Use of Automatic Vehicle Monitoring, Vehicle Health Monitoring, and Diagnostic Systems by Transit Agencies (2025)
Chapter: 4 Case Examples

CHAPTER 4
Case Examples
This section will summarize more in-depth case examples for three transit agencies that responded to the survey and were asked to provide additional, more in-depth information. The case examples were selected to cover a range of information including:
- Agency Overview
- Introduction of Maintenance Systems
- Deployment of Maintenance Systems
- Training Related to Maintenance Systems
- Integration of Maintenance Systems
- Benefits of Maintenance Systems
- Lessons Learned from the Process
There are three case examples in the following subsection, comprising these transit agencies and authorities:
- Capital District Transportation Authority
- Pinellas Suncoast Transit Authority
- San Diego Metropolitan Transit System
Capital District Transportation Authority
Agency Overview
 The Capital District Transportation Authority (CDTA) is a multi-modal public transit provider in New Yorkʼs Capital Region, serving the counties of Albany, Montgomery, Rensselaer, Saratoga, Schenectady, Warren, and Washington. Its fleet includes 40-foot buses, articulated buses, cutaways, rubber-tired trolleys, and Dodge Promasters for FLEX On Demand service. The authorityʼs service covers 2,393 square miles and serves a population of 628,952. It has a total of 306 vehicles operated in maximum service (VOMS), including 250 fixed route vehicles, 22 paratransit vehicles, 15 FLEX vehicles, 9 commuter vehicles, and 10 rubber-tired trolleys (seasonal).
Introduction of Maintenance Systems
CDTA is using CAD/AVL and PMT systems within its transit fleet. When asked about the purpose of adding this technology, CDTAʼs Director of Maintenance explained that he wanted the authority to be more proactive when it came to fleet maintenance issues. CDTA added CAD/AVL technology to its vehicles in 2019 and started a pilot program to test predictive fleet maintenance in 2021. The reason for this was the maintenance teamʼs desire to receive “better, real-time information as to what was going on with each vehicle,” he said. He also noted that “just because a ‘check engine’ light comes on doesnʼt mean a vehicle needs to be taken out of service,” and that receiving
fault codes or other more detailed information as to why a “check engine” light is on can help the maintenance team decide the best course of action.
The director then described the authorityʼs prior efforts, stating that the staff would “look at the fleet and come up with a reasonable time frame on how long a vehicle or part would last.” This would set up maintenance patterns to schedule service for the buses and to have bigger failure items replaced. When he learned about the possibilities offered by predictive technology, specifically that it could make predictions anywhere from two to six days prior to a component failing, the director decided that he wanted to see the technology in action. He described initial hesitation and skepticism of the benefits of predictive technology and explained that this is what led the agency to start a pilot program to see whether and how the integrated technology would work within the fleet. He explained that the addition of PMT on the vehicles changed CDTAʼs maintenance process. He stated, “Instead of bringing the entire fleet in and replacing parts that they believe need to be replaced soon, they can bring in flagged vehicles as they come in and make repairs because they know the data being provided is more accurate.”
Deployment of Maintenance Systems
CDTA began deploying PMT in a pilot program in October 2021; the program lasted one year. The pilot took place on 22 vehicles in the authorityʼs fleet; its purpose was to determine which predictive maintenance software and which deployment methods would work best for the fleet. The agency piloted two options. The first was to continue to use the CAD/AVL system for predictive maintenance data gathering; the second was to try a new software built specifically to predict maintenance issues and provide solutions powered through AI.
There was initial skepticism regarding the capabilities of this PMT. During the pilot, for the first three months, the agency staff did not make any repairs when they received an alert or repair plan. The purpose of this was to confirm the accuracy of the PMT manufacturer and to determine whether the parts would fail after being identified by the software. They found that over 75 percent of the predictions from the PMT were accurate, which led them to call the pilot a success and begin adding the software to more vehicles in the fleet.
After a year of testing, it was determined that Preteckt, one of the two PMT software manufacturers, was the best fit for CDTA, and the agency has continued with this technology since the pilot concluded. Currently, 19 of its vehicles feature this technology; a handful of buses have been retired. CDTA found the same PMT company to be a better fit for its fleetʼs needs; the company is also providing data for the agencyʼs BEBs in its own pilot. One way that predictive technology can benefit BEB fleets is by tracking a batteryʼs temperature to help prevent a thermal event. According to the director, the monitoring of BEBs is “still brand-new technology” and there is “not much information yet to support its success.” He went on to say, “The best way to put out a battery fire on a bus is to prevent it from ever happening.”
Training Related to Maintenance Systems
When asked about the PMT training process, the director noted that the training and installation of hardware was “very simple.” He explained that the agency was provided step-by-step instructions on how to install it on all of the 22 pilot vehicles. He described the maintenance process from start to finish through the lens of using this PMT. As the data are being gathered and analyzed, anomalies are looked at in accordance with the PMT. When something is flagged, it is first reviewed by the PMT manufacturer; CDTA management will then receive an email laying out the issue and providing a repair plan that identifies specifically what needs to be done. This is similar to a flow chart previously provided by the engine and transmission manufacturer to diagnose a certain code or failure. Because the process was so similar, very little additional training
was needed. The PMT developer has its own dashboard; this allows CDTA to communicate with the developer as needed.
Integration of Maintenance Systems
The director noted no significant issues when asked about the integration of the PMT with CDTAʼs existing systems and fleet. There was some uncertainty about how it would integrate, but “it was all pretty seamless.” He mentioned that the PMT developer did a good job preparing CDTA and the supervisors who would receive the repair plans. He noted that the biggest hurdle with the integration of the technology was the workforceʼs skepticism. The technicians were being asked to follow the repair plans and replace components of vehicles that might not appear to be having any issues. The director said, “They would ask, ‘Why am I replacing a part that isnʼt bad at this point?’” However, once they saw the collected data showing the past predictions and work orders, they shifted their mindsets and became more proactive, which was the goal of integrating these systems into the fleet.
Benefits of Maintenance Systems
CDTAʼs maintenance system benefits include savings in time, labor and parts costs, and operations. Time is saved by receiving alerts and repair plans that reduce the number of diagnostic hours. Similarly, labor and parts costs are reduced because diagnostics and repair plans are created for the technicians, eliminating trial and error. Operationally, having these issues detected two to six days prior to a failure allows the bus to be taken out of service at a time with a lower cost impact instead of in the middle of service. This also leads to a reduction in the mean distance between failures (MDBF).
When asked to evaluate CDTAʼs maintenance systems after the PMT was added to the fleet, the director provided a variety of data on the positive outcomes. The maintenance department has seen an 11 percent reduction in labor resources as well as a 9 percent savings on parts and materials. The agency has also seen a 20 percent improvement in vehicle reliability and a 40 percent decrease in road calls. The director also provided an estimation in dollar amounts to show the cost savings, which can be seen in Table 3.
Also important to note is that when CDTA compared vehicles of the same age, mileage, and other characteristics, it found a 15 percent reduction in the total cost of the vehiclesʼ maintenance requirements when using the PMT. The maintenance director stressed the importance of this: “They are diagnosing and replacing a component one time instead of diagnosing two or three times and replacing the wrong part.”
The director also noted that the biggest overarching benefit of utilizing this technology is the ability to be more proactive instead of reactive when it comes to maintaining the entire fleet.
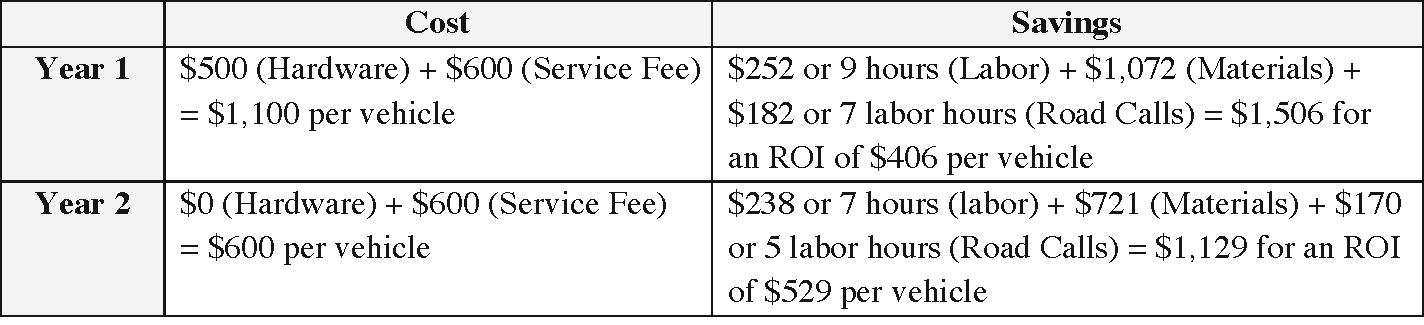
Note: ROI = return on investment
Long Description.
The table displays two columns with headers Cost and Savings, and two rows with headers Year 1 and Year 2. The data shown are as follows: Row 1: 500 dollars (hardware) plus 600 dollars (service fee) equals 1100 dollars per vehicle; and 252 dollars or 9 hours (labor) plus 1072 dollars (materials) plus 182 dollars or 7 labor hours (road calls) equals 1506 dollars for an ROI of 406 dollars per vehicle. Row 2: 0 dollars (hardware) plus 600 dollars (service fee) equals 600 dollars per vehicle; and 238 dollars or 7 hours (labor) plus 721 dollars (materials) plus 170 dollars or 5 labor hours (road calls) equals 1129 dollars for an ROI of 529 dollars per vehicle.
PMT does not replace the CAD/AVL; these are two different applications that are required in order for CDTA to run its buses. CDTA continues to use CAD/AVL for its particular applications; PMT will be used to make maintenance more efficient.
Lessons Learned from the Process
Since adding PMT to its fleet, the lessons learned at CDTA have been ongoing. When asked about what he wishes the agency had done from the beginning, the maintenance director said that it would have been beneficial to carry out a more controlled pilot on one or two vehicle types of the same model year in order to gauge the success and accuracy of the PMT. CDTA originally chose multiple vehicles across multiple bus fleets in order to gauge success; this took longer than anticipated and used many resources. This insight would be useful to any transit agency that is looking to conduct a pilot study.
Pinellas Suncoast Transit Authority
Agency Overview
 The Pinellas Suncoast Transit Authority (PSTA) is a public transportation provider located in Pinellas County, Florida. PSTA manages various modal types, including fixed route, demand response, paratransit, and bus rapid transit. The National Transit Database (NTD) asserts that PSTAʼs service area covers 304 square miles and serves a population of 1.1 million as of 2022. The number of riders is 10.4 million annually. The NTD lists PSTA as having 270 VOMS as of 2022.
Introduction of Maintenance Systems
PSTA began integrating technology such as CAD/AVL on its buses around the year 2010. AVM was incorporated into PSTAʼs fleet in 2018. PSTAʼs Director of Maintenance stated that with all the technology that can be found on each vehicle, “buses are essentially computers on wheels now.” He explained that vehicles today allow for the ability to dial into them in real time to watch their performance. Aside from CAD/AVL and AVM, additional PMT software was integrated into PSTAʼs fleet in late 2023. This technology monitors various systems and looks for anomalies so it can flag a potential issue before it occurs. The accuracy rate for these detected faults is around 98 percent. The director noted that instead of responding after a breakdown or failure, this technology has “changed the game to be more proactive instead of reactive, because the failures can be predicted before they occur.”
Deployment of Maintenance Systems
PSTAʼs fleet is made up of around 210 transit buses, with CAD/AVL and AVM technology installed on each vehicle. Nearly 80 percent of its fleet also utilizes PMT. The remaining 20 percent of vehicles are nearly two decades old, so integrating the predictive analytics software on those vehicles as they are coming to the end of their service lives would not be cost-effective. However, each bus in the fleet has some form of telematics system on it, whether it monitors the engine, OEM, HVAC system, or something else.
Training Related to Maintenance Systems
When asked about what kind of training PSTAʼs employees received relative to this type of technology, the director explained that PSTA invests both money and time in training its employees because the costs of getting new workers up to speed with the technology and of maintaining
the ever-evolving technological advancements is worth it. He declared, “Not one day goes by where training isnʼt occurring at some level,” whether in company-wide training sessions or in smaller groups. The director also noted that the training for this type of software were easy to complete, which was its main selling point. The goals of the software were to make it easy for the technicians to interact with the onboard systems and for the output to be a verifiable repair path. He explained that the technicians are oriented to the dashboard interface and also that the software continuously monitors the onboard system. The maintenance team can use the software as part of its everyday operations. When asked about how long it took for PSTA employees to complete the training, he explained that the Fleet Division comprises technicians varying in skill level from basic to advanced. Training starts with the advanced-level diagnostic technicians and continues as the beginner-level technicians advance themselves.
Integration of Maintenance Systems
When discussing the integration process and what challenges PSTA faced, the director emphasized that “there are always going to be hurdles and challenges.” One of these challenges is that each technology manufacturer declares that its technology can be integrated with that of every other manufacturer. He compared the integration of technology among various manufacturers with two people who are speaking different languages, noting that “sometimes things get lost in translation.” This is exemplified by how many systems are OEM-specific, meaning that although one manufacturer may be able to broadcast a fault in a vehicle, another manufacturer may not have the ability to specifically define the same fault. He explained that there tend to be a lot of technological proprietaries between the OEMs, although he made sure to note that this has been getting better in recent years because it doesnʼt benefit the various companies to be viewed as secretive or unreliable. When asked if the technology is cloud-based, the director noted that most of it is either already cloud-based or it is migrating in that direction. He explained that the agencyʼs IT team did not have to experience any major changes throughout the process of integrating the technology, noting that the changes were mostly related to configuration of internet protocol (IP) addresses and communication protocols. When asked about how the software was used with the existing processes, he stated, “Technology changes all the time. Whenever we see something which may help or advance our processes generally, a trial or pilot is completed.”
When asked whether PSTA faced any resistance from its employees regarding the integration of this technology, the director stated that resistance is not the right word, but that there are varying levels of ability among employees to engage technologically. Some workers may be intimidated by the vastness of the technology. He said that this is a reason for training to be viewed as an investment. The more confident the workers are with the technology, the less hesitation will take place regarding its utilization.
When asked about the capabilities of the technology, the director stated, “We feel that the technology will augment our own existing human technicians and allow us to just be more proficient and efficient at diagnosing the buses. Anything that we can do to increase reliability means that we are just that much better in terms of service to our passengers.” When questioned about the technologyʼs purpose, he said, “What it does and how it helps us is twofold. One, it works alongside the technicians. So, while itʼs there looking at the data and telling us what the probable repair could be, the technician is there along with it, learning as well.”
Benefits of Maintenance Systems
When discussing the benefits of using these technologies within its bus fleet, the director stressed that “‘useful’ is the key word here.” The maintenance department sought out and incorporated this
technology because its outputs would be (and have been) beneficial to PSTA—by saving time, money, and stress.
Not only does this predictive analytics software identify common failures, but it also creates a “probable repair plan” through the analysis of massive historical databases and live sensor data from each bus every day. The director noted that these plans are quite accurate and that they substantially reduce the time it takes to diagnose issues within a vehicle. When asked for an estimation of diagnostic time saved as a result of this technologyʼs predictive capabilities, he said that the technology saves around three to four hours annually per bus; when multiplied across the whole fleet of 210 buses, this means that roughly 630–840 diagnostic hours are saved annually. The number of diagnostic hours saved exemplifies the many benefits of this technology integration across transit fleets and correlates to money saved, fewer vehicles out of commission, and more reliable buses for transit users. When asked about the benefits of the technology, the director stated, “We were very pleased with what we saw and how it performed and ultimately how it would benefit us, so when it came to the determination of would we deploy this across many more vehicles in our fleet, it was somewhat of a no-brainer for us.”
The director also provided an estimation in dollar amounts to show the savings, which can be seen in Table 4.
The director conducted additional estimations in savings and determined that approximately $19,000–$25,000 per year is saved in diagnostic time and that $200,000 is saved in parts owing to a lower chance of misdiagnosis by using the predictive analytics software. However, he noted that the real value comes from using the technology to support the fleet maintenance team with vehicle uptime, and that many agencies spend countless dollars each year trying to keep up with repairs that had been detected too late or managed with scarce vehicle technician resources. The director stated, “Predictive analytics can help mitigate these costs, empower technicians with a tool to keep up with rapidly changing technology, and reduce the financial impacts of these repairs, not to mention inconvenience to the riding public. By identifying problems before they cause performance issues, we were able to correct them without negative operational impact.”
The director also emphasized that not using the technology to its full potential does a disservice to all involved. The director noted that there is no denying the financial cost of this technology, and to underutilize it would not only be wasting PSTAʼs money, but the taxpayersʼ as well.
When asked for specific examples of repair campaigns that the use of the technology facilitated, the director explained that the greatest benefit from the onboard technology has been the reduction of malfunction indicator lights (MILs) coming on; these are attributed to exhaust aftertreatment systems. The director stated, “Many times, MILs are produced from a malfunctioning sensor, sensors out of calibration, or another underlying issue somewhere in the engine system. For the most part, the system is flagging erroneous sensor readings, which may be indicative of
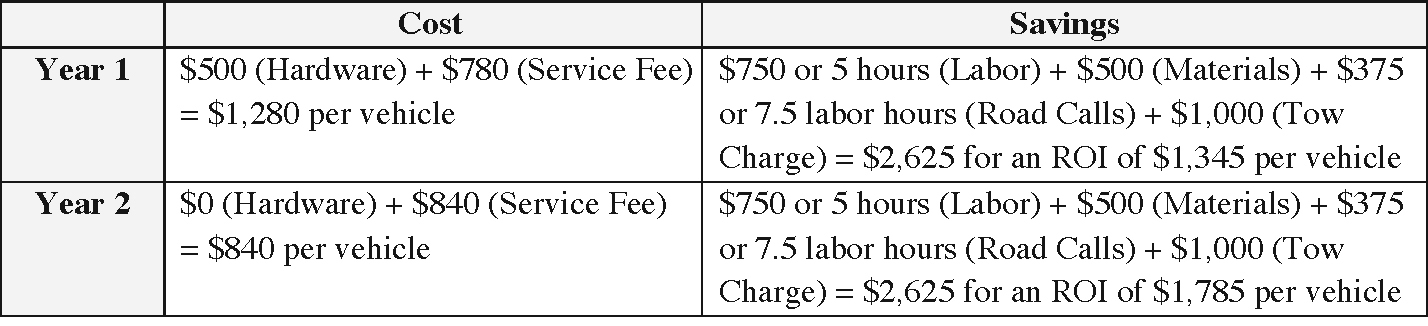
Note: ROI = return on investment
Long Description.
The table displays two columns with headers Cost and Savings, and two rows with headers Year 1 and Year 2. The data shown are as follows: Row 1: 500 dollars (hardware) plus 780 dollars (service fee) equals 1280 dollars per vehicle; 750 dollars or 5 hours (labor) plus 500 dollars (materials) plus 375 dollars or 7.5 labor hours (road calls) plus 1000 dollars (tow charge) equals 2625 dollars for an ROI of 1,345 dollars per vehicle. Row 2: 0 dollars (hardware) plus 840 dollars (service fee) equals 840 dollars per vehicle; and 750 dollars or 5 hours (labor) plus 500 dollars (materials) plus 375 dollars or 7.5 labor hours (road calls) plus 1000 dollars (tow charge) equals 2625 dollars for an ROI of 1785 dollars per vehicle.
future sensor failure. We can proactively replace the sensors before they contribute to an MIL and need the bus to be swapped out.” To provide context, he noted that if this onboard technology were not present and an issue was occurring with one of the vehicles, an MIL would turn on to indicate a maintenance issue. An MIL is like a “check engine” light in an automobile; it tells you something is wrong but not exactly what is wrong or even what part of the vehicle is affected. When an MIL came on, it would be up to maintenance technicians to pinpoint the actual issue, which would take additional time and effort. Having onboard technology cuts out much of this work because it can specifically diagnose what needs to be fixed before the MIL turns on.
Lessons Learned from the Process
The directorʼs insights come from having CAD/AVL technology on the agencyʼs fleet of over 200 vehicles since 2010, AVM since 2018, and PMT on 80 percent of the fleet since 2023. He explained that the maintenance systems used allow the agency to be proactive when it comes to maintenance issues and repairs; these can be addressed before they occur when the systems flag a potential issue. He described the training process as simple in its content and said the agency is comprehensive in its efforts to ensure that each affected employee can comprehend the technology, learn as it adapts, and utilize it to its full potential. The director explained that there was little resistance to learning how to use this technology, only some intimidation at its expansiveness. This was solved by extensive and ongoing efforts to train employees and keep them up to date on the latest technology. Many benefits were described by the director, including temporal, financial, and operational. He also provided estimations of time and money saved yearly at 630 hours of diagnostic time and $219,000 (at minimum) in diagnostic time and parts saved from misdiagnosis.
The director was asked if he would recommend the adoption of this technology. His response was that itʼs “not really a want anymore; itʼs more of a necessity if you want to be successful.” Since the CAD/AVL serves multiple internal departments as well as the riding public, he shared that it is the “heart and soul” of PSTA. The director explained that it gathers and analyzes data in real time, not only for the maintenance department, but also for the users of the transportation system. The director stated, “The predictive analytics software has specifically helped us to have [fewer] road calls and greater uptime with our fleet, so we can better support our community.”
The director described how the constant technological advancements that take place mean that it is critical to “build a rock-solid foundation from day one.” He emphasized the necessity of keeping up with training and housekeeping as personnel turnover and technological advancements take place. The director noted that it can be tempting to come up with patches and small fixes, but these can add up until the systems go into a state of disrepair. He concluded the discussion with the following guidance: “If you build a solid foundation, and practice good housekeeping, then you will be successful.”
San Diego Metropolitan Transit System
Agency Overview
 The San Diego Metropolitan Transit System (MTS) is a public transit provider in San Diego, California. MTS provides bus and rail service to three million people within San Diego County. MTS has 3,240 square miles of service area, which includes urbanized and rural areas. MTS coordinates all of its services and determines their routing, stops, frequencies, and hours of operations. MTS manages various modal types including commuter bus, motor bus, light rail,
and demand response. The NTD lists MTS as having 774 VOMS as of 2023. With nearly 800 buses in its fleet, MTS operates almost 100 fixed bus routes and ADA paratransit services that provide 300,000 weekday trips to passengers.
Introduction of Maintenance Systems
MTS began integrating CAD/AVL technology on the entirety of its bus fleet in 2004 and bus telematics on its BEBs in 2020. MTSʼs decision to integrate this technology was made so it would have the ability to monitor vehicle information while buses are in operation. This real-time information includes individual vehicle locations from CAD/AVL for the entire bus fleet as well as telematics for the batteryʼs state of charge for the BEBs. The Director of Fleet and Facility Maintenance at MTS explained that once a bus reaches below 20 percent battery, an alert is sent to the maintenance team. This leads to better service because they can bring a bus back to the facility before it runs of out battery; this eliminates the need to tow it in. This process saves the maintenance team time and effort because they can eliminate delays resulting from a battery dying mid-service. The director added that the agency also uses the technology for high temperature warnings in order to prevent a thermal event. This technology is utilized for both operational and safety reasons. The director explained that MTS does not use PMT in the transit fleet.
Deployment of Maintenance Systems
MTS has a BEB fleet of 25 buses, all of which are equipped with telematics technology. MTSʼs BEB fleet comprises 13 40-foot vehicles and 12 60-foot vehicles. Telematics technology was added to each existing BEB in the fleet in 2020. Starting in 2021, new BEBs purchased by MTS were ordered from the OEM with the telematics already installed on each vehicle. The director explained that ordering buses with telematics from the OEM will be MTSʼs new standard going forward.
Training Related to Maintenance Systems
The director explained that MTS was provided with an online training program to help its employees understand the portal for the technology that was being integrated into MTSʼs BEBs. A conference call scheduled with the manufacturer of the technology included the training for the portal. The training was described by the director as being easy to navigate. MTS initially decided to provide the training for the supervisors and managers in the maintenance department; the agency had not yet rolled out this training to the mechanics and other workers. The director noted that he continues to explore the program and familiarize himself further with the technology because “you can find more to do with the technology the more you dig.”
Integration of Maintenance Systems
The director noted that MTS encountered a few issues when it came to integrating the maintenance system into its existing fleet. These issues were primarily related to communication between the charger OEM and the bus manufacturer OEM involving telematics. The main challenge resulted from the presence of proprietary information and the manufacturersʼ unwillingness to share information with each other. The director realized that these communication issues would likely not be solved unless a representative from each manufacturer could come to the MTS facility in person to look at the vehicles and corresponding software in order to figure out where the issues were presenting. The director explained that this in-person meeting was necessary to get the manufacturers to communicate and work together to find a solution. Following this meeting, the OEMs were able to work together to get everything functioning the way it should. The director noted
that this effort “still didnʼt happen without its growing pains.” The director also explained that it took a lot of resources to make this meeting happen but that it was worth the investment.
Benefits of Maintenance Systems
The director explained that in the past few years (since the technology was added to their BEBs) the main benefit has been having the ability to log into the telematics portal and see the live codes and other data coming in as the bus is operating. MTS primarily uses the technology to track the location of the vehicle as well as the batteryʼs charge level and temperature. He noted that they “have never had that capability before” and that it has been significant in creating more efficient operations for MTS and its transit users.
Lessons Learned from the Process
The biggest lesson learned from MTS is to do what is necessary to ensure that the technology is working for the agencyʼs needs and to the best of its capabilities. The director emphasized the importance of facilitating the in-person meeting with the charger and bus OEMs when they were facing difficulties with the technologyʼs utilization. He noted that this in-person meeting was not something that was offered to MTS but that his pushing for it to happen made a big difference. He explained that this in-person meeting was necessary to ensure that the different technologies were communicating properly and that everything was functioning efficiently. He also stressed the importance of advocating for the needs of the transit fleet if something is not working properly when it comes to the technology. The director noted that the best thing you can do is “start the process early to get it fixed properly.”
Takeaways and Conclusion of Case Examples
Key takeaways from the case examples include the following:
- AVM, VHM, and PMT provide financial, temporal, and operational benefits to the transit agencies that use them.
- This technology is ever-changing, so it is important to build a strong foundation in its processes and capabilities once it has been integrated into the existing systems; imminent technological changes are inevitable.
- It is imperative to ensure that newer technology is properly communicating with existing systems to ensure that it can be used to the best of its ability.
- Although there is financial cost and training needed to integrate PMT systems, representatives of transit agencies view it as a necessity once they are using the technology in their fleets.
The agency representatives from each case example were asked whether they communicate with other transit maintenance departments that do not utilize some form of AVM, VHM, or PMT in their fleets, and if so, whether they know what those other departments give as their reasoning for not using it. They provided many reasons for an agency not to pursue these technologies, including the following:
- Lack of funding or the cost to implement
- Skepticism of the functionality or successful integration of the technology
- Agency size (smaller agencies do not feel that the benefit is worth the cost)
- Perception that existing system components may not support the addition of other system components
- Disinterest in adding more hardware to the vehicles


