Use of Automatic Vehicle Monitoring, Vehicle Health Monitoring, and Diagnostic Systems by Transit Agencies (2025)
Chapter: 3 Online Survey of Transit Operators

CHAPTER 3
Online Survey of Transit Operators
Survey Process and Methodology
The purpose of the survey was to gather information from a sample of transit agencies across the United States that vary in size, geographic location, user socioeconomics, fleet composition, and technology adoption. The overall objective was to learn more about how these agencies are using AVM, VHM, and PMT systems and to what degree. The survey was created and shared online. A PDF of the survey questionnaire is provided in Appendix C of this synthesis.
Transit Operators Surveyed
The study team released the survey to 100 agencies of various sizes and geographic locations. Fifteen agencies submitted responses. Three case examples were chosen from among these responses for further exploration and are discussed in Chapter 4 of this document.
The 15 agencies that submitted surveys were the following:
- Capital District Transportation Authority (New York)
- Great Falls Transit District (Montana)
- Golden Empire Transit District (California)
- GoRaleigh (North Carolina)
- Jacksonville Transportation Authority (Florida)
- Sacramento Regional Transit District (California)
- Sarasota County Area Transit (Florida)
- San Diego Metropolitan Transit System (California)
- Santa Monica Department of Transportation (California)
- Memphis Area Transit Authority (Tennessee)
- New York City Transit (New York)
- Pinellas Suncoast Transit Authority (Florida)
- Pittsburgh Regional Transit (Pennsylvania)
- Washington Metropolitan Area Transit Authority (Washington, DC; Maryland; and Virginia)
- Westchester County Bee-Line (New York)
Summary of Survey Results
The survey provided details on how agencies view and utilize AVM, VHM, and PMT in their fleets. A copy of the survey can be found in Appendix C. A summary of responses to the survey questions can be found in Appendix D. Graphical representations of responses to a few of the questions from the survey can be seen in Figures 3, 4, 5, and 6. Not every question was answered by each agency because of the skip logic built into the survey. To better identify how many

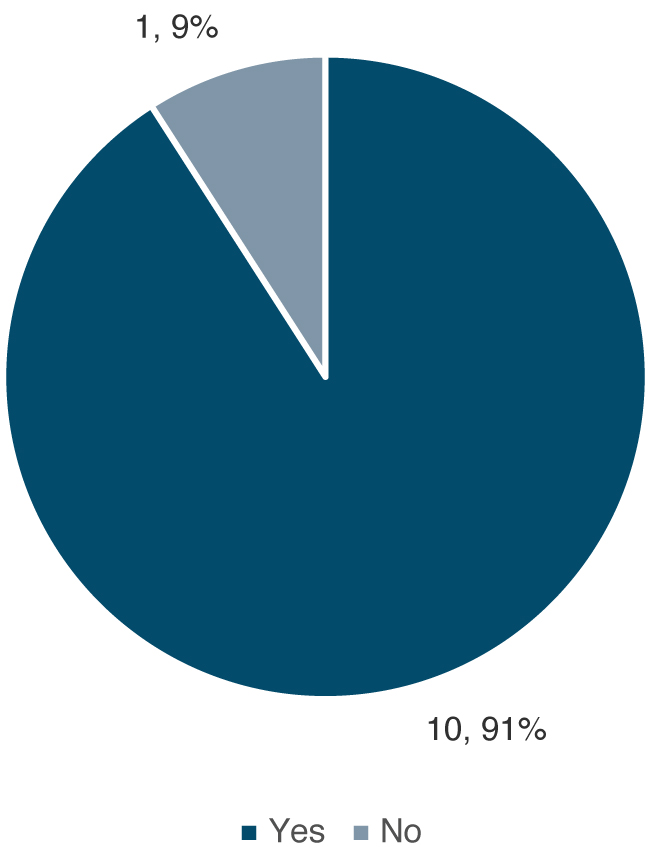
agencies are currently using AVM, VHM, diagnostic systems, and PMT, the survey began by asking how agencies do or do not employ such technologies.
Of the agencies that responded “Yes” to the question in Figure 3, three were selected to participate in further exploration through a case example process. The purpose of the case examples was to learn more about agencies that currently use AVM, health monitoring and diagnostic systems, PMTs, or a combination of these. The agencies shared additional information related
Long Description.
The data shown are as follows: Provided by individual component suppliers: 4 and 40 percent, Procured separately: 3 and 30 percent, and Other: 3 and 30 percent.
to their backgrounds, the technology used, their procurement processes, and their vehicle types and subsystems. The case examples are described in more detail in Chapter 4.
The survey question represented by Figure 4 aimed to establish the number of agencies that answered “Yes” to using any type of AVM, VHM, or PMT and whether they integrated such technology with an AVL system in their fleet.
Responses to this question indicate that among those that use AVM systems, the majority also use AVL, which provides location data along with the AVM data. AVL generally preceded AVM in the industry because of the manifest benefit of location data for emergency response, on-time
Long Description.
The data shown are as follows: Heavy-duty diesel or hybrid buses: 9 and 43 percent, Battery electric buses: 7 and 33 percent, Compressed natural gas (CNG) buses: 4 and 19 percent, and Other: 1 and 5 percent.
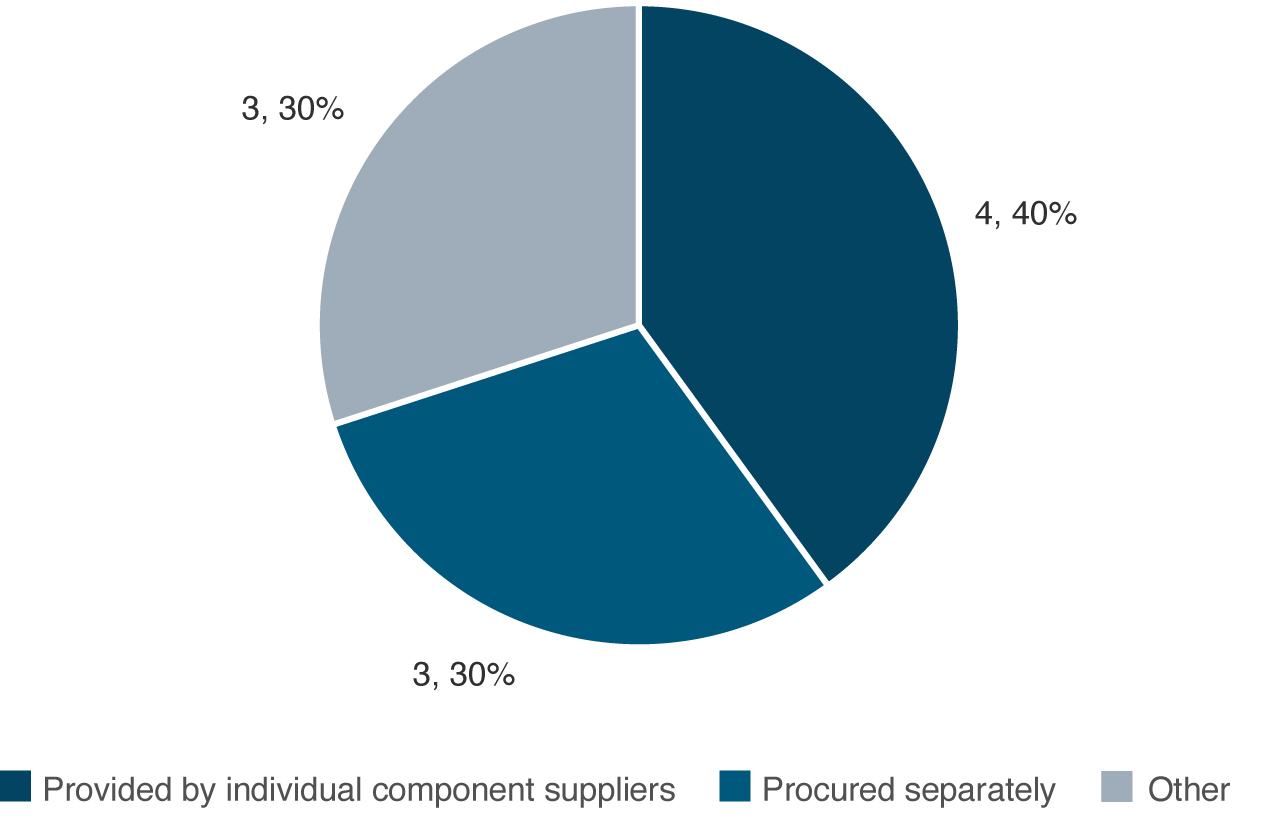
performance, real-time passenger information, and accurate running time data. For those systems choosing the communication capability required for AVM, AVL substantially enhances the significance of AVM data and is (as the response demonstrates) generally integrated. The survey question represented by Figure 5 aimed to better determine whether the systems being used were provided by individual component suppliers or whether more comprehensive systems were procured.
The responses showed a nearly even split between the systems being supplied by individual component suppliers and those being procured separately. Three agencies chose “Other.” The following were their write-in responses:
- “Part of a package”
- “Both”
- “Separately initially but combined after”
These responses indicate that each agency has a unique perspective and has the ability to procure systems in a way that works best for its specific needs.
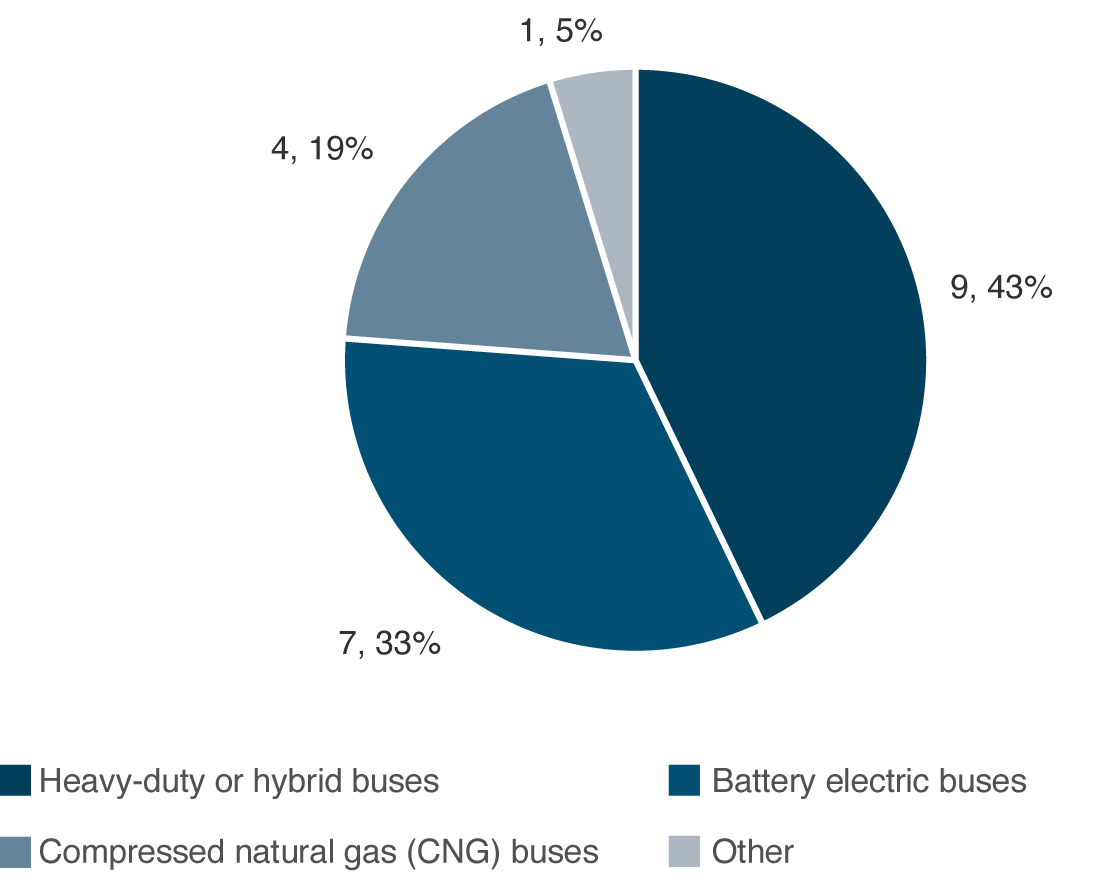
The survey question represented by Figure 6 aimed to establish what types of vehicles the AVM or other systems are used on within each agencyʼs fleet.
The survey responses showed that agencies use this technology on multiple vehicle types. The vehicle types with the technology integrated can be seen more often in heavy-duty diesel or hybrid buses as well as in BEBs. The respondent who answered “Other” wrote in “Diesel Cutaways” as the type of vehicle that they use this technology on. The fleet composition of respondents was not taken into consideration for this question.
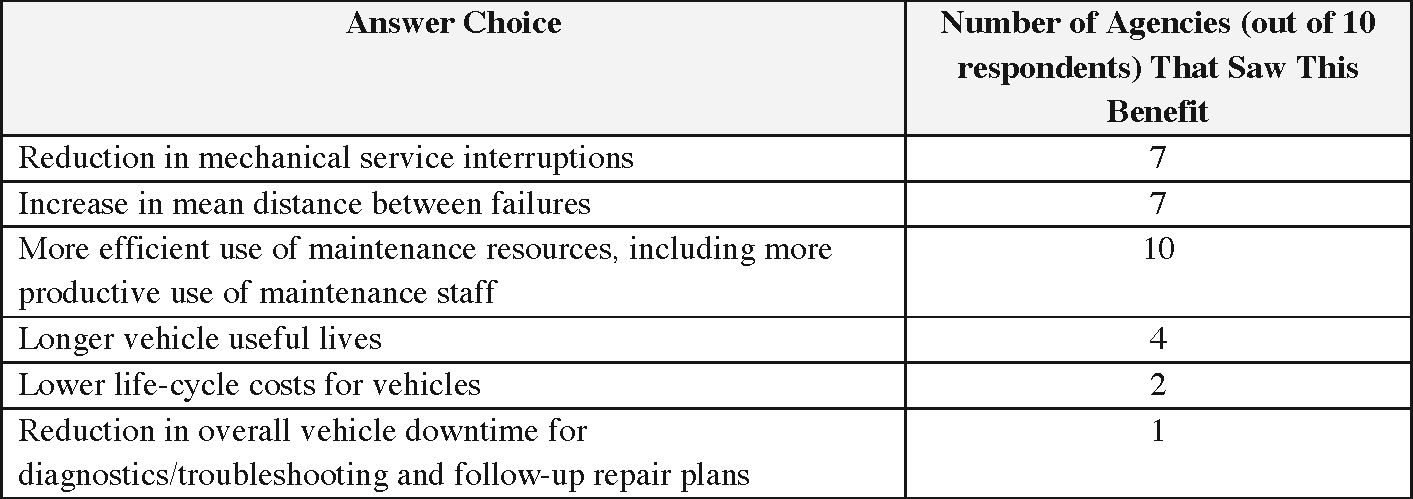
Table 1 and Table 2 present the types of benefits seen by the agencies as well as whether they have changed any of their maintenance practices as a result of integrating this technology into their fleets. Each survey question represented by Tables 1 and 2 allowed for multiple answer choices to be selected.
Near the conclusion of the survey, respondents were asked if they had any additional comments regarding their agencyʼs use of AVM, VHM, or PMT. The following are key takeaways from the agency representatives who chose to respond:
- AVM is beneficial, but it takes staff training to fully utilize its capabilities.
- Systems can be integrated with an agencyʼs yard management system so they know the health of a vehicle before it is dispatched into service.
- Regarding AVM on BEBs, there will likely be a better understanding in the future of faults and notifications being sent, which would lead to predictions of a potential major fault occurring.
Long Description.
The table shows two columns and six rows. The column headers are Answer choice and Number of agencies (out of 10 respondents) who saw this benefit. The data given in the table are as follows: Row 1: Reduction in mechanical service interruptions: 7. Row 2: Increase in mean distance between failures: 7. Row 3: More efficient use of maintenance resources, including more productive use of maintenance staff: 10. Row 4: Longer vehicle useful lives: 4. Row 5: Lower lifecycle costs for vehicles: 2. Row 6: Reduction in overall vehicle downtime for diagnostics or troubleshooting and follow-up repair plans: 1.

Long Description.
The table shows two columns and four rows. The column headers are Answer choice and Number of agencies (out of 11 respondents) that changed their procedures. The data given in the table are as follows: Row 1: Vehicle maintenance planning has become more data-driven and customized to the duty cycles specific to your transit agency: 8. Row 2: Reduction in troubleshooting time: 10. Row 3: Improved knowledge of technicians in troubleshooting and repairs: 6. Row 4: Other (Written in response: “Use of the system is still in a transition period”): 1.
- These systems have become critical. Fixing a problem before it happens reduces vehicle downtime, increases reliability for passengers, aids in the training of new technicians, increases the number of available buses, and represents the future of how fleet maintenance practices should be structured.
In Chapter 4, these topics are explored in more detail through the case examples. To see each survey question and its responses, refer to Appendix C and Appendix D, respectively.
Takeaways from the Survey Responses
Transit agencies represented a variety of sizes, geographic locations, user socioeconomics, fleet compositions, and lengths of time they have been using AVM, VHM, PMT, or a combination of these. Common themes from the survey responses include the following:
- Most survey respondents reported using at least one form of AVM or VHM in their fleet systems.
- The extent and utility of VHM sensor systems is higher in agencies that use AVM to transmit the data.
- Specific bus subsystems that are most often monitored using VHM systems are engines and aftertreatment systems, although there is a wide variety of subsystems monitored.
- Among agencies that have deployed battery electric buses in their fleets, the use of VHM systems to monitor battery health and to support charging management systems shows increasing adoption and interest.
- The use of PMT to extract preventive maintenance guidance from VHM databases using machine learning or other AI technology is of great interest, but quantified general benefits are still emerging.


