Use of Automatic Vehicle Monitoring, Vehicle Health Monitoring, and Diagnostic Systems by Transit Agencies (2025)
Chapter: Appendix A: Bus Components and Systems

APPENDIX A
Bus Components and Systems
Tables A-1 through A-10 (where applicable to an electric vehicle drive system) and Tables A-11 through A-15 list the minimum performance data signals that each system is required to make available to the intelligent transportation system (ITS) vehicle logic unit controller for a battery electric bus. The tables represent signals commonly monitored by the Vehicle Monitoring System. These tables are not to be referred to or be construed as being the only data points required from components at any time, but the minimum data set required in addition to every other data element described within this document. All data, including faults, performance points, and subsystem controller firmware versions that are to be externalized by any onboard computer or component shall be provided to the ITS vehicle logic unit specified. All data must be configured in nonproprietary format compliant with an industry standard protocol.
Long Description.
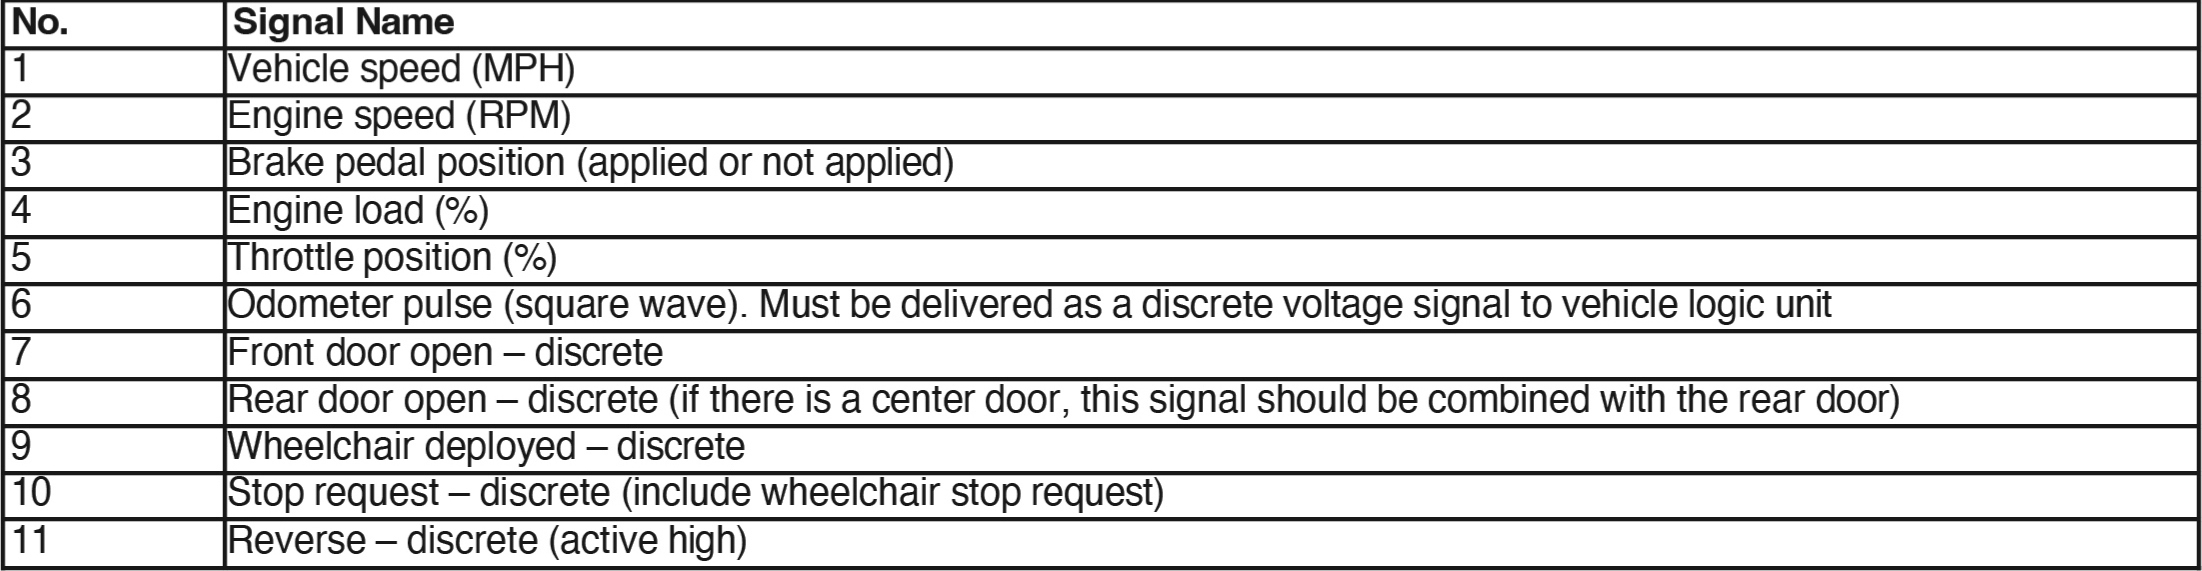
The table is titled 'Table A1: Vehicle Signals' and has 2 columns and 11 rows. The column headers are Number and Signal name. The data shown are as follows: Column 1: 1, 2, 3, 4, 5, 6, 7, 8, 9, 10, and 11. Column 2: Vehicle speed (MPH); 2, Engine Speed (RPM); 3, Brake pedal Position (Applied or Not-Applied); 4, Engine Load (Percentage); 5, Throttle Position (Percentage); 6, Odometer pulse (Square Wave). Must be delivered as a discrete Voltage signal to Vehicle Logic Unit; 7, Front Door Open – Discrete; 8, Rear Door Open – Discrete (if there is a Center door, this signal should be combined with the Rear Door); 9, Wheelchair Deployed – Discrete; 10, Stop Request – Discrete (include Wheelchair Stop Request); and 11, Reverse – Discrete (Active High).
Long Description.
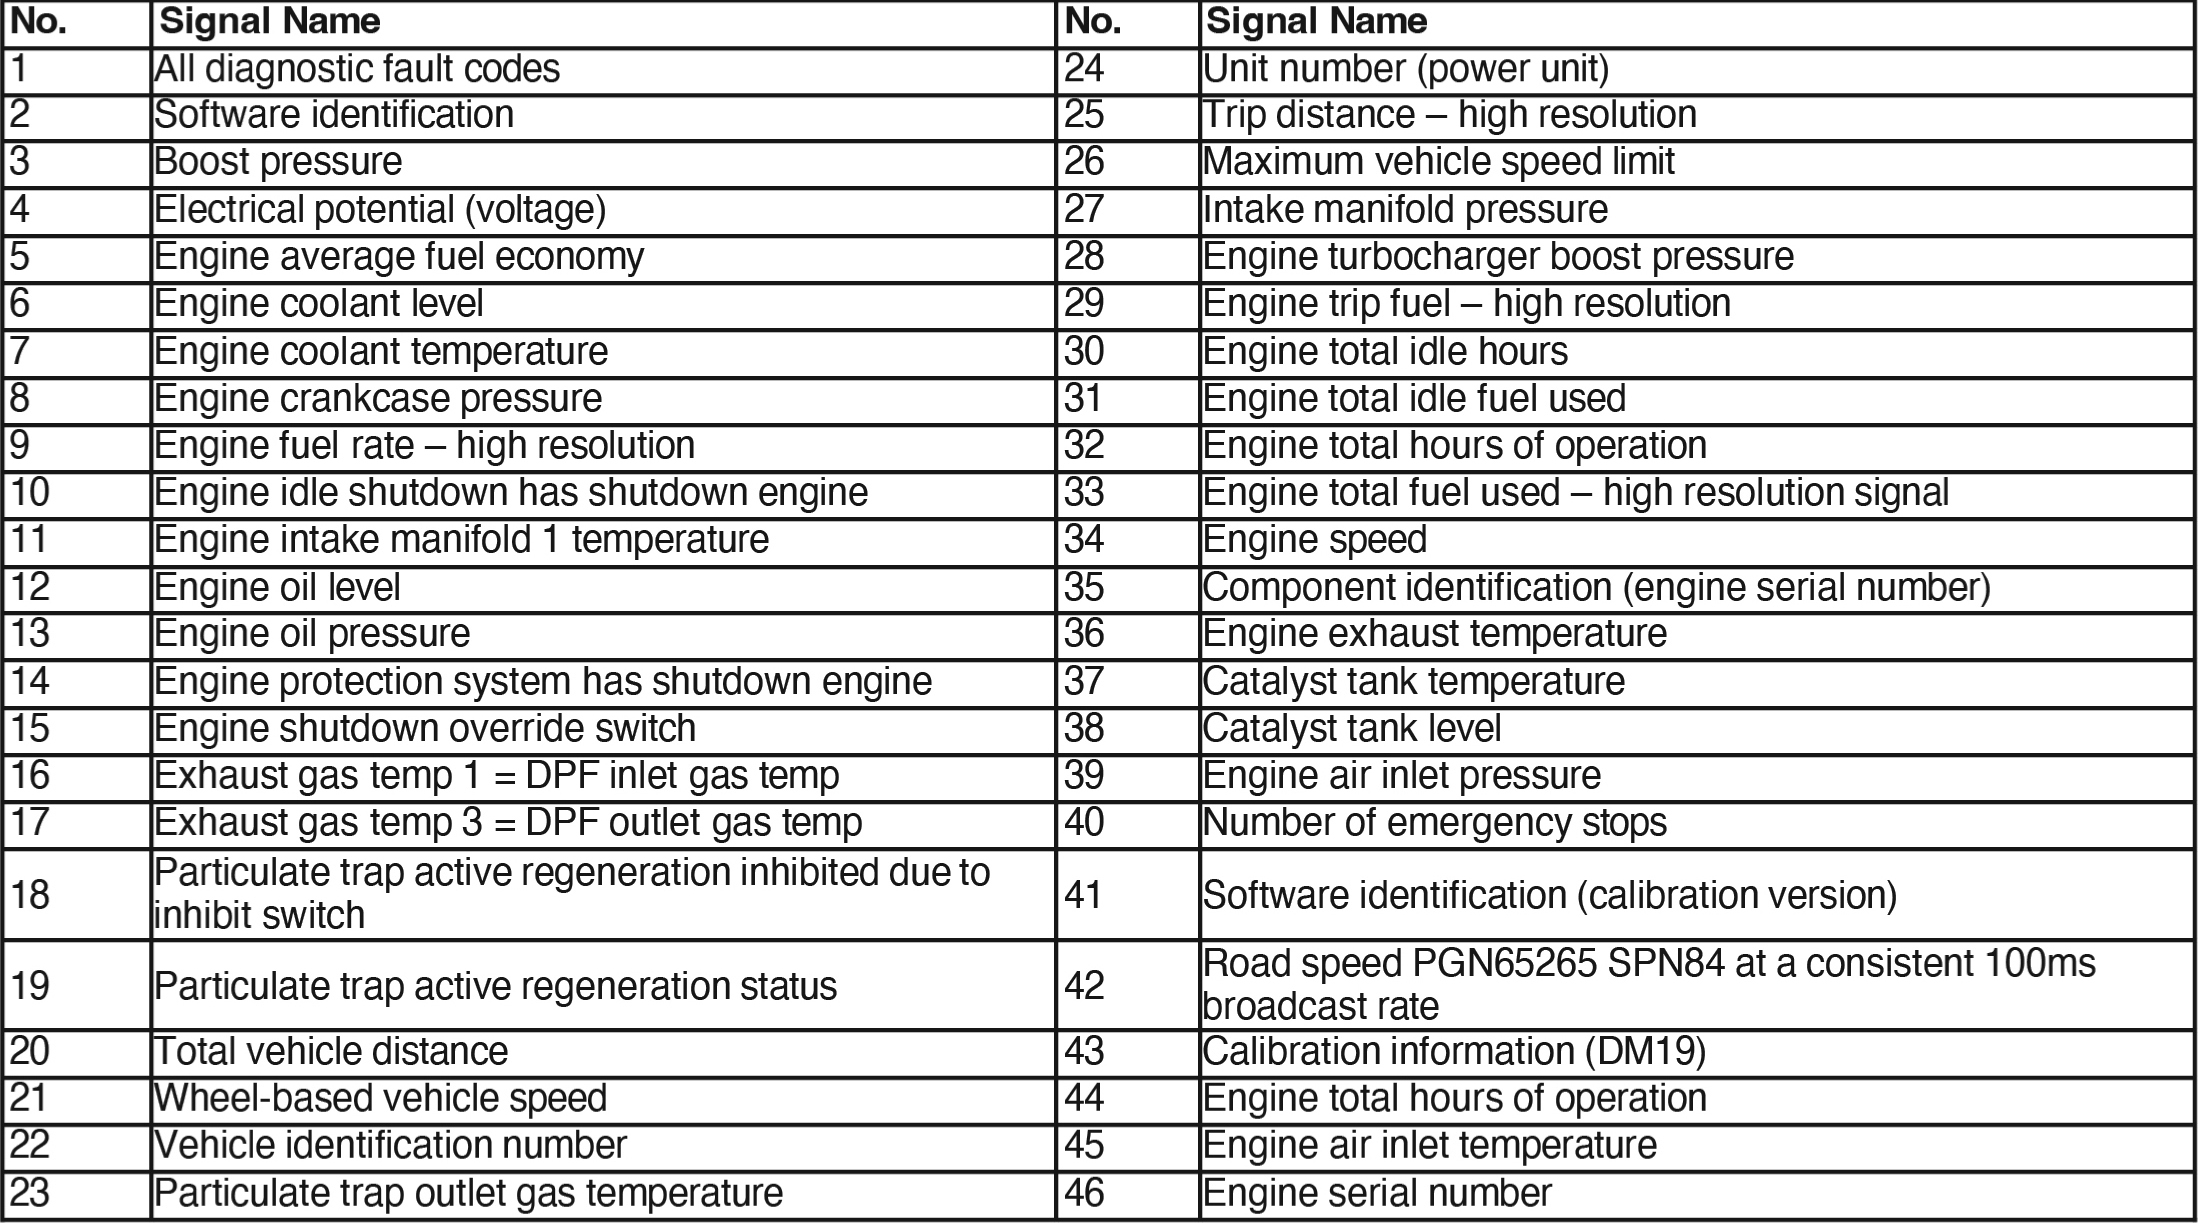
The table is titled 'Table A2: Engine' and has 4 columns and 23 rows. The column headers are Number, Signal name, Number, and Signal name. The data shown are as follows: Column 1: numbered from 1 to 23. Column 2: All Diagnostic fault codes; Software Identification; Boost Pressure; Electrical Potential (Voltage); Engine Average Fuel Economy; Engine Coolant Level; Engine Coolant Temperature; Engine Crankcase Pressure; Engine Fuel Rate – High Resolution; Engine Idle Shutdown has Shutdown Engine; Engine Intake Manifold 1 Temperature; Engine Oil Level; Engine Oil Pressure; Engine Protection System has Shutdown Engine; Engine Shutdown Override Switch; Exhaust Gas Temp 1 equals DPF Inlet Gas Temp; Exhaust Gas Temp 3 equals DPF Outlet Gas Temp; Particulate Trap Active Regeneration Inhibited Due to Inhibit Switch; Particulate Trap Active Regeneration Status; Total Vehicle Distance; Wheel-Based Vehicle Speed; Vehicle Identification Number; and Particulate Trap Outlet Gas Temperature. Column 3: numbered from 24 to 46. Column 4: Unit Number (Power Unit), Trip Distance – High Resolution, Maximum Vehicle Speed Limit, Intake Manifold Pressure, Engine Turbocharger Boost Pressure, Engine Trip Fuel – High Resolution, Engine Total Idle Hours, Engine Total Idle Fuel Used, Engine Total Hours of Operation, Engine Total Fuel Used – High Resolution signal, Engine Speed, Component Identification (Engine Serial Number), Engine Exhaust Temperature, Catalyst Tank Temperature, Catalyst Tank Level, Engine Air Inlet Pressure, Number of Emergency Stops, Software Identification (Calibration Version), Road Speed PGN 65265 SPN 84 at a consistent 100 m s broadcast rate, Calibration Information (DM 19), Engine Total Hours of Operation, Engine Air Inlet Temperature, and Engine Serial Number.
Long Description.
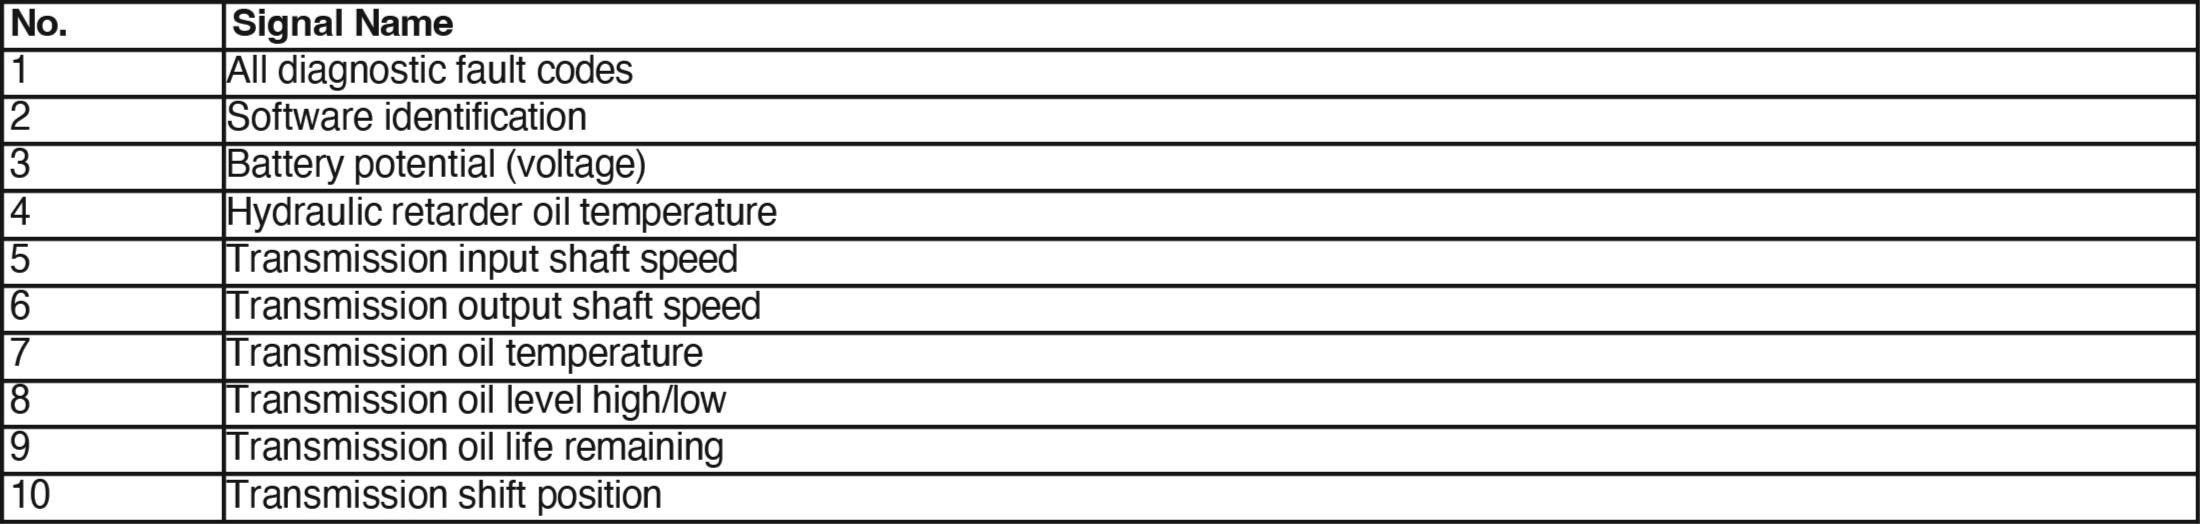
The table is titled 'Table A3: Transmission' and has 2 columns and 10 rows. The column headers are Number and Signal Name. The data shown are as follows: Column 1: 1, 2, 3, 4, 5, 6, 7, 8, 9, and 10. Column 2: All Diagnostic fault codes, Software Identification, Battery Potential (Voltage), Hydraulic Retarder Oil Temperature, Transmission Input Shaft Speed, Transmission Output Shaft Speed, Transmission Oil Temperature, Transmission Oil Level High or Low, Transmission Oil Life Remaining, and Transmission Shift Position.
Long Description.
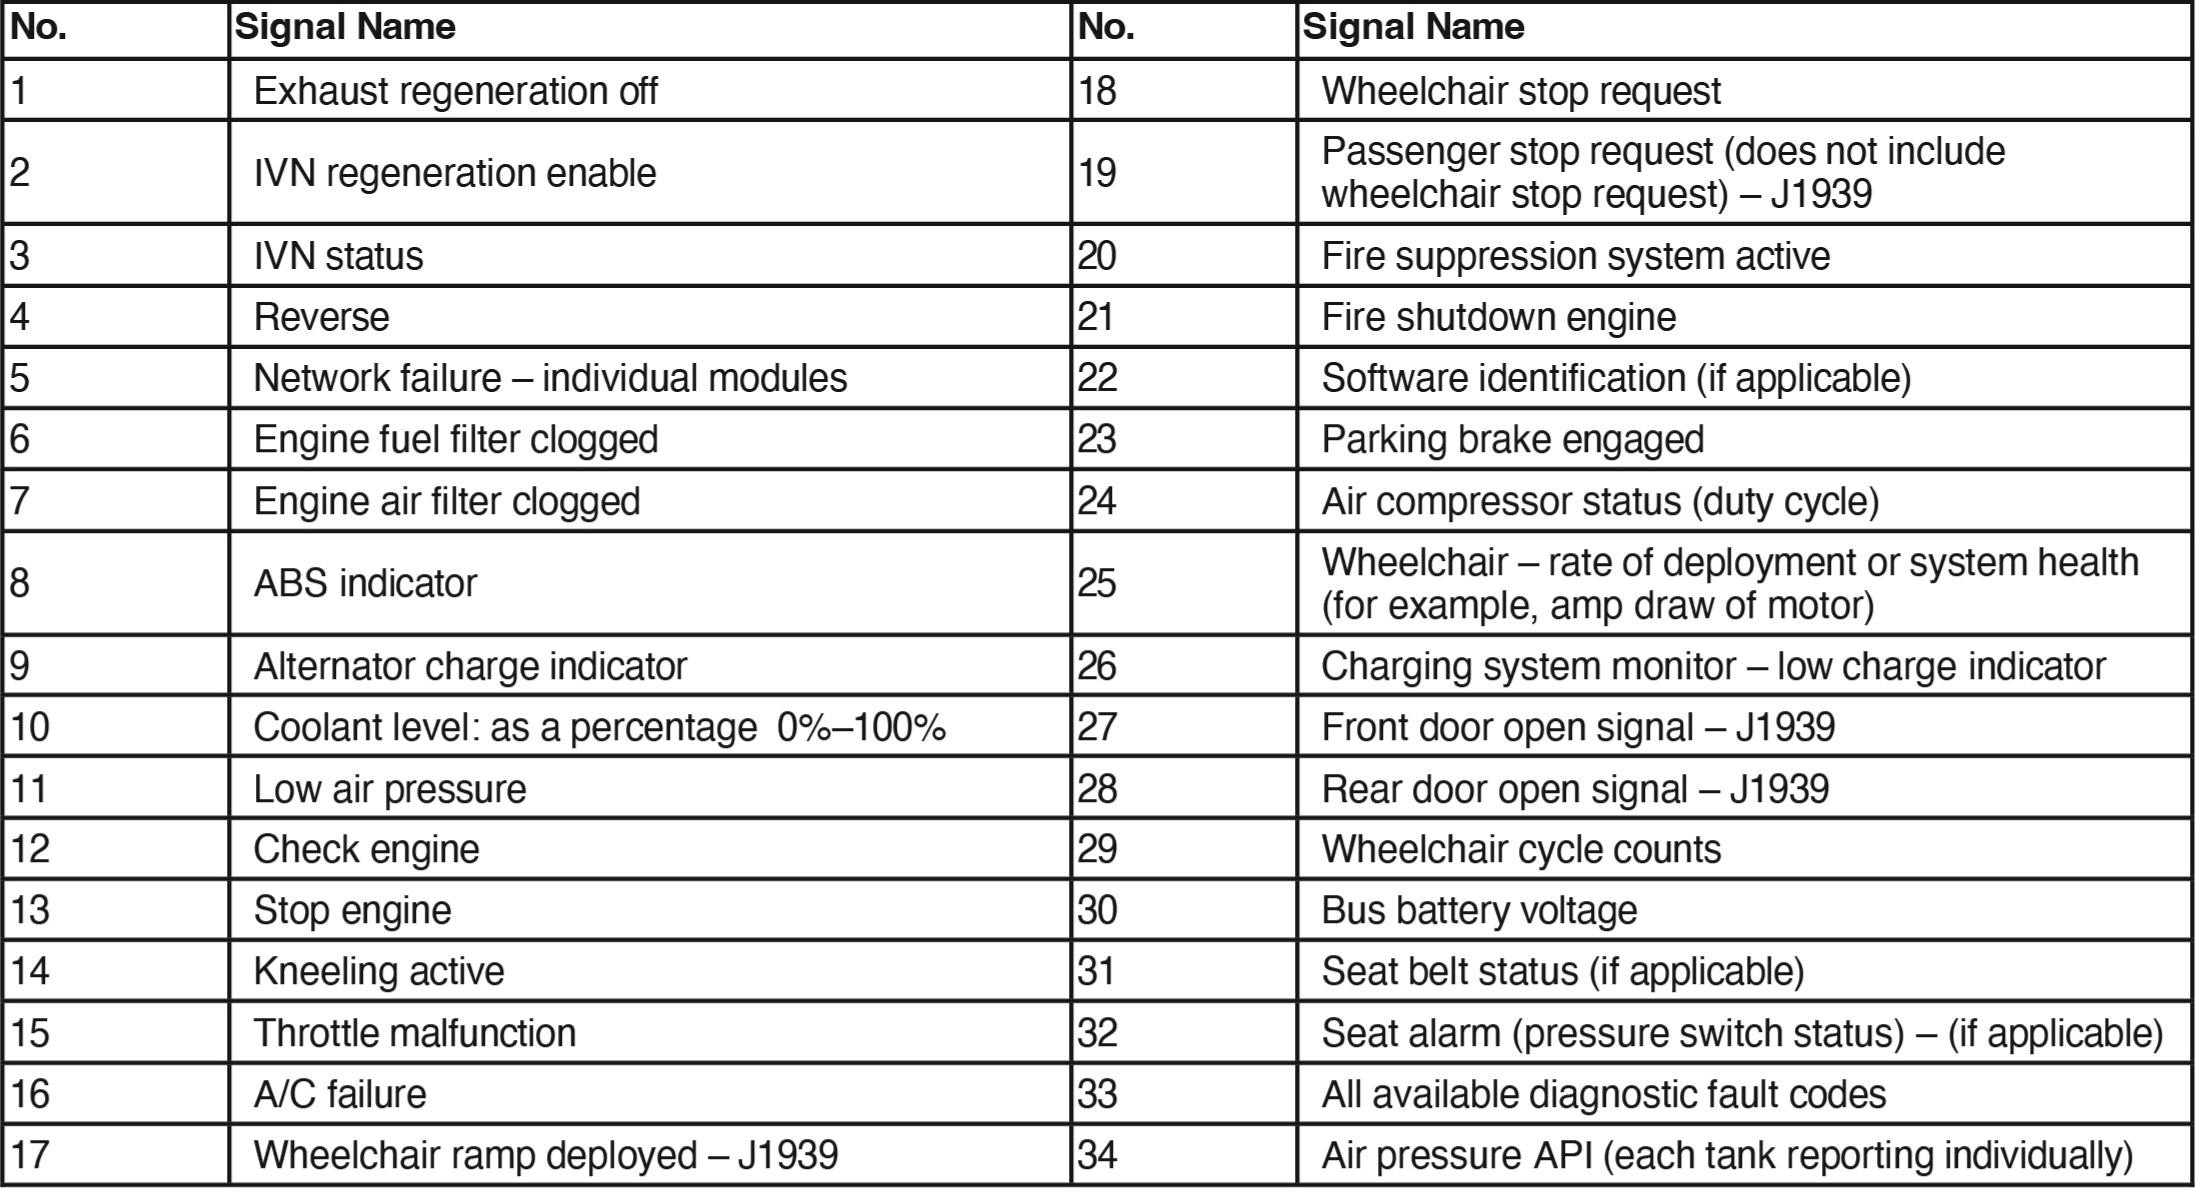
Both tables are titled 'Table A4: Multiplex system broadcast via J1939 CAN network.' The first table consists of 4 columns and 8 rows. The column headers are Number, Signal name, Number, and Signal name. The data given are as follows: Column 1: 1, 2, 3, 4, 5, 6, 7, and 8. Column 2: Exhaust Regeneration Off, IVN Regeneration Enable, IVN Status, Reverse, Network Failure – Individual Modules, Engine Fuel Filter Clogged, Engine Air Filter Clogged, and ABS Indicator. Column 3: 18, 19, 20, 21, 22, 23, 24, and 25. Column 4: Wheelchair Stop Request, Passenger Stop Request (does not include Wheelchair Stop Request) – J1939, Fire Suppression System Active, Fire Shutdown Engine, Software Identification (if applicable), Parking Brake Engaged, Air Compressor Status (Duty Cycle), and Wheelchair – rate of deployment or system health (for example, amp draw of motor). The second table consists of 4 columns and 9 rows. The column headers are Number, 'Signal name, 'Number, and Signal name. The data given are as follows: Column 1: 9, 10, 11, 12, 13, 14, 15, 16, and 17. Column 2: Alternator Charge Indicator; Coolant Level: As a percentage, 0 to 100; Low Air Pressure; Check Engine; Stop Engine; Kneeling Active; Throttle Malfunction; A or C Failure; and Wheelchair Ramp Deployed – J1939. Column 3: 26, 27, 28, 29, 30, 31, 32, 33, and 34. Column 4: Charging System Monitor – Low Charge Indicator, Front Door Open Signal – J1939, Rear Door Open Signal – J1939, Wheelchair Cycle Counts, Bus Battery Voltage, Seat Belt Status (if applicable), Seat Alarm (Pressure switch status) – (if applicable), All Available Diagnostic Fault Codes, and Air Pressure API (Each Tank Reporting Individually).
Long Description.
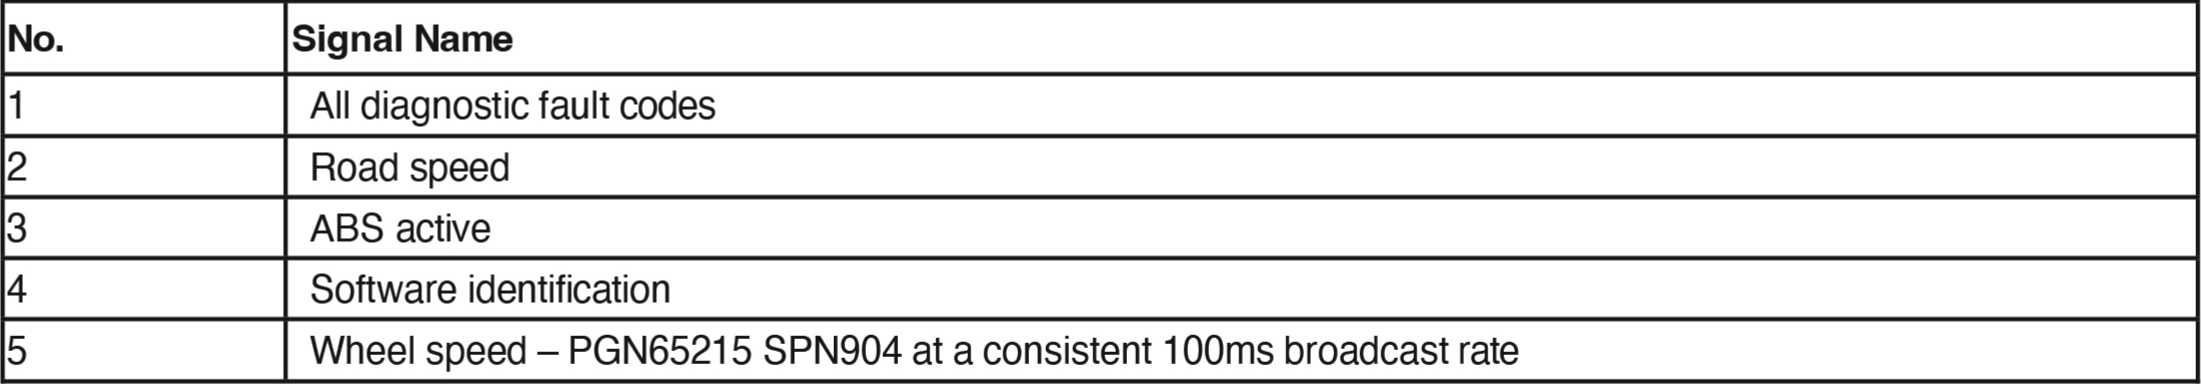
The table is titled 'Table A5: Antibraking System' and has 2 columns and 5 rows. The column headers are the number and signal name. The data shown are as follows: Column 1: 1, 2, 3, 4, and 5. Column 2: All diagnostic fault codes, Road Speed, ABS Active, Software Identification, and Wheel Speed PGN 65215 SPN 904 at a consistent 100 milliseconds broadcast rate.
Long Description.
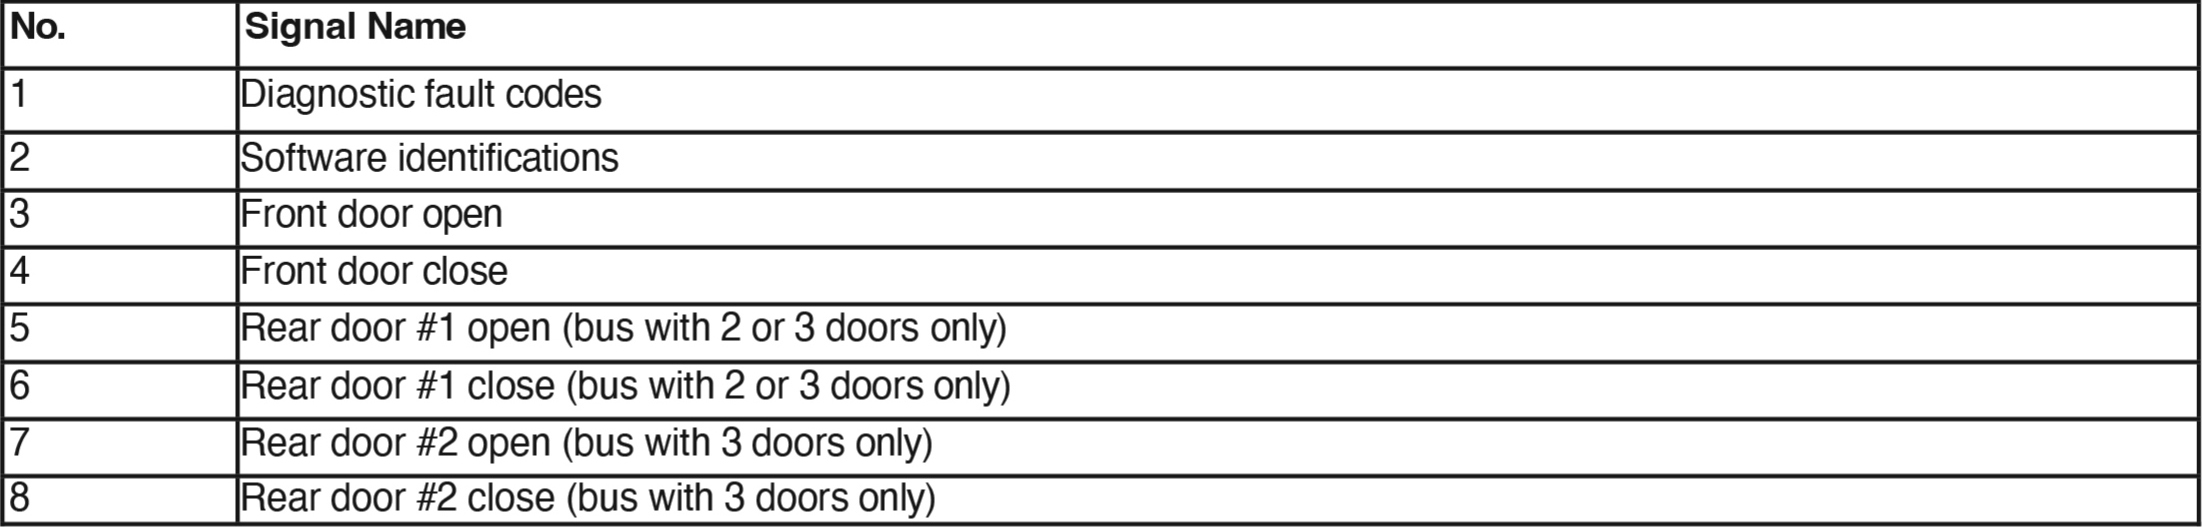
The table is titled 'Table A6: Door Systems' and has 2 columns and 8 rows. The column headers are the number and signal name. The data shown are as follows: Column 1: 1, 2, 3, 4, 5, 6, 7, and 8. Column 2: Diagnostic fault codes, Software Identifications, Front Door Open, Front Door Close, Rear Door number 1 Open (Bus with 2 or 3 doors only), Rear Door number 1 Close (Bus with 2 or 3 doors only), Rear Door number 2 Open (Bus with 3 doors only), and Rear Door number 2 Close (Bus with 3 doors only).
Long Description.
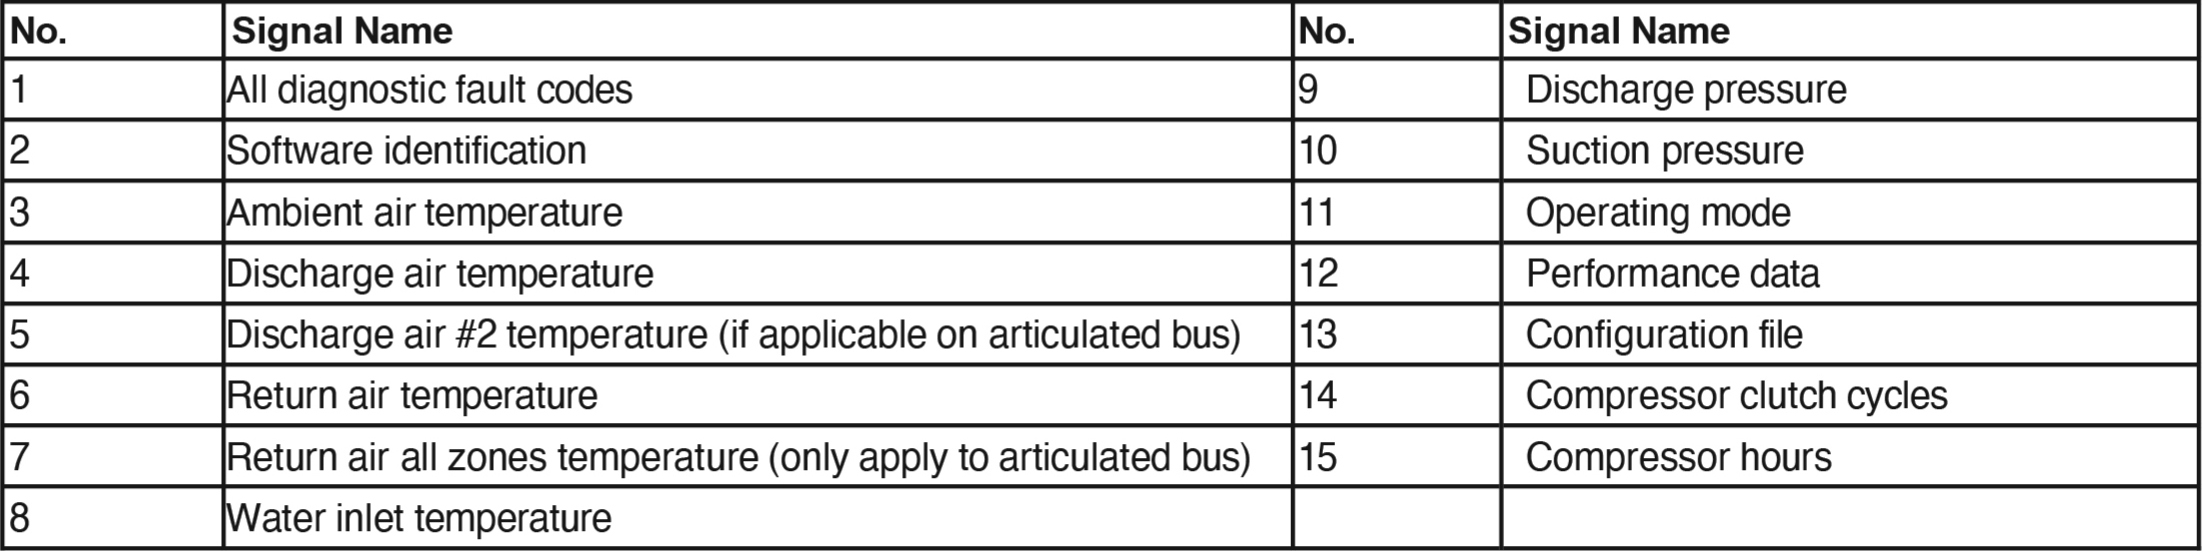
The table is titled 'Table A7: Climate control system.' It has 2 columns, continuing to the right, making it a total of 4 columns and 8 rows. The column headers are Number and Signal name. The data shown are as follows: Column 1: 1, 2, 3, 4, 5, 6, 7, and 8. Column 2: All Diagnostic Fault Codes, Software Identification, Ambient Air Temperature, Discharge Air Temperature, Discharge Air Number 2 Temperature (if applicable on articulated bus), Return Air Temperature, Return Air All Zones Temperature (only applies to articulated bus), and Water Inlet Temperature. The last row of the third and fourth columns is left blank. Column 3: 9, 10, 11, 12, 13, 14, and 15. Column 4: Discharge Pressure, Suction Pressure, Operating Mode, Performance Data, Configuration File, Compressor Clutch Cycles, and Compressor Hours.

Long Description.
The table is titled 'Table A8: Artic joint system (applies to artic bus only)' with 2 columns and 2 rows. The column headers are Number and Signal name. The data given are as follows: Column 1: 1 and 2. Column 2: All Diagnostic Fault Codes and Software Identification.

Long Description.
The table is titled 'Table A9: Vehicle logic unit' with 2 columns and 2 rows. The column headers are Number and Signal name. The data given are as follows: Column 1: 1 and 2. Column 2: All Diagnostic Fault Codes and Software Identification.

Long Description.
The table is titled 'Table A10: Electric vehicle data elements' with 2 columns and 2 rows. The column headers are Number and Signal name. The data given are as follows: Column 1: 1 and 2. Column 2: All Diagnostic Fault Codes and Software Identification.
Long Description.
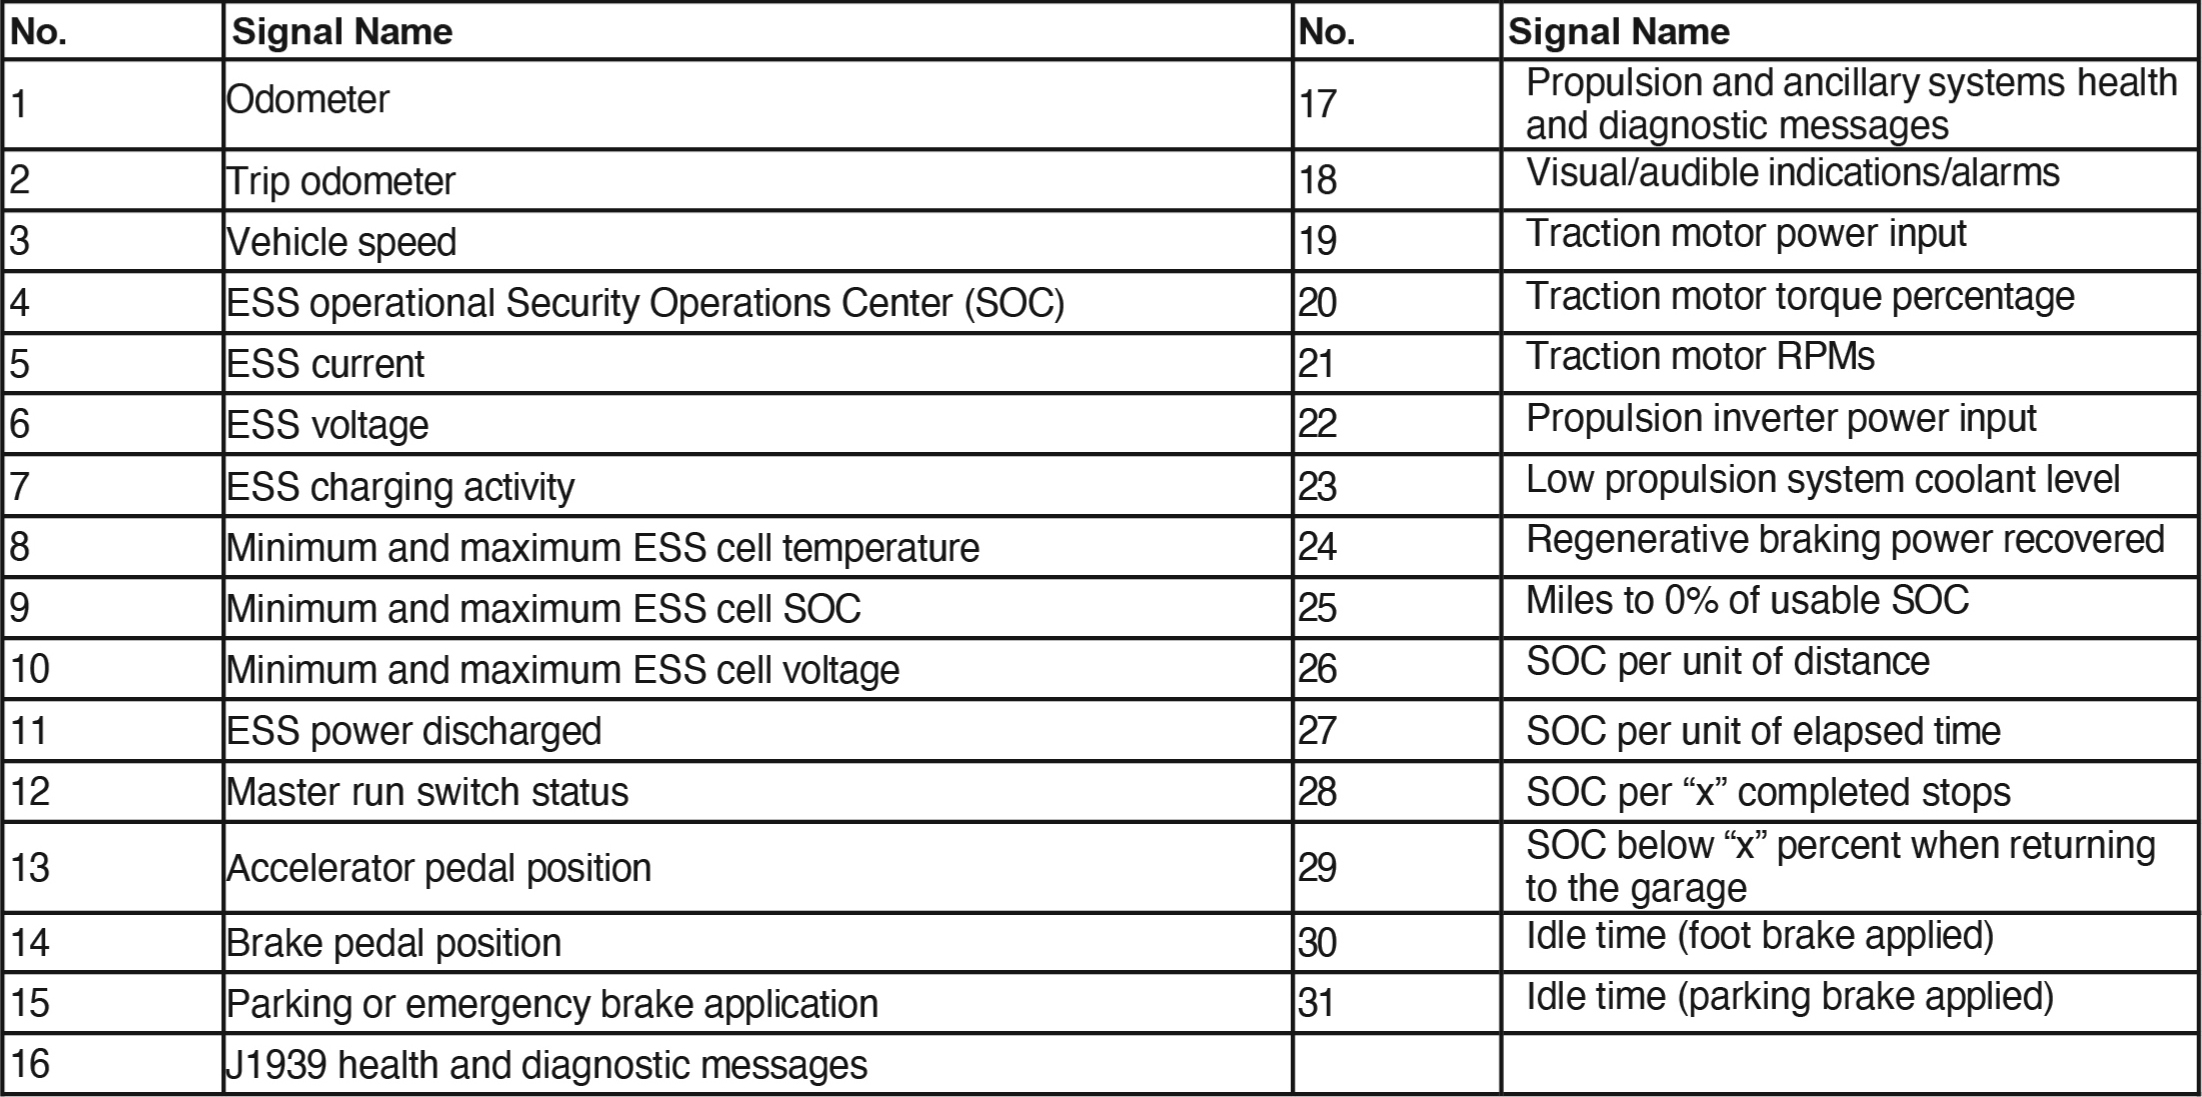
The table is titled 'Table A11: Powertrain system equals traction motor or propulsion control or ESS.' The table consists of 4 columns and 16 rows. The column headers are Number, signal name, number, and Signal name. The data given are as follows: Column 1: 1, 2, 3, 4, 5, 7, 8, 9, 10, 11, 12, 13, 14, 15, 16. Column 2: Odometer, Trip Odometer, Vehicle Speed, E S S Operational Security Operations Center (SOC); ESS Current, ESS Voltage, ESS Charging Activity, Minimum and Maximum ESS Cell Temperature, Minimum and Maximum ESS Cell SOC, Minimum and Maximum ESS Cell Voltage, ESS power discharged, Master Run Switch Status, Accelerator Pedal Position, Brake Pedal Position, Parking or Emergency Brake Application, and J1939 Health and Diagnostic Messages. In Column 3, Number, rows are 17, 18, 19, 20, 21, 22, 23, 24, 25, 26, 27, 28, 29, 30, and 31. Column 4, Signal name, rows are Propulsion and Ancillary Systems Health and Diagnostic Messages, Visual or Audible Indications or Alarms, Traction Motor Power Input, Traction Motor Torque Percentage, Traction Motor RPMs, Propulsion Inverter Power Input, Low propulsion system coolant level, Regenerative braking power recovered, Miles to 0 percentage of useable SOC, SOC per unit of distance, SOC per unit of elapsed time, SOC per “x” completed stops, SOC below “x” percent when returning to the garage, Idle time (foot brake applied), and Idle time (parking brake applied). The last rows of the third and fourth columns are left blank.
Long Description.
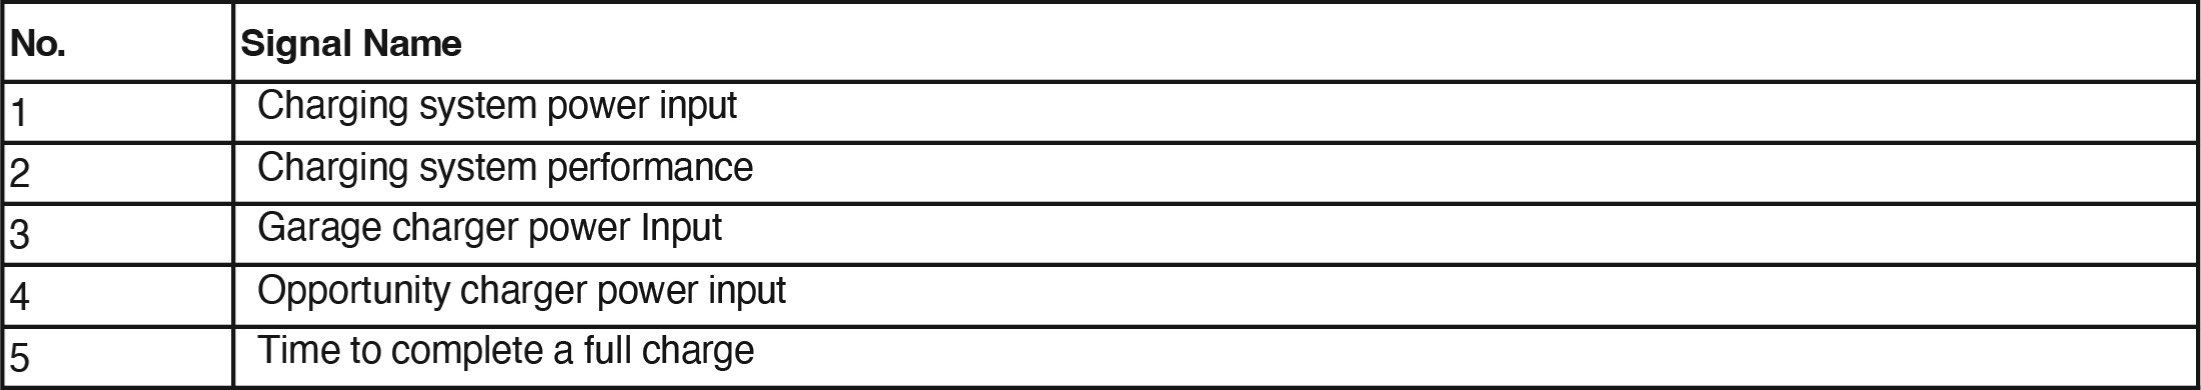
The table is titled 'Table A12: Charging system' with 2 columns and 5 rows. The column headers are Number and Signal name. The data given are as follows: Column 1: 1, 2, 3, 4, and 5. Column 2: Charging system power input, Charging system performance, Garage charger power Input, Opportunity charger power input, and Time to complete a full charge.
Long Description.
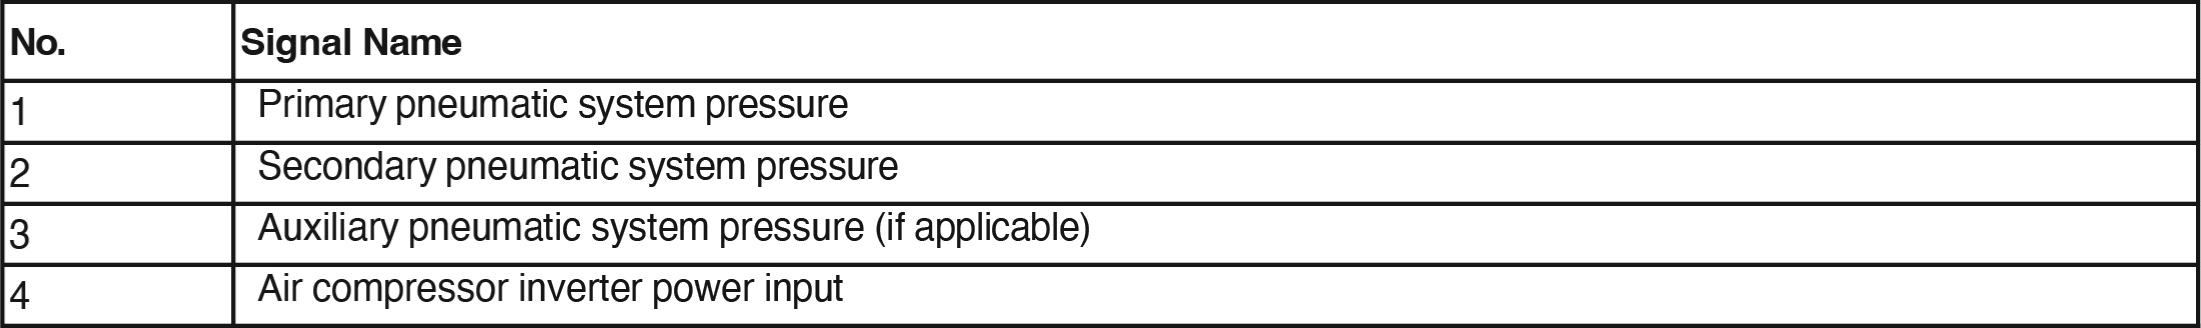
The table is titled 'Table A13: Electric vehicle pneumatic system' with 2 columns and 4 rows. The column headers are Number and Signal name. The data given are as follows: Column 1: 1, 2, 3, and 4. Column 2: Primary Pneumatic System Pressure, Secondary Pneumatic System Pressure, Auxiliary Pneumatic System Pressure (if applicable), and Air Compressor Inverter Power Input.
Long Description.
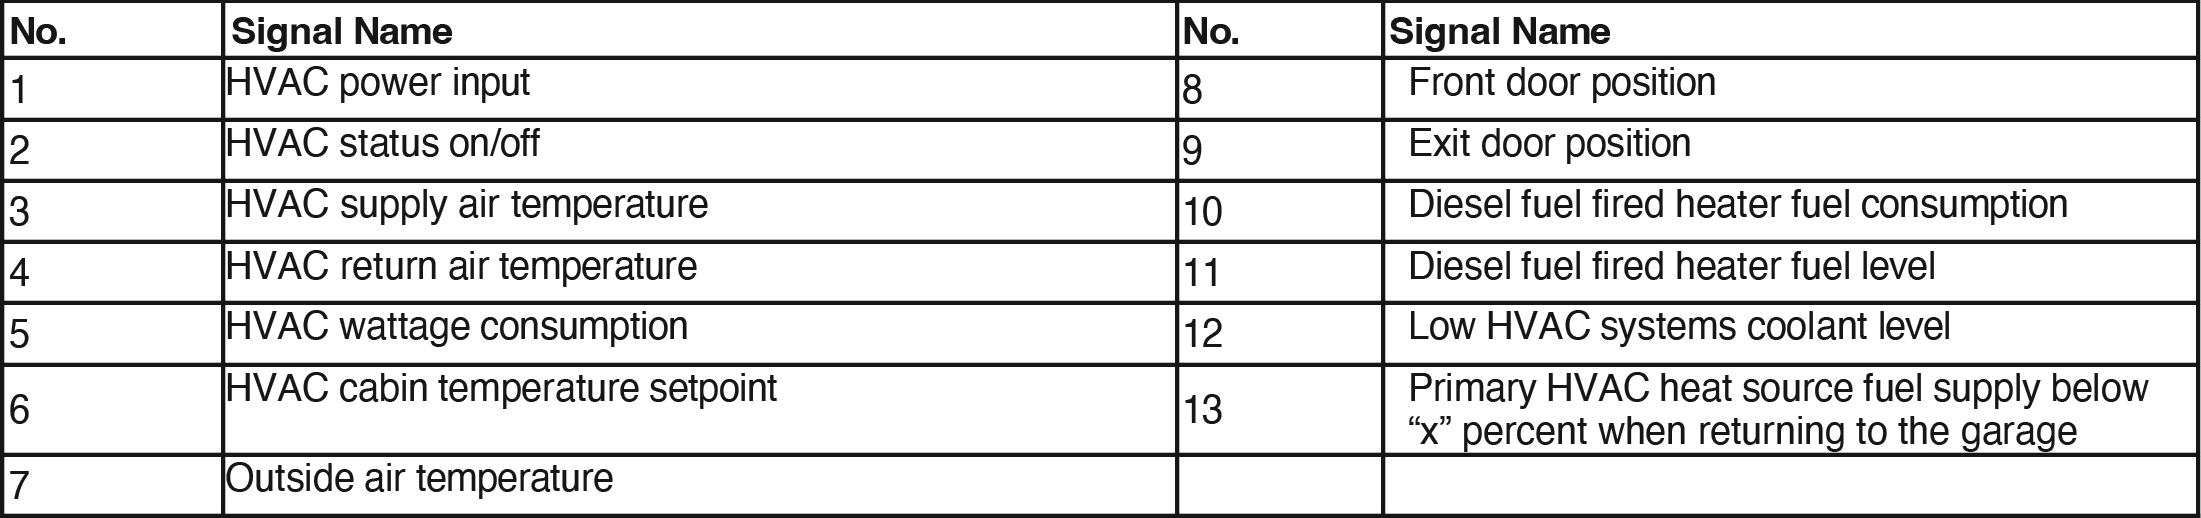
The table is titled 'Table A14: Electric vehicle H VAC system' and has 4 columns and 7 rows. The column headers are Number, signal name, number, and Signal name. The data shown are as follows: Column 1: 1, 2, 3, 4, 5, 6, and 7. Column 2: HVAC Power Input, HVAC Status on or off, HVAC Supply Air Temperature, H VAC Return Air Temperature, HVAC wattage consumption, HVAC Cabin Temperature setpoint, and Outside Air Temperature. The last rows of the third and fourth columns are left blank. Column 3: 8, 9, 10, 11, 12, and 13. Column 4: Front Door Position, Exit Door Position, Diesel Fuel Fired Heater Fuel Consumption, Diesel Fuel Fired Heater Fuel Level, Low HVAC systems coolant level, and Primary HVAC heat source fuel supply below “x” percent when returning to the garage.
Long Description.
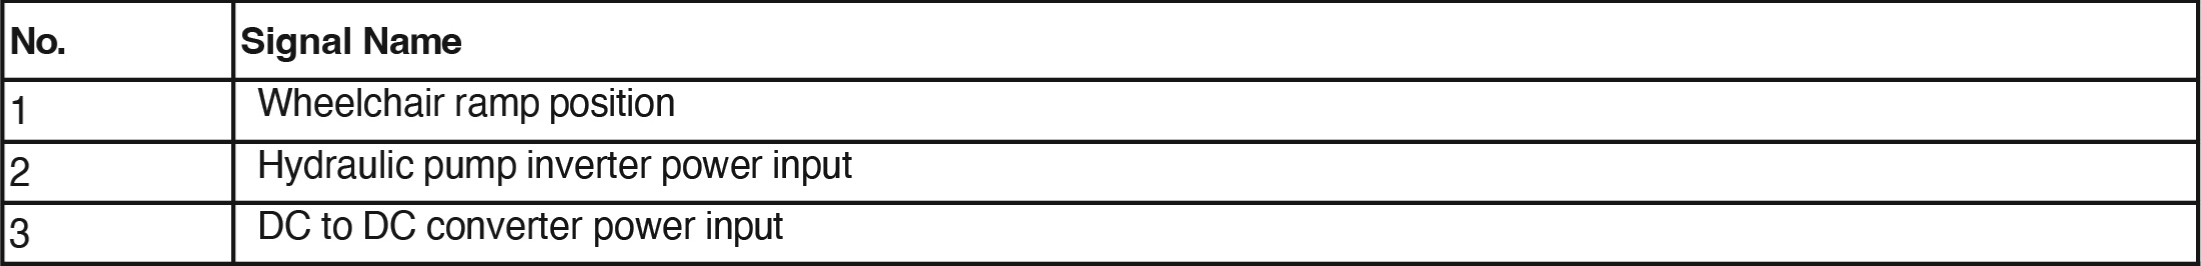
The table is titled 'Table A15: Electric vehicle auxiliary systems' and has 2 columns and 3 rows. The column headers are the number and the signal name. The data given are as follows: Column 1: 1, 2, and 3. Column 2: Wheelchair Ramp Position, Hydraulic Pump Inverter Power Input, and DC to DC Converter Power Input.


