Design Options to Reduce Conflicts Between Turning Motor Vehicles and Bicycles: Conduct of Research Report (2024)
Chapter: 7 Video-Based Conflict Analysis
CHAPTER 7
Video-Based Conflict Analysis
The video-based surrogate safety analysis, or conflict analysis, examines conflicts via surrogate safety measures at a further targeted scale to provide additional insight into the dynamics between bicycle safety and known risk factors like turning volumes, speed, and design features. This chapter presents the findings from the conflict analysis, including site selection, video data collection, conflict extraction and results.
Site Selection
The goal of the conflict analysis site selection process was to identify 25-30 sites, with: five to six locations per treatment type, a mix of traffic intensities (medium, high) and locations with higher bicycle volumes and crash history to increase the likelihood of recordable conflicts.
For conflict analysis site selection, the primary consideration was for traffic intensity and recorded or estimated AADT. Recorded AADT came from local jurisdiction volume data for specific segments immediately entering or exiting the intersection on the approach street. Estimated AADT were derived by averaging across the entire city AADT dataset, assigned by functional class of the roadway. AADTs were categorized5 as:
- High - above 15,000
- Medium - 9,000 to 15,000
- Low - below 9,000
To select the candidate locations for video-based conflict analysis, the entire set of sites selected for the micro crash analysis were reviewed and filtered by type of treatment type (e.g., bike lane, pocket bike lane, mixing zone, separated bike lane, protected intersection). The available list of sites were reviewed and sites with high-quality designs and feasible camera mounting locations were prioritized for selection. At each location, the cameras were mounted at a certain height and angle in consultation with the video processing vendor to facilitate good views for optimal data extraction and minimize occlusion. Several locations in each city were included to incorporate geographic diversity. The team intentionally did not select sites with known low bicycle volumes due to the concern about not being able to record enough motor vehicle - bicycle interactions for analysis.
Additional sites were added to the list of sites that were selected for crash analysis to ensure that we have enough locations with high-quality design for each design treatment type. For example, most of the sites initially identified for offset /protected intersection locations were in New York, and generally were on the
___________________
5 The AADT thresholds (high, medium, low) were selected based on the context of this research and, while reasonable breakpoints, may not be applicable to all jurisdictions.
left side of one-way streets. Several additional locations that were right-side offset / protected designs were included.
Ultimately, 28 sites were selected for video data collection and conflict analysis spread across the four cities and distributed among the bikeway types shown in Table 39. A higher number of offset/protected treatment sites were selected due to key unresolved research questions identified during the literature review and practitioner interviews. The key questions were regarding the bikeway type and the diversity in existing designs (left-side vs. right-side), therefore, necessitating the oversampling of sites and ensuring enough interactions would be available for analysis.
Table 39. Bikeway design type count by city
| Bikeway Type | City | ||||
|---|---|---|---|---|---|
| Austin | Minneapolis | Seattle | New York | Total | |
| Bike lane | 2 | 1 | 2 | 0 | 5 |
| Pocket bike lane | 1 | 2 | 2 | 0 | 5 |
| Mixing zone | 0 | 1 | 1 | 3 | 5 |
| Separated bike lane | 2 | 0 | 3 | 0 | 5 |
| Offset/Protected | 1 | 0 | 1 | 6 | 8 |
| Total | 28 | ||||
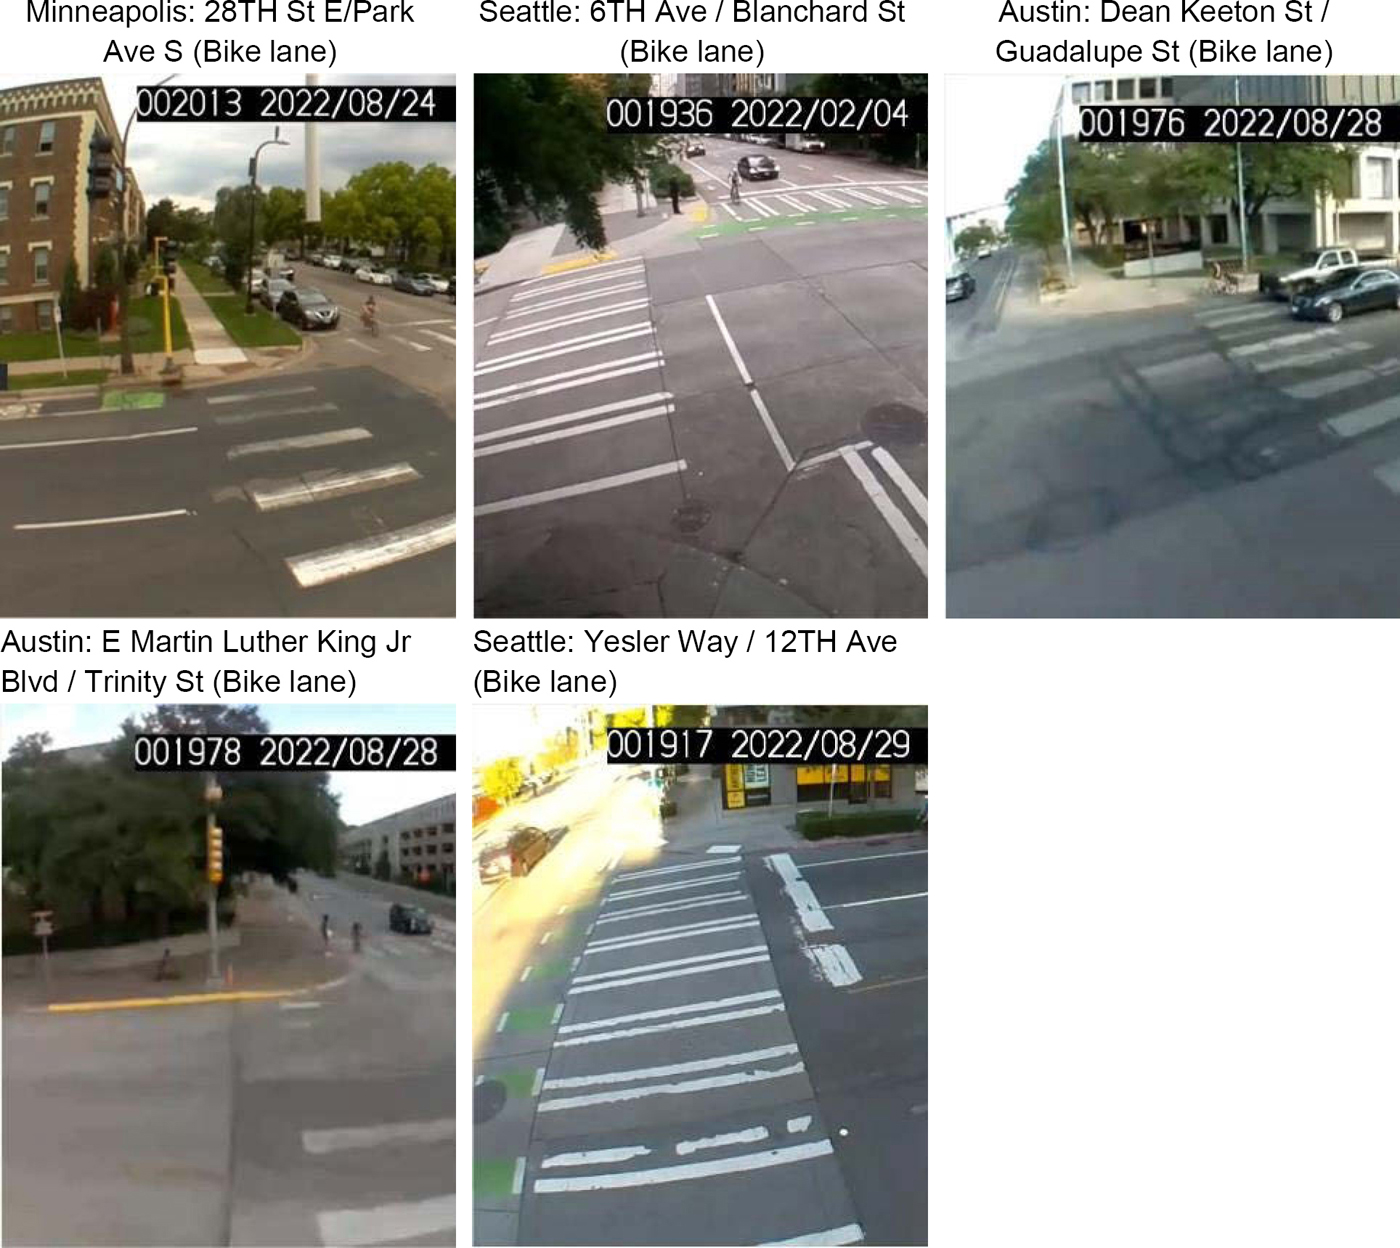
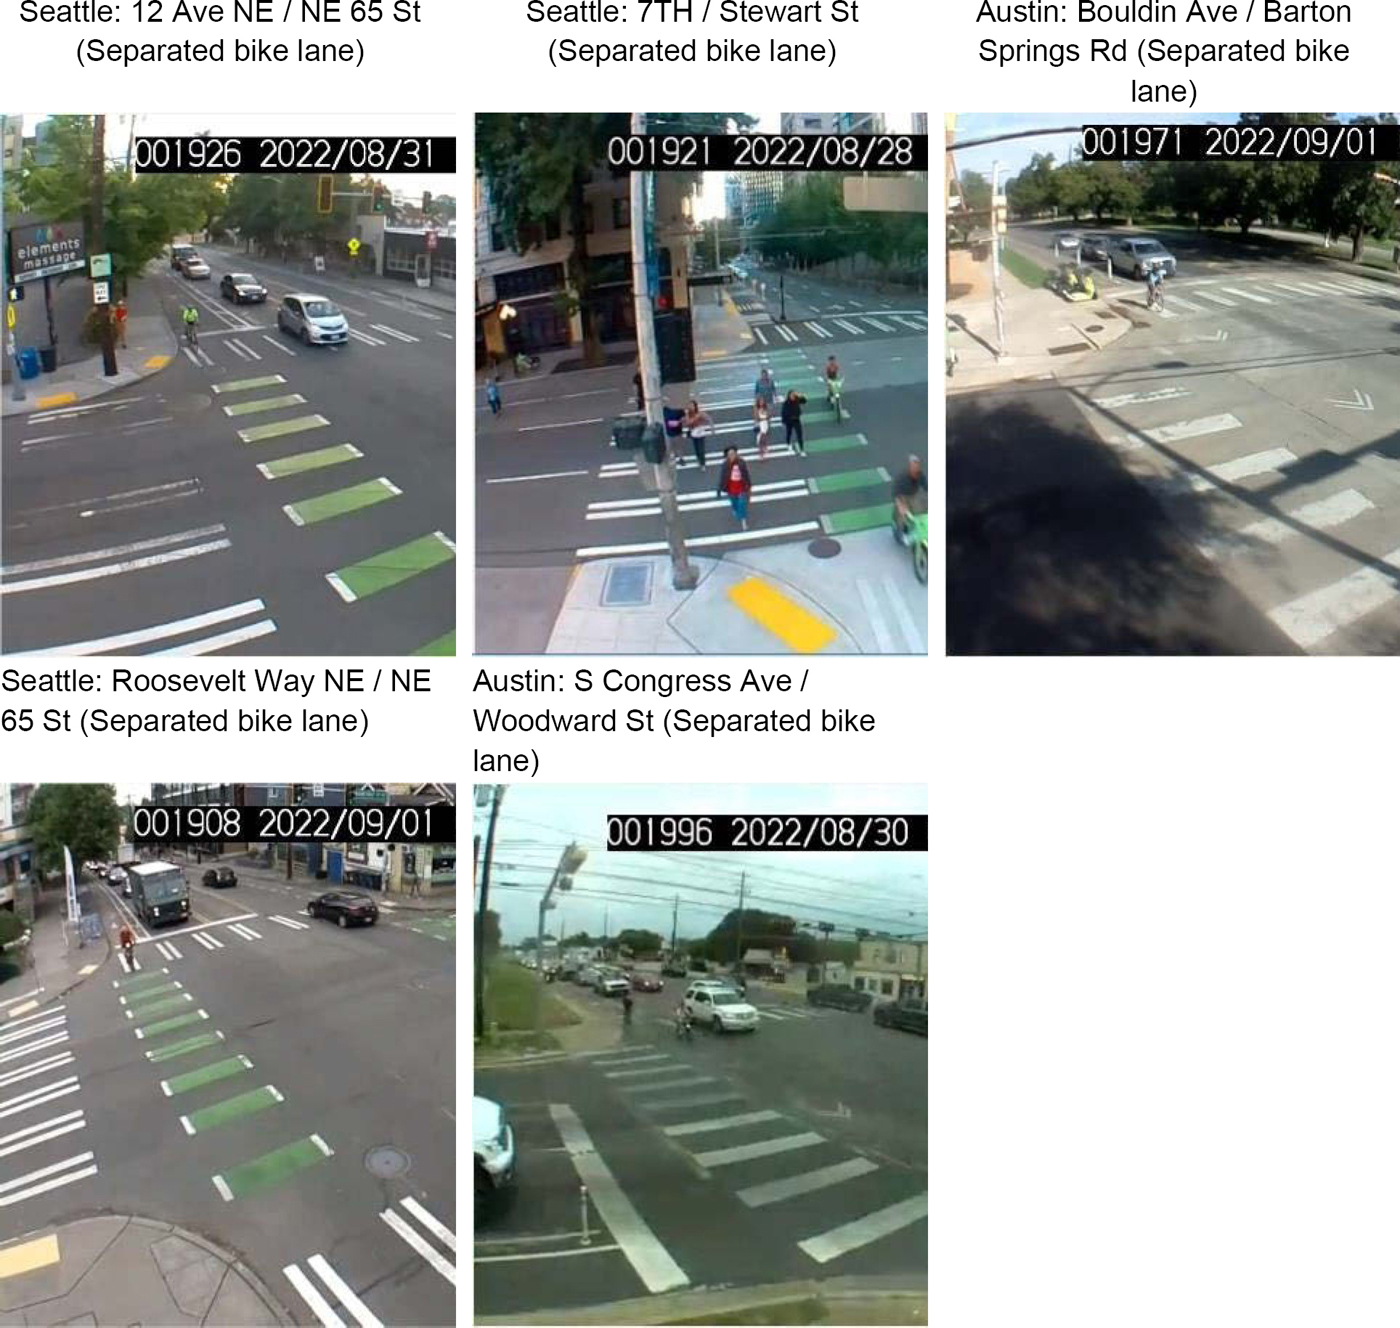
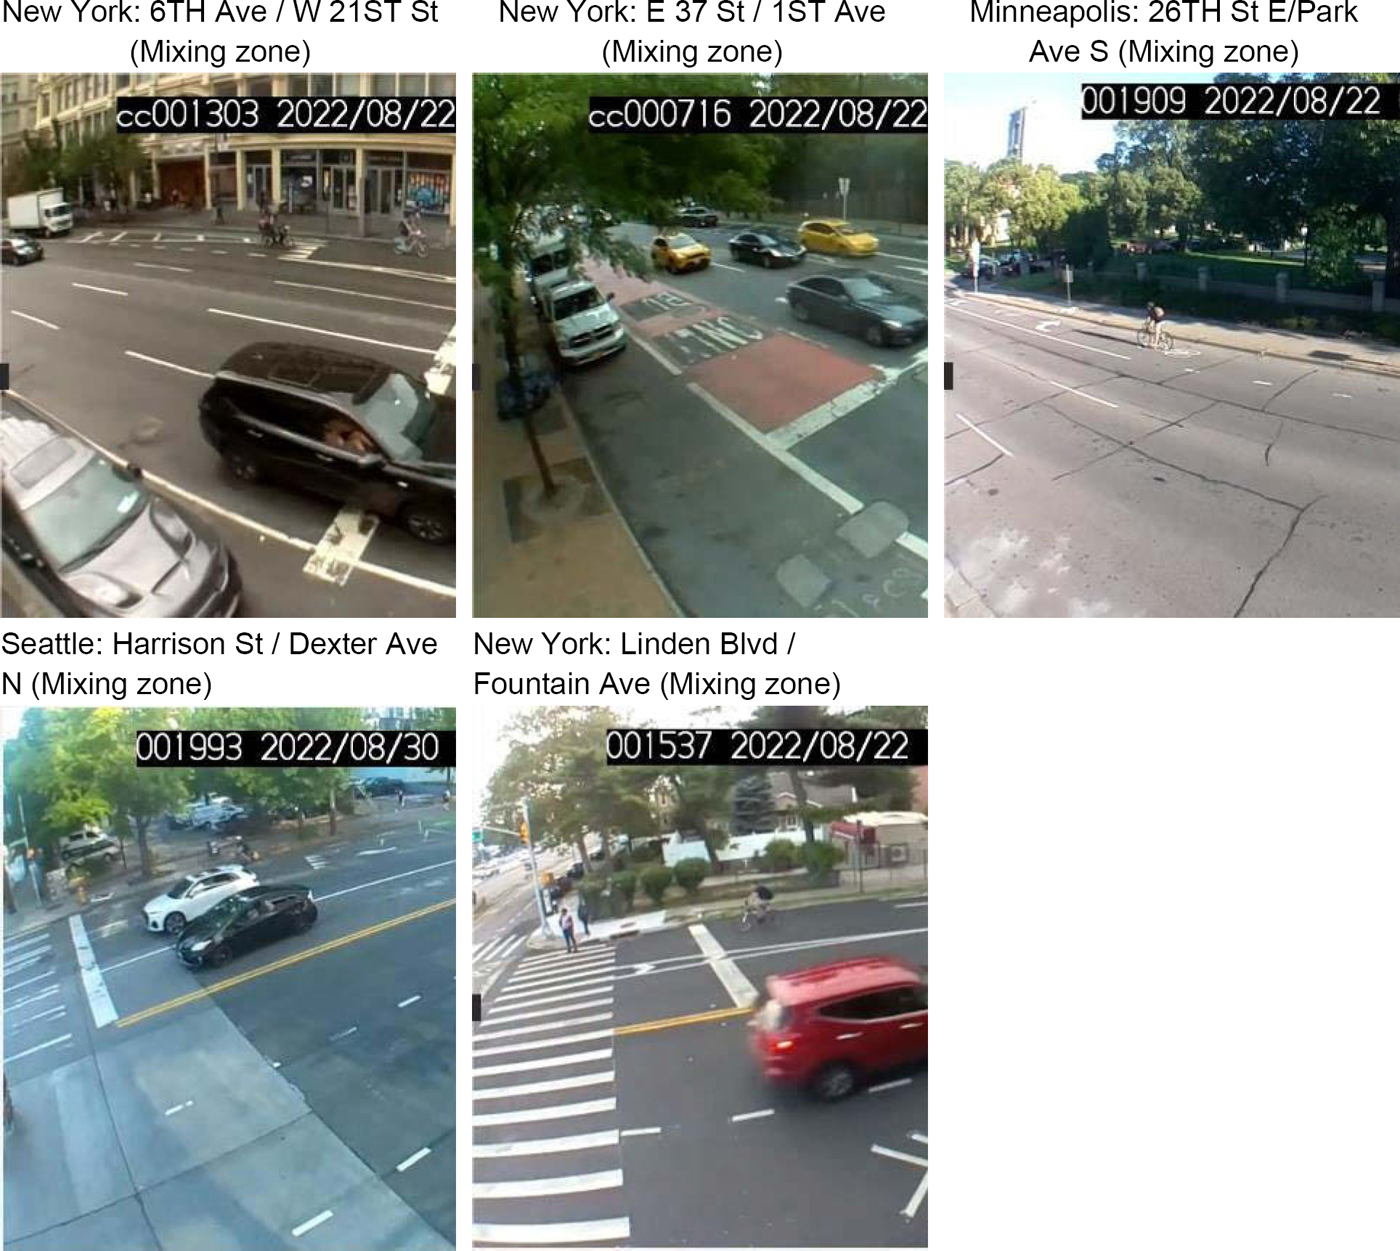
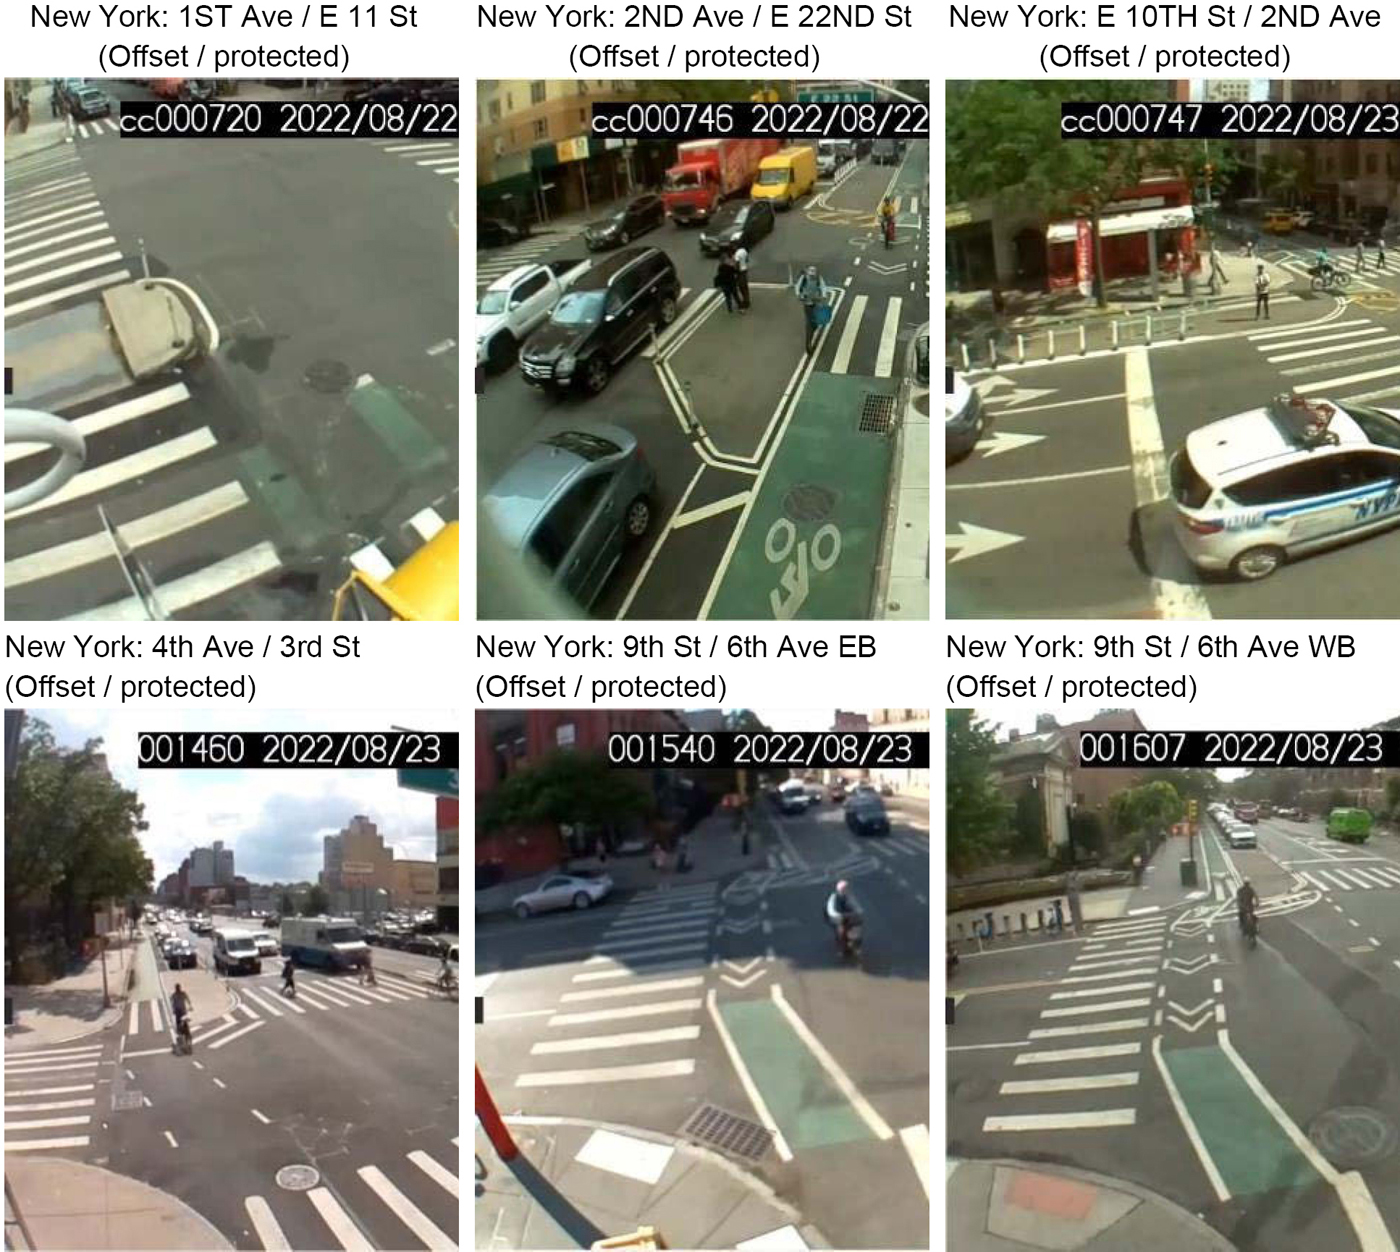
The final list of sites along with some key site characteristics is shown in Table 40. Screen shots from the video capture are shown in Figure 7 through Figure 11. Additional details and images are included in the Appendix E – Conflict Analysis Site by Site Graphics.
CONVENTIONAL BIKE LANES
POCKET OR KEYHOLE BICYCLE LANE

SEPARATED BIKE LANE
MIXING ZONES
OFFSET / PROTECTED

Video Data Collection
Once the locations were selected for the conflict analysis, they were shared with two different vendors; one contracted to assist with the data collection and the other for the automated conflict data extraction process. The data collection vendor coordinated with the data extraction vendor to optimize the camera placement at each of the sites. A map of the locations was generated, and the research team identified the conflict areas for each site to be recorded. Potential camera placements and mounting specifications were identified using Google Street View and satellite images and further refined to maximize the conflict area view at each site.
The goal of the data collection process was to collect at least five days of video, with 12 hours of video per day (i.e., 7 am - 7 pm), resulting in approximately 60 hours of video collected per site. However, due to camera malfunctions at many sites, video data was recollected resulting in more than 60 hours of video data being available. This was particularly relevant at the Austin and Seattle locations. Only one location (Yesler Way and 12th Ave) in Seattle had 28 hours of usable video data. Table 41 shows the dates and time of the video data collection.
Table 40. Conflict analysis sites and key characteristics
| Bikeway Type | Location | City | Approach | Traffic Direction | Speed Limit | Vehicle AADT | BL side | Opposing left turn signal | Cross street # general traffic lanes |
|---|---|---|---|---|---|---|---|---|---|
| Conventional Bike Lane | Dean Keeton St and Guadalupe St | Austin | N | Two-way | 35 | 24713* | Right | Excl Left 5-head turn arrow | 3 |
| E MLK Jr Blvd and Trinity St | Austin | NW | Two-way | 45 | 26329 | Right | Excl Left 5-head turn arrow | 6 | |
| 28th St E and Park Ave S | Minneapolis | N | One-way | 35 | 9490 | Right | No opposing left turn lane | 3 | |
| 6th Ave and Blanchard St | Seattle | NW | One-way | 25 | 18200 | Right | No opposing left turn lane | 3 | |
| Yesler Way and 12th Ave | Seattle | S | Two-way | 25 | 13100 | Right | No opposing left turn lane | 3 | |
| Pocket Bike Lane | Guadalupe St and W 38th St | Austin | SE | Two-way | 45 | 16372* | Right | Excl Left 5-head turn arrow | 6 |
| Hennepin Ave and S 1st St | Minneapolis | SW | Two-way | 30 | 16372* | Right | Excl Left-3-head Turn Arrow | 5 | |
| S 11th St and Lasalle Ave | Minneapolis | SW | Two-way | 30 | 10188 | Right | Excl Left 5-head turn arrow | 6 | |
| 7th Ave S and Dearborn St | Seattle | W | Two-way | 25 | 22400 | Right | No opposing left turn lane | 2 | |
| NE 75th St and Roosevelt Way NE | Seattle | E | Two-way | 25 | 11600 | Right | No opposing left turn lane | 4 | |
| Separated Bike Lane | Bouldin Ave and Barton Springs Rd | Austin | SE | Two-way | 45 | 24713* | Right | 3-head ball | 1 |
| Congress Ave and Woodward St | Austin | NE | Two-way | 45 | 24713* | Right | Excl Left 5-head turn arrow | 4 | |
| 12th Ave NE and NE 65th St | Seattle | W | Two-way | 25 | 17100 | Right | Excl Left 4-head turn arrow | 6 |
| Bikeway Type | Location | City | Approach | Traffic Direction | Speed Limit | Vehicle AADT | BL side | Opposing left turn signal | Cross street # general traffic lanes |
|---|---|---|---|---|---|---|---|---|---|
| 7th Ave S and Stewart St | Seattle | SE | One-way | 25 | 9500 | Right | No opposing left turn lane | 4 | |
| Roosevelt Way NE and NE 65th St | Seattle | NE | Two-way | 25 | 14700 | Right | No opposing left turn lane | 6 | |
| Mixing Zone | 26th St E and Park Ave S | Minneapolis | W | One-way | 30 | 13213 | Right | No opposing left turn lane | 3 |
| 6th Ave and W 21st St | New York City | NE | One-way | 25 | 6552 | Left | No opposing left turn lane | 1 | |
| E 37th St and 1st Ave | New York City | NE | One-way | 25 | 12356 | Left | No opposing left turn lane | 1 | |
| Linden Blvd and Fountain Ave | New York City | SE | Two-way | 25 | 2895 | Right | 3-head ball | 10 | |
| Harrison St and Dexter Ave N | Seattle | N | Two-way | 25 | 11900 | Right | Excl Left-3-head Turn Arrow | 3 | |
| Offset or Protected Intersection | Congress Ave and E 3rd St | Austin | SE | Two-way | 35 | 5628* | Right | No opposing left turn lane | 4 |
| 1st Ave and E 11th St | New York City | NE | One-way | 25 | 2763 | Left | No opposing left turn lane | 1 | |
| 2nd Ave and E 22nd St | New York City | SW | One-way | 25 | 3179 | Left | No opposing left turn lane | 1 | |
| 4th Ave and 3rd St | New York City | NE | Two-way | 25 | 26256 | Right | No opposing left turn lane | 2 | |
| 9th St and 6th Ave | New York City | SE | Two-way | 25 | 8689 | Right | 3-head ball | 2 | |
| E 10th St and 2nd Ave | New York City | SW | One-way | 25 | 25279 | Left | No opposing left turn lane | 1 | |
| Dexter Ave N and Aloha St | Seattle | N | Two-way | 25 | 13300 | Right | No opposing left turn lane | 2 |
(* AADT is estimated)
Table 41. Video data collection hours
| Bikeway Type | Location | City | Dates (2022) | Total Hours Collected |
|---|---|---|---|---|
| Conventional Bike Lane | Dean Keeton St and Guadalupe St | Austin | Oct. 05 to Oct. 10 | 54 |
| E MLK Jr Blvd and Trinity St | Austin | Aug. 31 to Sep. 03 Oct. 05 to Oct. 12 |
108 | |
| 28th St E and Park Ave S | Minneapolis | Aug. 21 to Aug. 26 | 74 | |
| 6th Ave and Blanchard St | Seattle | Aug. 29 to Aug. 31 Sep. 03 to Sep. 05 Oct. 02 to Oct. 06 |
117 | |
| Yesler Way and 12th Ave | Seattle | Aug. 28 to Sep. 01 | 28 | |
| Pocket Bike Lane | Guadalupe St and W 38th St | Austin | Aug. 31 to Sep. 02 Oct. 05 to Oct. 10 |
102 |
| Hennepin Ave and S 1st St | Minneapolis | Sep. 18 to Sep. 23 | 77 | |
| S 11th St and Lasalle Ave | Minneapolis | Aug. 24 to Aug. 26 Sep. 19 to Sep. 23 |
102 | |
| 7th Ave S and Dearborn St | Seattle | Aug. 28 to Sep. 02 Oct. 03 to Oct. 07 |
82 | |
| NE 75th St and Roosevelt Way NE | Seattle | Aug. 29 to Sep. 02 Oct. 03 to Oct. 07 |
111 | |
| Separated Bike Lane | Bouldin Ave and Barton Springs Rd | Austin | Oct. 05 to Oct. 12 | 77 |
| Congress Ave and Woodward St | Austin | Sep. 01 to Sep. 03 Oct. 05 to Oct. 11 |
89 | |
| 12th Ave NE and NE 65th St | Seattle | Aug. 29 to Aug. 31 Oct. 03 to Oct. 07 |
88 | |
| 7th Ave S and Stewart St | Seattle | Aug. 28 to Sep. 02 | 124 | |
| Oct. 03 to Oct. 06 | ||||
| Bikeway Type | Location | City | Dates (2022) | Total Hours Collected |
|---|---|---|---|---|
| Roosevelt Way NE and NE 65th St | Seattle | Aug. 29 to Sep. 02 | 68 | |
| Mixing Zone | 26th St E and Park Ave S | Minneapolis | Aug. 21 to Aug. 26 | 69 |
| 6th Ave and W 21st St | New York City | Aug. 22 to Aug. 26 | 69 | |
| E 37th St and 1st Ave | New York City | Aug. 22 to Aug. 26 | 71 | |
| Linden Blvd and Fountain Ave | New York City | Aug. 22 to Aug. 26 | 70 | |
| Harrison St and Dexter Ave N | Seattle | Aug. 29 to Sep. 01 Oct. 03 to Oct. 07 |
98 | |
| Offset or Protected Intersection | Congress Ave and E 3rd St | Austin | Sep. 01 to Sep. 03 Oct. 05 to Oct. 07 Oct. 09 to Oct. 12 |
85 |
| 1st Ave and E 11th St | New York City | Aug. 22 to Aug. 26 | 71 | |
| 2nd Ave and E 22nd St | New York City | Aug. 22 to Aug. 26 | 71 | |
| 4th Ave and 3rd St | New York City | Aug. 22 to Aug. 26 | 68 | |
| 9th St and 6th Ave | New York City | Aug. 22 to Aug. 26 Oct. 05 to Oct. 07 |
106 | |
| E 10th St and 2nd Ave | New York City | Aug. 22 to Aug. 26 Oct. 05 to Oct. 07 |
75 | |
| Dexter Ave N and Aloha St | Seattle | Aug. 29 to Sep. 02 | 67 | |
| Total | 2,167 |
Conflict Identification
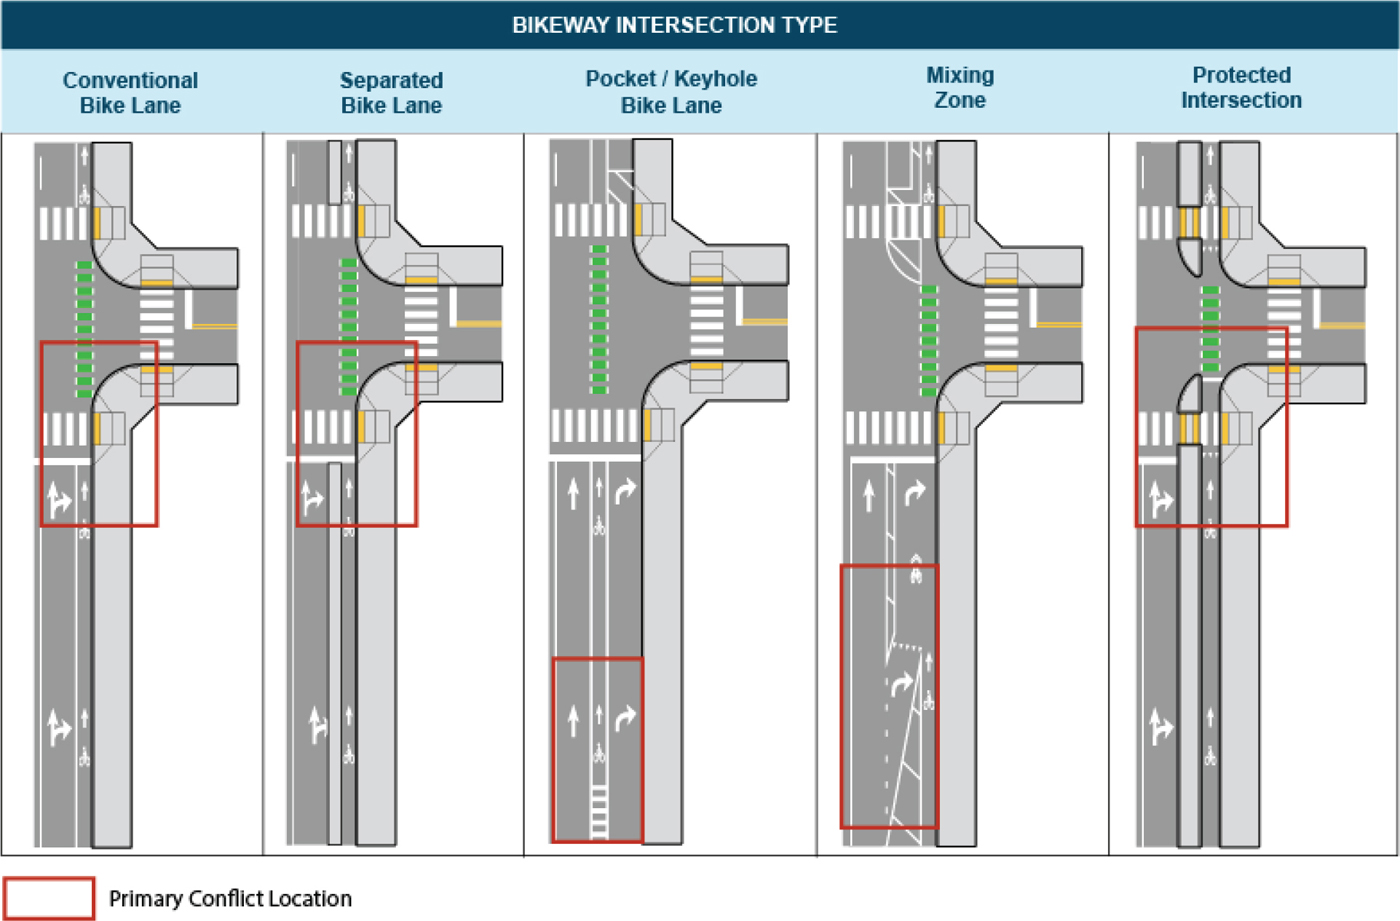
After the videos were collected at each site, they were processed using automated video processing methods by a vendor selected for this task. For each selected site, the research team worked with the vendor to identify the locations where the design required motor vehicles and bicycles to interact or cross paths. In general, the locations for the conflict areas are shown in Figure 12.
At each site, the vendor identified conflicts from the video using algorithms that track each user’s trajectory in the time-space plane. The measure used to identify conflicts was the PET, a surrogate safety metric. PET was originally introduced by Allen et al. (Allen et al., 1978) and is defined as “the time between the moment when the first road user leaves the path of the second and the moment when the second reaches the path of the first” (Johnsson et al., 2018). Thus, PET essentially measures how close in time the road users are to each other when occupying the same space (Russo et al., 2022). Lower values of PET indicate the potential for more severe conflicts.
PET was chosen as the surrogate safety metric of choice as opposed to TTC because the road users do not have to be on a collision course to calculate PET and it is easier to measure by defining the conflict point and recording time stamps for the different road users.
The vendors algorithm identified all interactions with PETs less than or equal to 10 seconds for the movement of interest at each location. The raw data provided by the vendor included two files. The safety events file included:
- the observed PETs,
- the date and time of each observed conflict,
- type of road users,
- which road user arrived first,
- median and conflict speed of the two road users involved in the conflict, and
- the type of conflict.
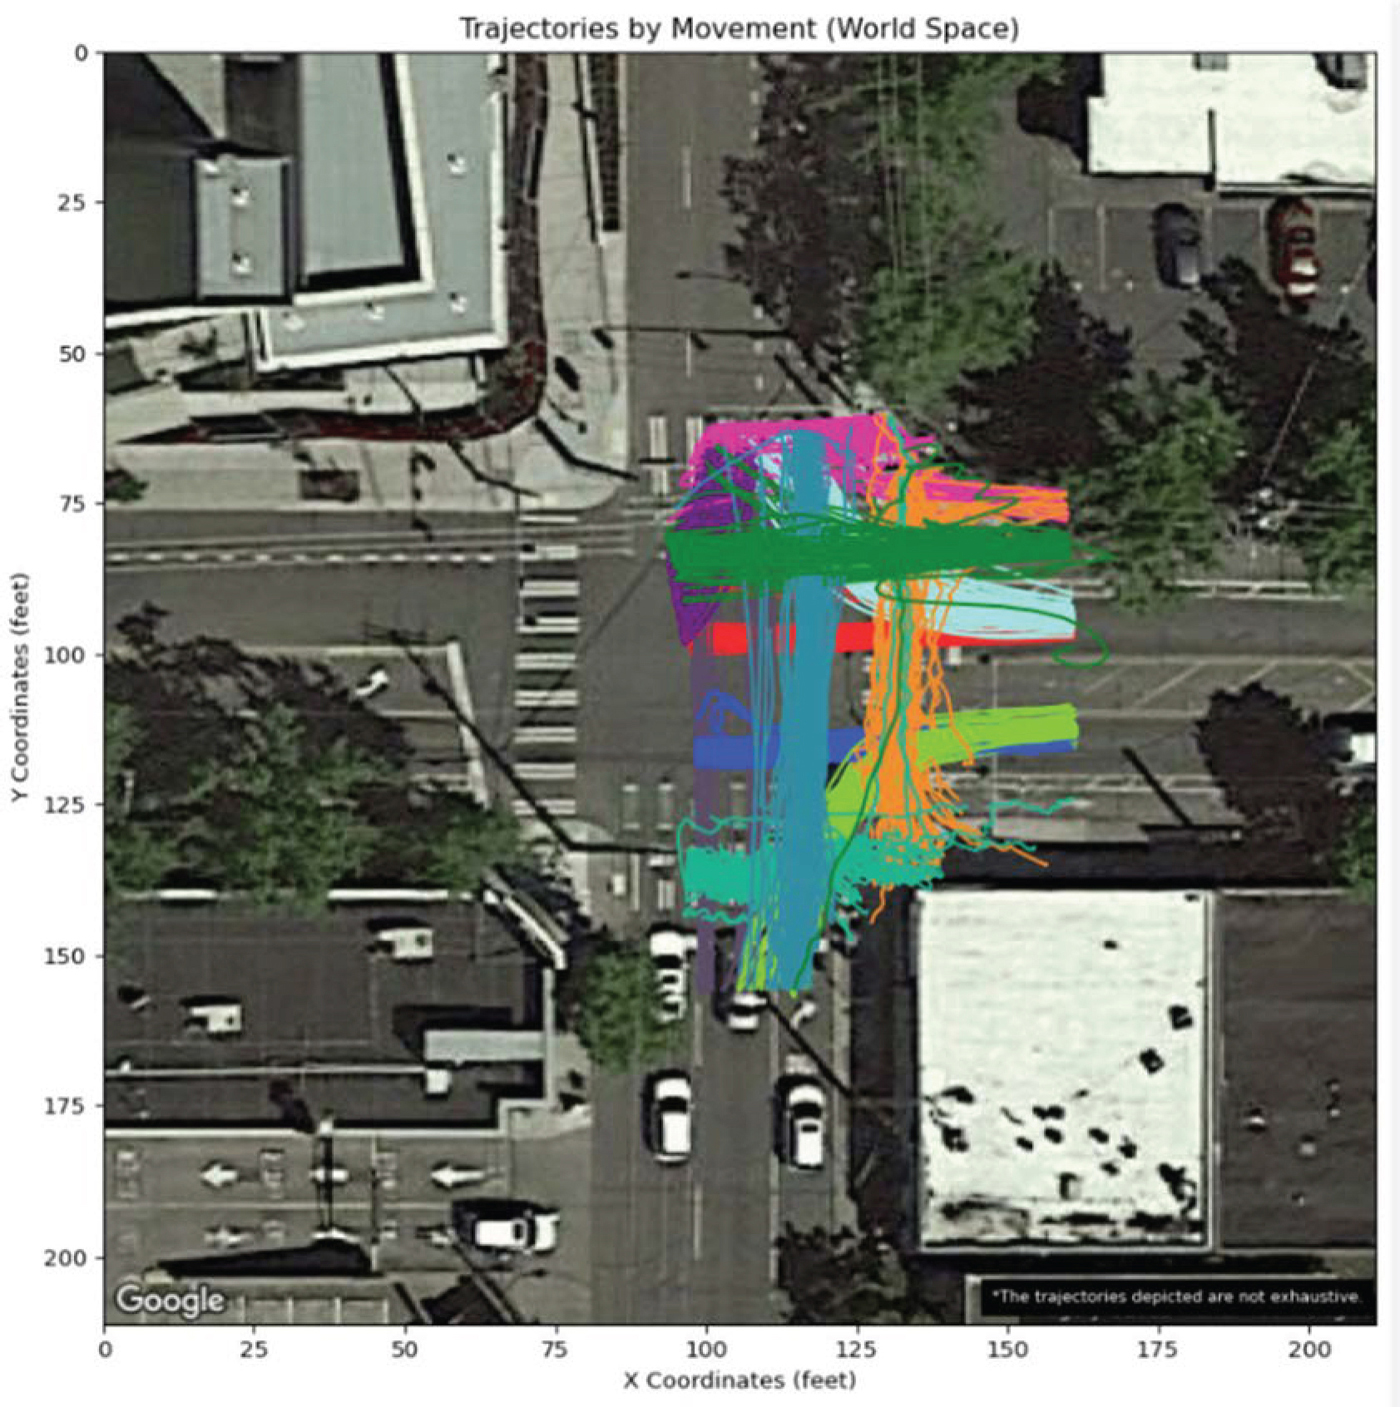
The road user’s data file included all observed road users (including those that were not involved in conflicts) along with their median speed and location. In addition to these files, videos for all conflicts with PETs less than or equal to 2 seconds were provided on the web portal for review. Figure 13 shows a sample visual out from the software mapping the trajectories onto world space. For each site in the video data analysis, similar maps are shown for all locations in the Appendix E: Conflict Analysis Site by Site Graphics.
Data Cleaning and Preparation
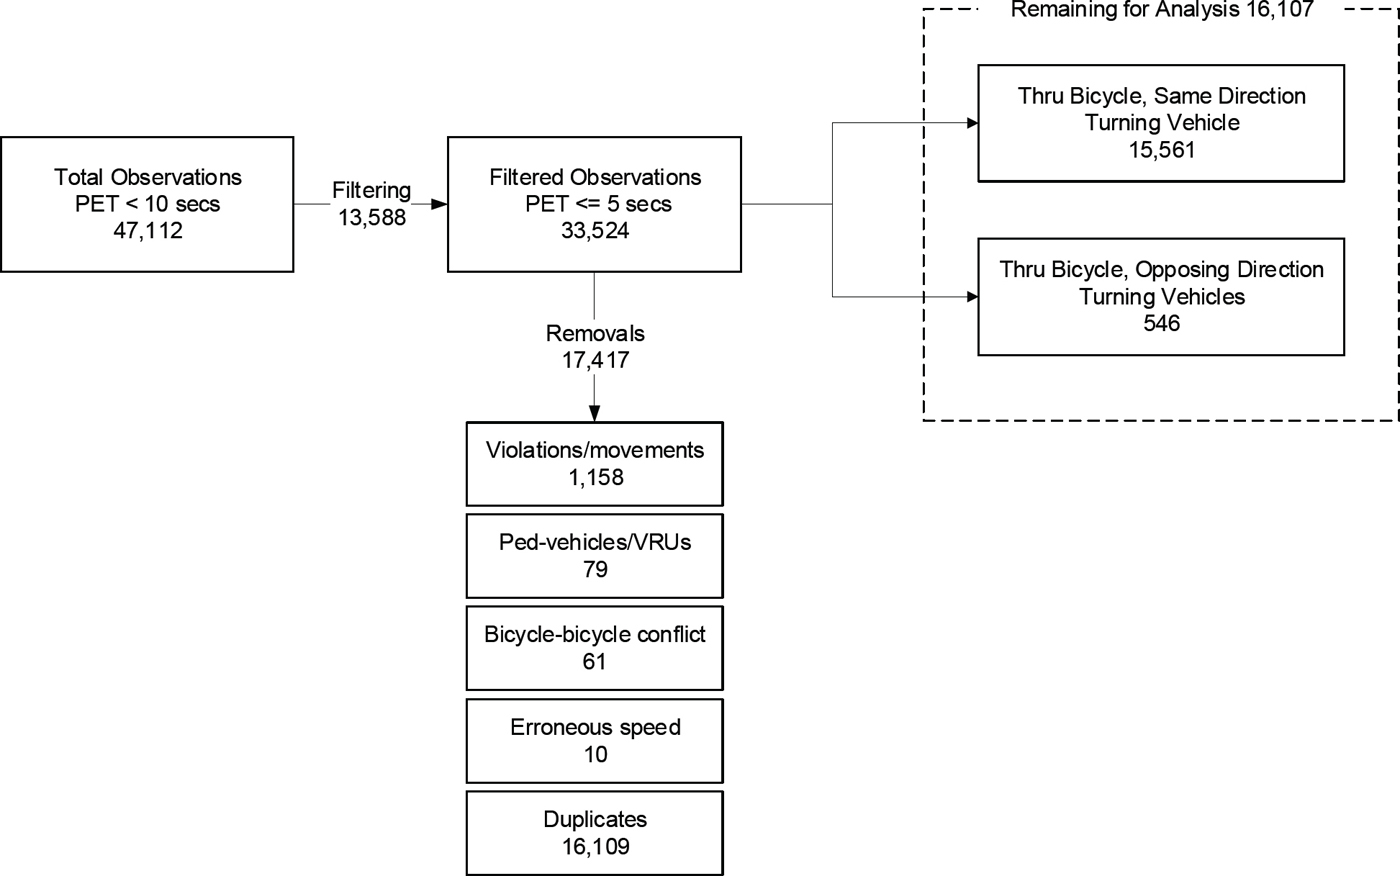
To prepare the data for modeling and analysis, filters were applied to the dataset. Figure 14 presents a flowchart of the data cleaning process. As mentioned, the software identified all PETs <= 10 secs. A total of 47,112 interactions were included. First, all interactions with PETs > 5 seconds were filtered out, leaving 33,524 interactions with PETs >= 5 seconds. Next, observations were removed from analysis as follows:
- 1,158 observations due to violations (bicycles traveling the wrong way) and vehicle turning movements that were not of relevance to the study.
- 79 pedestrian conflicts and vulnerable road user (VRU), which were classified as VRU’s when they were not able to be classified as one of the other user types by the automated software) and motorized vehicle observations.
- 61 bicycle-to-bicycle conflicts.
- 10 erroneous speed observations were removed, including a set of bicycle speeds of 186.41 mi/hr, a vehicle speed of 186.41 mi/h, and a set of bicycle speeds of 80 mi/h.
- 16,109 duplicate observations; specifically, if Road User I ID, Road User II ID and the timestamp were all the same.
This filtering and removal left 16,107 observations for analysis. Of those, there were 15,561 conflicts in the same direction (i.e., right- or left-turning vehicle on the approach conflicting with a through bike on the same approach), and 546 conflicts were observed in the opposing direction (i.e., a right- or left-turning vehicle from the opposing direction conflicting with the bicycle on the approach of interest).
Conflict Thresholds and Severity
PET is the time gap between two intersecting trajectories crossing the same space. However, it is helpful to further refine and categorize the PETs to better describe the interactions. One approach is to define thresholds for the value of PET. Previous research for bicycle-motor vehicle interactions (Zangenehpour et al., 2016, Russo et al., 2020, 2022) has suggested threshold levels are classified as PET ≤ 1.5 sec, 1.5 < PET ≤ 3.0 and 3.0 < PET ≤ 5.0. We have used these thresholds in the descriptive analyses and in filtering the conflicts for modeling purposes. The lower PETs values generally indicate a closer interaction between the two users.
However, PET alone can be insufficient to describe the interaction as a conflict. In the State of the Practice literature review, alterative surrogate safety measures were reviewed that include some characterization or use of speed (e.g. TTC). The vendor’s algorithm is only trained to produce PET observations so any of these other measures are not available. Intuitively, the potential for a conflict measured by PET threshold can be further informed by the vehicle speed in the conflict area. We can classify the conflicts based on vehicle speed and PETs as a proxy for severity potential. Previous research suggests that a threshold value of 9 mi/h is appropriate to classify high and low vehicle speeds with respect to bicycle-motor vehicle crashes/conflicts (Jurewicz, Sobhani, Woolley, Dutschke, & Corben, 2016; Russo et al., 2022,).
In the remainder of this chapter, we apply the severity label for observations with the following combination of PET and vehicles speed in the conflict area:
- High Severity (PET ≤ 1.5 sec and vehicle speed at conflict greater than 9 mi/h).
- Medium Severity (1.5 sec < PET ≤ 3.5 sec and vehicle speed at conflict greater than 9 mi/h).
- Low Severity (3.5 < PET ≤ 5 sec and vehicle speed at conflict greater than 9 mi/h).
Conflict Analysis Methods
To further explore the observed conflicts, conflict frequency and CS models were estimated. These are further described in the following sections. Table 42 summarizes which CS was were used in the two modeling approaches.
Table 42. Summary of CS Used in Modeling Analysis
| Severity Classification | PET and Vehicle Speed Threshold | Count Data Models for Conflict Frequency | Discrete Choice Models for CS |
|---|---|---|---|
| High Severity | PET ≤ 1.5 sec and vehicle speed at conflict greater than 9 mi/h | P, n= 961 | P, n=961 |
| Medium Severity | 1.5 sec < PET ≤ 3.5 sec and vehicle speed at conflict greater than 9 mi/h | – | P, n=2,848 |
| Low Severity | 3.5 < PET < 5 sec and vehicle speed at conflict greater than 9 mi/h | – | P, n= 2,045 |
Count-Data Models for Conflict Frequency
Using the safety events files and the road user movement files provided via Transoft, a series of conflict frequency and CS models were fit. Each row in the road user movement file represented one road user. Other variables that were included in the road user movement file included:
- date,
- ID,
- entry and exit time of the road user in the conflict area,
- road user type,
- median speed in mph, and
- direction of movement.
For conflict frequency, the road user movement files were used to determine hourly volumes during the data collection period, where the number of observations observed for a given hour was used as the hourly volume. Hourly volumes were determined for bicycle and approach turn movements.
Each row in the safety event file represented a conflict between two road users. Other variables in this file included:
- observed PET value,
- date and time of the conflict,
- which road user arrived first at the conflict area,
- details of each road user (ID, movement direction and type),
- conflict and median speed of each road user in miles per hour, and
- the movement scenario (i.e., movement direction of the two conflicting road users).
The safety events files were used to determine the number of conflicts for a given hour. The number of conflicts in an hour is the conflict frequency that was analyzed. Many modeling frameworks and data aggregations were explored. These data were joined to create a single file based on location, date and hour for modeling purposes. For CS, only the safety events files were used and no aggregation was required.
The number of conflicts in a given hour is represented by a non-negative integer value, or a count; as such, the appropriate class of models are count-data models. One challenge with using PET with bicycle-motor vehicle conflicts is that some conflicts that are identified only by low PET times are more similar to the expected user interactions and yielding than a pre-cursor to a crash. Initially, models of all conflicts were explored but the results were difficult to interpret due to the large numbers of observations with PETs < 5 secs. There was greatest interest in the most crash-potential events from a safety perspective. Thus, speed of the vehicle and low PET times were combined and only severe conflicts PET less than or equal to 1.5 sec and vehicle speed greater than 9 mi/h were modeled. The most common count-data model is the Poisson model. In the Poisson model, yi is drawn from a Poisson population with parameter λi, where the model is represented as (Greene, 2018):
| (1) |
where P(yi) is the probability of hour i having yi conflicts and λi is the Poisson parameter for hour i. The Poisson parameter is also equal to the expected number of conflicts, E[yi], in hour i. The Poisson model is estimated by specifying the Poisson parameter as a function of explanatory variables (e.g., bicycle volume, approach turning volume), which then takes the form of a log-linear model:
|
ln(λi) = βXi |
(2) |
or equally:
|
λi = eβXi |
(3) |
where Xi is a vector of explanatory variables and β is vector of parameters to be estimated. The expected number of conflicts in hour i conditional on Xi is then given by:
|
E[yi | Xi] = Var[yi | Xi] = λi = eβXi |
(4) |
Despite the Poisson model being a non-linear regression model, it is easier to estimate parameters using maximum likelihood, where parameters are estimated as:
| (5) |
The Poisson model, however, suffers from a distinct limitation: it is unable to handle over- or under-dispersion. The Poisson model, and the Poisson distribution, operate under the assumption that the mean and variance are equal, E[yi] = Var [yi]. If this equality, or assumption, is found to be untrue, the data being analyzed is considered under-dispersed (E[yi] > Var[yi]) or over-dispersed (E[yi] < Var[yi]). If under-or over-dispersion is present and actions not taken to correct for it, parameter estimates will no longer be unbiased and standard errors will be incorrect. The determination of dispersion can be computed manually but is also a common output from models that account and correct for dispersion, such as the negative binomial model, through the estimation of a dispersion parameter. If the estimated dispersion parameter is statistically significant, the Poisson model is not appropriate. It was determined that for each of the conflict frequency models, the dispersion parameter was not statistically significant (i.e., no significant dispersion); therefore, Poisson models were used.
Discrete Choice Models for Conflict Severity
Two severity analyses were conducted, the first of which considers three severity levels:
- high severity (PET ≤ 1.5 sec and vehicle speed greater than 9 mi/h)
- medium severity (1.5 sec < PET ≤ 3.5 sec and vehicle speed greater than 9 mi/h)
- low severity (3.5 < PET ≤ 5 sec and vehicle speed greater than 9 mi/h).
The second consists of analyzing high severity conflicts alone, such that 1 if high severity conflict (PET ≤ 1.5 sec and vehicle speed greater than 9 mi/h), and 0 otherwise. As defined previously, in addition to considering these PET ranges, vehicle speed was also considered. To summarize, this resulted in the following severity categories:
- High Severity (PET ≤ 1.5 sec and vehicle speed at conflict greater than 9 mi/h).
- Medium Severity (1.5 sec < PET ≤ 3.5 sec and vehicle speed at conflict greater than 9 mi/h).
- Low Severity (3.5 < PET ≤ 5 sec and vehicle speed at conflict greater than 9 mi/h).
Ordered Probit Models
Based on the ordered nature of severity (low severity to high severity), an ordered probit model was chosen to model CS when considering all three severities. In the ordered probit model, an unobservable variable y* is defined as a linear function (Greene, 2018):
|
y* = βX + ε |
(6) |
where X is a vector of explanatory variables (e.g., vehicle category, vehicle speed, user arrival), β is a vector of parameters to be estimated, and ε is an independently randomly distributed disturbance term with mean 0 and variance 1. Utilizing Eq. (10), conflict severities can be represented as observable (Greene, 2018):
| y = 0 if y* ≤ 0 | (Low Severity) | |
| y = 1 if 0 < y* ≤ μ1 | (Medium Severity) | (7) |
| y = 2 if μ1 < y* | (High Severity) |
where µ are the thresholds used to define the ordered conflict severities. During model estimation, µ is estimated simultaneously with β, where integer ordering is used such that J is the highest integer order (i.e., high severity conflict). To determine the probabilities of J, ε is assumed to be normally distributed (mean 0 and variance 1) such that the ordered probabilities are (Greene, 2018):
| (8) | |
with:
| (9) |
where y = 2 is high severity, y = 1 is medium severity, y = 0 is low severity, and Eq. (9) shows the required relationship for the threshold parameters to ensure all probabilities are positive.
To assess the impact of explanatory variable X on severity probability, marginal effects are computed. Marginal effects represent the change in probability due to a one-unit increase in explanatory variable X. For continuous explanatory variables, marginal effects are determined as (Greene, 2018):
| (10) | |
while for indicator variables:
| (11) |
where is the mean of all other variables (i.e., variables are held constant) while indicator Xk changes from zero to one. Ordered probit marginal effects have an inherent difficulty in interpreting interior orders (in this study, y = 1). This results in the analyst not knowing for certain what impact a positive or negative parameter has on this probability, only that it is positive or negative (Washington, Karlaftis, Mannering, & Anastasopoulos, 2020). Therefore, marginal effects are interpreted at the outer orders (high severity and low severity).
Binary Logit Models
For modeling the likelihood of a severe conflict (1 if high severity conflict, 0 otherwise), a binary logit model framework was applied. The binary logit framework follows the form of the logit probability where one of the two outcomes is normalized to zero (Greene, 2018):
| (12) |
where Pn(i) is the probability of observation n having outcome i (high severity conflict), β is a vector of parameters to be estimated, X is a vector of explanatory variables, and εin is a Type I Extreme Value distributed error term. The model is interpreted via marginal effects, where for continuous variables:
| (13) |
where is the derivative of the probability of observation n having CS i. For indicator variables, marginal effects are computed as shown in Eq. (11).
Parameter Transferability
In this work, disaggregate data models by treatment type were applied; that is, a separate conflict frequency and CS model was fit for each treatment type. To determine if separate models by treatment type are appropriate, the following log-likelihood ratio test is applied (Washington et al., 2020):
| (14) |
where LL is the log-likelihood at converge of a model using parameters from the treatment b model on the data for treatment α, LL(βα) is the log-likelihood at convergence of the treatment α model, and χ2 is a chi-square statistics with degrees of freedom equal to the number of estimated parameters in . If χ2 results in statistical significance, the null hypothesis that all treatments should be modeled together in a single model is rejected in favor for the alternative hypothesis that each treatment type should consist of its own model.
Conflict Analysis Results
This section presents the descriptive statistics, conflict frequency and conflict analysis models.
Descriptive Statistics
Table 43 shows the frequency and proportion of conflicts by treatment type where the PET <=5 sec, first presenting it regardless of arrival and then by if the vehicle or bicycle arrived first at the conflict location.
Overall, the highest number of conflicts (10,151) were observed at the protected intersection locations (63% of the total), followed by mixing zone locations (3,201 and 19.9%). This is not surprising, as six of the eight protected intersection sites and three out of five mixing zone sites were in New York City, where the bicycle and vehicle volumes are higher compared to other locations. The lowest number of observed conflicts were observed at the pocket bike lane locations (584, 3.6% of total).
Tabel 44 shows the frequency and proportion of high severity conflicts (PET ≤ 1.5 sec) by treatment type. The proportion among conventional bike lanes remains consistent, while other treatment types have
substantial differences in proportions when considering only high severity conflicts. At separated bike lanes, 75% of high severity conflicts (compared to 40.2% for all severity conflicts) occurred when the vehicle arrived first. Similar changes in proportions are also observed at protected intersections, where 67.6% of high severity conflicts (compared to 50.7% for all severity conflicts) occurred when the vehicle arrived first.
Since PET measures the time difference between the arrival of conflicting vehicles, either the motor vehicle or the bicycle can arrive at the conflict point first. In the broad sense, it can describe which user would need to yield to the other or take action to avoid a collision. Overall, across all treatment types, there was a slightly higher proportion of conflicts where the vehicle arrived first (50.5%). The proportion of conflicts in which the vehicle arrived first was about the same for the separated bike lane and conventional bike lane approaches (40%). The pocket bike lane had the lowest proportion (31.5%) while the mixing zone had nearly 60% of the conflicts with the vehicle arriving first.
Table 43. Number of Conflicts (PET ≤ 5 sec) and Treatment Type
| Treatment | Vehicle Arrived First | % Vehicle Arriving First | Bicycle Arrived First | % Bicycle Arrived First | Total Conflicts | % of Total Conflicts |
|---|---|---|---|---|---|---|
| Conventional Bike Lane | 419 | 41.0% | 604 | 59.0% | 1,023 | 6.4% |
| Pocket Bike Lane | 184 | 31.5% | 400 | 68.5% | 584 | 3.6% |
| Separated Bike Lane | 461 | 40.2% | 687 | 59.8% | 1,148 | 7.1% |
| Mixing Zone | 1,920 | 60.0% | 1,281 | 40.0% | 3,201 | 19.9% |
| Protected Intersection | 5,143 | 50.7% | 5,008 | 49.3% | 10,151 | 63.0% |
| Total | 8,127 | 50.5% | 7,980 | 49.5% | 16,107 | 100.0% |
Table 44. Number of High Severity Conflicts (PET ≤ 1.5 sec) and Treatment Type
| Treatment | Vehicle Arrived First | % Vehicle Arriving First | Bicycle Arrived First | % Bicycle Arrived First | Total Conflicts | % of Total Conflicts |
|---|---|---|---|---|---|---|
| Conventional Bike Lane | 91 | 41.3% | 64 | 58.7% | 155 | 5.2% |
| Pocket / Keyhole Bike Lane | 22 | 20.6% | 85 | 79.4% | 107 | 3.6% |
| Separated Bike Lane | 78 | 75.0% | 26 | 25.0% | 104 | 3.5% |
| Mixing Zone | 546 | 69.9% | 235 | 30.1% | 781 | 26.3% |
| Protected Intersection | 1,233 | 67.6% | 592 | 32.4% | 1,825 | 61.4% |
| Total | 1,970 | 66.3% | 1,002 | 33.7% | 2,972 | 100.0% |
Table 45 shows the frequency of conflicts and exposure by treatment type, location and exposure (i.e., number of through bicycles, number of approach turns and number of oncoming turns). The lowest frequency of conflicts was observed at the pocket or keyhole bike lane locations (n=584), while the highest frequency was observed at the offset/protected intersection locations (n=10,151). The offset/protected intersection sites were primarily located in New York City where observed bicycle volumes were much higher compared to locations at other treatment types as seen in Table 45.
Table 45. Total Frequency of Conflicts and Exposure Measures by treatment type and location
| Treatment Type | Location | City | Freq. | Total Exposures | Hourly Through Bicycle Volume | Hourly Approach Turning Volume | Hourly Oncoming Turning Volume | ||||||||
|---|---|---|---|---|---|---|---|---|---|---|---|---|---|---|---|
| Through Bicycles | Approach Turns | Oncoming Turns | Avg. | Min | Max | Avg. | Mir | Max | Avg | Min | Max | ||||
| Convention al Bike Lane | Dean Keeton St and Guadalupe St | AUS | 228 | 257 | 8,242 | 0 | 6 | 0 | 15 | 179 | 33 | 324 | 0 | 0 | 0 |
| E MLK Jr Blvd and Trinity St | AUS | 36 | 53 | 2,560 | 904 | 2 | 0 | 6 | 91 | 21 | 195 | 32 | 13 | 79 | |
| 28th St E and Park Ave S | MSP | 348 | 816 | 7,791 | 0 | 11 | 1 | 40 | 108 | 33 | 198 | 0 | 0 | 0 | |
| 6th Ave and Blanchard St | SEA | 370 | 588 | 14,139 | 0 | 6 | 0 | 21 | 133 | 20 | 213 | 0 | 0 | 0 | |
| Yesler Way and 12th Ave | SEA | 41 | 180 | 769 | 0 | 8 | 0 | 14 | 32 | 17 | 47 | 0 | 0 | 0 | |
| Pocket / Keyhole Bike Lane | Guadalupe St and W 38th St | AUS | 48 | 84 | 4,095 | 0 | 2 | 0 | 5 | 108 | 31 | 154 | 0 | 0 | 0 |
| Hennepin Ave and S 1st St | MSP | 393 | 948 | 10,411 | 0 | 13 | 1 | 29 | 147 | 73 | 232 | 0 | 0 | 0 | |
| S 11th St and Lasalle Ave | MSP | 56 | 195 | 1,046 | 0 | 5 | 0 | 14 | 26 | 8 | 67 | 0 | 0 | 0 | |
| 7th Ave S and Dearborn St | SEA | 75 | 155 | 5,277 | 0 | 3 | 0 | 15 | 108 | 16 | 166 | 0 | 0 | 0 | |
| NE 75th St and Roosevelt Way NE | SEA | 12 | 18 | 2,193 | 0 | 1 | 0 | 2 | 91 | 70 | 128 | 0 | 0 | 0 | |
| Separated Bike Lane | Bouldin Ave and Barton Springs Rd | AUS | 80 | 1,597 | 480 | 320 | 59 | 3 | 198 | 18 | 0 | 64 | 12 | 0 | 46 |
| Congress Ave and Woodward St | AUS | 203 | 310 | 7,545 | 4,336 | 6 | 0 | 13 | 154 | 30 | 217 | 88 | 28 | 140 | |
| 12th Ave NE and NE 65th St | SEA | 207 | 691 | 4,712 | 3,620 | 8 | 1 | 19 | 54 | 11 | 88 | 42 | 11 | 93 | |
| 7th Ave S and Stewart St | SEA | 564 | 2,762 | 4,689 | 0 | 26 | 4 | 75 | 45 | 13 | 73 | 0 | 0 | 0 | |
| Roosevelt Way NE and NE 65th St | SEA | 94 | 410 | 4,146 | 3,394 | 6 | 0 | 17 | 62 | 16 | 100 | 51 | 20 | 95 | |
| Treatment Type | Location | City | Freq. | Total Exposures | Hourly Through Bicycle Volume | Hourly Approach Turning Volume | Hourly Oncoming Turning Volume | ||||||||
|---|---|---|---|---|---|---|---|---|---|---|---|---|---|---|---|
| Mixing Zone | 26th St E and Park Ave S | MSP | 121 | 198 | 8,806 | 0 | 3 | 0 | 10 | 149 | 41 | 280 | 0 | 0 | 0 |
| 6th Ave and W 21st St | NYC | 1,421 | 13,392 | 5,051 | 0 | 209 | 31 | 364 | 79 | 10 | 107 | 0 | 0 | 0 | |
| E 37th St and 1st Ave | NYC | 1,601 | 12,213 | 10,599 | 0 | 182 | 29 | 362 | 158 | 34 | 319 | 0 | 0 | 0 | |
| Linden Blvd and Fountain Ave | NYC | 21 | 66 | 1,697 | 0 | 3 | 1 | 8 | 71 | 25 | 104 | 0 | 0 | 0 | |
| Harrison St and Dexter Ave N | SEA | 37 | — | — | — | ||||||||||
| Offset/Protected Intersection | Congress Ave and E 3rd St | AUS | 270 | 1,559 | 1,806 | 857 | 29 | 4 | 61 | 33 | 8 | 58 | 16 | 0 | 44 |
| 1st Ave and E 11th St | NYC | 3,721 | 16,528 | 3,756 | 0 | 236 | 17 | 410 | 54 | 15 | 107 | 0 | 0 | 0 | |
| 2nd Ave and E 22nd St | NYC | 1,911 | 19,445 | 1,737 | 0 | 295 | 80 | 639 | 26 | 3 | 73 | 0 | 0 | 0 | |
| 4th Ave and 3rd St | NYC | 465 | 6,370 | 1,699 | 0 | 91 | 19 | 156 | 24 | 4 | 42 | 0 | 0 | 0 | |
| 9th St and 6th Ave (EB) | NYC | 410 | 3,411 | 1,952 | 1,308 | 46 | 7 | 108 | 26 | 0 | 55 | 18 | 3 | 61 | |
| 9th St and 6th Ave (WB) | NYC | 278 | 3,369 | 1,007 | 1,146 | 49 | 9 | 91 | 15 | 1 | 31 | 17 | 1 | 43 | |
| E 10th St and 2nd Ave | NYC | 2,958 | 19,190 | 4,581 | 0 | 263 | 15 | 702 | 63 | 16 | 107 | 0 | 0 | 0 | |
| Dexter Ave N and Aloha St | SEA | 138 | 1,526 | 910 | 372 | 31 | 4 | 105 | 18 | 4 | 41 | 7 | 1 | 16 | |
Table 46 shows the frequency of conflicts by city and treatment type. The highest number of conflicts were observed in New York City (79.4%) at the protected intersection and mixing zone locations at least partly due to higher volumes. Seattle had the second highest proportion of conflicts (9.5%), followed by Minneapolis (5.7%) and Austin (5.4%).
Table 46. Conflicts by treatment type and city
| City | Convent. Bike Lane | Pocket/Keyhole Bike Lane | Separated Bike Lane | Mixing Zone | Protected Intersection | Total |
|---|---|---|---|---|---|---|
| Frequency | ||||||
| Austin | 264 | 48 | 283 | — | 270 | 865 |
| Minneapolis | 348 | 449 | — | 121 | 918 | |
| New York City | — | — | — | 3,043 | 9,743 | 12,786 |
| Seattle | 411 | 87 | 865 | 37 | 138 | 1,538 |
| Total | 1,023 | 584 | 1,148 | 3,201 | 10,151 | 16,107 |
| Percentage of Total | ||||||
| Austin | 25.8% | 8.2% | 24.7% | — | 2.7% | 5.4% |
| Minneapolis | 34.0% | 76.9% | — | 3.8% | 5.7% | |
| New York City | — | — | — | 95.1% | 96.0% | 79.4% |
| Seattle | 40.2% | 14.9% | 75.3% | 1.2% | 1.4% | 9.5% |
| Total | 6.4% | 3.6% | 7.1% | 19.9% | 63.0% | 100% |
Table 47 shows a distribution of conflicts based on PET thresholds (PET ≤ 1.5 sec, 1.5 < PET ≤ 3.0, and 3.0 < PET ≤ 5.0. Mean PETs by treatment type are also shown in Table 47 with the values ranging between 2.66 sec for mixing zones and 3.17 sec for separated bike lane locations. Of all the conflicts observed across the treatment types, the highest proportion were conflicts where PET was between 1.5 and 3.0 sec (47.0%), followed by conflicts where PET was between 3.0 and 5.0 sec (34.5%). Overall, 18.5% of all conflicts had PETs less than or equal to 1.5 sec.
Within each treatment type also, higher proportions of conflicts were observed with PETs greater than 1.5 sec and less than or equal to 5 sec. For conflicts with PETs less than or equal to 1.5 sec, the largest proportion was observed at the mixing zone locations (24.4%) followed by pocket or keyhole bike lane locations (18.3%), with the separated bike locations showing the lowest proportion (9.1%). Figure 15 shows a plot of the mean PET by intersection treatment type, with separated bike lane facilities having the highest and mixing zones the lowest observed mean PET.
Table 48 shows the distribution of conflicts by location, city, treatment type and PET. Across all treatment types, the highest proportion of conflicts were those with PETs greater than 1.5 sec, which have lower propensity for crashes. The highest proportion of conflicts with PETs less than or equal to 1.5 sec were observed at the mixing zone locations (24.4%), followed by pocket/keyhole bike lane locations (18.3%).
In addition to PETs, vehicle speeds were also extracted during the video processing. Vehicle speed is a key contributor to crash severity. Table 49 shows the vehicle speeds descriptive statistics at conflict areas by treatment type and location. Across cities, average turning vehicle speeds at the pocket/keyhole bike
lane locations (14.61 mi/hr) and bike lane (10.25 mi/hr) were observed to be higher, while speeds at the protected intersection (7.90 mi/hr) and mixing zone (7.27 mi/hr) locations were the lowest among the treatment locations. Figure 16 shows the plot of mean vehicle speeds at conflicts points at each site, while Figure 17 shows the mean and 85th percentile speed (mi/h) at the conflict point by treatment type. Figure 18 shows the plots of speed vs. PET for the various treatment types.
Table 47. Frequency and Percentage of Conflicts by Treatment Type and PET Thresholds
| Treatment | Mean PET (sec) | Conflicts with PET <= 1.5 sec | Conflicts with 1.5 sec < PET <= 3.5 sec | Conflicts with 3.5 sec < PET <= 5.0 sec | Total Conflicts (PET <= 5 sec) |
|---|---|---|---|---|---|
| Conventional Bike Lane | 2.90 | 155 (15.2%) | 531 (51.9%) | 337 (32.9%) | 1,023 (100.0%) |
| Pocket / Keyhole Bike Lane | 2.88 | 107 (18.3%) | 264 (45.2%) | 213 (36.5%) | 584 (100.0%) |
| Separated Bike Lane | 3.17 | 104 (9.1%) | 558 (48.6%) | 486 (42.3%) | 1,148 (100.0%) |
| Mixing Zone | 2.66 | 781 (24.4%) | 1,395 (43.6%) | 1,025 (32.0%) | 3,201 (100.0%) |
| Protected Intersection | 2.83 | 1,825 (18.0%) | 4,829 (47.6%) | 3,497 (34.4%) | 10,151 (100.0%) |
| Total Combined (%) | 2.83 | 2,972 (18.5%) | 7,577 (47.0%) | 5,558 (34.5%) | 16,107 (100%) |
Table 48. Number of Conflicts by Location, City, Treatment Type and PET
| Treatment Type | Location | City | Mean PET (sec) | Conflicts with PET <= 1.5 sec | Conflicts with 1.5 sec < PET <= 3.5 sec | Conflicts with 3.5 sec < PET <= 5.0 sec | Total Conflicts (PET <= 5 sec) |
|---|---|---|---|---|---|---|---|
| Conventional Bike Lane | Dean Keeton St and Guadalupe St | Austin | 2.83 | 45 (19.7%) | 110 (48.2%) | 73 (32.0%) | 228 |
| E MLK Jr Blvd and Trinity St | Austin | 3.03 | 7 (19.4%) | 14 (38.9%) | 15 (41.7%) | 36 | |
| 28th St E and Park Ave S | Minneapolis | 2.88 | 46 (13.2%) | 193 (55.5%) | 109 (31.3%) | 348 | |
| 6th Ave and Blanchard St | Seattle | 2.99 | 45 (12.2%) | 195 (52.7%) | 130 (35.1%) | 370 | |
| Yesler Way and 12th Ave | Seattle | 2.49 | 12 (29.3%) | 19 (46.3%) | 10 (24.4%) | 41 | |
| Total | 2.90 | 155 (15.2%) | 531 (51.9%) | 337 (32.9%) | 1023 | ||
| Pocket / Keyhole Bike Lane | Guadalupe St and W 38th St | Austin | 2.89 | 3 (6.3%) | 30 (62.5%) | 15 (31.3%) | 48 |
| Hennepin Ave and S 1st St | Minneapolis | 2.85 | 82 (20.9%) | 164 (41.7%) | 147 (37.4%) | 393 | |
| S 11th St and Lasalle Ave | Minneapolis | 3.14 | 7 (12.5%) | 26 (46.4%) | 23 (41.1%) | 56 | |
| 7th Ave S and Dearborn St | Seattle | 2.81 | 12 (16.0%) | 39 (52.0%) | 24 (32.0%) | 75 | |
| NE 75th St and Roosevelt Way NE | Seattle | 2.71 | 3 (25.0%) | 5 (41.7%) | 4 (33.3%) | 12 | |
| Total | 2.88 | 107 (18.3%) | 264 (45.2%) | 213 (36.5%) | 584 | ||
| Separated Bike Lane | Bouldin Ave and Barton Springs Rd | Austin | 3.23 | 3 (3.8%) | 43 (53.8%) | 34 (42.5%) | 80 |
| Congress Ave and Woodward St | Austin | 3.20 | 19 (9.4%) | 97 (47.8%) | 87 (42.9%) | 203 | |
| 12th Ave NE and NE 65th St | Seattle | 2.96 | 21 (10.1%) | 121 (58.5%) | 65 (31.4%) | 207 | |
| 7th Ave S and Stewart St | Seattle | 3.26 | 50 (8.9%) | 250 (44.3%) | 264 (46.8%) | 564 | |
| Roosevelt Way NE and NE 65th St | Seattle | 3.02 | 11 (11.7%) | 47 (50.0%) | 36 (38.3%) | 94 | |
| Total | 3.17 | 104 (9.1%) | 558 (48.6%) | 486 (42.3%) | 1,148 | ||
| Mixing Zone | 26th St E and Park Ave S | Minneapolis | 3.00 | 15 (12.4%) | 56 (46.3%) | 50 (41.3%) | 121 |
| 6th Ave and W 21st St | New York City | 2.66 | 331 (23.3%) | 650 (45.7%) | 440 (31.0%) | 1,421 | |
| E 37th St and 1st Ave | New York City | 2.64 | 425 (26.5%) | 660 (41.2%) | 516 (32.2%) | 1,601 | |
| Linden Blvd and Fountain Ave | New York City | 2.25 | 6 (28.6%) | 10 (47.6%) | 5 (23.8%) | 21 |
| Harrison St and Dexter Ave N | Seattle | 2.92 | 4 (10.8%) | 19 (51.4%) | 14 (37.8%) | 37 | |
| Total | 2.66 | 781 (24.4%) | 1395 (43.6%) | 1025 (32.0%) | 3,201 | ||
| Offset/Protected Intersection | Congress Ave and E 3rd St | Austin | 3.15 | 30 (11.1%) | 128 (47.4%) | 112 (41.5%) | 270 |
| 1st Ave and E 11th St | New York City | 2.67 | 832 (22.4%) | 1,764 (47.4%) | 1,125 (30.2%) | 3,721 | |
| 2nd Ave and E 22nd St | New York City | 2.97 | 230 (12.0%) | 975 (51.0%) | 706 (36.9%) | 1,911 | |
| 4th Ave and 3rd St | New York City | 2.82 | 76 (16.3%) | 236 (50.8%) | 153 (32.9%) | 465 | |
| 9th St and 6th Ave (EB) | New York City | 2.89 | 54 (13.2%) | 219 (53.4%) | 137 (33.4%) | 410 | |
| 9th St and 6th Ave (WB) | New York City | 3.11 | 36 (12.9%) | 117 (42.1%) | 125 (45.0%) | 278 | |
| E 10th St and 2nd Ave | New York City | 2.87 | 544 (18.4%) | 1,328 (44.9%) | 1,086 (36.7%) | 2,958 | |
| Dexter Ave N and Aloha St | Seattle | 2.97 | 23 (16.7%) | 62 (44.9%) | 53 (38.4%) | 138 | |
| Total | 2.83 | 1825 (18.0%) | 4829 (47.6%) | 3497 (34.4%) | 10,151 |
Table 49. Vehicle Speed at Conflict Point by Treatment Type and Location (mi/h)
| Treatment | Location | City | Number of Observations | Mean | Median | PDF Peak | 85th Speed | Max Speed |
|---|---|---|---|---|---|---|---|---|
| Conventional Bike Lane | Dean Keeton St and Guadalupe St | Austin | 228 | 9.52 | 10.15 | 10.92 | 12.38 | 18.20 |
| E MLK Jr Blvd and Trinity St | Austin | 36 | 11.88 | 11.50 | 11.93 | 14.85 | 22.48 | |
| 28th St E and Park Ave S | Minneapolis | 348 | 10.53 | 10.58 | 10.17 | 13.12 | 17.88 | |
| 6th Ave and Blanchard St | Seattle | 370 | 10.28 | 10.41 | 11.43 | 13.65 | 23.67 | |
| Yesler Way and 12th Ave | Seattle | 41 | 10.35 | 10.40 | 10.57 | 11.85 | 13.27 | |
| Total | 1,023 | 10.25 | 10.49 | 10.60 | 13.14 | 23.67 | ||
| Pocket / Keyhole Bike Lane | Guadalupe St and W 38th St | Austin | 48 | 16.29 | 16.16 | 21.79 | 23.43 | 31.04 |
| Hennepin Ave and S 1st St | Minneapolis | 393 | 14.37 | 14.34 | 12.54 | 19.24 | 31.14 | |
| S 11th St and Lasalle Ave | Minneapolis | 56 | 13.14 | 13.13 | 12.81 | 17.94 | 22.01 | |
| 7th Ave S and Dearborn St | Seattle | 75 | 15.61 | 15.12 | 14.30 | 19.90 | 25.55 | |
| NE 75th St and Roosevelt Way NE | Seattle | 12 | 16.14 | 16.76 | 17.80 | 21.31 | 21.54 | |
| Total | 584 | 14.61 | 14.54 | 13.07 | 19.56 | 31.14 |
| Separated Bike Lane | Bouldin Ave and Barton Springs Rd | Austin | 80 | 11.14 | 11.26 | 11.05 | 14.40 | 19.22 |
| Congress Ave and Woodward St | Austin | 203 | 13.46 | 13.36 | 13.09 | 16.19 | 22.21 | |
| 12th Ave NE and NE 65th St | Seattle | 207 | 10.54 | 10.64 | 10.58 | 13.23 | 18.73 | |
| 7th Ave S and Stewart St | Seattle | 564 | 7.85 | 7.84 | 5.25 | 11.09 | 18.60 | |
| Roosevelt Way NE and NE 65th St | Seattle | 94 | 10.13 | 10.32 | 10.70 | 12.15 | 17.36 | |
| Total | 1,148 | 9.74 | 9.92 | 10.23 | 13.28 | 22.21 | ||
| Mixing Zone | 26th St E and Park Ave S | Minneapolis | 121 | 9.36 | 10.48 | 11.57 | 13.56 | 22.00 |
| 6th Ave and W 21st St | New York City | 1,421 | 6.67 | 5.93 | 3.37 | 10.66 | 38.04 | |
| E 37th St and 1st Ave | New York City | 1,601 | 7.61 | 6.77 | 5.51 | 11.76 | 41.63 | |
| Linden Blvd and Fountain Ave | New York City | 21 | 10.58 | 6.92 | 5.17 | 18.95 | 33.69 | |
| Harrison St and Dexter Ave N | Seattle | 37 | 6.85 | 6.49 | 6.46 | 7.69 | 15.28 | |
| Total | 3,201 | 7.27 | 6.48 | 5.44 | 1135 | 41.63 | ||
| Offset/Protected Intersection | Congress Ave and E 3rd St | Austin | 270 | 12.22 | 12.17 | 12.61 | 16.19 | 26.79 |
| 1st Ave and E 11th St | New York City | 3,721 | 6.91 | 7.13 | 7.61 | 8.87 | 35.98 | |
| 2nd Ave and E 22nd St | New York City | 1,911 | 7.59 | 7.46 | 7.87 | 9.48 | 63.49 | |
| 4th Ave and 3rd St | New York City | 465 | 8.38 | 8.35 | 9.07 | 10.89 | 17.76 | |
| 9th St and 6th Ave (EB) | New York City | 410 | 9.46 | 9.53 | 9.57 | 12.31 | 16.77 | |
| 9th St and 6th Ave (WB) | New York City | 278 | 8.89 | 8.91 | 8.91 | 11.93 | 17.19 | |
| E 10th St and 2nd Ave | New York City | 2,958 | 8.52 | 8.54 | 8.49 | 11.74 | 26.88 | |
| Dexter Ave N and Aloha St | Seattle | 138 | 8.75 | 8.55 | 8.64 | 11.13 | 19.11 | |
| Total | 10,151 | 7.90 | 7.72 | 7.74 | 10.61 | 63.49 |
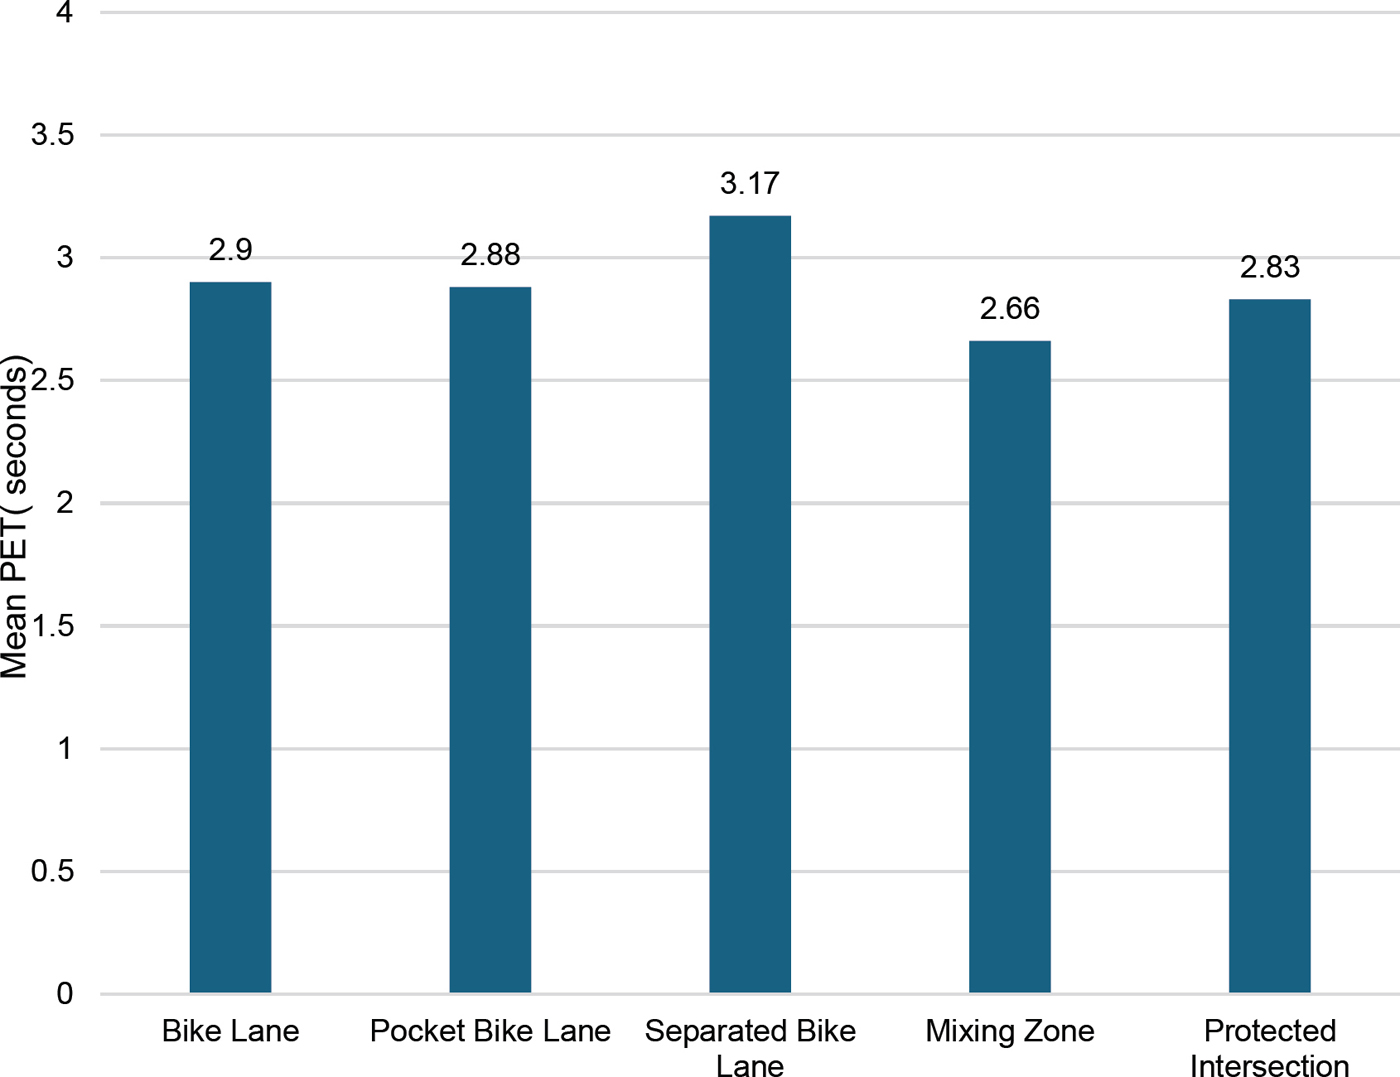
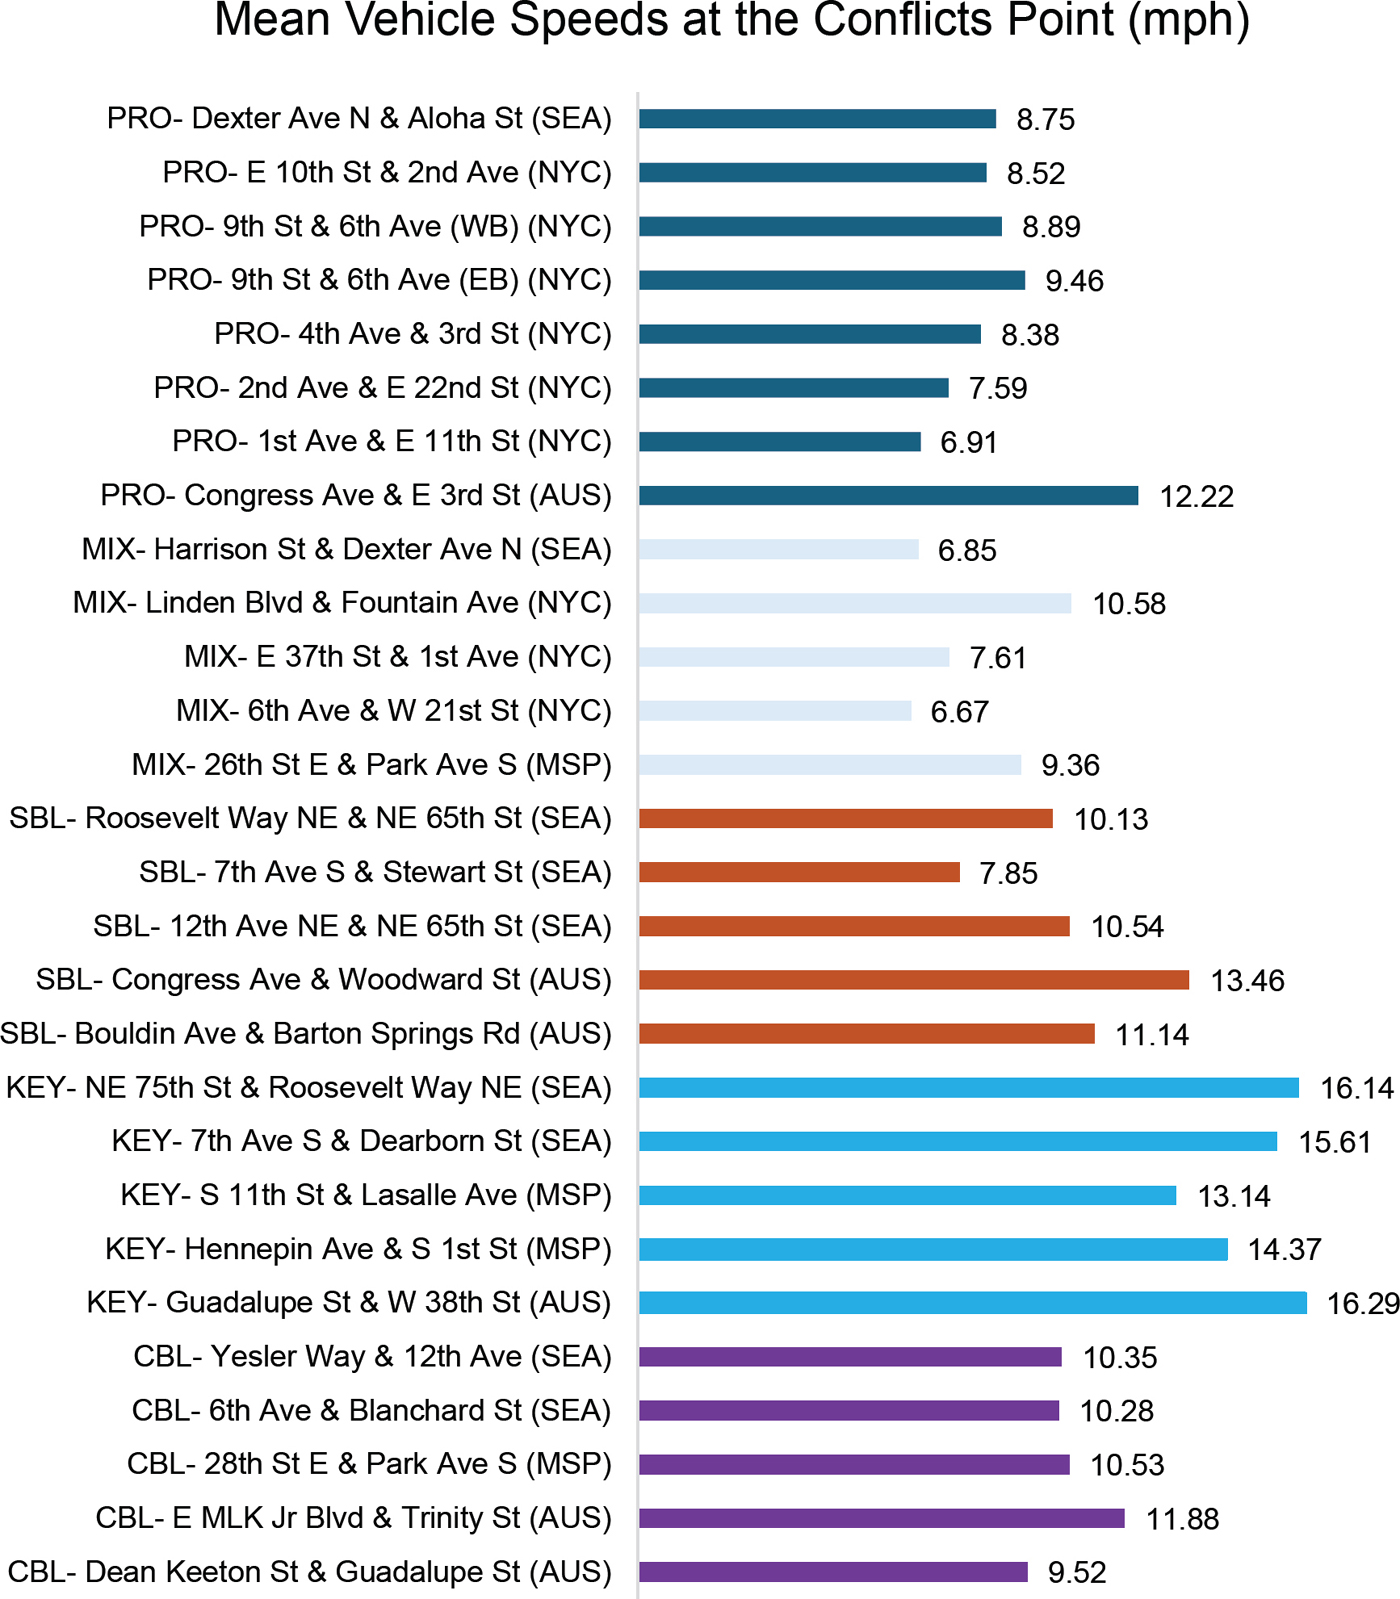
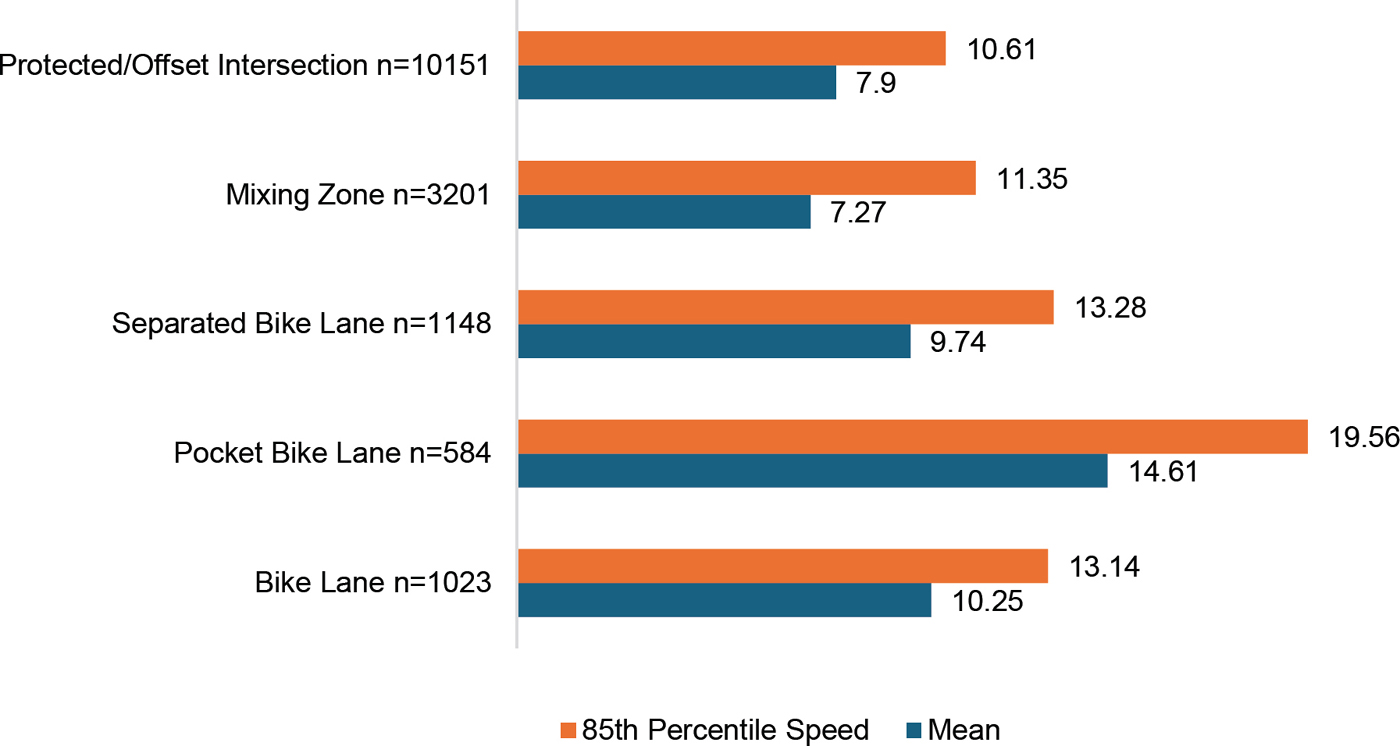

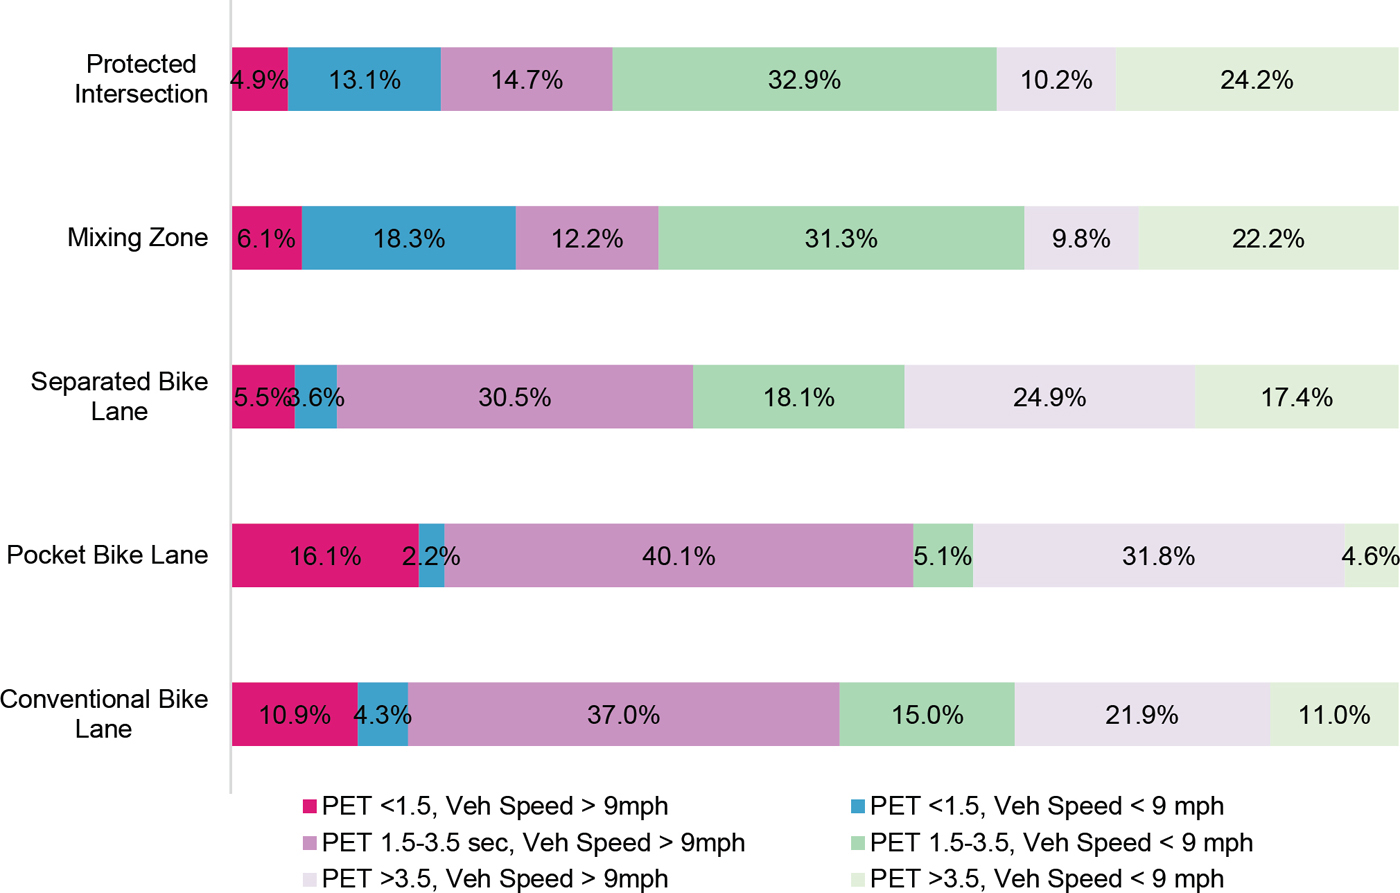
Table 50 shows the distribution of conflicts by treatment type, severity and speed. Conflicts with PETs < 1.5 sec and high vehicle speeds are likely to be the most severe and within this category, protected intersection locations had the lowest proportion (4.9%), followed by the separated bike lane locations (5.5%). Figure 19 shows the observed proportions of conflicts by severity and treatment type. For each treatment type, the figure shows the percentage of each PET and vehicle speed category that is shown in the bottom half of Table 50. The stacked bar figure allows visual comparison of the distribution of the PET and vehicle speed combinations.
Table 50. Frequency and proportion of conflicts by treatment type, PET and vehicle speed
| Treatment | Conflicts (PET <= 1.5 sec) | Conflicts (1.5 sec < PET <= 3.5 sec) | Conflicts (3.5 sec < PET <= 5.0 sec) | |||
|---|---|---|---|---|---|---|
| High Vehicle Speed >= 9 mi/h | Low Vehicle Speed < 9 mi/h | High Vehicle Speed >= 9 mi/h | Low Vehicle Speed < 9 mi/h | High Vehicle Speed >= 9 mi/h | Low Vehicle Speed < 9 mi/h | |
| Frequency | ||||||
| Conventional Bike Lane | 111 | 44 | 378 | 153 | 224 | 113 |
| Pocket / Keyhole Bike Lane | 94 | 13 | 234 | 30 | 186 | 27 |
| Separated Bike Lane | 63 | 41 | 350 | 208 | 286 | 200 |
| Mixing Zone | 196 | 585 | 392 | 1,003 | 313 | 712 |
| Protected Intersection | 497 | 1,328 | 1,494 | 3,335 | 1,036 | 2,461 |
| Total | 961 | 2,011 | 2,848 | 4,729 | 2,045 | 3,513 |
| Percentage of Total for Each Treatment | ||||||
| Conventional Bike Lane | 10.9% | 4.3% | 37.0% | 15.0% | 21.9% | 11.0% |
| Pocket / Keyhole Bike Lane | 16.1% | 2.2% | 40.1% | 5.1% | 31.8% | 4.6% |
| Separated Bike Lane | 5.5% | 3.6% | 30.5% | 18.1% | 24.9% | 17.4% |
| Mixing Zone | 6.1% | 18.3% | 12.2% | 31.3% | 9.8% | 22.2% |
| Protected Intersection | 4.9% | 13.1% | 14.7% | 32.9% | 10.2% | 24.2% |
| Total | 6.0% | 12.5% | 17.7% | 29.4% | 12.7% | 21.8% |
Parameter Transferability Results
Table 51 and Table 52 show the parameter transferability results for the conflict frequency models and the CS models. For the severity models, the binary logit specifications were used for the transferability test. The tables show the chi-square statistic and degrees of freedom, each which indicate with at least 90% confidence that separate treatment type models are the appropriate approach; that is, the null hypothesis that parameters are not different across model types is rejected. Based on the results of this test, conflict frequency and CS results are presented and discussed by treatment type model.
Table 51. Transferability Test for Conflict Frequency Models
| Treatment Type | Conventional Bike Lane | Pocket / Keyhole Bike Lane | Separated Bike Lane | Protected Intersection | Mixing Zone |
|---|---|---|---|---|---|
| Conventional Bike Lane | — | 22.19 (2) | 29.97 (2) | 40.04 (2) | 64.75 (2) |
| Pocket Bike Lane | 14.74 (2) | — | 50.45 (2) | 62.31 (2) | 101.64 (2) |
| Separated Bike Lane | 478.59 (2) | 1,240.39 (2) | — | 4.81 (2) | 7.41 (2) |
| Protected Intersection | 1,775.99 (2) | 2,904.88 (2) | 1,978.15 (2) | — | 77.64 (2) |
| Mixing Zone | 1,848.98 (2) | 4,020.96 (2) | 81.77 (2) | 124.96 (2) | — |
Table 52. Transferability Test for Conflict Severity Models
| Treatment Type | Conventional Bike Lane | Pocket / Keyhole Bike Lane | Separated Bike Lane | Protected Intersection | Mixing Zone |
|---|---|---|---|---|---|
| Conventional Bike Lane | — | 353.60 (3) | 54.23 (4) | 9.68 (4) | 5.96 (3) |
| Pocket Bike Lane | 9.44 (3) | — | 23.08 (3) | 11.20 (3) | 7.76 (3) |
| Separated Bike Lane | 48.46 (4) | 227.19 (3) | — | 29.54 (4) | 37.94 (3) |
| Protected Intersection | 75.80 (4) | 1,702.46 (3) | 198.68 (4) | — | 56.81 (4) |
| Mixing Zone | 22.39 (3) | 1,652.00 (3) | 152.58 (3) | 26.01 (4) | — |
Conflict Frequency Analysis Results
As a reminder, only severe conflicts with PET less than or equal to 1.5 sec and vehicle speed greater than 9 mi/h were modeled in the frequency count models.
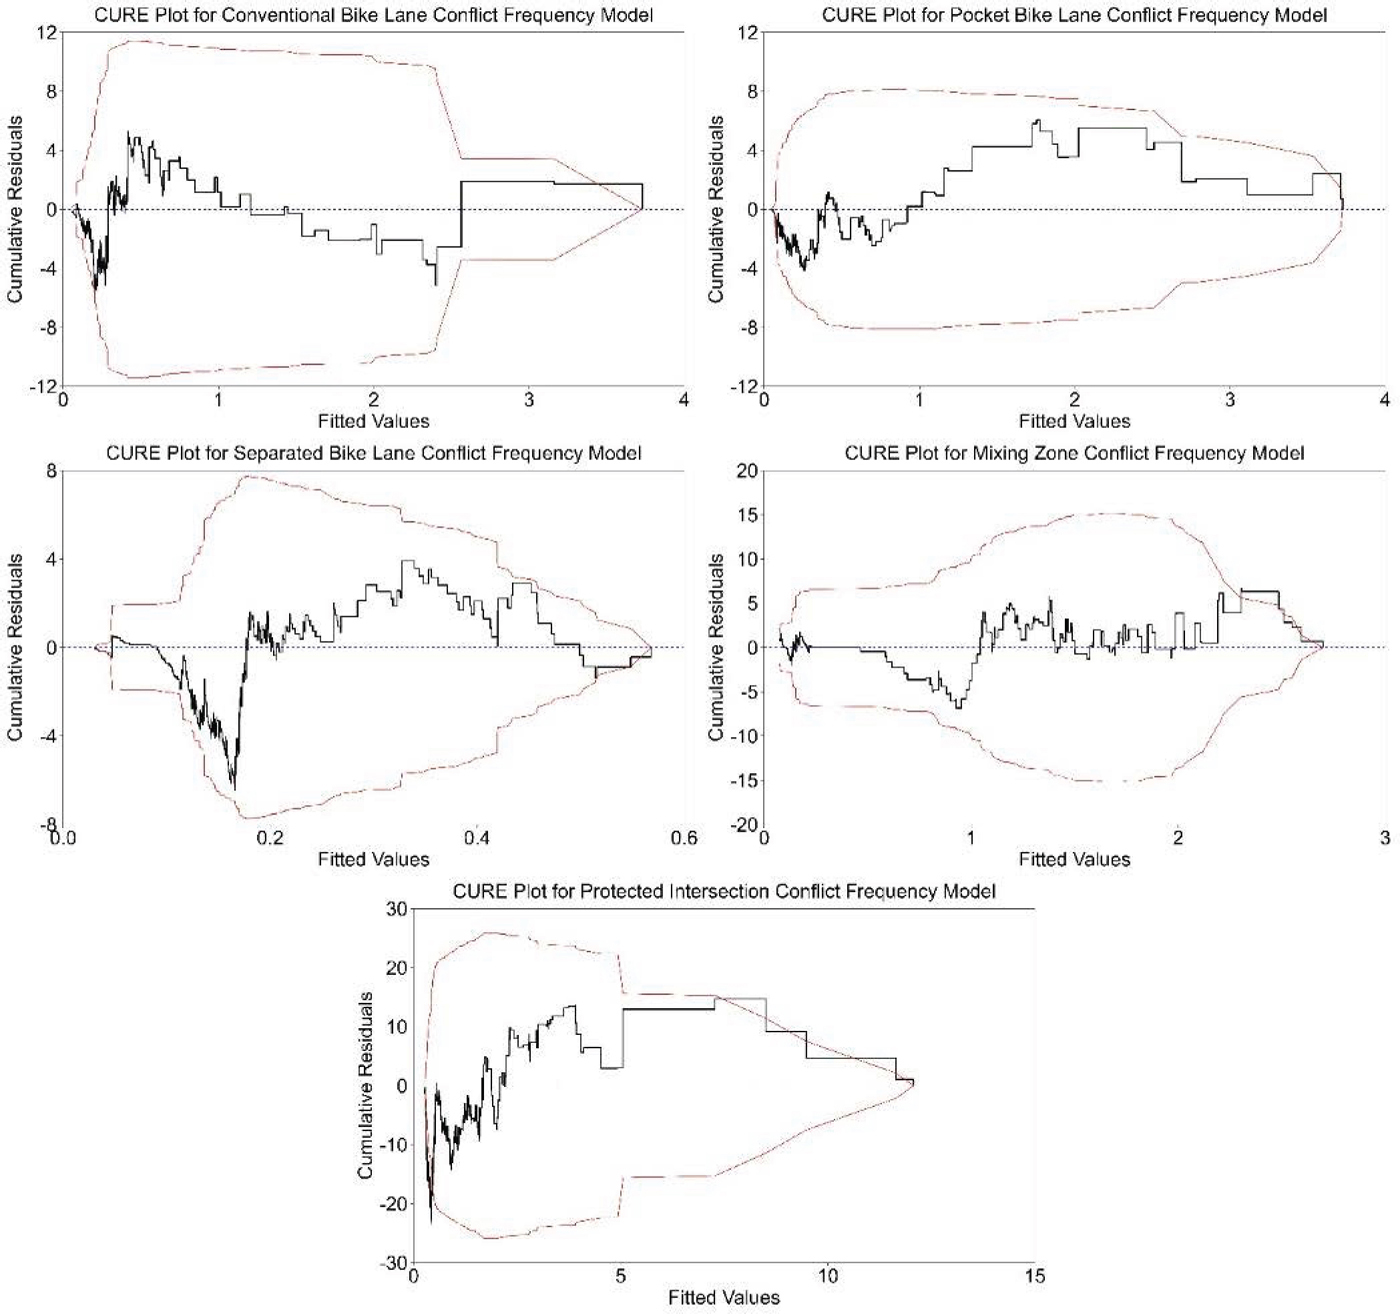
Conflict frequency models by treatment type are shown in Table 53 to Table 56, and CURE plots for each model are shown in Figure 20. Both Poisson and negative binomial models were fit for each model, where no significant dispersion was found; therefore, all treatment type models are Poisson. The CURE plots show the model residuals bounded by 2 standard deviations and is a typical way crash and conflict frequency models are assessed for fit. The residual line should track within the bounds of the standard deviations, and, overall, indicate good fit. The plots do show that the model fits are not as good as the exposure measures increase.
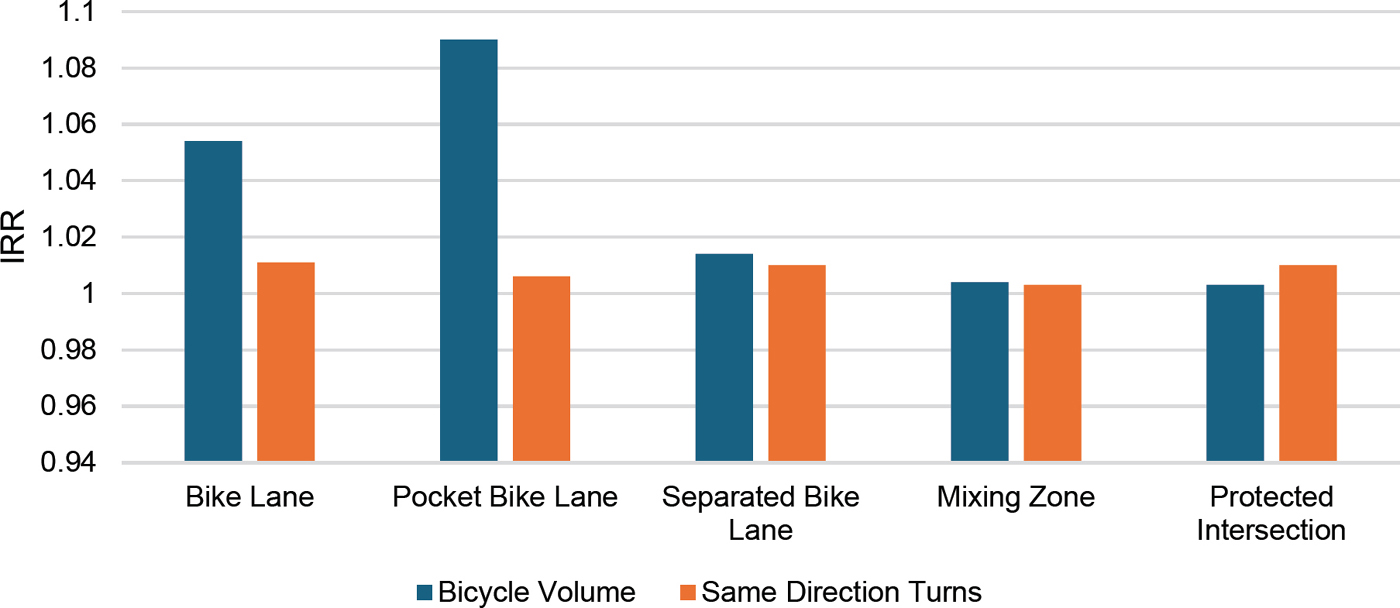
The individual estimates for each treatment type shown in the model specification tables are the estimates for hourly through bicycle volume, hourly vehicle turn volume on approach and site indicators. Also shown in the model specification tables are the incidence rate ratios, or IRRs. An IRR represents the expected change in conflict frequency as a multiplicative factor and is determined by exponentiating the parameter estimate; that is, eβ. For example, the IRR for Yesler Way and 12th Ave indicate that the expected conflict frequency at this location is expected to increase by a factor of 4.085. Alternately, IRRs can be interpreted as a percent increase in the expected number of conflicts as eβ — 1. In each model, all parameters for hourly through bicycle volume and hourly vehicle turn volume on approach are significant with at least 90% confidence, while parameter significance for site indicators varies. The site indicators, regardless of significance, were included in final model specifications to control for site-level differences.
Figure 21 summarizes the IRR for the exposure measures (bicycle volume and same direction motor vehicle turning volumes). For all five treatment types, the contribution of the same direction motor vehicle
turning volume was relatively consistent however, for the conventional bike lane and pocket/keyhole bike lane the bicycle volume was a significantly more important predictor of the total severe conflicts (as measured by the IRR) than the through same direction turning volume. This indicates that bicycle volume is a significant consideration in predicting the frequency of conflicts.
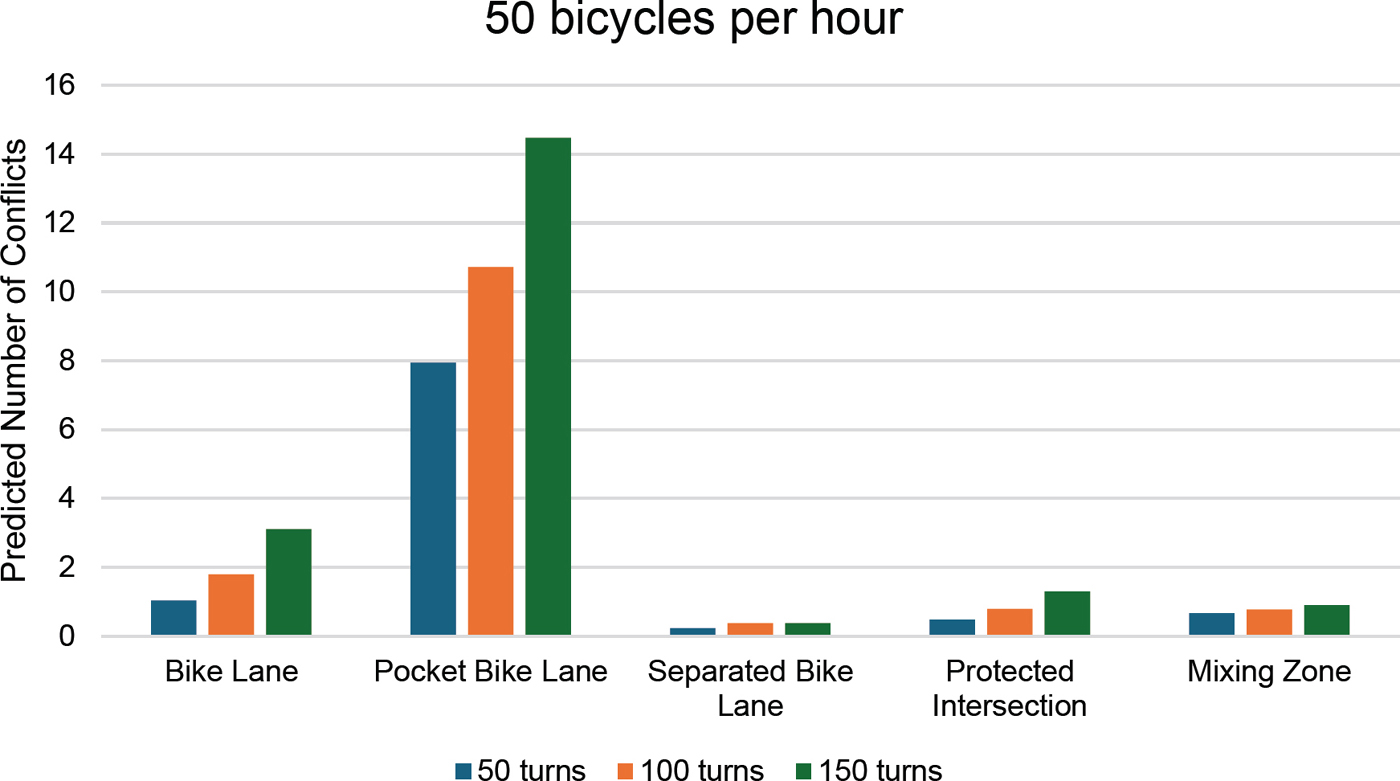
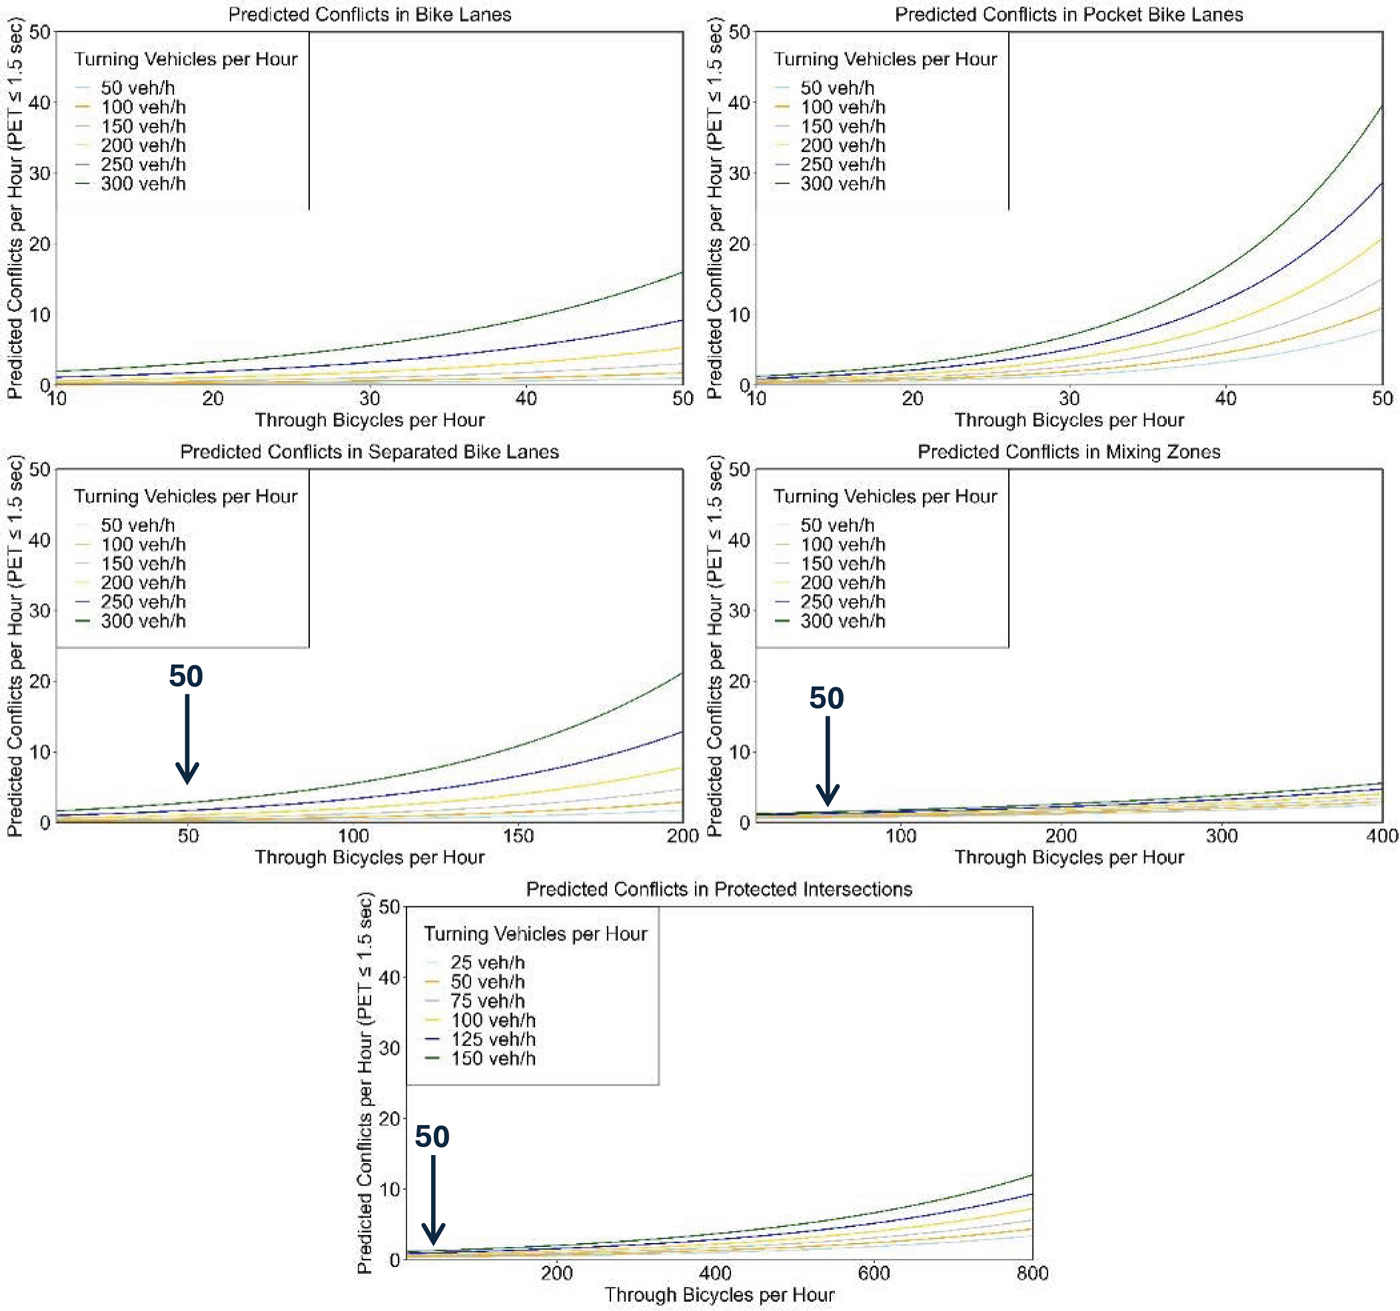
Figure 22 and Figure 23 present the models predicted conflict frequency across a range of bicycle and vehicle volumes. Models, especially safety performance models, are not reliable outside of the ranges of the variables (i.e., bicycle and vehicle volumes in these charts) that were used to develop the model. In other words, it is not reliable to extend the predictions of the model to exposure ranges (bicycle and vehicle volumes) that were not observed at the study locations. For the treatment types with lower bicycle volumes, we have limited the x-axis to the range of hourly through bicycle volumes that were present at the study locations. The y-axis is the predicted severe conflict frequency and is the same scale for all five treatment types. Figure 22 isolates the predicted conflict frequency to 50 bicycles per hour in a bar chart format, which was in the range of observed data for all treatments. As seen in Figure 23, the two treatment types that had the most bicycle volumes and exposures (mixing zones and offset/protected intersections) also had the lowest predicted number of severe conflicts (controlling for all other inputs). The frequency model also predicts low numbers of conflicts for the separated bike lane, especially when compared to the pocket/keyhole bicycle lane and the conventional bike lane. The figure also illustrates that the increase of the predicted severe conflicts as the exposure volumes increase is not the same across the treatment types. As shown in the figure, the models predict significantly increasing conflicts as the combined exposure increases (the x-axis - bicycle volume and same direction turning volume) for the bicycle lane, the pocket/keyhole bicycle lane and the separated bike lane. The models predict that the mixing zone and the offset/protected are able to handle much higher volumes without as significant increase in the predicted severe conflicts.
Figure 22 shows the predicted conflicts for 50 bicycles per hour for 50, 100 and 150 same direction turning vehicles. This figure more clearly shows that the pocket/keyhole bike lane is predicted to have the most conflicts for all volume ranges observed at the study locations. The bicycle lane has the next largest predicted number of conflicts. For both of these treatments, the bar plots show how the predicted number of conflicts increase significantly with the combination of the turning volume and bicycle volume. The separated bicycle lane treatment has the lowest predicted conflicts on for this combination of volumes. Note, however, in Figure 23 that predicted number of conflicts exceeds the mixing zone and offset/protected intersection designs at higher volumes. Overall, the conflict frequency analysis suggests that mixing zone and offset/protected intersection have the lowest predicted conflict frequency.
The effect of some site level design and operational variables in the frequency models were explored. However, the site selection was designed to examine the differences between treatment types, rather than design level variables. As such, the site-to-site variation of some variables (e.g., speed limit) is not sufficient to be included in the model because there is little site-to-site variation (all the variables were not statistically significant). To partially address this, we included site-level indicators in the models. Some of these site level indicators are significant, indicating that there are likely some unexplained design, operational, or user context differences in our models.
Table 53. Poisson Model Specifications for Conflict Frequency in Conventional Bike Lanes
| Variable | Coefficient | Std. Error | z-statistic | IRR |
|---|---|---|---|---|
| Constant | -2.578 | 0.400 | -6.45 | |
| Exposure | ||||
| Hourly Through Bicycle Volume | 0.087 | 0.018 | 4.69 | 1.090 |
| Hourly Turn Volume on Approach (Same Direction) | 0.006 | 0.003 | 2.24 | 1.006 |
| Site | ||||
| S 11th St and Lasalle Ave | Reference | |||
| NE 75th St and Roosevelt Way NE | -0.567 | 0.826 | -0.69 | 0.567 |
| Hennepin Ave and S 1st St | 0.188 | 0.570 | 0.33 | 1.207 |
| Guadalupe St and W 38th St | -0.858 | 0.768 | -1.12 | 0.424 |
| 7th Ave S and Dearborn St | -0.037 | 0.609 | -0.06 | 0.963 |
| Model Summary | ||||
| Number of Observations | 223 | |||
| Log-likelihood at zero (constant only) | -202.24 | |||
| Log-likelihood at convergence | -134.91 | |||
Table 54. Poisson Model Specifications for Conflict Frequency in Separated Bike Lanes
| Variable | Coefficient | Std. Error | z-statistic | IRR |
|---|---|---|---|---|
| Constant | -2.631 | 0.492 | -5.35 | |
| Exposure | ||||
| Hourly Through Bicycle Volume | 0.013 | 0.006 | 2.12 | 1.014 |
| Hourly Turn Volume on Approach (Same Direction) | 0.010 | 0.006 | 1.71 | 1.010 |
| Site | ||||
| Roosevelt Way NE and NE 65th St | Reference | |||
| Bouldin Ave and Barton Springs Rd | -0.954 | 1.186 | -0.80 | 0.385 |
| 12th Ave NE and NE 65th St | 0.064 | 0.405 | 0.16 | 1.066 |
| 7th Ave S and Stewart St | 0.090 | 0.438 | 0.21 | 1.094 |
| Congress Ave and Woodward St | -0.141 | 0.775 | -0.18 | 0.869 |
| Model Summary | ||||
| Number of Observations | 335 | |||
| Log-likelihood at zero (constant only) | -170.75 | |||
| Log-likelihood at convergence | -163.21 | |||
Table 55. Poisson Model Specifications for Conflict Frequency in Protected Intersections
| Variable | Coefficient | Std. Error | z-statistic | IRR |
|---|---|---|---|---|
| Constant | -1.390 | 0.172 | -8.08 | |
| Exposure | ||||
| Hourly Through Bicycle Volume | 0.003 | 0.000 | 6.36 | 1.003 |
| Hourly Turn Volume on Approach (Same Direction) | 0.010 | 0.004 | 2.31 | 1.010 |
| Site | ||||
| 4th Ave and 3rd St | Reference | |||
| 1st Ave and E 11th St | 0.532 | 0.226 | 2.36 | 1.703 |
| 2nd Ave and E 22nd St | 0.134 | 0.237 | 0.57 | 1.144 |
| 9th St and 6th Ave | 0.055 | 0.207 | 0.26 | 1.056 |
| Congress Ave and E 3rd St | 0.097 | 0.284 | 0.34 | 1.102 |
| E 10th St and 2nd Ave | 0.741 | 0.234 | 3.17 | 2.099 |
| Model Summary | ||||
| Number of Observations | 526 | |||
| Log-likelihood at zero (constant only) | -808.34 | |||
| Log-likelihood at convergence | -583.21 | |||
Table 56. Poisson Model Specifications for Conflict Frequency in Mixing Zones
| Variable | Coefficient | Std. Error | z-statistic | IRR |
|---|---|---|---|---|
| Constant | -0.759 | 0.310 | -2.45 | |
| Exposure | ||||
| Hourly Through Bicycle Volume | 0.004 | 0.001 | 3.58 | 1.004 |
| Hourly Turn Volume on Approach (Same Direction) | 0.003 | 0.001 | 2.47 | 1.003 |
| Site | ||||
| E 37th St and 1st Ave | Reference | |||
| 26th St E and Park Ave S | -1.629 | 0.413 | -3.95 | |
| 6th Ave and W 21st St | -0.154 | 0.170 | -0.91 | |
| Linden Blvd and Fountain Ave | -1.964 | 0.722 | -2.72 | |
| Model Summary | ||||
| Number of Observations | 214 | |||
| Log-likelihood at zero (constant only) | -301.11 | |||
| Log-likelihood at convergence | -231.75 | |||
Conflict Severity Analysis Results
Ordered Probit Model for High, Low and Medium Severity Conflicts
Ordered probit model specifications for CS, and corresponding marginal effects, are shown in Table 57 to Table 66.
To provide an example of how to interpret the marginal effects, refer to Table 62. The marginal effect for continuous explanatory variable vehicle speed (mi/h) is 0.0045, indicating that for a one-unit increase in speed (1 mi/h), there is a 0.0045 higher probability of the conflict being severe. The marginal effect for the indicator variable for if the vehicle arrived first is 0.0927, indicating if the vehicle arrived first there was a 0.0927 higher probability of a high severity conflict.
As part of the modeling efforts, we explored all data that were available. We attempted to include geometric and other variables in the modeling process but none of these variables were significant. This is primarily because the variation between sites on these variables is minimal due to the intentional site selection process. As a proxy, we included site level indicator variables, some of which were significant. In the text we explain the characteristics of these sites for context, but these should not be interpreted as the cause or reason for the severity differences in the model estimates.
Conventional Bike Lanes
Three parameters were found to be statistically significant in the bike lane severity model (see Table 57 and Table 58). The first of these was for the indicator for articulated truck, box truck, or bus, where marginal effects indicate a 0.1263 higher probability of a severe conflict if the conflict was with an articulated truck, box truck, or bus. Also significant were two parameters for site indicators. Marginal effects suggest that if a conflict occurred at Yesler Way and 12th Ave (Seattle) there was a 0.1448 higher probability of a severe conflict. There are no bike lane markings at this location, three motor vehicle cross street lanes, two-way motor vehicle traffic, no bus stop, no left-turn lane or signal and a speed limit of 25 mi/h. Also with a significant parameter, marginal effects indicate that if a conflict occurred at 28th St E and Park Ave S (Minneapolis-St. Paul) there was a 0.0787 higher probability of a severe conflict. This site also has no bike lane markings, three motor vehicle cross street lanes, no bus stop, no left-turn lane or signal and a speed limit of 25 mi/h. Conflicts that occurred at Dean Keeton St and Guadalupe St (Austin) had a similar probability of resulting in a severe conflict; however, this site has full-green bike lane markings, an exclusive left-turn lane with a 5-head signal and turn arrow and a speed limit of 35 mi/h – all other characteristics were the same.
Table 57. Ordered Probit Model Specifications of CS in Conventional Bike Lanes
| Variable | Coefficient | Std. Error | z-statistic | p-value |
|---|---|---|---|---|
| Constant | 0.557 | 0.564 | 0.99 | 0.324 |
| Vehicle Category | ||||
| 1 if passenger car, pickup truck, or work van, 0 otherwise | Reference | |||
| 1 if articulated truck, box truck, or bus, 0 otherwise | 0.415 | 0.247 | 1.68 | 0.093 |
| Conflict Characteristics | ||||
| 1 if conflict in opposing direction, 0 otherwise | Reference | |||
| 1 if conflict in same direction, 0 otherwise | -0.287 | 0.514 | -0.56 | 0.577 |
| 1 if bicycle arrived first, 0 otherwise | Reference | |||
| 1 if vehicle arrived first, 0 otherwise | 0.140 | 0.104 | 1.35 | 0.178 |
| Vehicle Speed | ||||
| Vehicle speed at conflict (mi/h) | -0.007 | 0.018 | -0.42 | 0.676 |
| Site | ||||
| 6th Ave and Blanchard St | Reference | |||
| Yesler Way and 12th Ave | 0.470 | 0.252 | 1.86 | 0.063 |
| E Martin Luther King Jr Blvd and Trinity St | -0.048 | 0.277 | -0.17 | 0.862 |
| Dean Keeton St and Guadalupe St | 0.285 | 0.176 | 1.62 | 0.106 |
| 28th St E and Park Ave S | 0.295 | 0.158 | 1.86 | 0.062 |
| Threshold Parameters | ||||
| µ1 | 1.420 | 0.073 | 19.45 | 0.000 |
| Model Summary | ||||
| Number of Observations | 506 | |||
| Log-likelihood at zero (constant only) | -514.68 | |||
| Log-likelihood at convergence | -509.94 | |||
Table 58. Marginal Effects on CS in Conventional Bike Lanes
| Variable | Low Severity | Medium Severity | High Severity |
|---|---|---|---|
| Vehicle Category | |||
| 1 if passenger car, pickup truck, or work van, 0 otherwise | Reference | ||
| 1 if articulated truck, box truck, or bus, 0 otherwise | -0.1299 | 0.0037 | 0.1263 |
| Conflict Characteristics | |||
| 1 if conflict in opposing direction, 0 otherwise | Reference | ||
| 1 if conflict in same direction, 0 otherwise | 0.0929 | -0.0086 | -0.0843 |
| 1 if bicycle arrived first, 0 otherwise | Reference | ||
| 1 if vehicle arrived first, 0 otherwise | -0.0491 | 0.0120 | 0.0371 |
| Vehicle Speed | |||
| Vehicle speed at conflict (mi/h) | 0.0026 | -0.0007 | -0.0020 |
| Site | |||
| 6th Ave and Blanchard St | Reference | ||
| Yesler Way and 12th Ave | -0.1453 | 0.0006 | 0.1448 |
| E Martin Luther King Jr Blvd and Trinity St | 0.0171 | -0.0048 | -0.0123 |
| Dean Keeton St and Guadalupe St | -0.0975 | 0.0197 | 0.0778 |
| 28th St E and Park Ave S | -0.1021 | 0.0234 | 0.0787 |
Pocket/Keyhole Bike Lanes
In the pocket bike lane model, just one parameter was statistically significant, as well as the constant. Marginal effects suggest that if a conflict occurred with an articulated truck, box truck, or bus, there was a 0.0887 higher probably of a severe conflict (Table 59 and Table 60). Although all sites in the pocket/keyhole bike lane model have a negative coefficient and decrease the probability of a severe conflict (relative to the base case of 7th Ave S and Dearborn St in Austin), the parameters for these indicators were not significant.
Table 59. Ordered Probit Model Specifications of CS in Pocket / Keyhole Bike Lanes
| Variable | Coefficient | Std. Error | z-statistic | p-value |
|---|---|---|---|---|
| Constant | 1.163 | 0.659 | 1.77 | 0.077 |
| Vehicle Category | ||||
| 1 if passenger car, pickup truck, or work van, 0 otherwise | ||||
| 1 if articulated truck, box truck, or bus, 0 otherwise | 0.384 | 0.127 | 3.03 | 0.003 |
| Conflict Characteristics | ||||
| 1 if bicycle arrived first, 0 otherwise | Reference | |||
| 1 if vehicle arrived first, 0 otherwise | -0.143 | 0.211 | -0.68 | 0.496 |
| Vehicle Speed | ||||
| Vehicle speed at conflict (mi/h) | -0.032 | 0.060 | -0.54 | 0.590 |
| Site | ||||
| 7th Ave S and Dearborn St | Reference | |||
| NE 75th St and Roosevelt Way NE | -0.501 | 0.541 | -0.93 | 0.354 |
| Hennepin Ave and S 1st St | -0.414 | 0.350 | -1.18 | 0.238 |
| Guadalupe St and W 38th St | -0.314 | 0.406 | -0.77 | 0.440 |
| Threshold Parameters | ||||
| µ1 | 1.643 | 0.164 | 10.02 | 0.000 |
| Model Summary | ||||
| Number of Observations | 128 | |||
| Log-likelihood at zero (constant only) | -121.31 | |||
| Log-likelihood at convergence | -119.36 | |||
Table 60. Marginal Effects on CS in Pocket / Keyhole Bike Lanes
| Variable | Low Severity | Medium Severity | High Severity |
|---|---|---|---|
| Vehicle Category | |||
| 1 if passenger car, pickup truck, or work van, 0 otherwise | Reference | ||
| 1 if articulated truck, box truck, or bus, 0 otherwise | -0.1278 | 0.0391 | 0.0887 |
| Conflict Characteristics | |||
| 1 if bicycle arrived first, 0 otherwise | Reference | ||
| 1 if vehicle arrived first, 0 otherwise | 0.0525 | -0.0257 | -0.0268 |
| Vehicle Speed | |||
| Vehicle speed at conflict (mi/h) | 0.0118 | -0.0056 | -0.0062 |
| Site | |||
| 7th Ave S and Dearborn St | Reference | ||
| NE 75th St and Roosevelt Way NE | 0.1933 | -0.1203 | -0.0730 |
| Hennepin Ave and S 1st St | 0.1507 | -0.0731 | -0.0776 |
| Guadalupe St and W 38th St | 0.1155 | -0.0584 | -0.0572 |
Separated Bike Lanes
There were six significant parameters in the separated bike lane model. Unlike the previous two models, marginal effects suggest that if a conflict occurred with an articulated truck, box truck, or bus, there was a 0.0432 decrease in probability of a severe conflict (see Table 61 and Table 62). If the conflict occurred with the bicycle and vehicle traveling in the same direction (i.e., vehicle was turning on approach), marginal effects indicate a 0.0383 higher probability of a severe conflict. The parameter for if the vehicle arrived first was highly significant, where marginal effects suggest a 0.0927 higher probability of a severe conflict if the vehicle arrived first. Lastly, despite all four sites having similar effects on probability, three had significant parameters. Marginal effects indicate that if a conflict occurred at Bouldin Ave and Barton Springs Rd (Austin), there was a 0.0399 lower probability of a severe conflict. This location has no bike lane markings, one motor vehicle cross street lane, two-way motor vehicle traffic, no bus stops, a left-turn lane with a 3-head ball and a speed limit of 45 mi/h. If a conflict occurred at 7th Ave S and Stewart St (Seattle), marginal effects suggest a 0.0391 lower probability of the conflict being severe. This location differs from the previous, as there are full-green bike lane markings, four motor vehicle cross street lanes, one-way motor vehicle traffic, no bus stop, no left-turn lane or signal and a speed limit of 25 mi/h. The final location with a significant parameter was Congress Ave and Woodward St (Austin), where if a conflict occurred here marginal effects indicate a 0.0450 lower probability of a severe conflict. This location has full-white bike lane markings, four motor vehicle cross street lanes, two-way motor vehicle traffic, a far-side bus stop, an exclusive left-turn lane with a 5-head signal and turn arrow and a speed limit of 45 mi/h.
Table 61. Ordered Probit Model Specifications of CS in Separated Bike Lanes
| Variable | Coefficient | Std. Error | z-statistic | p-value |
|---|---|---|---|---|
| Constant | -0.317 | 0.341 | -0.93 | 0.352 |
| Vehicle Category | ||||
| 1 if passenger car, pickup truck, or work van, 0 otherwise | Reference | |||
| 1 if articulated truck, box truck, or bus, 0 otherwise | -0.317 | 0.175 | -1.81 | 0.071 |
| Conflict Characteristics | ||||
| 1 if conflict in opposing direction, 0 otherwise | Reference | |||
| 1 if conflict in same direction, 0 otherwise | 0.271 | 0.152 | 1.78 | 0.075 |
| 1 if bicycle arrived first, 0 otherwise | Reference | |||
| 1 if vehicle arrived first, 0 otherwise | 0.528 | 0.105 | 5.02 | 0.000 |
| Vehicle Speed | ||||
| Vehicle speed at conflict (mi/h) | 0.028 | 0.023 | 1.20 | 0.229 |
| Site | ||||
| 12th Ave NE and NE 65th St | Reference | |||
| Bouldin Ave and Barton Springs Rd | -0.289 | 0.168 | -1.72 | 0.085 |
| 7th Ave S and Stewart St | -0.257 | 0.141 | -1.82 | 0.069 |
| Congress Ave and Woodward St | -0.308 | 0.138 | -2.22 | 0.026 |
| Roosevelt Way NE and NE 65th St | -0.284 | 0.219 | -1.30 | 0.194 |
| Threshold Parameters | ||||
| µ1 | 1.549 | 0.077 | 20.15 | 0.000 |
| Model Summary | ||||
| Number of Observations | 579 | |||
| Log-likelihood at zero (constant only) | -548.76 | |||
| Log-likelihood at convergence | -528.54 | |||
Table 62. Marginal Effects on CS in Separated Bike Lanes
| Variable | Low Severity | Medium Severity | High Severity |
|---|---|---|---|
| Vehicle Category | |||
| 1 if passenger car, pickup truck, or work van, 0 otherwise | Reference | ||
| 1 if articulated truck, box truck, or bus, 0 otherwise | 0.1255 | -0.0822 | -0.0432 |
| Conflict Characteristics | |||
| 1 if conflict in opposing direction, 0 otherwise | Reference | ||
| 1 if conflict in same direction, 0 otherwise | -0.1071 | 0.0688 | 0.0383 |
| 1 if bicycle arrived first, 0 otherwise | Reference | ||
| 1 if vehicle arrived first, 0 otherwise | -0.2013 | 0.1086 | 0.0927 |
| Vehicle Speed | |||
| Vehicle speed at conflict (mi/h) | -0.0109 | 0.0064 | 0.0045 |
| Site | |||
| 12th Ave NE and NE 65th St | Reference | ||
| Bouldin Ave and Barton Springs Rd | 0.1142 | -0.0743 | -0.0399 |
| 7th Ave S and Stewart St | 0.1009 | -0.0619 | -0.0391 |
| Congress Ave and Woodward St | 0.1212 | -0.0762 | -0.0450 |
| Roosevelt Way NE and NE 65th St | 0.1124 | -0.0736 | -0.0388 |
Mixing Zones
The mixing zone model had five significant parameters. Once more, the indicator for articulated truck, box truck, or bus had a significant parameter. According to marginal effects, if the conflict occurred with an articulated truck, box truck, or bus, there was a 0.0663 higher probability of a severe conflict (see Table 63 and Table 64). If the vehicle arrived first, there was a 0.0658 higher probability of a severe conflict, based on marginal effects. The first site with a significant parameter was 6th Ave and W 21st St (New York), where marginal effects indicate a 0.1122 higher probability of a severe conflict. Although estimates indicate an increase in probability of a severe conflict, this site has full-white bike lane markings, one motor vehicle cross street lane, one-way motor vehicle traffic, a near-side bus stop, no left-turn lane or signal, and a speed limit of 25 mi/h. Also significant was the parameter for E 37th St and 1st Ave (New York), which has the same characteristics and nearly the same effects on probability of a severe conflict. The final site with a significant parameter was Linden Blvd and Fountain Ave (New York), where marginal effects suggest that if a conflict occurred here there was a 0.2044 higher probability of the conflict being severe. This site has full-white bike lane markings, 10 motor vehicle cross street lanes, two-way motor vehicle traffic, no bus stop, a left-turn lane with a 3-head ball signal and a speed limit of 25 mi/h. This site was also the only mixing zone site in which the mixing zone marking was determined to be minimal.
Table 63. Ordered Probit Model Specifications of CS in Mixing Zones
| Variable | Coefficient | Std. Error | z-statistic | p-value |
|---|---|---|---|---|
| Constant | 0.076 | 0.143 | 0.53 | 0.597 |
| Vehicle Category | ||||
| 1 if passenger car, pickup truck, or work van, 0 otherwise | Reference | |||
| 1 if articulated truck, box truck, or bus, 0 otherwise | 0.208 | 0.107 | 1.95 | 0.051 |
| 1 if motorcycle, 0 otherwise | -0.121 | 0.353 | -0.34 | 0.733 |
| Conflict Characteristics | ||||
| 1 if bicycle arrived first, 0 otherwise | Reference | |||
| 1 if vehicle arrived first, 0 otherwise | 0.224 | 0.059 | 3.79 | 0.000 |
| Vehicle Speed | ||||
| Vehicle speed at conflict (mi/h) | -0.007 | 0.008 | -0.91 | 0.362 |
| Site | ||||
| 26th St E and Park Ave S | Reference | |||
| 6th Ave and W 21st St | 0.370 | 0.113 | 3.29 | 0.001 |
| E 37th St and 1st Ave | 0.377 | 0.114 | 3.30 | 0.001 |
| Linden Blvd and Fountain Ave | 0.580 | 0.338 | 1.72 | 0.086 |
| Harrison St and Dexter Ave N | 0.093 | 0.213 | 0.44 | 0.662 |
| Threshold Parameters | ||||
| µ1 | 1.234 | 0.040 | 30.91 | 0.000 |
| Model Summary | ||||
| Number of Observations | 1,465 | |||
| Log-likelihood at zero (constant only) | -1552.83 | |||
| Log-likelihood at convergence | -1535.97 | |||
Table 64. Marginal Effects on CS in Mixing Zones
| Variable | Low Severity | Medium Severity | High Severity |
|---|---|---|---|
| Vehicle Category | |||
| 1 if passenger car, pickup truck, or work van, 0 otherwise | Reference | ||
| 1 if articulated truck, box truck, or bus, 0 otherwise | -0.0709 | 0.0046 | 0.0663 |
| 1 if motorcycle, 0 otherwise | 0.0441 | -0.0098 | -0.0344 |
| Conflict Characteristics | |||
| 1 if bicycle arrived first, 0 otherwise | Reference | ||
| 1 if vehicle arrived first, 0 otherwise | -0.0806 | 0.0148 | 0.0658 |
| Vehicle Speed | |||
| Vehicle speed at conflict (mi/h) | 0.0027 | -0.0004 | -0.0022 |
| Site | |||
| 26th St E and Park Ave S | Reference | ||
| 6th Ave and W 21st St | -0.1299 | 0.0178 | 0.1122 |
| E 37th St and 1st Ave | -0.1330 | 0.0198 | 0.1132 |
| Linden Blvd and Fountain Ave | -0.1722 | -0.0322 | 0.2044 |
| Harrison St and Dexter Ave N | -0.0324 | 0.0037 | 0.0287 |
Protected Intersections
Three variables had significant parameters in the protected intersection model. Once more, the parameter for articulated truck, box truck, or bus was found to be significant (see Table 65 and Table 60). If the conflict occurred with an articulated truck, box truck, or bus, marginal effects indicate a 0.0326 higher probability of a severe conflict. Also observed once more is the significance of the parameter for if the vehicle arrived first, where marginal effects suggest a 0.0975 higher probability of a severe conflict if the vehicle arrived first. Just one site had a significant parameter, 1st Ave and E 11th St (New York), in which marginal effects indicate a 0.0790 higher probability of a severe conflict if a conflict occurred at this location. This site has full-green bike lane markings, one motor vehicle cross street lane, one-way motor vehicle traffic, no bus stops, no left-turn lane or signal and a speed limit of 25 mi/h.
Table 65. Ordered Probit Model Specifications of CS in Protected Intersections
| Variable | Coefficient | Std. Error | z-statistic | p-value |
|---|---|---|---|---|
| Constant | -0.040 | 0.134 | -0.30 | 0.768 |
| Vehicle Category | ||||
| 1 if passenger car, pickup truck, or work van, 0 otherwise | Reference | |||
| 1 if articulated truck, box truck, or bus, 0 otherwise | 0.123 | 0.097 | 1.27 | 0.204 |
| 1 if motorcycle, 0 otherwise | 0.111 | 0.283 | 0.39 | 0.694 |
| Conflict Characteristics | ||||
| 1 if conflict in opposing direction, 0 otherwise | Reference | |||
| 1 if conflict in same direction, 0 otherwise | 0.042 | 0.104 | 0.40 | 0.686 |
| 1 if bicycle arrived first, 0 otherwise | Reference | |||
| 1 if vehicle arrived first, 0 otherwise | 0.392 | 0.039 | 9.96 | 0.000 |
| Vehicle Speed | ||||
| Vehicle speed at conflict (mi/h) | 0.006 | 0.006 | 0.89 | 0.375 |
| Site | ||||
| Congress Ave and E 3rd St | Reference | |||
| Dexter Ave N and Aloha St | 0.029 | 0.144 | 0.20 | 0.841 |
| 1st Ave and E 11th St | 0.291 | 0.098 | 2.96 | 0.003 |
| 2nd Ave and E 22nd St | -0.028 | 0.097 | -0.29 | 0.773 |
| 4th Ave and 3rd St | 0.111 | 0.112 | 0.99 | 0.321 |
| 9th St and 6th Ave (EB) | 0.291 | 0.112 | 2.59 | 0.010 |
| 9th St and 6th Ave (WB) | -0.194 | 0.147 | -1.32 | 0.187 |
| E 10th St and 2nd Ave | 0.060 | 0.091 | 0.66 | 0.509 |
| Threshold Parameters | ||||
| µ1 | 1.330 | 0.029 | 46.48 | 0.000 |
| Model Summary | ||||
| Number of Observations | 3,201 | |||
| Log-likelihood at zero (constant only) | -3291.00 | |||
| Log-likelihood at convergence | -3224.14 | |||
Table 66. Marginal Effects on CS in Protected Intersections
| Variable | Low Severity | Medium Severity | High Severity |
|---|---|---|---|
| Vehicle Category | |||
| 1 if passenger car, pickup truck, or work van, 0 otherwise | Reference | ||
| 1 if articulated truck, box truck, or bus, 0 otherwise | -0.0450 | 0.0124 | 0.0326 |
| 1 if motorcycle, 0 otherwise | -0.0406 | 0.0113 | 0.0294 |
| Conflict Characteristics | |||
| 1 if conflict in opposing direction, 0 otherwise | Reference | ||
| 1 if conflict in same direction, 0 otherwise | -0.0157 | 0.0054 | 0.0103 |
| 1 if bicycle arrived first, 0 otherwise | Reference | ||
| 1 if vehicle arrived first, 0 otherwise | -0.1458 | 0.0482 | 0.0975 |
| Vehicle Speed | |||
| Vehicle speed at conflict (mi/h) | -0.0021 | 0.0007 | 0.0014 |
| Site | |||
| Congress Ave and E 3rd St | Reference | ||
| Dexter Ave N and Aloha St | -0.0107 | 0.0034 | 0.0073 |
| 1st Ave and E 11th St | -0.1044 | 0.0254 | 0.0790 |
| 2nd Ave and E 22nd St | 0.0105 | -0.0035 | -0.0070 |
| 4th Ave and 3rd St | -0.0407 | 0.0116 | 0.0291 |
| 9th St and 6th Ave (EB) | -0.1023 | 0.0204 | 0.0819 |
| 9th St and 6th Ave (WB) | 0.0743 | -0.0300 | -0.0443 |
| E 10th St and 2nd Ave | -0.0223 | 0.0072 | 0.0151 |
Binary Logit Model for High Severity Conflicts
To model only high severity conflicts (PET ≤ 1.5 sec and vehicle speed greater than 9 mi/h, 0 otherwise), a series of binary logit models were generated. Despite similarities, there were differences observed as well (compared to the ordered probit models). The binary logit models were a bit more sensitive to variables in which a large proportion of severe conflicts, or otherwise, were present.
Conventional Bike Lanes
Two parameters were significant in the bike lane model, while a third was just inside the fail to reject region (i.e., test statistic of 1.64, see Table 67). The indicator for the vehicle arriving first had a significant parameter, where marginal effects suggest a 0.100 higher probability of the conflict being severe if the vehicle arrived first. Yesler Way and 12th Ave (Seattle), also significant in the ordered probit framework, had a significant parameter and marginal effects that indicate a 0.189 higher probability of the conflict being severe if it occurred at this location. There are no bike lane markings at this location, three motor vehicle cross street lanes, two-way motor vehicle traffic, no bus stop, no left-turn lane or signal, and a speed limit of 25 mi/h. Just inside the fail to reject region was the indicator for Dean Keeton St and Guadalupe St (Austin), which was found to be significant through the ordered probit framework. In the current
framework, marginal effects indicate that conflicts that occurred at this location had a 0.113 higher probability of being severe. As stated previously, this site has full-green bike lane markings, an exclusive left-turn lane with a 5-head signal and turn arrow and a speed limit of 35 mi/h – all other characteristics are the same as Yesler Way and 12th Ave.
Table 67. Binary Logit Model Specifications for High Severity Conflicts in Conventional Bike Lanes
| Variable | Coefficient | Std. Error | z-statistic | Odds Ratio | Marginal Effect |
|---|---|---|---|---|---|
| Constant | -2.141 | 1.370 | -1.56 | ||
| Vehicle Category | |||||
| 1 if passenger car, pickup truck, or work van, 0 otherwise | Reference | ||||
| 1 if articulated truck, box truck, or bus, 0 otherwise | 0.717 | 0.568 | 1.26 | 2.049 | 0.124 |
| Conflict Characteristics | |||||
| 1 if conflict in opposing direction, 0 otherwise | Reference | ||||
| 1 if conflict in same direction, 0 otherwise | -0.379 | 1.266 | -0.30 | 0.685 | -0.061 |
| 1 if bicycle arrived first, 0 otherwise | Reference | ||||
| 1 if vehicle arrived first, 0 otherwise | 0.669 | 0.238 | 2.81 | 1.952 | 0.100 |
| Vehicle Speed | |||||
| Vehicle speed at conflict (mi/h) | 0.011 | 0.036 | 0.30 | 1.011 | 0.002 |
| Site | |||||
| 6th Ave and Blanchard St | Reference | ||||
| Yesler Way and 12th Ave | 1.035 | 0.562 | 1.84 | 2.814 | 0.189 |
| E Martin Luther King Jr Blvd and Trinity St | 0.266 | 0.665 | 0.40 | 1.305 | 0.041 |
| Dean Keeton St and Guadalupe St | 0.729 | 0.445 | 1.64 | 2.072 | 0.113 |
| 28th St E and Park Ave S | 0.454 | 0.434 | 1.05 | 1.574 | 0.067 |
| Model Summary | |||||
| Number of Observations | 506 | ||||
| Log-likelihood at zero (constant only) | -239.91 | ||||
| Log-likelihood at convergence | -232.61 | ||||
Pocket/Keyhole Bike Lanes
Just one parameter was significant in the pocket/keyhole bike lane model, where this parameter was for the indicator of articulated truck, box truck, or bus (see Table 69). It should be noted that this indicator made up a smaller proportion of observations, of which the majority were not high severity; hence the large statistical significance observed. Marginal effects suggest that if the conflict was with an articulated truck, box truck, or bus, there was a 0.126 lower probability of the conflict being severe. Also note that all sites in the pocket/keyhole bike lane model indicate a decrease in probability of the conflict being severe; however, the parameters for these indicators were not significant.
| Variable | Coefficient | Std. Error | z-statistic | Odds Ratio | Marginal Effect |
|---|---|---|---|---|---|
| Constant | -0.622 | 1.946 | -0.32 | ||
| Vehicle Category | |||||
| 1 if passenger car, pickup truck, or work van, 0 otherwise | Reference | ||||
| 1 if articulated truck, box truck, or bus, 0 otherwise | -28.218 | 0.476 | -59.27 | 0.000 | -0.126 |
| Conflict Characteristics | |||||
| 1 if bicycle arrived first, 0 otherwise | Reference | ||||
| 1 if vehicle arrived first, 0 otherwise | -0.173 | 0.620 | -0.28 | 0.841 | -0.017 |
| Vehicle Speed | |||||
| Vehicle speed at conflict (mi/h) | -0.054 | 0.179 | -0.30 | 0.948 | -0.005 |
| Site | |||||
| 7th Ave S and Dearborn St | Reference | ||||
| NE 75th St and Roosevelt Way NE | -0.743 | 1.489 | -0.50 | 0.476 | -0.060 |
| Hennepin Ave and S 1st St | -0.508 | 0.792 | -0.64 | 0.602 | -0.052 |
| Guadalupe St and W 38th St | -1.216 | 1.007 | -1.21 | 0.297 | -0.106 |
| Model Summary | |||||
| Number of Observations | 128 | ||||
| Log-likelihood at zero (constant only) | -46.24 | ||||
| Log-likelihood at convergence | -43.60 | ||||
Separated Bike Lanes
In the separated bike lane model, three variables had significant parameters (see Table 69). If the conflict was with an articulated truck, box truck, or bus, marginal effects suggest there was a 0.066 lower probability of the conflict being severe. If the conflict occurred with the bicycle and vehicle traveling in the same direction (e.g., through bicycle and approach turning vehicle), marginal effects indicate a 0.080 higher probability of the conflict being severe. Additionally, the indicator for if the vehicle arrived first had a significant parameter, where marginal effects indicate that conflicts in which the vehicle arrived first had a 0.189 higher probability of being severe. Although no site indicators had significant parameters, the parameter for Bouldin Ave and Barton Springs Rd was significant with just under 85% confidence. Marginal effects indicate that conflicts that occurred at this location had a 0.060 lower probability of being severe. This location has no bike lane markings, one motor vehicle cross street lane, two-way motor vehicle traffic, no bus stops, a left-turn lane with a 3-head ball and a speed limit of 45 mi/h. Despite these characteristics, the ordered probit framework also suggested a decrease in severity at this location.
Table 69. Binary Logit Model Specifications for High Severity Conflicts in Separated Bike Lanes
| Variable | Coefficient | Std. Error | z-statistic | Odds Ratio | Marginal Effect |
|---|---|---|---|---|---|
| Constant | -5.106 | 1.118 | -4.57 | ||
| Vehicle Category | |||||
| 1 if passenger car, pickup truck, or work van, 0 otherwise | Reference | ||||
| 1 if articulated truck, box truck, or bus, 0 otherwise | -1.109 | 0.647 | -1.71 | 0.330 | -0.066 |
| Conflict Characteristics | |||||
| 1 if conflict in opposing direction, 0 otherwise | Reference | ||||
| 1 if conflict in same direction, 0 otherwise | 1.364 | 0.612 | 2.23 | 3.914 | 0.080 |
| 1 if bicycle arrived first, 0 otherwise | Reference | ||||
| 1 if vehicle arrived first, 0 otherwise | 2.250 | 0.373 | 6.03 | 9.489 | 0.189 |
| Vehicle Speed | |||||
| Vehicle speed at conflict (mi/h) | 0.035 | 0.067 | 0.52 | 1.035 | 0.003 |
| Site | |||||
| 12th Ave NE and NE 65th St | Reference | ||||
| Bouldin Ave and Barton Springs Rd | -0.965 | 0.676 | -1.43 | 0.381 | -0.060 |
| 7th Ave S and Stewart St | 0.281 | 0.406 | 0.69 | 1.324 | 0.023 |
| Congress Ave and Woodward St | 0.048 | 0.444 | 0.11 | 1.049 | 0.004 |
| Roosevelt Way NE and NE 65th St | 0.154 | 0.653 | 0.24 | 1.166 | 0.013 |
| Model Summary | |||||
| Number of Observations | 579 | ||||
| Log-likelihood at zero (constant only) | -188.44 | ||||
| Log-likelihood at convergence | -156.72 | ||||
Mixing Zones
Three variables had significant parameters in the mixing zone model (see Table 70). Marginal effects show that if the vehicle arrived first, there was a 0.112 higher probability of the conflict being severe. Also significant were the parameters for two site indicators. Marginal effects indicate that conflicts which occurred at 6th Ave and W 21st St (New York) had a 0.199 higher probability of being severe. Although estimates indicate an increase in probability of a severe conflict, this site has full-white bike lane markings, one motor vehicle cross street lane, one-way motor vehicle traffic, a near-side bus stop, no left-turn lane or signal, and a speed limit of 25 mi/h. This increase in probability was also observed in the ordered probit modeling framework. If a conflict occurred at E 37th St and 1st Ave (New York), marginal effects indicate a 0.222 higher probability of the conflict being severe. Similar to findings in the ordered probit framework, these two sites have the same characteristics and nearly the same effects on the probability of a severe conflict. Model specifications here, as with the ordered probit framework, provide some evidence that an alternate modeling methodology may provide some additional insight on conflict behavior at these two locations, specifically a methodology where parameters can be indexed by outcome.
Table 70. Binary Logit Model Specifications for High Severity Conflicts in Mixing Zones
| Variable | Coefficient | Std. Error | z-statistic | Odds Ratio | Marginal Effect |
|---|---|---|---|---|---|
| Constant | -2.691 | 0.452 | -5.95 | ||
| Vehicle Category | |||||
| 1 if passenger car, pickup truck, or work van, 0 otherwise | Reference | ||||
| 1 if articulated truck, box truck, or bus, 0 otherwise | 0.252 | 0.231 | 1.09 | 1.287 | 0.045 |
| 1 if motorcycle, 0 otherwise | -0.187 | 0.854 | -0.22 | 0.829 | -0.030 |
| Conflict Characteristics | |||||
| 1 if bicycle arrived first, 0 otherwise | Reference | ||||
| 1 if vehicle arrived first, 0 otherwise | 0.687 | 0.138 | 4.96 | 1.987 | 0.112 |
| Vehicle Speed | |||||
| Vehicle speed at conflict (mi/h) | -0.014 | 0.019 | -0.77 | 0.986 | -0.002 |
| Site | |||||
| 26th St E and Park Ave S | Reference | ||||
| 6th Ave and W 21st St | 1.172 | 0.405 | 2.89 | 3.227 | 0.199 |
| E 37th St and 1st Ave | 1.322 | 0.405 | 3.26 | 3.752 | 0.222 |
| Linden Blvd and Fountain Ave | 1.089 | 0.917 | 1.19 | 2.970 | 0.227 |
| Harrison St and Dexter Ave N | 0.510 | 0.644 | 0.79 | 1.666 | 0.097 |
| Model Summary | |||||
| Number of Observations | 1,465 | ||||
| Log-likelihood at zero (constant only) | -784.01 | ||||
| Log-likelihood at convergence | -759.69 | ||||
Protected Intersections
In the protected intersection model, two variables had significant parameters (see Table 71). A third variable had a significant parameter with just under 85% confidence. The indicator for if the vehicle arrived first had a significant parameter, where marginal effects show that if the vehicle arrived first there was a 0.160 higher probability of the conflict being severe. Conflicts that occurred at 1st Ave and E 11th St (New York), according to marginal effects, had a 0.140 higher probability of being severe. This site has full-green bike lane markings, one motor vehicle cross street lane, one-way motor vehicle traffic, no bus stops, no left-turn lane or signal and a speed limit of 25 mi/h. The same increase in probability was observed in the ordered probit framework. The parameter with significance with just under 85% confidence was for the indicator for E 10th St and 2nd Ave, where marginal effects indicate a 0.061 higher probability of the conflict being severe if it occurred at this location. This site has a full-white bike lane marking, one motor vehicle cross street lane, one-way motor vehicle traffic, no bus stops, no left-turn lane or signal and a speed limit of 25 mi/h.
Table 71. Binary Logit Model Specifications for High Severity Conflicts in Protected Intersections
| Variable | Coefficient | Std. Error | z-statistic | Odds Ratio | Marginal Effect |
|---|---|---|---|---|---|
| Constant | -2.480 | 0.375 | -6.62 | ||
| Vehicle Category | |||||
| 1 if passenger car, pickup truck, or work van, 0 otherwise | Reference | ||||
| 1 if articulated truck, box truck, or bus, 0 otherwise | 0.073 | 0.242 | 0.30 | 1.076 | 0.010 |
| 1 if motorcycle, 0 otherwise | -0.169 | 0.867 | -0.20 | 0.844 | -0.022 |
| Conflict Characteristics | |||||
| 1 if conflict in opposing direction, 0 otherwise | Reference | ||||
| 1 if conflict in same direction, 0 otherwise | -0.330 | 0.277 | -1.19 | 0.719 | -0.048 |
| 1 if bicycle arrived first, 0 otherwise | Reference | ||||
| 1 if vehicle arrived first, 0 otherwise | 1.228 | 0.102 | 11.99 | 3.413 | 0.160 |
| Vehicle Speed | |||||
| Vehicle speed at conflict (mi/h) | 0.004 | 0.016 | 0.27 | 1.004 | 0.001 |
| Site | |||||
| Congress Ave and E 3rd St | Reference | ||||
| Dexter Ave N and Aloha St | 0.174 | 0.390 | 0.45 | 1.191 | 0.025 |
| 1st Ave and E 11th St | 0.898 | 0.268 | 3.35 | 2.455 | 0.140 |
| 2nd Ave and E 22nd St | 0.039 | 0.282 | 0.14 | 1.040 | 0.005 |
| 4th Ave and 3rd St | 0.200 | 0.324 | 0.62 | 1.221 | 0.028 |
| 9th St and 6th Ave (EB) | 0.428 | 0.333 | 1.28 | 1.534 | 0.064 |
| 9th St and 6th Ave (WB) | 0.068 | 0.380 | 0.18 | 1.070 | 0.009 |
| E 10th St and 2nd Ave | 0.444 | 0.255 | 1.74 | 1.559 | 0.061 |
| Model Summary | |||||
| Number of Observations | 3,201 | ||||
| Log-likelihood at zero (constant only) | -1477.90 | ||||
| Log-likelihood at convergence | -1383.94 | ||||
Summary of Marginal Effects
A summary of the marginal effects from the ordered probit and logit modeling are presented in this section. The results are summarized in Table 72. Plots are shown in Figure 24 through Figure 27.
For all treatment types except the pocket/keyhole bike lane, the marginal effects of the vehicle arriving first on the severity is positive and of similar magnitude. Vehicles arriving first are most likely traveling faster and not yielding to persons on bicycles (the definition of a severe conflict includes PET and speed). It is not clear if the difference for the pocket/keyhole bike lane can be generalized to the design or is explaining the data that were observed at the locations in this study. Similarly, the marginal effects on predicting a severe conflict when the vehicle is large truck, the conflict is predicted to be more severe for
the bike lane, mixing zone and the protected intersection. The two designs that are the most similar (conventional bike lanes and separated bike lane) in the placement of the conflict point, show a similar higher predicted severity with increasing vehicle speed. The other treatments show a declining probability of severity, including the pocket/keyhole bike lane, which had the highest observed vehicle speeds in the conflict areas. Finally, while not summarized in the table, we observed that site level marginal effects are also significant, suggesting some design level or other unexplained variance.
Table 72. Summary of Marginal Effects
| Treatment | Ordered Probit | Logit | ||
|---|---|---|---|---|
| Articulated truck, box truck, or bus | Conflict in same direction | Vehicle arrived first | Vehicle arrived first | |
| Conventional Bike Lane | 0.124 | -0.061 | 0.100 | 0.037 |
| Pocket / Keyhole Bike Lane | -0.126 | -0.017 | -0.027 | |
| Separated Bike Lane | -0.066 | 0.080 | 0.189 | 0.093 |
| Mixing Zone | 0.045 | 0.112 | 0.066 | |
| Protected Intersection | 0.036 | -0.043 | 0.153 | 0.094 |

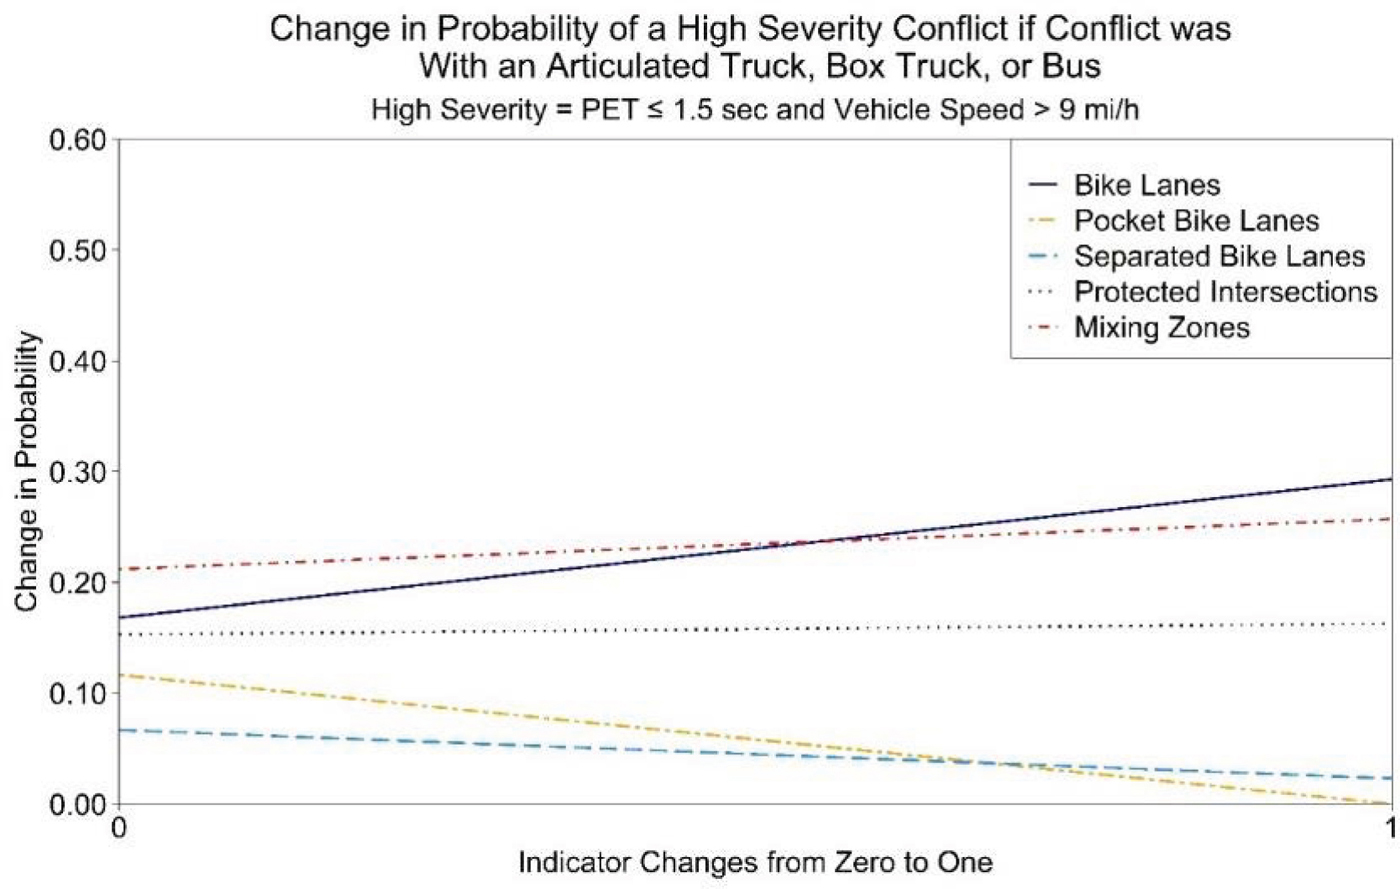

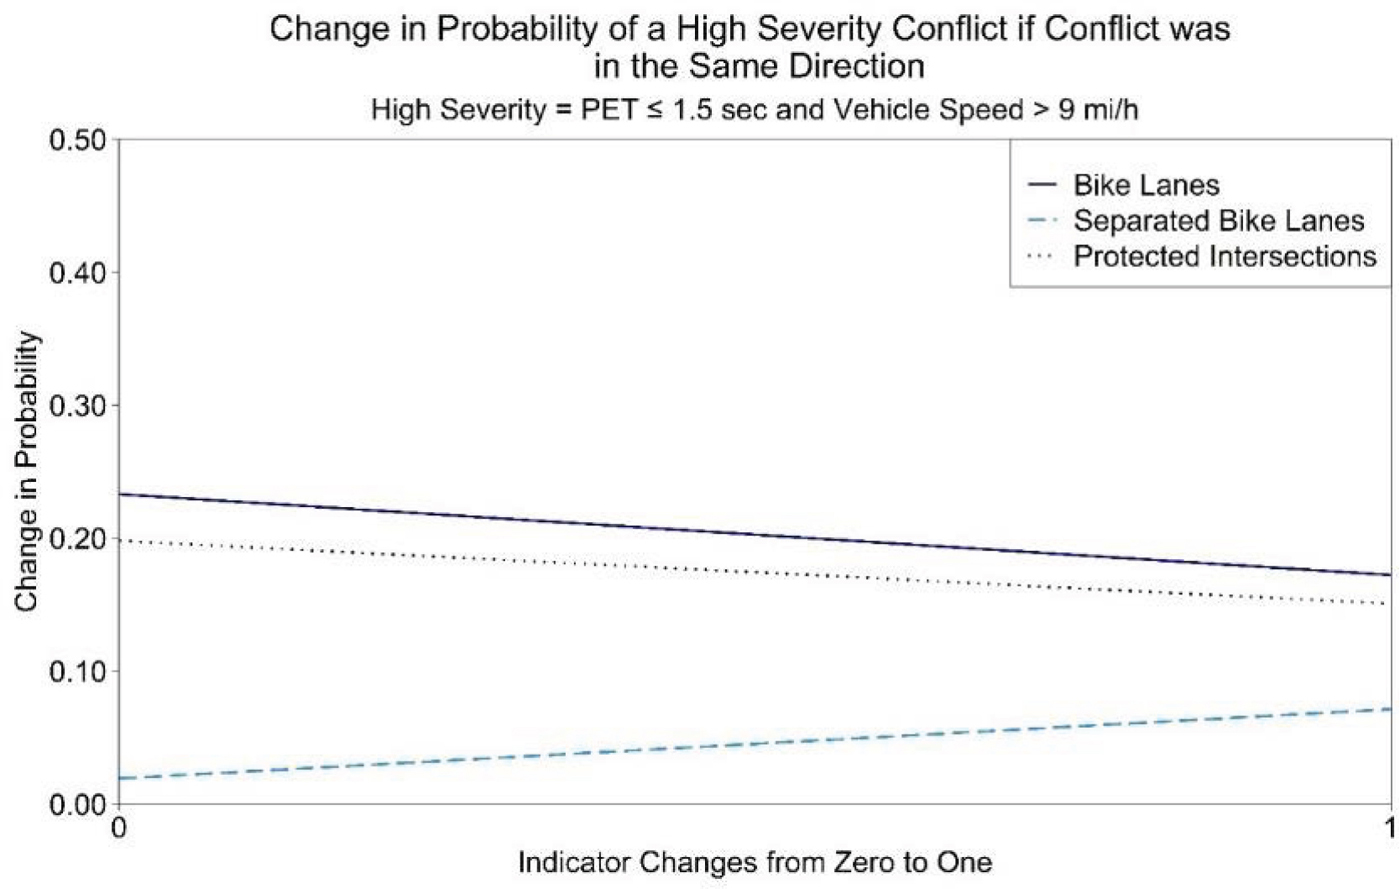
Comparison of Crash and Conflicts
At the sites selected for conflict analysis, the observed conflicts were compared to crashes to explore how conflicts correlate with crashes. Figure 28 shows the plot of turning crashes and total crashes at the approach per year and observed conflicts for PETs <=5 secs and PETs <1.5 secs per hour at 20 sites. The remaining sites (Linden Blvd. and Fountain Ave.; 12th Ave NE and NE 65th St.; 7th Ave. S and Stewart St.; Dexter Ave. N and Aloha St.; Roosevelt Way NE and NE 65th St.; 4th Ave. and 3rd St.; 9th St. and 6th Ave.) were not included in the comparison as these facilities were either installed in 2019 or later, which precluded the availability of crash data. There appears to be some correlation between observed crashes and conflicts, but the association is not strong perhaps due to the small sample size. The plots include the estimated r-squared value from a simple linear regression. The values indicate a reasonable correlation between conflicts and crashes.

Conflict Analysis Summary
This chapter presented the findings from the conflict analysis at 28 locations selected across four cities – Austin, Minneapolis, New York City and Seattle and encompassing five treatment types. The key findings are summarized below.
Conflict Frequency
- The protected intersection treatment type had the lowest percentage of the total conflicts (4.9%) classified into the high severity category (PET less than or equal to 1.5 seconds and vehicle conflict speed > 9 mi/hr). The pocket/keyhole bike lane had the largest percentage (16.1%) of its total conflicts observed in this high severity category followed by the conventional bike lane (10.9%), the mixing zone (6.1%) and the separated bike lane to the right of a shared turn lane (5.5%). The pocket/keyhole bike lane and the conventional bike lane had significantly higher percentage of total conflicts in the severity category as compared to the other treatment types (mixing zone, separated bike lane, and protected intersection).
- The models that were used to analyze conflict frequency confirmed that both bicycle volume and motor vehicle turning volume are significant predictors of the frequency of conflicts observed at each treatment type. The models of severe conflicts (low PET and high vehicle speed) predicted higher conflicts for a given bicycle and motor vehicle turning volume for the conventional bike lane and the pocket/keyhole bike lane. For all five treatment types, the contribution of the same direction motor vehicle turning volume was relatively consistent however, for the conventional bike lane and pocket/keyhole bike lane the bicycle volume was a significantly more important predictor of the total severe conflicts (as measured by the IRR) than the through same direction turning volume. This indicates that bicycle volume is a significant consideration when deciding to move to a higher treatment type design such as mixing zones, protected intersection or bicycle signal.
- For the small sample (28 sites) there is a reasonable correlation between observed PET values and reported total and turning bicycle-motor vehicle crashes. R-squared values ranged from 0.39 to 0.52.
Vehicle Speed and Arrivals
- There are clearly differences of the vehicle speeds that were observed at the conflict points, and we know that speed is associated with crash severity and worse injury outcomes.
- Vehicle speeds at the conflict point were highest for the pocket/keyhole bicycle lane (the design places the conflict point prior to the turn and deceleration area). The mixing zone designs had the lowest speeds at the conflict point probably because these treatments were installed on facilities with lower speeds and vehicle and the bicycle also have to navigate a shared space, followed by the Offset/Protected intersection locations.
- Turning speed variance, measured by the difference between the 85th percentile and the mean speed, was highest for the pocket/keyhole bike lane (5.02 mph). The variance for the other treatment types was about 3 mph. The increased range of speeds at the conflicts point, combined with overall higher conflict speed confirms that design of the pocket/keyhole bike lane, which moves the conflict point prior to the intersection, increases the probability that a conflict or crash between a motor vehicle and a bicycle will occur at a higher speed.
- The CS models identified that when the motor vehicle arrived first, the conflict was likely to be more severe. The observed locations and the selected treatment types had varying ranges of observed proportions of vehicles arriving first. Either the motor vehicle driver or the person on a bicycle can adjust approach speeds to change who arrives at the conflict point first. The conventional bike lane, the pocket/keyhole bike lane and the separated bike lane had about 40% of the conflict observations with the vehicle arriving first. The mixing zone had 60% of the vehicles arriving first and the protected
- intersection had 50%. It is not clear from this analysis how the treatment types might influence this operation.
Design and Operation
- While every effort was made to select sites that were consistent in design, the conflict frequency analysis and the severity analysis revealed that the individual sites were often significant in predicting both the conflict frequency and the severity. This indicates that there are important design level variables about each treatment type that are not fully explained in the models.
Vehicle Size and Type
- Probability of CS was higher if the conflict occurred with large vehicles (articulated truck, box truck, or bus).


