Design Options to Reduce Conflicts Between Turning Motor Vehicles and Bicycles: Conduct of Research Report (2024)
Chapter: 2 Literature Review
CHAPTER 2
Literature Review
The literature review first describes key study methods that have been used to assess bicyclist safety at intersections, including measures of perceived safety and of empirical safety, with the latter broken down by crash-based studies, safety performance, conflict studies, and simulator studies. After reviewing these study methods, the review then focuses on relevant findings arranged by finding topic area, with sections on crash types and patterns, crash contributing factors, bicycle intersection treatments, intersection features, and approach features. The review concludes with a discussion of applicable existing crash modification factors, and a summary of key findings and gaps from the literature review.
Measures of Safety
Two dimensions of safety must be considered in the design, operation, and construction of bikeways and associated intersection designs. First, for persons bicycling, perceived safety is critical because it influences decisions about whether to bicycle and which facility or route type to choose. Secondly, actual or empirical safety refers to crash events or surrogate measures for crashes. Empirical safety is essential because it is a direct performance measure to evaluate the impact of design choices on the safety of road users. The following sections describe various measures, contexts, and relationships of perceived and empirical safety. A summary of the studies evaluated can be found in Appendix A.
Perceived Safety
Recent research on user preferences and safety indicates bikeway designs should eliminate conflicts to the greatest extent possible (Porter et al. 2016). In general, greater separation from motor vehicle traffic along segments and at intersections increases comfort for people biking and those driving (Winters and Teschke 2010; McNeil et al. 2015; Sanders 2016; Warner et al. 2017; Abadi and Hurwitz 2018). Perceived comfort, specifically at intersections, has been identified as an important goal to increase bicycling rates, with separation from traffic and less complex designs preferred by users (Monsere et al. 2020a; Wang and Akar 2018b). Further, innovative treatments such as green bike lanes and bike signals have been viewed favorably by all road users (Monsere et al. 2015; Rahimi et al. 2013).
Providing high-comfort bikeways is an important consideration for cities attempting to build connected bicycle networks given the demonstrated link between perceived comfort, facilities, and ridership (Dill and Carr 2003, Broach et al. 2012, and Blanc et al. 2016). Continuity is also important, as people riding bicycles prefer to have their own dedicated through lane approaching intersections rather than operating in mixing zones with vehicles. Thus, intersection design and operation are critical, especially along routes with separated bike lanes, to create comfortable bike networks. However, system users’ perceived comfort and perceived safety are often insufficient information for most designers to select a treatment. Designers and practitioners need to feel confident that their decision to select a treatment is grounded in safety as measured by reported crash data or other safety surrogates, such as conflicts, low speeds at conflicts, or other similar indicators.
Methods to Measure Perceived Safety
Perceptions of safety, comfort, and stress of bicycle facilities are studied to determine whether and where bicyclists (and potential bicyclists) will ride. Perceptions of comfort may be measured as hypothetical or imagined scenarios, often through surveys presenting photos or videos of scenarios, through simulated environments, or via naturalistic studies of people bicycling through an environment. Surveys typically ask respondents to rate their sense of safety or comfort on a Likert scale (e.g., from very uncomfortable or very unsafe to very comfortable or very safe). Naturalistic studies may measure bio-physiological parameters to pick up on measures of stress. Several studies examined a stated level of comfort or safety for segments (e.g., Foster et al. 2015; McNeil et al. 2015; Sanders and Judelman 2018; Abadi and Hurwitz 2018; and Clark et al. 2019) and for intersections (e.g., Landis et al. 2003; Dill et al. 2012; Jensen 2013; Monsere et al. 2015; Monsere et al. 2019). While there is a tendency for some researchers to prefer biophysical feedback overstated preferences, there is no evidence that one type of study better measures perceived safety than another.
Level of Service/Level of Traffic Stress
Level of service (LOS) measures, such as in the Highway Capacity Manual (HCM), presume to measure satisfaction with a travel environment. For motorists at intersections, LOS is based on average control delay. However, for pedestrians and bicyclists, LOS is more reliant on users’ perceptions of safety and comfort.
HCM bicycle LOS, or BLOS, considers factors such as outside lane width, crossing distance, motor vehicle through and turning volumes, and presence of on-street parking (TRB 2010). BLOS scores can be calculated for links (segments) and intersections. At signalized intersections, the variables that influence BLOS (and their direction of influence as the variable increases) are:
- Width of outside through, bicycle, and parking lanes, paved shoulder (↑)
- Width of street (cross-street) (↓)
- Motor vehicle traffic volume (through, right, and left on approach) (↓)
- Presence of occupied on-street parking (↓)
None of the bicycle intersection designs described as the focus of this research (mixing zone, pocket bike lane, offset/protected intersection, bicycle signals) can be evaluated with BLOS. The bicycle level of traffic stress, or BLTS, is an index system and tool assigned to each segment and crossing of a network. BLTS scores range from one (LTS=1) for a facility that most children would tolerate to four (LTS=4) for a facility that only experienced and confident cyclists would tolerate (Mekuri, Furth and Nixon 2012). Unsignalized intersections are evaluated in the context of crossing the major street. Signalized intersections are evaluated only in the context of interacting with right-turning traffic. The presence and type of right turn lane (dual or single), length of the right turn lane (<75 feet, 75 feet to 150 feet, >150 feet), turning speed of vehicles (<15 mph), and intersection geometries are used to establish the level of traffic stress.
Empirical Safety
Crash-Based Studies
Crash data is the primary source of safety data in most analyses. These data are accessed through databases that states (or, in some cases, cities) maintain, with the data being generated from police records following a crash (and, in some cases, citizen self-reports). Overall, safety analysis using crash data can be methodologically challenging due to the well-known limitations, including low frequency of event types at any one intersection or segment, reporting rules and databases designed to monitor motor vehicle safety,
and inaccurate or incomplete coding of crashes. Additionally, crash databases exclude many bicycle crashes because they do not meet the reporting requirements of property damage or injury thresholds, involvement with a motor vehicle, or the location requirements (i.e. on the public right of way).
Stutts and Hunter et al (1999) estimated that 69% of bicycle crashes reported to hospital emergency rooms occurred on roadway locations, and 45% of bicycle roadway crashes involved a collision with a motor vehicle. Lopez et al. (2012) found that 54.5% of bicycle-related injuries treated at San Francisco General Hospital from 2009-13 were not associated with a police report. Nevertheless, crash data represent a direct way to assess safety. Crash frequency, severity, rates, and risk are commonly used to assess safety at intersections. Crash frequency refers to the number of crashes at a given location over a specified period. Crash severity refers to the injury level and damage incurred in a crash. Typically, severity is denoted by the KABCO scale (K = fatal injury, A = incapacitating injury, B = non-incapacitating injury, C = possible injury, O = property-damage only) (NHTSA 2017). Crash severity codes are used to establish crash costs.
Crash frequency data is often paired with exposure measures related to the number of cyclists to compare the potential opportunities for a crash to occur (Turner et al. 2018). A commonly used exposure measure in safety analysis is bicycle counts, measured directly from site counts collected through automated or manual means, or estimated using models (direct demand, regional travel demand models). Crash rates describe the number of crashes in a given period compared to the traffic volume (or exposure) to crashes. Crash rates are calculated by dividing the total number of crashes at a given roadway section or intersection over a specified period (typically three to five years) by a measure of exposure. Crash risk is the ratio of expected or measured crashes by kind and severity to some measure of exposure (Turner et al. 2018).
Although police recorded crash data has improved over time, it primarily focuses on the crash’s physical circumstances. It excludes many pre-crash and post-crash factors that affect crash rates and injury outcomes (Cherry et al. 2018). Recent research has focused on linking pre-crash and post-crash datasets to crash data. Pre-crash data sets include data that can be used to predict factors that influence crashes, such as citation histories, meteorological data, naturalistic data, or crowdsourced data. Other complementary post-crash datasets like hospitalization data exist and can provide a complete picture of safety if combined with the crash data (Cherry et al. 2018). In addition to hospitalization data, previous linkage efforts have focused on medical insurance claims databases, emergency medical systems data, and vital statistics (Cherry et al. 2018). Recent work has used hospital records and interviews to explore the safety of separated bikeways (Cicchino et al. 2020). While this is an emerging area of research, health data is hard to obtain due to strict privacy regulations in the U.S. and is not often recorded with the location accuracy needed for transportation safety analysis at the design level. Thus, many safety studies continue to rely on crash data.
Safety Performance
Crash modification factors (CMFs) are used to evaluate safety effectiveness, such as to compute the expected number of crashes after implementing a countermeasure on a road or intersection (AASHTO 2010; FHWA 2021). In road safety research, most safety effectiveness study designs are observational designs where data are collected from sites where the treatment has already been implemented (Gross et al. 2010). Experimental designs, like those in medical research, where sites are identified for treatment and then randomly assigned to either a treatment or an untreated control group, are relatively rare in transportation (Gross et al. 2010).
Two methodological approaches are commonly used for observational study designs – before and after studies (B/A) and cross-sectional studies (C/S). According to Hauer, before and after studies are “techniques by which one may study the safety effect of some change that has been implemented on a group of entities (e.g., road sections, intersections, drivers, vehicles, neighborhoods).” In contrast, cross-sectional studies compare “the safety of one group of entities having some common feature (e.g., stop-controlled
intersections) to the safety of a different group of entities not having that feature (e.g., yield-controlled intersections) in order to assess the safety effect of that feature (stop vs. yield signs)” (Hauer 1997). Other methods include case-control studies, cohort, meta-analysis, expert panel, and surrogate measure studies. These are summarized in the following subsections and in Table 1.
Table 1. Summary of methods to evaluate safety performance
| Method | Description | Pros | Cons |
|---|---|---|---|
| Simple Approach | Compares raw frequencies before and after treatment. | Simple to implement. | Can produce biased estimates because changes in variables (traffic conditions, weather, land use etc.) and regression-to-mean bias not accounted for. |
| Comparison Group | Untreated groups of sites are compared to treated groups of sites to account for changes in crashes unrelated to the treatment. | Alternative to complex empirical Bayes approach when regression-to-the-mean is not present, and a suitable comparison group is available. | Method does not account for regression-to-the-mean bias unless treatment and comparison sites are carefully selected and matched based on the observed crash frequency in the before period. |
| Empirical Bayes | Estimates the number of crashes that would have occurred at a treatment site in the after period if the treatment had not been installed. | Accounts for the regression-to-the mean and traffic volumes and time trends in a more robust way. | More complex to implement compared to the simple and comparison group approaches. |
| Full Bayes | A reference group is used to generate a distribution of the likely values of the expected crash frequency and its variance, which is then combined with the observed crash frequency to estimate the long-term expected crash frequency. | The CMF can be estimated more accurately; modeling framework allows for complex model forms; valid models can be estimated with smaller sample sizes; spatial correlation between the sites can be considered; prior knowledge can be incorporated. | Complexity of the application and the level of statistical training required for model estimation. |
| Cross-Sectional Studies | CMF is estimated as the ratio of the average crash frequency for sites with and without treatment. | Approach is useful for estimating CMFs when there are insufficiently treated sites. | Observed crash differences in the two groups may be due to known or unknown factors; unknown or known by unmeasured factors cannot be accounted for. |
| Method | Description | Pros | Cons |
|---|---|---|---|
| Case-Control Studies | Assess whether exposure to a potential treatment is disproportionately between the cases and controls, indicating the likelihood of a benefit from the treatment. | Useful for studying rare events due to the predetermination of cases and controls. | Care must be taken to ensure that cases and controls are representative of the sites being studied; approach cannot determine causality because time sequence is not accounted for in the analysis. |
| Cohort Studies | Estimate relative risk, which is the expected percent change in the probability of an outcome given a unit change in the treatment. | Useful for studying rare treatments, and several outcomes can be studied for a particular treatment; methodologically stronger than case-control studies because groups can be carefully designed and selected independent of the outcome of interest. | Cost and time restrictions are drawbacks of this method as large samples and long follow-up periods may be required; care must be taken to ensure that treatments and confounding variables are accounted for properly; actual increase in risk may be underestimated. |
| Meta-Analysis Studies | Systematic way of combining knowledge on CMFs from multiple previous studies to derive a final CMF while considering the study’s quality. | Beneficial when the expected reduction in crashes is small, but many studies are available, individual estimates from which can be combined to increase the statistical power. | Sensitivity and publication bias are two issues with meta-analysis studies. |
| Expert Panel Studies | Formed to critically evaluate the findings of published and unpublished studies and CMFs are derived through consensus. | Similar to the meta-analysis approach but is less formal. | Repeatability and accuracy of results, results differing across panels. |
Before and After Studies
In before and after studies (B/A), data are gathered before and after a treatment has been implemented at a given site. Several approaches are used within the before-after study design to evaluate safety. These include simple approach (naive before-after), comparison group, empirical-Bayes, and full or hierarchical Bayes (Gross et al. 2010).
Simple Approach
The simple approach used for B/A analysis compares the raw crash frequencies before and after treatment installation, assuming that past trends will predict future crash counts (Monsere et al. 2017). While this method is simple, it can produce biased estimates because changes in traffic conditions, weather, land use, traffic control, crash reporting levels, installation of other treatments, and regression-to-the-mean bias are
not accounted for (Gross et al. 2010). Additionally, the statistical analysis cannot determine if the safety effect is due to the treatment or other factors (Hauer 1997).
Comparison Group
In a before-after comparison group study, untreated groups of sites are compared to treated groups of sites to account for changes in crashes unrelated to the treatment (Gross et al. 2010). The ratio of observed crashes in the after period to the before period is computed for the comparison group. The observed crash frequency in the before period for the treatment group is multiplied by this ratio to obtain a modified crash frequency had no treatment been applied. This modified crash frequency in the before period is then compared to crash frequency in the after period at the treated sites to estimate the treatment’s safety impacts (Gross et al. 2010).
It is recommended that the comparison sites be drawn from the same jurisdiction as the treated sites; however, this may be challenging to do (Gross et al. 2010). Hauer recommends that a test of comparability be performed to select potential comparison groups for the treated sites (Hauer 1997). A comparison group is considered good if the annual trend in crash frequencies is similar to the treatment group before treatment. Additional requirements for a suitable comparison group are that the before and after periods for the treatment and comparison group should be the same, change in factors other than the treatment under study should be the same in the treatment and comparison groups, and the crash counts must be sufficiently large (Hauer 1997). This method also does not account for the regression-to-the-mean bias unless treatment and comparison sites are carefully selected and matched based on the observed crash frequency in the before period (Gross et al. 2010). However, when regression-to-the-mean is not present and a suitable comparison group is available, the comparison group method can be an alternative to the complex empirical Bayes approach (Gross et al. 2010).
Empirical Bayes
The empirical Bayes method estimates the number of crashes that would have occurred at a treatment site in the after period if the treatment had not been installed. In this method, the sum of estimated crashes from the treatment sites is compared with the actual number of observed crashes after treatment. Compared to the comparison group, this method accounts for regression-to-the-mean effects (Gross et al. 2010). To correctly account for the regression-to-the-mean, the number of crashes in the before period is a weighted average of the number of crashes observed in the before period at the treated sites and the number of predicted crashes at the treated sites based on reference sites with similar traffic and physical characteristics (Gross et al. 2010).
A safety performance function (SPF) is estimated first to predict the average crash frequency for similar locations and then used to predict the number of crashes at treated sites based on similar operational and geometric characteristics (Gross et al. 2010). An SPF is a mathematical model that predicts the mean crash frequency for similar locations with the same characteristics such as traffic volumes, traffic control, and geometry (Gross et al. 2010). Compared to the comparison group approach, the SPF accounts for the regression-to-the mean, traffic volumes, and time trends in a more robust way (Gross et al. 2010).
Full Bayes
Full Bayes is a modeling approach used in the same manner as a generalized linear modeling approach (Gross et al. 2010). In this approach, a reference group is used to generate a distribution of the likely values of the expected crash frequency and its variance, which is then combined with the observed crash frequency to estimate the long-term expected crash frequency (Gross et al. 2010). Due to the use of a distribution rather than a point estimate which is used in the empirical Bayes method, the CMF can be estimated more
accurately (Gross et al. 2010). The advantages of the Full Bayes method are that the modeling framework allows for complex model forms (which are not possible with the generalized linear modeling approaches), valid models can be estimated with smaller sample sizes, spatial correlation between the sites can be considered, and prior knowledge can be incorporated (Gross et al. 2010). A disadvantage of this approach is the complexity of the application and the level of statistical training required for model estimation (Gross et al. 2010).
Cross-Sectional Studies
In this approach, the CMF is estimated as the ratio of the average crash frequency for sites with and without treatment. This approach is useful for estimating CMFs when there are insufficiently treated sites (Gross et al. 2010). However, when there are sufficiently treated sites, the B/A design is preferred. CMFs estimated using the cross-sectional approach generally indicate smaller expected crash reductions than those from B/A studies (Gross et al. 2010). Since it is difficult to collect data for enough locations that are alike, cross-sectional analyses are often conducted using multiple regression models accounting for all variables that affect safety, with the CMFs being derived from model parameters (Gross et al. 2010). The issue with a cross-sectional design is that the observed crash differences in the two groups may be due to known or unknown factors. While known factors such as traffic volume or geometric characteristics can be accounted for in the regression models, unknown or known but unmeasured factors cannot be accounted for (Gross et al. 2010). Therefore, CMFs developed by this method should be used with caution (Gross et al. 2010).
Case-Control Studies
Case-control studies are based on cross-sectional data, with the sites selected based on the outcome of a status (crash, no crash) and prior treatment status within each outcome group (Gross et al. 2010). These studies assess whether exposure to a potential treatment is disproportionate between the cases and controls, indicating the likelihood of a benefit from the treatment (Gross et al. 2010). The CMF, expressed as an odds ratio, is the expected increase or decrease in the outcome due to a treatment, with an odds ratio of greater than 1 indicating an increase in risk due to the treatment’s presence (Gross et al. 2010). This approach is often used to show the relative effect of treatments using multiple logistic regression techniques (Gross et al. 2010). A matching scheme may be used to produce a balanced design (Gross et al. 2010). This method is useful for studying rare events due to the predetermination of cases and controls.
Additionally, multiple treatments can be investigated in relation to a single outcome using the same sample (Gross et al. 2010). While using this approach, care must be taken to ensure that cases and controls are representative of the sites being studied (Gross et al. 2010). This approach cannot determine causality because time sequence is not accounted for in the analysis (Gross et al. 2010).
Cohort Studies
Cohort methods estimate relative risk, which is the expected percent change in the probability of an outcome given a unit change in the treatment (Gross et al. 2010). Relative risk is a direct estimate of a CMF. Sites are categorized into a cohort based on current treatment status and followed over time to observe exposure and event frequency (Gross et al. 2010). The time at risk between different cohorts is assessed, with disproportionate times at risk indicating the treatment’s relative effect (Gross et al. 2010). Pair matching and frequency matching are options to account for potential confounding variables (Gross et al. 2010).
Cohort studies are useful for studying rare treatments, and several outcomes can be studied for a particular treatment (Gross et al. 2010). These studies are also methodologically stronger than case-control studies
because groups can be carefully designed and selected independent of the outcome of interest (Gross et al. 2010). Cost and time restrictions are drawbacks of this method as large samples and long follow-up periods may be required (Gross et al. 2010). Additionally, care must be taken to ensure that treatments and confounding variables are accounted for properly (Gross et al. 2010). The actual increase in risk may be underestimated with this method because locations with multiple crashes or a single crash are not differentiated, and only the time to first crash is analyzed (Gross et al. 2010).
Meta-Analysis Studies
Meta-analysis is a systematic way of combining knowledge on CMFs from multiple previous studies to derive a final CMF while considering the study’s quality (Gross et al. 2010). The process consists of defining the meta-analysis topic precisely, conducting a systematic search for relevant studies, defining study inclusion criteria, determining which data to extract from each study, and converting estimates of effect to a common scale (Elvik 2005). For an effective meta-analysis, all studies should be similar in terms of data used, outcome(s) measure, and study methodology (Gross et al. 2010). Each study should also include an estimate of the CMF standard error (Gross et al. 2010). These studies are beneficial when the expected reduction in crashes is small, but many studies are available, and individual estimates can be combined to increase the statistical power (Gross et al. 2010). Weighted averages may also be used to combine the estimates (Gross et al. 2010). Sensitivity and publication bias are two issues with meta-analysis studies (Gross et al. 2010).
Expert Panel Studies
Expert panels are formed to critically evaluate the findings of published and unpublished studies (Gross et al. 2010). Each panel selects reliable studies and derives CMFs through consensus (Gross et al. 2010). An expert panel is similar to a meta-analysis but less formal. The panel aims to develop a weighted average CMF through a discussion of research and informally assign weights to each CMF estimate (Gross et al. 2010). Yet, issues remain with expert panel studies due to the impossibility of repeatability and accuracy of results if results differ across panels.
Summary of Crash Data Evaluation Methods
Although reported crash data suffer from shortcomings, they represent the most direct approach to evaluate safety. Crash analysis can be useful if sites are selected with care for analysis and sufficient samples are obtained. This section reviewed the variety of methods that exist for the development of CMFs and safety evaluation.
Conflict Studies
If crash data are not available, surrogate measures such as vehicle speeds, lane departure encroachments, compliance, and traffic conflicts can be used to estimate safety indirectly. Conflicts are among the most common surrogates and are defined as interactions between road users on the same paths. Surrogate safety measures based on conflict data are broadly divided into four groups - time to collision measures (TTC), post encroachment time (PET) measures, deceleration measures, and combined measures. Conflict data are often analyzed to overcome the limitations of crash data pertaining to under-reporting, rarity, and the limited information they provide of behavioral and environmental aspects of crashes (Laureshyn et al. 2010).
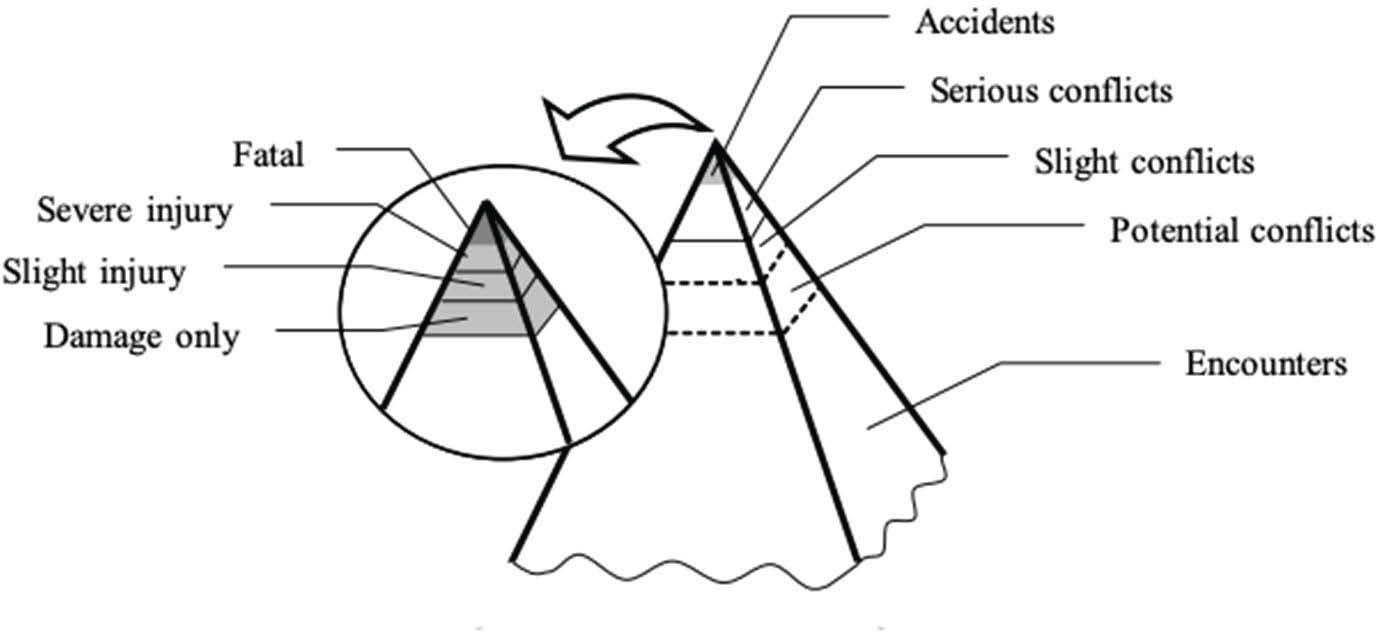
Surrogate safety measures are based on the concept that traffic flow consists of a number of events that differ in their degree of severity and that a relationship exists between the frequency and severity of events (Svensson and Hydén 2006). This relationship is described by Hydén as a safety pyramid (see Figure 2), with the base of the pyramid containing normal events that are safe and frequent, while the tip contains the
events that result in injuries or fatalities and are infrequent (Hydén 1987). Various studies have suggested that a strong correlation exists between serious conflicts and the frequency of crashes (Brown 1994; El-Basyouny and Sayed 2013; Hydén 1987; Lord 1996; Migletz et al. 1985; Sacchi et al. 2013), but only one study has explored the relationship between bicycle-vehicle conflicts and crashes, and only then through self-reported near misses (Sanders 2015).
Zangenehpour et al. (2016) examined various configurations of cycle tracks and extracted surrogate safety measures (PET) and compared them to existing crash history. The results of the rank-based analysis of the two methods were strongly correlated. A recent study explored the relationship between crashes and conflicts for bicycles in Sweden using crash data, naturalistic data, and count data and found that near misses occurred at locations where crashes occurred, indicating a possible relationship, although the results were not statistically significant (Dozza 2019). Johnsson et al. suggest that an ideal indicator should reflect collision risk and injury risk, have robust validity, and be reliable (Johnsson et al. 2018). A recent study compared the relationship between bicycle-motor vehicle left- and right-turning crashes with conflicts at signalized intersections using the surrogate safety indicators TTCmin and PET (Johnsson et al. 2021). Their findings revealed that a significant relationship exists between the expected number of crashes and both conflict indicators. However, this correlation may be related to a connection between indicators and the number of interactions between the users (exposure).
TTC and Related Measures
TTC is defined as the time until a collision between the vehicles would occur if they continued on their present course without changing speed (Hayward 1972). Lower values of TTC may indicate a higher probability of a collision. TTC’s are difficult to measure in the field but can be quantified with simulation models or with automated computer vision tools (Figliozzi et al. 2017). Variations of TTC include time-exposed TTC (TET), time-integrated TTC (TIT), and Time-to-Zebra (TTZ). TET measures the length of time during which all vehicles involved in a conflict are below a minimum TTC threshold (Minderhoud and Bovy 2001). TIT measures the difference between the threshold TTC value and the observed TTC. It is calculated over the time interval when the vehicle is on the road segment, thus reflecting exposure (Minderhoud and Bovy 2001). TTZ is the time taken for the vehicle to reach a zebra crossing when a pedestrian starts crossing (Varhelyi 1998). T2, proposed by Laureshyn et al., is the predicted arrival time of the second road user, estimated while the first road user has not left the conflict point yet (Laureshyn et al., 2010). A recent conflict analysis of bicyclists and right-turning traffic at signalized intersections utilized
a T2 calculation, in combination with vehicle speeds, to assess the severity of conflict (Mansell et al., 2024). If the road users are on a collision course, then T2 is equal to TTC.
PET and Related Measures
PET is defined as the time between the first road user leaving the conflict area and the second road user arriving there (Allen et al. 1978). A PET value less than a threshold value is considered a conflict (Songchitruska and Tarko 2004). Estimating PET is more straightforward than other surrogate measures as it does not need data on speed and direction (Figliozzi et al. 2017). A limitation of PET is that road users can enter the conflict area at a right angle, be within the minimum threshold and never collide. To overcome this limitation, Laureshyn proposed defining PET as the minimal delay of the first road user, which, if applied, will result in a collision course and a collision (Laureshyn et al. 2010).
Gap time, closely related to PET, is the difference between the arrival times of the two road users at the point of crossing, provided no evasive actions are taken (Glauz and Migletz 1980). Time advantage (TAdv) is used to describe situations where two road users pass a common area but at different times, thereby avoiding a collision (Hansson 1975). TAdv is seen as an extension of the PET. While PET is a single value for each event, TAdv calculates the PET value for each moment if the road users continue with the same speeds and paths (Laureshyn et al. 2010).
Deceleration and Related Measures
Deceleration-based surrogates estimate or measure deceleration rates necessary to avoid a collision (Figliozzi et al. 2017). The deceleration rate is a measure of the highest rate at which a vehicle decelerates to avoid a collision in response to another vehicle’s erratic movement (Songchitruska and Tarko 2004). Deceleration rate to avoid a crash (DRAC) is the ratio of the difference in speeds between a following and leading vehicle and their collision time. The leading and the following vehicles are responsible for the initial and evasive action (Almquist et al. 1991). Proportion of stopping distance is the ratio of the distance remaining to be traversed to the projected collision point to the minimum acceptable stopping distance (Allen et al. 1978). Crash Potential Index improves upon DRAC by including the probability that DRAC of a vehicle is higher than its braking capacity or maximum deceleration rate (Cunto and Saccomanno 2007).
Other Indicators
Other indicators include conflict severity (CS) and extended DeltaV. CS is a combination of DeltaV, Time-to-Accident (TA) (available breaking time, or time to accident) and assumed maximum average deceleration (Bagdadi 2013). DeltaV indicator is the change in velocity and depends on the speed and mass of each road user and the angle at which the road users approach each other (Shelby 2011). TA and maximum average deceleration are used to estimate the effectiveness of the evasive actions. Laureshyn et al. (2017) proposed an extended DeltaV indicator which combines DeltaV with the T2 indicator and a deceleration constant. Kuang et al. used an indicator called the aggregated crash index (ACI), which is meant for car-following scenarios and comprises four conditions: both the initial conditions of a conflict and the evasive actions (Kuang et al. 2015). ACI is calculated as the accumulation of collision probabilities of all possible outcomes (Johnsson et al. 2018).
Ogawa developed a space occupancy index based on personal space which includes the space necessary for pedestrians, bicyclists, and vehicles (Ogawa 2007). An area surrounding the road user is defined based on each road user type’s characteristics, and the number of conflicts is estimated as the number of personal space incursions (Ogawa 2007). Cantisani et al. (2018) studied the risk of collision between cyclists-motor
vehicles at urban intersections with and without bike paths using the available stopping time (AST), which is defined as the time available to a user to avoid a collision.
Combination of Indicators
Sometimes indicators are combined with other indicators to get a better understanding of safety. This approach is based on the premise that many indicators cannot be applied to all traffic events (Johnsson et al. 2018). This approach is most commonly seen in traffic conflict techniques developed in the 1970s and 1980s.
Traffic Conflict Methodologies
Various methodologies have been developed to study traffic conflicts, which use one or more of the previously described surrogate measures. Prominent among these methods are the Swedish Conflict Technique (Swedish TCT), Dutch Conflict Technique (DOCTOR), and the probabilistic surrogate measures of safety (PSMS). Swedish TCT differentiates between non-severe and severe conflicts, and the severity ranking is based on two indicators - TA, which is the TTC when evasive action was taken, and Conflicting Speed (CS) which is the speed of the road user when the evasive action was taken (Laureshyn et al. 2017). In the DOCTOR method, the probability of collision is determined by TTC and PET. A minimum TTC of 1.5s or less is considered critical, while PET values lower than 1s in urban areas are considered as possibly critical. PSMS uses motion prediction methods to estimate road users’ future position probability at each time interval along with TTC and PET (Mohamed and Saunier 2013).
Other less commonly used techniques include the American conflict technique, which defines conflicts as occurrences of evasive actions which can be identified by braking or weaving maneuvers (Parker and Zegeer 1989), and the Canadian conflict technique, which uses TTCmin (less than 2s, less than 1.6s, and less than 1s) along with a subjective risk of collision (low, moderate and high) to determine the severity of a conflict (Brown et al., 1984). Laureshyn et al. (2017) compared the three methods using crash and conflict data from three sites in Oslo, Norway, consisting of one large intersection on an arterial street with bike lanes in each direction and advanced stop lines for cyclists; one intersection with bike lanes only one side and absent on the other side; and a roundabout in a residential/recreational part of the city with bike lanes on two legs merging with motorized traffic just before the intersection. The findings revealed similarities between the three conflict methods: the Swedish and Dutch conflict techniques agreed on the number, types, and locations of conflicts, but displayed some differences for no obvious reason. Many more interactions, including the less severe events, were observed with PSMS, which is compatible with the TCTs, but may include a significant share of false alarms (Laureshyn et al. 2017).
Summary of Conflict Measures
The use of surrogate safety measures to examine bicycle safety has been gaining traction in recent years. Conflicts, which are much more numerous than actual crashes, have been shown to relate to safety outcomes, and can be stratified according to their severity. Table 2 presents the summary of the surrogate safety measure reviewed in this section. A number of surrogate safety indicators and conflict techniques have been used to study bicycle-motor vehicle conflicts, though the TTC family of measures and PET remain the most commonly used indicators. This study will examine conflicts using Transoft Solutions’s automated vision processing software (PET as the surrogate safety indicator and speed of vehicles) at a further targeted scale to provide additional insight into the dynamics between bicycle safety and known risk factors like turning volumes and design features.
Table 2. Summary of key research using surrogate measures for vulnerable road users
| Study | Objective | Surrogate Measures |
|---|---|---|
| Lord 1996 | Pedestrian-vehicular left-turn conflicts at T-intersections and X-intersections | U.S. conflict technique, TTC, CS, PET |
| Zanegenehpour et al. 2016 | Safety at signalized intersections with cycle tracks | PET |
| Laureshyn et al. 2017b | Cross comparison of three traffic conflict techniques for bicyclist safety at intersections in Norway | TTA, CS, TTC, PET evaluated by Swedish TCT, DOCTOR and PSMS methods |
| Cantisani et al. 2018 | Collision risk analysis between bicyclists-motor vehicles at intersections | AST |
| Dozza 2019 | Relationship between near misses and collisions | Not specified |
| Johnsson et al. 2021 | Validation of surrogate measures of safety with a focus on bicyclist-motor vehicle interactions | TTCmin, PET |
Driving and Bicycling Simulator Studies
Since the first primitive flight simulators were used in 1910, various automobile, truck, ship, motorcycle, and bicycle simulators have been developed and are widely used for educational (e.g., research, design, and training) and recreational (e.g., theme parks and video games) purposes (Moore 2008). The bicycle simulator has been one of the more challenging simulators to develop due to the inherently unstable dynamics of the bicycle coupled with the dynamics of the human rider. In addition, there are difficulties associated with the real-time simulation of human-controlled and human-powered vehicles moving in a virtual environment (Kwon et al. 2001). Different forms of bicycle simulators have been utilized in medical science (Deutsch et al. 2012; Ranky et al. 2010; Vogt et al. 2015), sport science (Watson and Swensen 2006), video games (ElectronicSports 2008), and mechanical engineering (He et al. 2005; Jeong et al. 2006). However, very few studies have employed bicycling simulation in the context of transportation safety.
Simulators offer the opportunity to construct and evaluate novel treatments that are currently not widely implemented, ease the data collection process, provide an environment that is safe and replicable, allow for the study of road users’ reactions to dangerous situations without being physically at risk, and allow for feedback (Wang et al. 2007). Experiments in simulators can be designed to carefully control for confounding factors and have all subjects interact in a statistically valid random design. Technological advances in hardware and software and reduction in cost have led to increased adoption of simulators (Wang et al. 2007). However, the general drawback is that the number of total scenarios that can be modeled in a single experiment is relatively limited. Like surrogate measures, the link between the performance measure in the simulator and actual crash data must be established.
Various studies using a simulator were conducted to evaluate the influence of distraction, driving performance (gap acceptance, lane change, speeding, passing), characteristics of young drivers (risk-taking), collision avoidance, signs, markings, and new infrastructure (Wang et al. 2007). Simulators have also been used to evaluate intelligent transportation system applications such as adaptive cruise control systems, head-up or head-down displays, collision and crash warning systems, and other new in-vehicle technologies (Wang et al. 2007). Driving simulators typically consist of a vehicle cab mounted on the pitch
motion system with the driver’s eye point located at the center of the viewing volume (Hurwitz et al. 2015). The pitch motion system allows for the accurate representation of acceleration or deceleration. Researchers build the environment and track subject drivers from within the operator workstation (Hurwitz et al. 2015).
Major elements of a typical bicycle simulator include cueing systems (visual, auditory, proprioceptive, and motion), bicycle dynamics, computers and electronics, bicycle frame and control, measurement algorithms, and data processing and storage. Cueing systems involve stimulation of all rider sensory and perceptual systems. In each of the cueing systems, the appropriate stimulus resulting from the cyclist’s control inputs must be computed and then accurately displayed to the cyclist. Cues such as steering feel are a direct consequence of the cyclist’s control response and resulting bicycle reaction. Motion cues are a function of the bicycle’s dynamic response to rider control inputs, with additional independent inputs due to dynamic roadway disturbances. Visual and auditory cues can result in rider/bicycle responses and have significant independent inputs from dynamic roadway elements (Fisher et al. 2011).
The simulators allow for high-resolution data collection, including time, instantaneous speed, instantaneous position, instantaneous acceleration and deceleration, and visual attention. These observations are used to estimate human-factors responses such as eye glances, eye fixation durations, stress levels, and other measures. Safety can also be inferred or estimated using surrogate safety measures, error patterns, or collisions (Fisher et al. 2011).
A driving simulator may be validated in an absolute (Hurwitz et al., 2012) or relative (Bella 2005; Törnros 1998; Knodler 2001) manner, based on observed differences in any performance measures, such as speed or lateral position. For a simulator experiment to be useful, it is not required that absolute validity be obtained; however, relative validity must be established (Hurwitz et al. 2012). Horne et al. (2018) proposed a speed calibration procedure to increase the simulator results’ validity and found that the final simulation speed after implementing the procedure was within 99.5% of the bicycle computer speed, indicating that the bicycle speed was accurately captured in the simulator. Another study assessed the behavioral validity of participants in the bicycle simulator using spatial position measures (average lane position, deviation in lane position, average passing distance from curbside parked cars), speed measures (average speed of cyclists, speed reduction on approach to intersections) and head movement (O’Hern et al. 2017). Their findings revealed that aspects of cyclist behaviors could be modeled in the bicycle simulator; however, more research may be needed to validate head movement (O’Hern et al. 2017).
Findings
The following sections in this chapter describe the results of the literature review focused on bicycle intersection safety.
Crash Types and Patterns
Early efforts to classify motorist-bicyclist crash types were developed in the 1970s by NHTSA (Cross and Fisher 1977). That study explored 919 fatal and non-fatal crashes from select areas in California, Colorado, Florida, and Michigan and arrived at seven crash types which accounted for half the crashes studied (Thomas et al. 2019). These crash types included bicyclist riding out of the driveway or alley, a bicyclist riding out at a stop-controlled intersection, a motorist driving out of the driveway, a motorist driving out of a two-way stop-controlled intersection, motorist overtaking, a bicyclist turning left across motorist’s path and motorist turning left across bicyclist’s path (Thomas et al. 2019). Hunter et al., improved upon NHTSA’s crash typing methodology by evaluating 3,000 motorist-bicyclist crashes in the U.S. and found that half of the crashes either occurred at or were related to intersections (Hunter et al. 1996). Common crash types included bicyclist and motorist failure to yield for crossing path crashes and motorist turning or merging into bicyclist’s path, motorist overtaking, and bicyclist turning or merging into
motorist’s path for parallel path crashes. Subsequently, the Pedestrian and Bicycle Crash Analysis Tool (PBCAT) was developed to code bicycle and pedestrian crashes in the late 1990s and was refined in 2006 (Harkey et al. 1999, 2006).
Schneider and Stefanich (2016) applied both the PBCAT crash typing and alternate typing scheme (location-movement) to 229 bicycle crashes reported to police in Wisconsin. About 39% of crashes occurred at intersections (both stop-controlled and signalized intersections). The most common fatal intersection crash type involved motor vehicles traveling straight with bicycles in crossing paths (24%). Crashes typed to involve left and right turning vehicles were only 6% of fatal injuries but 32% of severe injuries and 38% of minor or no injury crashes. Recent research suggests that left turn crashes are less prevalent but result in more severe injury for bicyclists (Seattle Department of Transportation, 2020). Recently, Thomas et al. (2019) compared fatal bicyclist crash types from national data with serious injury and all-severity bicyclist collisions from North Carolina and Boulder, CO. At urban intersections, 720 crashes from the national sample (fatal only) were compared to 1,934 (all severity) crashes in North Carolina, and 830 (all severity) crashes in Boulder. There were differences when comparing the most common crash types across the jurisdictions. However, four crash types were in the top five in all jurisdictions: bicyclist failed to yield (signalized intersection), motorist right turn/merge, motorist failed to yield (sign-controlled), and motorist left turn/merge.
Crash Contributing Factors
Before delving into findings related to bicycle intersection facilities and designs, this section covers more general factors influencing bicycle crash risk or injury severity. Throughout the following sections, relevant findings related to both empirical and perceived safety are discussed.
Bicycle Volume
As would be expected, bicyclist intersection crash risk is highly correlated with bicyclist volume. Although the absolute risk of bicycle crashes increases with higher bicycle volume (Nordback et al. 2014, Carlson et al. 2019; Strauss et al. 2013; Russo et al. 2020), most studies examining the issue have found that the crash risk per cyclist goes down with a higher number of cyclists. For example, Carlson et al. (2019) note that a 1% increase in daily bicycle volume results in less than a 1% increase in bicycle crashes - closer to 0.5% in their study, while Strauss et al. (2013) found that a 1% increase in bicyclist volume at signalized intersections would be expected to result in a 0.87% increase in cyclist injuries. Several studies have also examined bicycle volume data from app-based sources, such as Strava. Three studies examining bicycle crash risk with Strava volumes have found that higher bicycle counts at intersection approach locations in Strava were associated with higher bicycle crash frequency (Chen et al. 2020; Saad et al. 2019; Raihan et al. 2019). These studies also found that medium and high bicycle activity at intersections were found to increase bicycle crash probability by almost three times at signalized intersections.
There may also be some critical mass of bicyclists connected to lower risk; Nordback et al. (2014) found that collisions per cyclist are substantially lower at locations with more than 200 average annual daily bicyclists. This concept of decreasing risk per individual bicyclist is often referred to as safety-in-numbers. While not focused exclusively on intersection safety, a recent meta-analysis by Elvik et al. (2017) found strong evidence that the concept exists in the studies reviewed. However, these findings are not universal. A case-crossover study in Vancouver and Toronto found intersections with higher bicycle volume were associated with higher crash risk, primarily from crashes with motor vehicles. The authors suggest the potential conflict with other studies may be due to other studies taking a more macro approach, while this study was focused on specific intersections (Harris et al. 2013).
Vehicle Volume
Higher vehicular volumes (usually measured as ADT or AADT) are associated with increased bicycle crashes in several studies (Chen et al. 2020; Russo et al. 2020; Saad et al. 2019). One study also found that increased network density, which may be a proxy for increased motor vehicle activity or increased bicycle activity, is associated with bicycle crash frequency at intersections (Chen et al. 2020).
However, there is also some evidence that bicycle crashes increase by less than the rate of motor vehicle volume increases. A study in Minneapolis found that in addition to a reduction in bicycle crash rates as daily bicyclist traffic increases, there is also a reduction in bicycle crash rates as motor vehicle AADT increases, finding that a 1% increase in the average of AADT results in an increase in the number of bicycle crashes by 0.8% (Carlson et al. 2019). Regardless, persons on bicycles associate higher directional traffic volume with higher perceived risk / decreased comfort (Landis et al. 2003).
Higher turning vehicle volumes are also generally associated with higher bicycle crash risk. Higher right turn volumes are associated with greater crash risk for bicyclists in numerous studies (e.g., Nordback et al. 2014; Strauss et al., 2013; Zangenehpour et al. 2015; Miranda-Moreno et al., 2011), with one finding that a 1% increase in right turn traffic at a signalized intersection would increase bicyclist injury occurrence by 0.24% (Strauss et al. 2013). One study found that more receiving turn lanes (the number of lanes available to turn into, legal or not) are associated with increased bicycle-motor vehicle crashes, which may be due to higher turning speed (Wang and Nihan 2004).
Research on left turn traffic volumes and bicycle crash risk is more limited. Strauss et al. (2013) found that a 1% increase in left-turn traffic at a signalized intersection would increase bicyclist injury occurrence by 0.19%, slightly less than for right-turning traffic volume. A New York City Department of Transportation (NYC DOT) report (2016) found that pedestrians or bicyclists involved in collisions with left-turning vehicles were more than three times as likely to have a severe injury or fatality than from a right-turning vehicle, which the report attributed to higher turning speeds due to wider turn radii, sometimes limited visibility, and driver cognitive load associated with negotiating oncoming and turning traffic (NYC DOT 2016). However, another study found that more opposing direction turn traffic was associated with fewer bicycle-motor vehicle crashes. The authors posited that the opposing direction traffic might slow traffic and provide more visibility of bicycles and traffic signals to the same direction traffic (Wang and Nihan 2004).
Higher motorist turning volumes are associated with reduced bicyclist perceptions of safety. A 2015 study of separated bike lane intersection designs found that bicyclist perceptions of safety were more heavily influenced by turning vehicle volumes than by turning vehicle compliance with correct turning movements (Monsere et al. 2015). A 2019 study found that cyclists and potential cyclists rated intersection as less comfortable if they observed a turning motor vehicle at the intersection (Monsere et al. 2019).
Vehicle and Bicycle Speed
Higher motor vehicle speeds are associated with more motor vehicle – bicycle crashes (Chen 2015; Siddiqui et al 2012) and more severe bicyclist injury (Kim et al. 2007; Helak et al. 2017). Bicyclist fatality probability increases incrementally but dramatically as motorist speeds increase, nearly doubling at 30mph compared to 20 mph, increasing over 300% at 40mph, and increasing nearly 10-fold at speeds of 50mph or above, all compared to 20 mph (Kim et al. 2007). Higher posted speeds have also been found to increase bicyclist injury probability (Helak et al. 2017). However, incidence of speeding as a reported contributing factor in motor vehicle – bicycle crashes is likely underreported, as speeding is generally only reported when there is clear evidence that the vehicle was traveling over the speed limit (Neuner et al. 2016). A key
consideration for the relationship between speed and safety is that drivers have less time to react to unexpected situations when traveling at higher speeds, which results in greater breaking distance required and less recovery time for distractions (Boodlal et al. 2015). This may be particularly true for crashes that occur in darkness.
There does not appear to be much research on bicycle speeds and safety. In a driving simulator study, Hurwitz et al. (2015) found an increased likelihood of right-hook crashes with greater bicyclist approach speed. A 16 mph approach speed for a bicyclist approaching a motorist from behind was the highest risk scenario for a collision. The authors suggested that bicycles are visible to motorists for shorter time durations because of the bicyclists’ higher approach speed. In addition, the higher approach speed from behind may make a judgement of closing distance more challenging for the driver. A conflict analysis study found that a downgrade on approach to an intersection was associated with an increase in the number of higher severity conflicts, which the authors suggest may be due to bicyclists traveling at a higher speed on approach with limited braking ability (Mansell et al., 2024).
Pedestrian Volume
Several studies have identified findings associating the presence of pedestrian facilities with bicycle crashes. At least two studies have identified a bus stop within the vicinity of an intersection as increasing bicycle crash risk. One found that the presence of a bus stop within 50 meters of an intersection is associated with increased bicycle crash risk (Miranda-Mireno et al. 2011). Another study found that bus stops resulted in a 40% increase in bicycle injury occurrence (Strauss et al. 2013). Raihan et al (2019) found a 61% increase in bicycle crash probability at signalized intersections with three or more bus stops in Florida. On the other hand, a study in Florida found that wider sidewalks were associated with decreased bicycle crashes (Saad et al. 2019). A study in Tokyo, Japan, found that intersections with pedestrian overpasses were associated with more bicycle crashes, possibly due to an associated lack of street-level crossing provisions for pedestrians and bicyclists at those locations (Wang and Nihan 2004).
Only one study was identified that explored the perception of bicycle and pedestrian interactions. Bigazzi et al. (2021) examined a redesigned multimodal corridor in Vancouver, BC, at mid-block and unsignalized intersections. A primary finding is that pedestrian interactions with bicycles are rated as more comfortable and lower risk than interactions with motor vehicles, even though rates of yielding and other measures were similar.
Vehicle Type and Size
Large trucks and buses are associated with additional risk for bicycle crashes, both due to the vehicles’ size and mass and the lessened visibility of other road users. Research has identified safety risks for bicyclists related to large vehicles at intersections, including intersection complexity and limited visibility (Pokorny et al. 2017; Pokorny and Pitera 2019). Right-hook style crashes have been identified as a common truck - bicycle crash scenario, with bicyclist positioning near the front-turning corner of the truck and in blind spots being a major contributing factor (Talbot et al. 2017). Studies have also found that more large vehicles turning at intersections are associated with a higher likelihood of conflicts (Liang et al. 2020), and crashes involving trucks or buses are about twice as likely to result in severe injury for the bicyclist (Asgarzadeh et al. 2017; Moore et al. 2011).
User Characteristics
Characteristics about the bicyclists themselves can also affect how likely they are to feel comfortable riding through intersections and the potential risks they may take. One study found that men, younger people, and more experienced cyclists are likely to rate comfort levels at intersections more highly (Wang
and Akar 2018a). A similar study found that male cyclists traveled at higher velocities than female cyclists during conflicts with right-turning vehicles (Abadi and Hurwitz 2019). A study based in Nanjing, China, found that men, younger riders, and e-bike riders are more likely to run red lights (Guo et al. 2018), while another study in China found that higher proportions of e-bike riders at intersections are associated with more conflicts with turning vehicles (Liang et al. 2020).
There is also evidence that road users adapt to new designs over time, and behave as intended and more safely as they become more familiar with a design. A 2011 Norwegian study examined conflicts at a t-junction with a cycle track crossing at three time periods, including two months after installation, four years after, and ten years after. They found a reduction in conflicts over time (particularly between the two-month and four-year time periods) with comparable traffic, suggesting that road user learning and adaptation may explain some of the difference (Philips et al. 2011). A simulator study found that drivers familiar with various facility types, such as bike boxes and merge lanes, were more likely to stop or yield earlier (Fournier et al. 2020). That study also found that frequent bicyclists drove slower and made more eye glances at roadway treatments and in their mirrors (Fournier et al. 2020).
Lane Positioning
Several simulator studies have found that the presence and relative position of a bicyclist at an intersection affects how motorists interact with them. A 2016 study examining cycle tracks in different cities recommends shifting bicyclists closer to parallel auto traffic at intersection approaches to improve the visibility of cyclists to motorists (Bryant et al. 2016). More detailed studies of driver detection of persons on a bicycle have been conducted using driving simulators. One study found that motorists were more likely to see bicyclists who were positioned in front of them (Hurwitz et al. 2015). Bicyclists approaching from behind a right-turning car are least likely to be observed by drivers, as drivers focus on cars in front of them at the expense of their peripheral vision (Jannat et al. 2018). Conversely, when a bicyclist was in front of the motorist, the motorist’s perception of the driving environment degraded (Jannat et al. 2018; Jannat et al. 2020). Christofa et al. (2019) found that a bicyclist’s presence approaching or at an intersection resulted in reduced motor vehicle speeds on approach to the intersection and while conducting right turns. However, there is also some indication that drivers focused less on crossing pedestrians when bicyclists were riding ahead of right-turning vehicles (Jannat et al. 2020).
Lighting Conditions
According to 2017 data, just over half of bicyclist fatalities also occurred in the dark or dusk and dawn hours (47% at night and 5% in dusk/dawn hours), with the hours between 6 p.m. and 9 p.m. having the highest proportion of any three-hour period (NHTSA 2019). While lighting at intersections is known to improve safety and reduce crashes, a few studies have examined lighting and bicycle safety directly at intersections. At intersections, one study found that bicycle crashes at night are about 1.5 times more likely to result in severe injury than those that occur in the evening (Asgarzadeh et al. 2017), while another found bicycle crash risk greatest at peak evening hours (Russo et al. 2020).
Bikeway Intersection Treatments
Findings related to several of the general bicycle intersection approach strategies, including the provision of mixing zones, pocket or keyhole lane designs with a lateral shift of the bike lane to the inside of a turn lane, and designs that bend the bike lane in or out, are discussed in this section.
Bike Lane
Findings on the safety effects of having a bike lane leading up to an intersection are mixed. A paper based on studies of bicycle facilities in cities in New Zealand and Australia found CMFs of installing bike lanes at intersections ranging from 0.42 to 2.03, noting that while the overall effect of adding bike lanes was neutral, lanes “built to high standards improve cyclist safety” while “those built to lesser standard can reduce cyclist safety (Turner et al. 2011). That study found that colored bike lanes leading up to intersections were associated with a 39% reduction in bicycle crashes (Turner et al. 2011), and noted that, while intersections with exclusive turn lanes were safer than those with shared turn/through lanes, both benefitted from having colored bike lanes. In 2021, the Federal Highway Administration (FHWA) developed CMFs for bike lane additions by means of reducing lane and shoulder widths. Observations were collected from varying roadway types in Washington, Florida, and Texas, where Texas yielded the largest sample size. The results from Texas produced CMFs indicating reductions in total crashes for (i) two-lane undivided urban collectors and local streets, and (ii) four-lane undivided urban collectors and local streets (Avelar et al. 2021). A study utilizing bicycle crash data in Florida from 2011 to 2014 found that the presence of a bike lane or slot at an intersection was associated with an increase in bicycle crash probability of 27% at four-leg intersections and 36% at three-leg intersections, and a 71% increase in fatal and severe bicycle crash probability at four-leg intersections (Alluri et al. 2017). However, the study only controlled for bicycle activity within a block group, and not between bike lane routes and adjacent routes. In a follow-up study using Strava data to control for exposure, the presence of a bike lane was not significant in their cross-sectional models (Raihan et al. 2019).
In a 2020 study, Cicchino et al. recruited 604 patients from hospital emergency rooms in New York City, NY, Washington, D.C., and Portland, OR who were being treated for a collision or fall resulting from cycling on a roadway. Using participants’ descriptions of the sites, further validated via Google Street View and city-owned GIS inventories, the authors identified and compared characteristics and features of the roadways, between each incident. When compared to major roadways without bike lanes, the risk of falling or crashing was lower when conventional bike lanes were present (adjusted OR = 0.53; 95 % CI = 0.33, 0.86) (Cicchino et al. 2020).
Several other studies have looked at how the presence or absence of a bike lane on an intersection approach affects bicycle crash risk and also found mixed results. One study found that bike lanes can decrease bicyclist crash risk in some cases (Kondo et al. 2018), while another study found that bike lanes were associated with increased crash risk at some intersections (Chen et al. 2020).
Bike lane width has been found to be associated with bicyclist satisfaction and sense of safety at intersections. Bike lane width was one of the few factors associated with increased bicyclist satisfaction at intersections in one Danish study (Jensen 2013). A Florida bicycle LOS study found that increases in the combined width of the outside lane plus bike lane (if present) were associated with the decreased perceived hazard (Landis et al. 2003)
Pocket/Keyhole Bicycle Lane
Detailed safety studies focused on this pocket/keyhole bicycle lane design were not identified; however, several studies examine compliance and comfort. A 2015 study in multiple U.S. cities found that bicyclists shifted into the pocket lane 68-87% of the time without cars in the turn lane, and 81-93% of the time when one or more cars are in the turn lane (Monsere et al. 2015). That study also found that motorists often encroached at least partially in the through bike lane when present, with 30% to 66% doing so, depending on the specific intersection (Monsere et al. 2015). In terms of comfort, a 2020 study found that cyclists and potential cyclists rated the lateral shift design among the least comfortable, along with other designs that mix cyclists and turning vehicles upstream of intersections, with only 37% of all respondents and 27% of
“interested but concerned” respondents saying they would be comfortable riding through intersections with the design (Monsere et al. 2020a).
Mixing Zones
A 2016 study found that mixing zones were associated with increased yielding by motorists and fewer motor vehicle – bicycle conflicts (Rothenberg et al. 2016). A study looking at intersections in New York City and Portland found that mixing zones reduced severe conflict risk by 17% compared to a split leading bicycle interval (split LBI), which is a leading interval that also allows through motor vehicle traffic to proceed (Russo et al. 2020). However, due to the small sample of sites (three for mixing zone and two for split LBI), it is unclear if the decreased conflict risk is related solely to the mixing zone presence and more research is needed (Russo et al. 2020). A 2023 conflict analysis study by Russo et al. (2023) found that mixing zones are associated with fewer conflicts at locations with lower right-turn volume, particularly lower than 75 vehicles per hour, and are appropriate for sites with at least 25 bicyclists per hour. Several studies of bicycle intersection designs in New York City have included findings related to mixing zones. A 2018 NYCDOT study found a 27% reduction in crashes with a mixing zone compared to no bicycle-specific intersection treatment. Mixing zones performed best at smaller intersections and had more frequent, less severe conflicts than other design types in the study (NYC DOT 2018). A follow-up study found that short mixing zones of about 35 feet from the yield line to the crosswalk performed better in bicycle crash rates than slightly longer mixing zones with 50 feet from yield line to crosswalk (Sundstrom et al. 2019). The short mixing zones also decreased crash risk at locations with high right turn volume (defined as 120 turns per hour or more). They had lower crash rates than fully split signal phases (1.3 annual crashes per million cyclists for the short mixing zones, compared to 1.6 for the longer mixing zones and 2.2 for the split signal phases); the authors suggest this may be related to higher congestion and lower speeds at such sites (Sundstrom et al. 2019). A 2023 study of bicycle treatments at urban intersections in Texas and Virginia found that mixing zones were associated with a reduction in fatal and injury crashes between bicyclists and motorists for Texas sites – they identified a mixing zone CMF of 0.571, p=0.034 (Avelar et al. 2023).
Despite the evidence showing fewer conflicts with mixing zones, several studies have found that people do not feel as safe or comfortable riding through mixing zones compared to other designs. The NYC DOT study found that only 65% of intercepted cyclists felt safe with a mixing design, compared to 93% at an offset intersection design (NYC DOT 2018). A study of cyclist comfort when riding through bicycle intersections that were not limited to current or intercepted cyclists found much lower comfort, with only 37% of all respondents and 29% of interested but concerned respondents stating they would be comfortable riding through an intersection with a mixing zone (Monsere et al. 2020a). However, in that study, a turning vehicle’s presence did not further erode comfort as much with the mixing zone design as it did at other design types, perhaps because bicyclists are primed to expect turning vehicles regardless of a mixing zone design (Monsere et al. 2020a).
There may be some confusion among road users around how bicyclists and motorists should use and interact in mixing zones. One early study found that bicyclist positioning in mixing zones is inconsistent and often not as intended, with bicyclists often ignoring sharrow markings in the center of the shared lane and choosing to ride curb-tight or as far to the inside of the shared lane as possible (Monsere et al. 2015). That study found that vertical posts denoting merging/entry/exit areas are associated with increased compliance in motorists’ merging or changing lanes at the intended locations (Monsere et al. 2015). Further, the 2018 NYC DOT study found that only 35% of intercepted bicyclists in a survey felt it was clear who should yield (motorist or bicyclist) in a mixing zone (NYC DOT 2018).
Offset / Protected Intersections
Offset intersections that bend the bike lane away from the motor vehicle lane, of which protected intersections are a subset, have received attention recently. A 2011 Dutch study of over 500 intersections found bicycle crossings to be safest when they are offset (bend-out) by two to five meters and raised (Scheppers et al. 2011). A Danish conflict analysis study comparing an offset / recessed design (comparable to a protected intersection), bike lane, and mixing zone designs found that the offset design resulted in fewer conflicts and was likely safer. However, they observed relatively few conflicts overall (Madsen and Lahrmann 2017). In a 2024 study, Younes et al. used computer vision techniques to study more than 9,000 vehicle speeds and trajectories at an intersection with two types of temporarily implemented bike lanes, one of which was a protected bike lane with plastic delineators and cones. This study found that at the intersection leg with the protected bike lane, the average speeds of right-turning motorists were reduced by 21% and their average maximum speeds were reduced by 28% (Younes et al. 2024). A conflict analysis study using data from 65 Canadian intersections also found that larger offsets were associated with fewer observed conflicts (Mansell et al., 2024).
In the U.S. context, several studies have found both positive impacts and some unintended and potentially negative impacts. A study in New York City found that cyclist yielding to motorists was higher with the offset design than in other designs, which the authors hypothesized may be due to confusion around who would have the right-of-way at such locations (Sundstrom et al. 2019). A before and after video study examining road user compliance with intended crossing behaviors at a protected intersection design in Salt Lake City, Utah, found that pedestrians and bicyclists were more likely to stop and cross in intended areas after implementing the design (Lyons et al. 2020). Pedestrians were more likely to stay in the crosswalk, and bicyclists were less likely to stop in the street or on the sidewalk. However, the study found that bicyclist signal compliance was reduced after the design was implemented. A 2020 study of two protected intersections, with one being the same location in Salt Lake City, found the design to be associated with increased two-stage left turns by bicyclists, but also found decreased signal compliance by bicyclists, along with reduced yielding by left-turning vehicles (Sanders et al. 2020). Some of the non-compliance changes are specific to the context of the Salt Lake City intersection, which has low vehicle speeds and volumes. Before the installation of the protected intersection, there were wide streets and crossings. After the installation of the protected intersections, the crossing risks and distance were considerably reduced. A recent study by Fitzpatrick et al. (2023) of protected intersections examined motorist yielding to bicyclists and pedestrians at 24 sites, including six protected intersection sites with before and after data, 14 sites with only post-treatment, or after, data, and four non-treatment sites (no protected intersections). They found motorist yielding to bicyclist rates of 38% for treated sites, and 34% for other sites; and motorist pedestrian yield rates of 23% for treatment and 16% for non-treatment sites.
In a 2020 study, Cicchino et al. recruited 604 patients from hospital emergency rooms in New York City, NY, Washington, D.C., and Portland, OR who were being treated for a collision or fall from cycling on a roadway. Using participants’ descriptions of the sites, further validated via Google Street View and city-owned GIS inventories, the authors identified and compared characteristics and features of the roadways, between each incident. Regarding protected bike lanes, the risk for crashing or falling was associated with the degree of separation – risk was found to be lower when heavier separation was present (tall, continuous barriers or grade and horizontal separation) (adjusted OR = 0.10; 95 % CI = 0.01, 0.95). Whereas protected bike facilities with less separation (low curbs, posts, parked cars) were found to pose a risk similar to one-way major roadways. This study suggested that protected bike lanes may introduce new non-vehicle hazards, as almost 25% of the incidents in protected bike lanes (light separation) were with pedestrians (Cicchino et al. 2020).
Several driving simulator studies have also examined protected intersection designs. A 2017 simulator study compared intersection designs with no protection, simple corner islands, and a design with islands
and green bike lane markings through the intersection (Warner et al. 2017). The study found that the addition of curb islands resulted in fewer high-risk TTC values (less than or equal to 0.9 seconds) but that the full protected design with green bike lane markings through the intersection did not result in consistent positive safety outcomes. Another study found that wider corner refuge islands, which effectively reduced the turning radius, were associated with slower motorist turn speeds (Deliali et al. 2020).
There is evidence that the protected intersection design is perceived as safer and more comfortable by cyclists and potential cyclists. A 2019 study found that designs that maximize bicyclists’ physical separation from motorists, such as a protected bike lane design (or signalized separation), are rated most comfortable (Monsere et al. 2019; Monsere et al. 2020a). Findings from a focus group of cyclists and potential cyclists in three southeast U.S. locations indicate that most participants viewed the protected intersection as very comfortable and felt the design was “self-explanatory” (Watkins et al. 2020).
Intersection Features
This section covers intersection elements and design components that may impact bicycle safety, including if and how the bike lane continues through the intersection, provision of bike boxes and two-stage turn areas, turn lanes, and more.
Bike Lane Markings
Findings have been mixed about whether or not to use colored pavement markings and the efficacy of continuing bike lane markings through an intersection.. A study of suburban bike lanes in Alabama found the addition of green pavement markings to existing bike lanes to improve driver safety performance measures such as speed and lateral position. Following the implementation of green pavement markings, drivers who were previously driving in or near the bike lane were found to be more aligned with the center of the travel lane along these roads (LaMondia et al. 2019). The addition of colored pavement markings to bike lanes in Oslo, Norway were found to have the same effect on driver behavior (Fyhri et al. 2021). Nolan et al. studied how the painting of bike lanes influenced drivers’ lateral positioning when passing cyclists on roadways across four Australian cities. A total 162 cyclists were outfitted with two cameras and a distance sensor, and studied over a two-week period, yielding 46,769 observations. The study found that drivers passed cyclists with less variability in lateral shifting when the bike lanes were painted (Nolan et al. 2021).
Regarding the continuation of bike lane markings through intersections, some studies have noted an increase in motorist yielding to bicyclists and reduced conflicts when they are extended through the intersection (Sanders et al. 2020). Simulator studies have noted that marking the bike lane through the intersection results in reduced approach speeds for vehicles, which could increase yielding, but did not find that actual turn speeds were affected (Deliali et al. 2020). Another simulator study found that dotted white lines through the intersection to mark the bike lane were more effective at improving driver scanning for and avoiding bicyclists than when green coloring was added to the bike lane through the intersection (Warner et al., 2017). A study looking at upstream bike lane crossings, such as in situations where the motorist pathway swerved to cross a bike lane (e.g., an offramp situation), found that blue pavement in the bike lane area, along “Yield to bikes” signage, increased motorist yielding (Hunter et al. 2000).
In contrast, a Dutch study found that adding color to the bike lane marking through the intersection (red in the Dutch context) was associated with increased bicycle crash risk, noting that the colored lanes appeared to result in cyclists riding faster and reducing their visual scanning through the intersection (Scheppers et al. 2011). A Transportation Association of Canada simulator study of four offramp type conflict areas, including designs with bike lane conflict areas denoted with either solid blue paint, blue skip stripe paint, sharrows, or skip stripe white line markings, did not find any difference in terms of motorist positioning or behavior in bicycle conflict situations (Boulevard Transportation Group 2008)
Only a few studies were found that explored perceptions of bike lane markings. Wang and Akar (2018a) found that intersection crossing markings were associated with increased comfort. A Danish study found that painted cycle lanes through the intersection (blue in the Danish context) were associated with increased bicyclist satisfaction (Jensen 2013). However, other studies have not found them significant (e.g., Landis et al. 2003).
Raised Bicycle Crossings
Raised bicycle crossings are less common in the United States than other intersection treatments, although raised pedestrian crossings are associated with reduced pedestrian injuries and fatalities (Sanders et al. 2020). In the European context, Scheppers et al. (2011) found that in the Netherlands, raised crossings and other measures to reduce speeds were effective in reducing bicycle crashes at intersections, while a 1998 study of the addition of raised crossings at 44 Swedish intersections estimated a bicycle crash risk reduction of 30% (Gårder et al. 1998). A recent scan of U.S. cycle tracks recommended including raised crossings to create a speed hump and lower motor vehicle turning speeds (Bryant et al. 2016).
Bike Boxes and Two-Stage Turn Boxes
Intersection markings such as bike boxes, advance stop bars, and two-stage turn boxes seek to provide space for cyclists to queue in front of motor vehicle traffic, increase visibility, facilitate turns, and provide direction to the road users about how to navigate the intersection.
Bike boxes, which generally include an advanced stop bar directing motorists to stop upstream of the intersection and before the bike box area, have been studied for compliance, and to a lesser degree, safety. Despite a focus group finding that many people unfamiliar with bike boxes are unclear about how to use them (Watkins et al. 2020), other studies have found relatively high compliance. For example, a study in Portland, Oregon, found that 73% of motorists stopped behind the bike box advanced stop bar (Dill et al. 2012). A study of two bike box locations in Austin, Texas, found that bike boxes improved the proportion of bicyclists stopping in a visible position in front of motor vehicle traffic and increased the percentage of bicyclists proceeding through the intersection before motorists (Loskorn et al. 2013); however, at a location with high right turn volume, motorist encroachment into the bike box and past the stop bar, and illegal right turning, were high. The Portland study found that bicycle-motor vehicle conflicts were reduced after the bike boxes were added and motorist yielding increased (Dill et al. 2012). These results are consistent with a recent study finding that a bike box was better at reducing conflicts between right-turning motorists and through bicyclists than typical bike lane designs or designs that place bike queuing areas in front of the crosswalk (Liang et al. 2020).
The Dill et al. (2012) study also intercepted cyclists at bike box locations and found that over three-quarters of cyclists stated that they felt safer riding through an intersection after a bike box was added. Another survey-based perception study found that bicycle facilities in the intersection, including bike boxes and two-stage turn boxes, as well as other features such as intersection crossing markings, curb extensions, and visible grass and trees, were associated with increased comfort (Wang and Akar 2018a). However, non-bicyclists were less likely to view some of these features, including the two-stage turn box, as improving safety (Wang and Akar 2018b). Focus group participants were unclear on the how two-stage turn boxes should be used (Watkins et al. 2020).
Number of Intersection Legs
In general, more complex intersections pose a greater crash risk to bicyclists, with studies finding higher bicycle crash risk for non-orthogonal intersections (Asgarzadeh et al. 2017) and for intersections with more legs (Chen et al. 2020). A study in Florida found that, even controlling for traffic volumes, three-legged
intersections tended to have fewer bicycle crashes than four-legged intersections (Saad et al. 2019). One study examining perceived comfort found that intersections with more than four legs and without traffic signals were associated with decreased bicyclist comfort (Wang and Akar 2018a).
Roadway Grade and Curvature
Downhill grades allow bicyclists to travel at higher speeds and are associated with increased bicycle crash risk at intersections. Only one study was identified that found higher injury risk at downhill locations, a case-crossover study in Vancouver, BC, and Toronto, ON (Harris et al. 2013). In a somewhat related topic, a 2011 study of bicycle intersection crashes in Ohio found that horizontal or vertical curves at an intersection increased the likelihood of a non-incapacitating injury by 13% and the likelihood of severe injuries by over 180% (Moore et al. 2011).
Curb Radius and Motorist Turning Speed
It is well known that a smaller curb radius at intersections is a way to control vehicle turning speeds, a key contributing factor in perceived and empirical safety. Curb radii of 30 to 45 feet accommodate larger vehicles and allow faster turn speeds. In comparison, radii of 15 to 25 feet are generally preferred in more residential areas, which, in addition to slowing turning traffic, produce shorter crossing distances (Levine 2012). Any studies that examined curb radius and bicycle safety at intersections using crash-based methods were not identified. A recent study found that reducing the corner radius with protected intersections decreased the speed of the right-turning vehicles (Fitzpatrick et al. 2022). One simulator study found that curb radius reductions result in slower speeds during conflicts with bicyclists and that added protective islands (as a single protected intersection design element) functionally reduced curb radii and resulted in reduced crash severity (Warner et al. 2017).
Crossing Distance
Intersections with longer crossing distances are associated with higher bicycle crash risk (Sundstrom et al., 2019; Strauss et al. 2013). One study found a 1% increase in crosswalk length was associated with a 0.58% increase in cyclist injury occurrence (Strauss et al. 2013). A 2019 study in Florida found that larger overall intersection size, defined by the sum of the distance of all crossings, was associated with more bicycle crashes (Saad et al. 2019). Wider crossings are also associated with higher perceived hazards (Landis et al., 2013) and reduced stated perceived comfort for bicyclists and potential cyclists (Monsere et al. 2020a). Monsere et al. (2020a) noted that the longer exposure for cyclists, including wider crossing distances and longer exposure periods before the intersection (such as in a mixing zone), were associated with lower perceived comfort, particularly for “interested but concerned” cyclists.
Medians reduce crossing width and are associated with fewer bicycle crashes (Saad et al. 2019). Strauss et al. (2013) found a raised median reduced bicycle injury occurrence by over 42%. However, one survey-based study found that respondents associated medians with reduced bicyclist comfort levels, which the authors posit may be related to the median images used showing well-marked crosswalks, possibly causing bicyclists to worry about interactions with pedestrians (Wang and Akar 2018a). Interestingly, the same study also found that cyclists crossing a one-way street reported higher comfort levels (Wang and Akar 2018a).
Operation of Traffic Signals for Bicycles
In general, signalized intersections are associated with higher bicycle crash risk than unsignalized intersections (Saad et al., 2019; Meuleners et al., 2019), which may be due to higher bicycle, motor vehicle,
and turning volumes at such locations. However, traffic signal operation can improve bicyclist safety. A few studies that quantified the safety improvements for bicycles were identified. Rahimi et al. evaluated five design elements for intersections in Japan for left-hook crashes (equivalent to a right-hook crash in the U.S. context) which included mixed traffic with left-turning motorists, left turns in the intersection for the motorists, bicycle signals, advance stop lines for bicyclists, bike boxes using video observation, and surveys along a route in Japan using ten bicyclists and four drivers. Their results revealed a higher preference for bicycle signals based on comfort and safety (Rahimi et al. 2013). Rash-ha Wahi et al. (2018) examined bicycle-motor vehicle crashes in Queensland, Australia, between 2002 and 2014 at uncontrolled, stop control, and signalized intersections. Their findings at signalized intersections revealed that bicyclist age, roadway characteristics (dip, the presence of driveways), and bicyclist behavior (movements that led them to be at fault during a crash) increased injury severity. Raihan et al (2019) estimated a 31% reduction in bicycle crash probability at urban intersections with protected signal phasing in Florida when taking into account bicycle activity levels and a 43% reduction without considering bicycle activity. Other strategies, such as protected but concurrent phasing, which allows through motor vehicle traffic and bike traffic to proceed, while providing right-turning motor vehicle traffic its own phase, can offer increased safety with minimal increase in delay (Furth et al. 2014). Other signalization approaches can reduce conflicts between the turning motorist and through bicyclists. In a driving simulator study, the impact of protected-permitted right-turns (PPRT) signal indication over typical indications varied depending on bike lane markings, with negative safety implications when paired with a green-colored bike lane (bicyclists were traveling faster and closer to MV travel lanes with PPRT), but with positive impacts in other cases, such as with no colored pavement marking, and replacing a green ball with a flashing yellow arrow (Abadi and Hurwitz 2019).
A few crash-based or conflict-based studies about bicycle-specific traffic signals and safety were identified, similar to a recent scan (Monsere et al. 2020b). Kothuri et al. (2018) also studied the safety impacts of a split leading bike interval at bicycle-specific traffic signals and mixing-zone treatments using an observational study with conflict analysis. A split LBI is similar to a leading pedestrian interval (LPI). With the split LBI treatment, while the conflicts were eliminated at the start of green, conflicts persisted during the start of the flashing yellow interval and continued through the stale green. A study in New York City found that bicycle-specific signal phases performed better than mixing zones to minimize bicycle crash risk at wider crossing locations (Sundstrom et al. 2019).
As a proxy for safety, many studies have examined the compliance of persons on bicycles with traffic signals. Several variables have been associated with the likelihood of compliance. For example, one study found that bicyclist signal compliance is more likely at wider crossings and longer green ratios, while red-light running (signal non-compliance) is more likely when a median is present, perhaps due to bicyclists’ feeling more protected as they cross (Guo et al. 2018). Longer wait times at signals have also been strongly associated with decreased bicyclist satisfaction (Jensen 2013). Bicyclist compliance with intended designs appears to be highest when the designs meet bicyclists’ needs. Casello et al. (2017) found compliance was highest when cyclists approach an intersection at a green signal phase. The same study found that accommodating infrastructure for left-turning cyclists, such as providing a bike box and advance green signal or two-stage left turn facility, increases signal compliance (Casello et al. 2017).
Turn Lane Presence and Restrictions
Right turn
Evidence generally suggests that in comparison to a shared through and right turn lane, exclusive right turn lanes are associated with reduced bicycle crash risk. A 2017 Danish conflict analysis study found that when there is a bike lane up to the intersection, having an exclusive right turn lane resulted in fewer conflicts than having a shared turn and through lane for motorists (Madsen and Lahrmann 2017). This finding is
consistent with a study looking at left-turn lanes in Australia and New Zealand, which function as right-turn lanes do in the U.S. context (Turner et al. 2011). In a review of crash frequency data, Hurwitz et al. (2015) found that most (59%) right hook crashes in an Oregon study occurred at locations with a bike lane to the right of a through lane where no right turn lane was present. No exposure data (turning vehicles or bicycles) was included so this result is intuitive but does not provide much insight into risk (Hurwitz et al. 2015). However, the Madsen and Lahrmann (2017) study found that the exclusive right turn lane had more conflicts at higher vehicle volumes, while another study found that exclusive right-turn lanes were associated with more conflicts with bicycles (Buch and Jensen 2012), although this may be due to turn lanes being installed at locations with higher turn volumes, and thus higher opportunity for conflicts.
Several studies have found that signage instructing turning motorists to yield to bicyclists can increase motorist yielding and scanning for bicyclists. A 2000 study in Portland found that a “Yield to bikes” sign with accompanying graphics, along with colored bike lanes, resulted in increased motorist yielding in situations where the motorist pathway swerved to cross a bike lane, such as in an offramp situation (Hunter et al. 2000). A 2015 study found that a “Turning Vehicles Yield to Bicycles” symbol sign was effective at increasing motorists’ visual attention to bicycles (Hurwitz et al. 2015), resulting in 9-10% more time looking for bicyclists in their side mirrors (Warner et al. 2017).
Left turn
A driver turning left often focuses much of their attention on approaching motor vehicles. A study in New York City found that left turn bike injuries are more likely to occur when a motorist is turning from a minor onto a major street (51% of cases) and when the receiving street is 60 feet wide or more (69% of cases) (NYC DOT 2016). That study also found that left turn restrictions resulted in a 41% drop in left-turn bicyclist and pedestrian injuries and adding a left-turn bay resulted in a 15% drop in such injuries (NYC DOT 2016). Left-turn-only signals resulted in a 33% drop in left-turn bicyclist and pedestrian injuries, while adding LPIs resulting in a 14% drop in left-turn pedestrian and bicyclist injuries and a 56% drop in severe injury for both modes (NYC DOT 2016).
Left-turn traffic can also increase the likelihood of right-hook crashes. One simulator study found that oncoming left-turn traffic draws right-turning drivers’ attention away from bicyclists approaching the intersection, increasing the risk of a right-hook crash (Jannat et al. 2020). A study in Tokyo, Japan, found that opposing turn lanes were associated with increased bicycle-motor vehicle crash risk, which the authors suggest may be due to turning vehicles paying more attention to opposing turning vehicles and less to bicyclists (Wang and Nihan 2004).
Approach Features
Some studies have examined how features on the approach to an intersection, including the presence and type of bicycle or motor vehicle travel lanes, can affect bicycle safety at intersections.
Separated Bike Lanes
For protected bike lanes on the approach to an intersection, a simulator study found that motorists were less likely to glance at bicyclists when the protected bike lane was present; however, they also traveled slower (Christofa et al. 2019). A conflict analysis study in Montreal found that, compared to no cycle track, right-side cycle tracks can reduce bicycle crash risk at intersections (Zangenehpour et al. 2016). However, the study did not find a safety impact for left-side cycle tracks. Only one study on two-way operation was identified– Schepers et al. (2011) found that one-way cycle tracks are less likely than two-way tracks to result in crashes where a through bicyclist has the right-of-way at an intersection.
Several crash-based studies have found positive intersection safety effects of separated bike lanes on approaches. The 2023 study of bicycle treatments at urban intersections in Texas and Virginia found that separated bike lanes were associated with a reduction in total crashes between bicyclists and motorists for Texas sites, with a CMF of 0.552, p=0.086 (Avelar et al., 2023). A study of 269 intersections in Germany found that separated bike lanes were associated with fewer bicycle crashes of all types for intersections with bicycle facilities only on the major street, and associated with a reduction in right-hook type crashes at intersections with bicycle facilities on both streets (Schröter et al., 2023). Schröter et al. (2023) suggest that in the latter case, the separated bike lane on the cross street provides additional protection for through cyclists from turning motorists by way of a reduced crossing distance.
Number of Motor Vehicle Lanes and Speeds
Street approaches with more vehicle lanes are associated with increased crash risk for bicyclists (Harris et al. 2013; Chen et al. 2020) and reduced bicyclist comfort (Wang and Akar 2018a). Harris et al. (2013) also found that crossings of two major streets have about five times greater chance of injury crashes for bicyclists than two local streets (Harris et al. 2013).
Studies have also found that when speed limits are lower on the approach to intersections, bicycle crash risk is reduced (Saad et al. 2019; Harris et al., 2013; Meuleners et al. 2019). In their case-crossover study of bicycle crash risk at intersections in Vancouver and Toronto, Harris et al. (2013) found that speeds below 30 km/h were associated with lower injury risk. A 2019 case-control study in Perth, Australia, found that bicycle crashes requiring hospitalization were about twice as likely at intersections with approach speeds of over 60 km/h (Meuleners et al. 2019).
Summary of Findings and Gaps
The reviewed literature from the Findings section is summarized below, followed by list of gaps identified in the research.
Bicycle Crash Factors at Intersections
- NHTSA reports that 70% of cyclist fatalities from 2008-2017 occurred in urban areas, and 31% occurred at intersections (NHTSA, 2010-2019)
- At intersections, fatal crashes most often involve vehicles traveling straight with bicycles on crossing paths, with either the bicyclist or driver failing to yield. Turning crash types are also common.
Crash Contributing Factors
- Bicycle and vehicle volumes are strongly correlated with crash frequency. Pedestrian volume and activity are related but are less of a contributing factor to bicycle safety.
- The bicyclist’s position in the driver’s field of view directly influences the interaction between users. This finding has important implications for design options.
- Higher motor vehicle speeds are associated with more motor vehicle – bicycle crashes and more severe bicyclist injury.
- Higher right turn volumes are associated with increased bicycle crash risk and decreased bicyclist stated comfort; however, the presence of a right turn lane for motorists has generally been found to reduce crash risk.
- Left-turn traffic can pose both a direct crash risk to bicyclists, through the left turns themselves, and an indirect risk, through increasing right-hook crash risk by drawing right-turning motorist’s attention away from through bicyclists.
Bikeway Intersection Types
- Of the few studies that have examined the safety performance of bicycle lanes at intersections (compared to no lanes), results have been mixed and have not always accounted for exposure or context.
- Mixing zones have an acceptable safety performance (measured by conflicts), though many variations in design details and exposure limit results’ transferability. It is clear that from a comfort/perceived safety standpoint, mixing zones are not rated highly by persons on bicycles.
- Offset/protected intersections have good safety performance internationally. The few U.S. studies have not yet been able to draw robust conclusions due to very few installations (though the number available for study is growing).
Intersection Features
- Intersection pavement markings of bike lanes and colored lane markings have mixed or unproven effects on bicycle intersection safety performance. There is some evidence of increased driver yielding with colored markings.
- Bike boxes encourage bicyclists to wait in positions that are more visible to motorists at intersections, and evidence suggests that they reduce conflicts.
- More intersection legs and non-orthogonal intersections increase bicycle crash risk.
- Longer crossing distances are strongly correlated with bicycle crash risk and reduced perceptions of safety.
- Downhill slopes and curves on an intersection approach are associated with increased crashes and injury risk for bicyclists.
- Curb radius reductions can reduce motor vehicle turning speeds, as well as speeds during conflicts. The relationship to bicycle safety is likely, but not yet firmly established.
- There is evidence that raised bicycle crossings are effective at improving bicycle safety in European context and pedestrian safety in the U.S. context, but they have not been studied for bicycle safety in the U.S.
- Signalized intersections appear to pose a higher bicycle crash risk, possibly due to higher volumes. While improved safety is expected with bicycle-only phases or bicycle-friendly signal timing, it is currently not a well-researched topic. Bicyclist compliance with signals is often used as a proxy for studying safety at intersections, though the relationship between compliance and safety has not been established. Still, compliance is highest at intersections with shorter wait times and longer green ratios, while compliance is lower with shorter crossing distances and when medians are present.
Approach Features
- The presence of separated bike lanes has generally been associated with decreased bicyclist risk; however, there are some safety concerns, including the potential for motorists to glance/look out for bicyclists less with separated bike lanes, as well as questions about the safety impacts of left-side and two-way cycle tracks at intersections.
- The number of lanes and posted speed limits on an intersection approach are positively associated with bicycle crash risk and severity.
Identified Research Gaps
- There are very few before and after studies for some facility types, particularly for new designs. Even some of the more common, older designs for handling the interaction of bicycles and motor vehicles in right-turn lanes, such as the provision of a pocket or keyhole lanes to the inside of the right-turn lane, were not the subject of any safety studies identified in the literature.
- There are relatively few studies that have robust crash data analyses for specific facilities. This is likely due to the fact that some of the more innovative bicycle intersection designs are relatively recent, and the limited number of reported bicycle crash events means that it may take several years (or more) to have enough data for the purposes of identifying safety changes over time for specific locations.
- Conflict data analysis, often via video collection and review, is a more feasible option than utilizing crash data in some cases for more recent facilities. However, conflict analysis can be time-consuming when done manually, and automated techniques are not yet widely in use, although they are becoming more common. Thus, many studies that employ conflict data events have limited sites which make robust analysis challenging. The evidence suggests correlation between reported crashes and conflicts but the linkage between perceived safety or comfort and conflict data requires further research.
- Few of the existing studies of bicycle intersection facilities have successfully isolated the safety impacts of individual design elements. Natural experiments come with very location-specific complicating factors, including different motorists and bicyclists, traffic patterns, design variances, land uses, and more.
- The challenges noted above have resulted in the development of few bicycle-specific intersection CMFs.
- For many bicycle intersection facility types, existing research has tended to focus on a limited set of cities that had implemented innovative designs. For example, early implementations of protected intersections were few in number, leading to studies to focus primarily on one or two locations. Notably, one protected intersection in Salt Lake City, Utah has been the focus of several studies. There is a need for a better understanding of likely safety impacts of designs across varying contexts, including in different regions and urban contexts.
- There is limited research on signal operations of bicycle only phases focused on safety, with few crash-based or conflict-based studies.
- Bicyclist visibility in relation to various intersection designs, including bend-in and bend-out approaches, has been examined in simulator-based studies. However, there is limited non-simulator research in this area.
- As jurisdictions have experimented with various means of reducing curb radii and adding curb islands or wedges as a component of bicycle intersection designs, there is limited research on the safety efficacy of such techniques, including the impact of the use of different materials and the apron / mountability impacts.
- There is limited research on two-way bikeway operation at intersections, and limited research on two-stage turn queue boxes.


