Framework and Tools for Incorporating Technologies into Airport In-Terminal Concessions Programs (2025)
Chapter: 7 Self-Assessment Tool
CHAPTER 7
Self-Assessment Tool
As part of the Framework, the research team developed a Self-Assessment Tool (the tool) to assist airports in assessing the maturity of their existing concessions technology program. The Self-Assessment Tool is available on the National Academies Press website (nap.nationalacademies.org) by searching for ACRP Research Report 279: Framework and Tools for Incorporating Technologies into Airport In-Terminal Concessions Programs and looking under “Resources.” This chapter presents an overview of the tool and instructions for using it.
7.1 Overview
The tool is a spreadsheet developed in Microsoft Excel that prompts for Yes/No responses to questions and then automatically displays maturity levels for each of the 11 domain (challenge) areas addressed in the ACRP 03-70 project. Along with the maturity level rating, recommendations are provided for potential improvements to the concessions technology program. This tool can be used to help develop an airport’s roadmap for its concessions technology program on the basis of its current maturity assessment.
To assist in the visualization of the results, the tool also provides a dashboard. The tool has three worksheet tabs: Introduction, Self-Assessment, and Dashboard. Macros are used to provide a Reset Form feature. Macros will need to be enabled to use this feature. Page samples follow.
7.2 Introduction Page
This page provides an overview of the objective of this tool, along with instructions for its use. Figure 25 depicts a screenshot of the tool instructions.
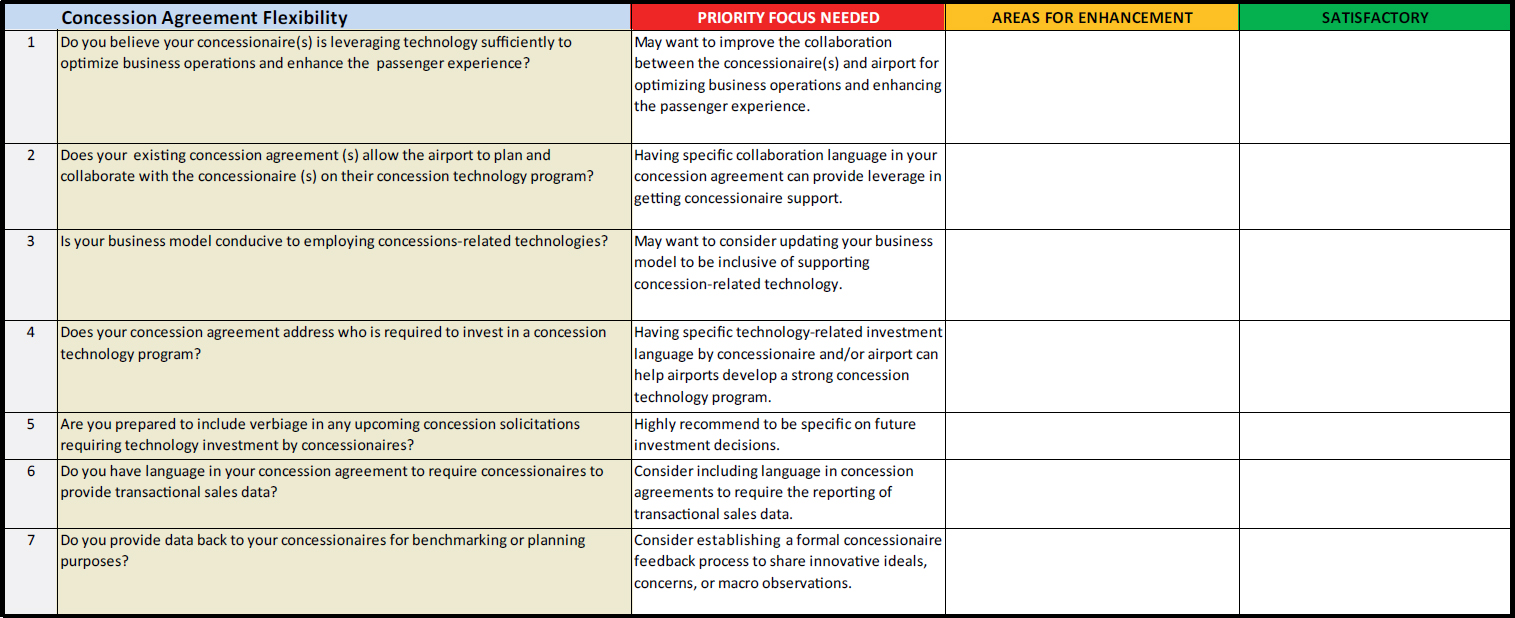
7.3 Self-Assessment Page
The Self-Assessment worksheet highlights in yellow the input cells that require data entry. A sample of the data entry fields is shown in Figure 26. Once all questions are answered for an area, the maturity level will be displayed to the right of the answers.
Maturity levels are based on the percentage of “Yes” versus “No” answers to the questions for each domain area. It is possible to answer “No” to one or two questions in some domain areas and still receive a high maturity level.


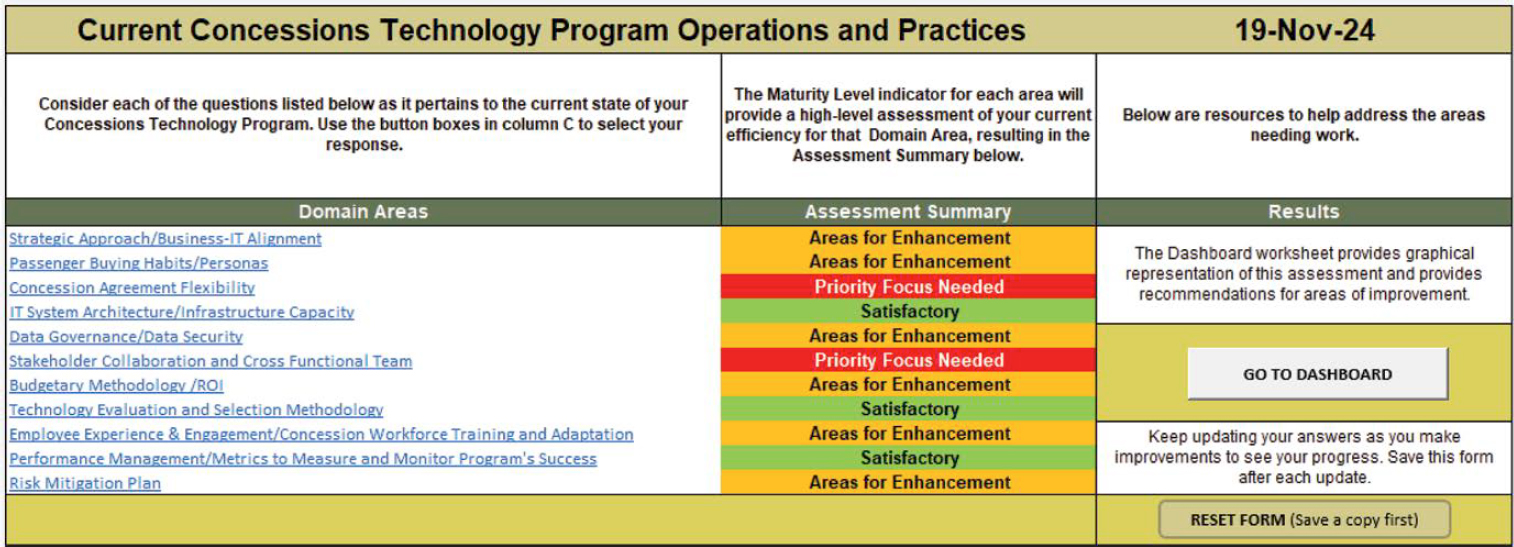
7.4 Assessment Summary
The maturity level results for each of the domain areas are equated to an assessment summary that identifies the developmental state of the concessions technology program in each area. Figure 27 shows the relationship of the maturity level to the assessment summary. Figure 28 shows a sample of an assessment summary.
7.5 Dashboard Page
To allow the user to quickly visualize the assessment summary for each domain area, the tool provides two dynamic charts in the Dashboard, as shown in Figure 29. In addition to these charts, the tool lists recommendations under each assessment summary type to show opportunities for improving the concessions technology program (Figure 30). As answers are updated on the Self-Assessment page, the Dashboard information is updated to represent the new current conditions.