Framework and Tools for Incorporating Technologies into Airport In-Terminal Concessions Programs (2025)
Chapter: Appendix B: Summary of Results of Air Passenger Survey
APPENDIX B
Summary of Results of Air Passenger Survey
Introduction
The Air Passenger Survey was conducted in September and October 2023 with the aim of capturing a comprehensive picture of air travel experience from a passenger perspective. A nonprobability panel was used to collect data from 1,200 individuals who had flown at least twice in the past 12 months, and these data were then weighted to the census to ensure a sample that was representative of the general population. The survey was designed to span a wide range of demographic segments, including age, income, and travel purpose, to reflect the diversity of the traveling population. The survey included a mix of quantitative questions, which allowed for the generation of statistical data on travel habits, preferences, and challenges, and qualitative questions to gain deeper insights into the motivations and experiences of travelers. Following is a summary of key data points with highlighted findings.
Travel Habits and Preferences
The Air Passenger Survey yielded illuminating insights into the travel habits and preferences of air passengers, with variations across different age groups. This section delves into the frequency of travel, preflight behaviors, and spending patterns observed in the surveyed demographic.
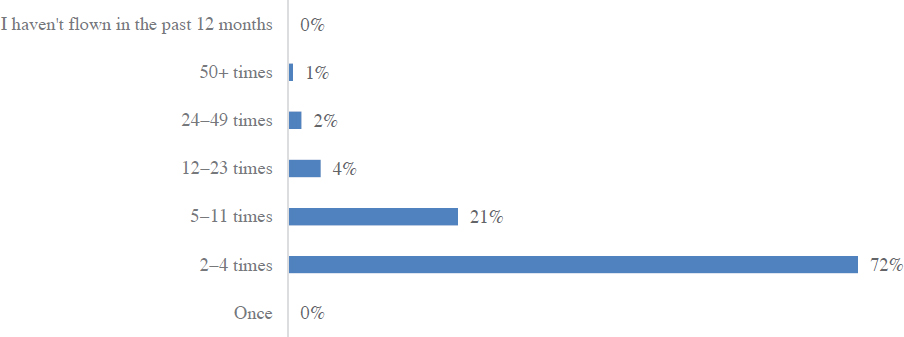
To participate in the survey, respondents had to have traveled at least twice in the past year. Approximately, 72% of respondents reported flying twice within the past year, and 21% had traveled 5 to 11 times, as shown in Figure B-1.

When asked about the main reason for traveling, two out of five respondents (40%) cited rest and relaxation. In addition to rest and relaxation, respondents cited visiting friends or family (38%), family vacation (35%), budget travel (31%), adventure travel (28%), and sightseeing (21%), as shown in Figure B-2.
More than one-third (35%) of respondents reported typically arriving at the airport 2 hours before their scheduled departure, in alignment with airline recommendations for early arrival. This behavior was more pronounced in older age groups, with individuals older than 55 years showing a greater tendency to arrive earlier than younger age groups (as shown in Figure B-3). Furthermore, preferences for time spent in the airport terminal before departure also differed with age. While the younger age bracket (ages 18 to 54 years) preferred up to 45 minutes in the terminal, older respondents (ages 55 years or more) leaned toward spending an hour or more before departure.

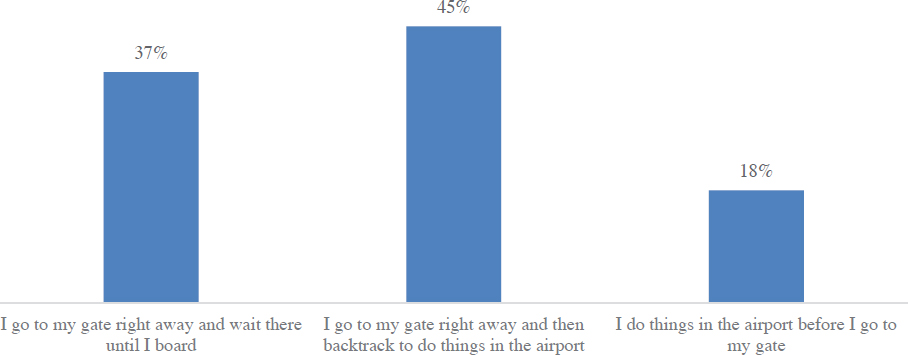
The data indicate that proximity to airports plays a role in travel decisions, with 33% of participants living within a 15- to 30-minute journey to the airport. Furthermore, the survey highlights the careful pretravel planning habits of passengers, with 44% deciding on their parking strategy at the time of booking their flight. The decision to proceed immediately to the gate after moving through security, observed in 45% of travelers, varied with the type of traveler behavior (as shown in Figure B-4). Digging more deeply, adventure travelers and those seeking rest and relaxation are more likely to visit airport amenities after passing through security (46% and 48%, respectively). Conversely, luxury and business travelers often go straight to their gate (39% and 38%, respectively).
These findings indicate the following:
- Business travel continues to lag behind leisure travel in this postpandemic era. Leisure travelers typically fly less frequently than business travelers and may, therefore, want more certainty/information during their journey. Technology can create this certainty.
- Respondents should have good familiarity with airports and how the rigors of air travel can be improved with technology.
- Significant dwell time at the airport, as these data show, could be influenced by airport recommendations, the need for buffer time due to the uncertainty of getting travel ready, or personal preferences. Long dwell times mean that discretionary times for food and retail purchases are significant and can be enhanced even further with the use of digitalization to assist in purchases.
- Passengers may want the certainty that, for example, the plane has arrived, the flight is leaving on time, and the time it takes from a place of interest (e.g., a restaurant brand they walked past) in the concourse to the gate is “X” minutes. Flight information display areas can be the hub for sharing information that passengers seek beyond just data on flight and gate status.
Technology and Communication
The integration of technology in travel is deeply woven into the modern traveler’s experience. With smartphones as essential travel companions and airport Wi-Fi usage at high levels, the digital landscape is reshaping expectations and operations within the travel industry. The ubiquity of smartphones in the travel domain was unmistakably highlighted in the survey, with an overwhelming 88% of respondents indicating that they carry smartphones during travel. The survey also revealed a substantial reliance on airport Wi-Fi, with 70% of participants using this service. This finding emphasizes the need for robust and reliable digital infrastructure to accommodate the tech-savvy traveler. Regarding data security, 52% of travelers expressed apprehension about their personal information being compromised.

Passengers reported wanting more real-time information on security checkpoint wait times and parking availability. They also want information on concessions opportunities and offers, as shown in Figure B-5.
Furthermore, appreciation for modern technological conveniences, such as contactless payments, real-time updates, and self-service options, was evident, with 34% to 39% of respondents valuing these features (Figure B-6). These preferences indicate a growing demand for efficient, technology-driven services at airports and by airlines.
The survey also highlighted a strong preference for digital platforms in the booking process, with 76% of respondents favoring airline websites or apps. Another finding is the preference for TSA PreCheck, with 30% of survey participants favoring this Trusted Traveler Program. This preference indicates a desire for streamlined and expedited travel processes and signals an opportunity for similar programs that enhance travel efficiency. Additionally, the reliance on

flight display boards at gates (56%) and boarding passes (47%) for information on gate numbers and flight status highlights the importance of clear and real-time information within the airport environment. The survey also revealed preferences regarding how travelers wish to receive information from airports. A majority prefer to receive updates via text/Short Message Service (SMS) (66%) and email (56%).
The survey results reveal widespread comfort with technology among air passengers, regardless of age. Approximately 85% of participants reported a high level of comfort with using technology. Whether booking flights online, accessing real-time travel updates via smartphone apps, or utilizing contactless payment methods, passengers are increasingly relying on technology to enhance their travel experiences. However, a mere 26% of respondents followed or monitored airport social media accounts, which suggests either a potential area in which airports can expand their digital outreach and engagement strategies or the need for airports to assess the value of these developing outlets.
These findings indicate the following:
- Passengers are adopting technology, wanting more of the information and efficiency that technology can provide, and are equipped to access that information.
- While concerns about privacy and data security may continue to grow, the general acceptance of technology may counter those concerns.
- Passengers may want the certainty that, for example, the plane has arrived, the flight is leaving on time, and the time it takes from a place of interest (e.g., a restaurant brand they walked past) in the concourse to the gate is “X” minutes.
Spending at the Airport
The Air Passenger Survey provides a comprehensive overview of how travelers engage with airport amenities and services. This section explores the spending behaviors, preferences, and concerns of passengers within the airport environment and provides insights into areas of interest for airport management and businesses operating within airports. It was observed that more than a third of respondents (36%) reported spending between $20 and $50 while in the airport terminal. This finding indicates a moderate but noteworthy propensity among travelers to engage in purchases. Despite the willingness to spend, there are areas of concern that have an impact on the overall airport experience. A notable 51% of respondents cited long waits at security checkpoints as a primary issue affecting how they use airport concessions and amenities. Additionally, 46% of travelers highlighted the cost of goods and services at concessions as a concern.
When it comes to spending at airport terminals, a clear age-based trend emerges, as shown in Figure B-7. Younger travelers, aged 23 to 38, reported a higher propensity to spend more, with 41% typically spending more than $50. In contrast, travelers aged 55 and older exhibited more conservative spending habits, with 49% of those aged 74 and older and 41% of those aged 65 to 73 staying within the $5 to $20 spending range. These findings underscore the influence of age on airport terminal spending patterns.
These findings indicate the following:
- The reported spending levels from this survey are generally in alignment with passenger sales per enplanement reported in the industry, though on the low side. Airport surveys that capture spending via an intercept are generally more accurate than an Internet-based survey that requires respondents to recollect something that potentially occurred months ago.
- Use of contactless payment is likely to increase with time, either as a result of it being a preferred payment option or because of the ongoing staff resource issues that concessionaires face.

Conclusion
The findings of the Air Passenger Survey present a multifaceted portrait of contemporary air travelers and provide insights into their habits, preferences, and experiences. The survey underscores the significant role of technology in enhancing the travel experience by showing a high reliance on smartphones, digital booking platforms, and airport Wi-Fi. This reliance on technology is juxtaposed with some concern about data security and privacy, which emphasizes the need for a balance between technological advancement and data protection.
Furthermore, the survey reveals differences in airport behaviors and spending patterns based on age, with older travelers tending to arrive earlier and spend less, and younger travelers displaying a higher propensity to spend more within the airport. The findings also stress the importance of efficient, technology-driven services, and the growing demand for streamlined travel processes, as evidenced by the preference for programs like TSA PreCheck. The data also suggest potential areas for improvement in airport amenities and concessions, especially with regard to addressing long waits at security and the perceived high costs of goods and services. Overall, the Air Passenger Survey provides valuable information that can be leveraged by airports, airport concessionaires, technology solution providers, airlines, and policymakers to enhance the air travel experience and ensure that it meets the evolving needs and preferences of a diverse traveling public.


