Protecting Transportation Employees and the Traveling Public from Airborne Diseases (2024)
Chapter: 4 CFD Studies of Transit Buses
Chapter 4
CFD Studies of Transit Buses
Methods
This section provides an overview of computational methods and models employed to simulate airflow in a transit bus. The model and boundary conditions are described. The techniques employed to simplify the ventilation system’s geometry for reducing computation time are explained. Efforts to confirm mesh independent solutions are presented. Lastly, methods implemented for conducting particle studies and the approaches used to analyze and interpret the study results are shown.
Computational Model
Utilizing the two-equation eddy-viscous standard k-ε turbulence model, SOLIDWORKS Flow Simulation software computes simulations using the Reynolds Averaged Navier Stokes computational model. There are four parameters that can be adjusted to fit the desired turbulence characteristics of the flow. To accurately capture the behavior of flow in the bus, calculations were made to select the proper turbulence parameters for each component within the bus. Modeling this kind of ventilation flow in a bus has many different velocities and length scales. A turbulence intensity and effective length were prescribed for the flow inside the main bus, inside the vents, and near the coughing dummy. When a cough is added to the simulation a turbulence intensity and length need to be prescribed differently, since the flow here is much more turbulent than the inlets and overall flow inside the bus. The equations and variables are listed below. As shown in Table 19, predicted mean velocities for each component within the bus were used in calculating k and ε for the simulations. In addition to this, the standard turbulence constant for k-ε models, Cµ, of 0.09, was assigned for all the turbulence condition calculations.
(Equation 3)
(Equation 4)
(Equation 5)
(Equation 6)
(Equation 7)
(Equation 8)
(Equation 9)
l=0.07dh (Equation 10)
| Turbulence Conditions | |||||
|---|---|---|---|---|---|
| Terms | Variable | Inside Bus | Inlet Vents | Cough | Units |
| Turbulent Energy [k] | K | 0.341 | 95.7 | 1320 | m2/s2 |
| Turbulent Dissipation [ε] | Ε | 0.234 | 11000 | 4.41E6 | m2/s3 |
| Turbulence Length Scale [l] | L | 0.140 | 0.0139 | 0.00178 | m |
| Turbulence Intensity [I] | I | 4.77 | 4.44 | 4.94 | % |
| Mean Flow Velocity | U | 0.1 | 1.8 | 6 | m/s |
| Characteristic Length | L | 2 | 0.20 | 0.0254 | m |
| Turbulence Constant | Cµ | 0.09 | 0.09 | 0.09 | - |
| Kinematic Viscosity of Air | µ | 1.50E-05 | 1.50E-05 | 1.50E-05 | m2/s |
| Density of Air | Ρ | 1.2 | 1.2 | 1.2 | kg/m3 |
| Velocity | V | 0.1 | 1.8 | 6 | m/s |
| Hydraulic Diameter | dh | 2 | 0.198 | 0.0254 | m |
| Reynolds Number | Re | 16000 | 28500 | 12200 | - |
Isolated Ventilation Study Experimental Simulation Setup
The meshing required to accurately simulate the airflow through the interior of the ventilation system in addition to the remainder of the bus led to large simulation times nearing 18 hours. To reduce computation time and allow for further mesh detail to be relocated to other higher priority locations, a study was conducted to determine the overall outlet velocity and pressure drop profile across the length of the ventilation system. This allowed for the determination of an appropriate method for simplifying the model geometry with the goal of reducing mesh size and computation time.
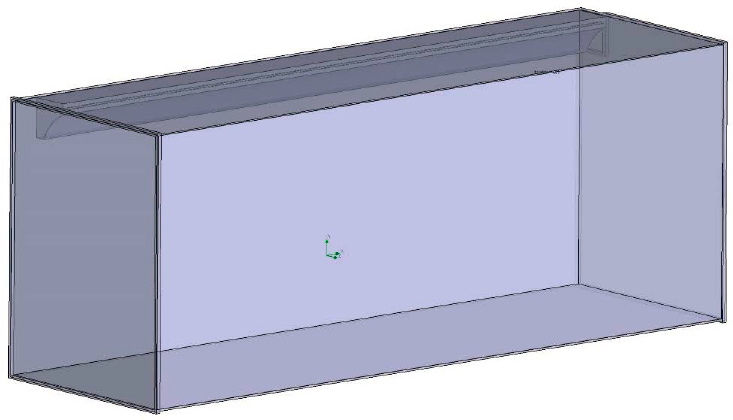
A hollow airtight container was built around the longer of the bus two vents (Figure 45), which allowed for a significantly finer mesh to surround the faces and holes of the ventilation system due to not requiring computing a mesh around the geometry of the rest of the bus. The inlet end of the vent was prescribed an inlet volume flowrate of 1400 cfm, the idealized volume flow calculated for the ventilation system. All walls not directly adjacent to the ventilation system were designated with an environmental pressure boundary condition.
Isolated Ventilation Study Results and Implementation of an Equivalent Area Design
The isolation of this ventilation system showed a 70% reduction in computation time (Table 20) and allowed for faster iteration of the experiment and design.
Table 20: Comparison of mesh size, mesh dimensions and simulation runtime.
| Configurations | Mesh Size | Max Cell Dimension (in) | Min Cell Dimension (in) | Simulation Run Time (hr:min:sec) |
|---|---|---|---|---|
| Ventilation in the Bus | 10,594,610 | 6.03 | 0.369 | 17:30:00 |
| Isolated Ventilation | 6,534,792 | 16.5 | 0.032 | 5:07:19 |
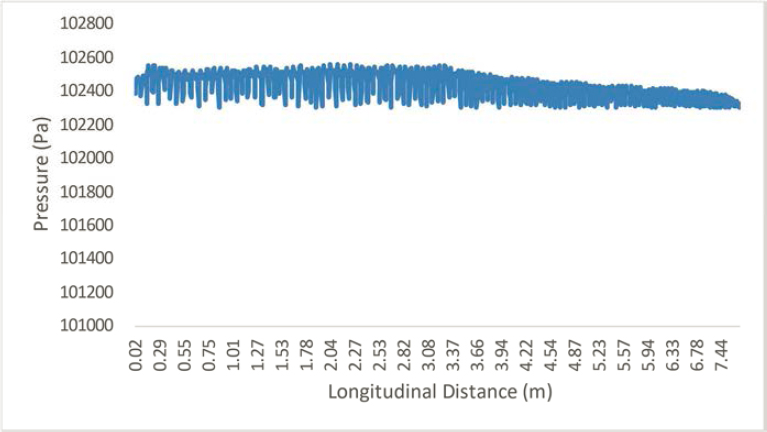
As seen in Figure 46, one row of the ventilation slots had a line drawn across the length of it to retrieve the desired data. This line was then used to create an xy-plot of the air flow distribution across the length of the vent. Figure 47 shows this profile is mostly constant across its entire length. Like the velocity profile, the pressure is mostly constant across the system, as represented in Figure 48, with a pressure drop of 100 Pa across the length of the system. It should be noted in both figures that every time the line crosses the space between vent holes the pressure and velocity both drop to zero, filtering methods were used to make the figures more easily understandable.


Based on this information, the ventilation system geometry was then simplified, as seen in Figure 49, to create a single channel along both of each vent’s faces. With this new geometry the velocity is constant across the length of the ventilation system but is lower than what was initially simulated. This is due to maintaining the same volumetric flow rate with a larger area.

Mesh Independence
Finite volume analysis simulations use a pattern of cells in a grid called a mesh. The vertices of the mesh are where the software runs calculations. This computation is done at each node and interpolated between
cells where the resolution of the result is determined by the mesh size. At a certain point the simulation results will not change with an increase in mesh density despite a significant increase in computation time. To balance the line of mesh independent results and computation time a mesh sensitivity study was conducted. This was conducted using two xy-plots (Figure 50) drawn down the center of the bus to analyze the x-velocities along the length of the bus which were then compared at different mesh levels. The results of the mesh independence study conducted can be seen in Table 21.

Table 21: Mesh cell counts along with simulation time and finishing conditions.
| Mesh Level | Number of Cells | Computation Time | Finishing Conditions |
|---|---|---|---|
| 1 | 810,252 | 25 minutes | All goals converge |
| 2 | 888,407 | 35 minutes | All goals converge |
| 3 | 1,018,388 | 38 minutes | All goals converge |
| 4 | 4,606,956 | 2.8 hours | All goals converge |
| 5 | 27,254,940 | 18 hours | Stop @ 200 iterations |
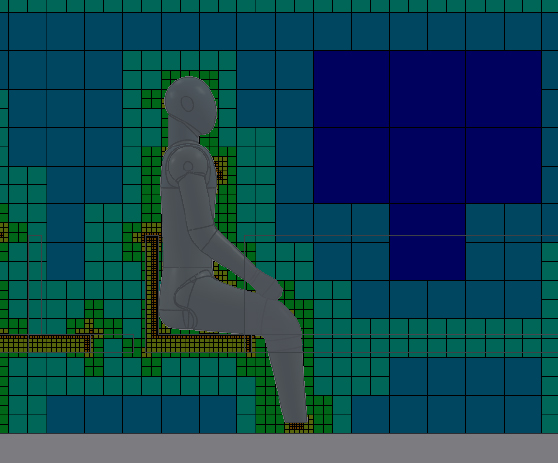
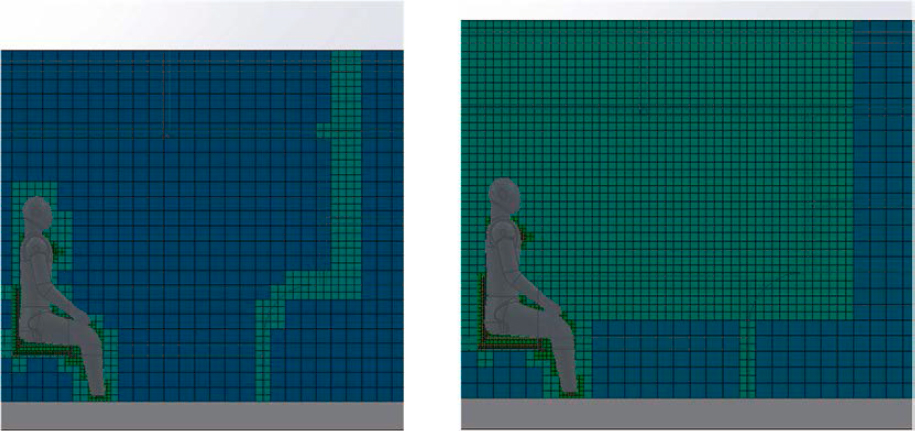
Mesh levels 1 and 2 were set to generate automatically by SOLIDWORKS Flow Simulation. After simulating at automatic mesh level 3, it was determined that a finer auto-generated mesh level was not needed. To generate finer mesh in other locations of interest a local mesh was assigned to the air surrounding the mannequin’s seating and other internal geometry. This can be seen in Figures 51-53. Mesh level 5 produced similar results of convergence to mesh level 4, however, at longer computation times.
The results of this mesh independence study were satisfactory considering the complexity of the model and the various flow patterns throughout the bus. There are significant differences in x-direction velocity between mesh levels 1-3. As seen in Figures 54-55, convergence starts to become clear between meshes 4 and 5 where the lines follow each other more closely. Based on this, mesh level 4 was chosen as it optimized computational time with mesh independent results.


Particle Studies
Particle studies are an important factor in understanding how particles, such as from a human cough, can be transmitted throughout an environment. 1 µm size particles were selected to simulate the particles expelled from a person coughing. 100 particles were expelled from the mouth of two sitting mannequins, one on the driver side of the bus in row 3, and the other in the passenger side of the bus in row 9. From each particle study the final location of each particle was extracted, using this ending location was determined if each particle was either absorbed by a surface within the bus or removed through the ventilation system. A particle is “absorbed” after it contacts a surface or object inside the bus. The data is categorized into sections of the bus rows. These sections will be referred to as rows 1-11, with 1 beginning at the front of the bus. The data collected is used to determine if barriers and a parallel ventilation system are more effective.
Processing of Particle Study Data: Baseline Case Studies (Cases 1-8)
Note that “cases” are defined in the “CFD” section. For case studies 1-8, which analyze the baseline ventilation system in its various configurations, extraction of data and particle used the particle trajectory, in the x-direction, for each of the 100 particles. This data was extracted through SOLIDWORKS Flow Simulation’s export wizard. The data shows the position of each particle relative to the origin across its entire length of travel. For the analysis of whether the particles are being absorbed by a surface or removed through the ventilation system, the only data point needed is the final ending location. A MATLAB script was written to ease the extraction of each of these last data points for all 100 particles. The ending position of each of these particles was then imported into Microsoft Excel and shifted 5.55 m so that the zero position represents the front most inner face of the bus, as opposed to the origin which is located in some arbitrary location of the bus. These shifted values were then sorted into bins.
These bin boundaries were defined by the geometry of the bus seats themselves and are not equally sized, as seen in Figure 56, to ease in the conceptualization of where the particles end. It should be noted that although the bus only has 11 rows, there are 12 defined bins, this 12th bin is defined to only encapsulate the rear bus air return, meaning all the particles that enter this row were effectively removed by the ventilation system. The sorted data was then compiled into histograms and pie charts, representing the number of
particles deposited in each row and ratio of particles removed by the ventilation system to particles deposited, respectively.

Processing of Particle Study Data: Upflow Parallel Ventilation System (Cases 9-16)
Cases 9-16, which analyze the parallel ventilation system in its upflow various configurations, used a combination of methods to determine how many particles were removed by the ventilation system, how many particles were deposited on surfaces within the bus, and the location of these particles ending positions. To start, the particle trajectories in the x-direction for each of the 100 particles were extracted through SOLIDWORKS Flow Simulation’s export wizard. This data shows the position of each particle relative to the origin across its entire length of travel. For the analysis of whether the particles are being absorbed by a surface or removed through the ventilation system, the only data point needed is the final ending location.
A MATLAB script was written to ease the extraction of each of these last data points for all 100 particles. The ending position of each of these particles was then imported into Microsoft Excel and shifted 5.55 m so that the zero position represents the front most inner face of the bus, as opposed to the origin which located in some arbitrary location of the bus. These shifted values were then sorted into bins. These bin boundaries were defined by the geometry of the bus seats themselves and are not equally sized to ease in the conceptualization of where the particles end. The particles in these bins do not denote whether the particles are being removed by the ventilation system or are being absorbed by surfaces, solely their ending location. This is remedied using surface parameters which count the number of particles deposited on the interior faces of the lower ventilation system. These particle counts were then extracted from SOLIDWORKS Flow Simulation and subtracted from the appropriate rows of the sorted ending position data, and this gives the number of particles deposited on surfaces within each row. This data was then compiled into histograms and pie charts, representing the number of particles deposited in each row and ratio of particles removed by the ventilation system to particles deposited, respectively.
Processing of Particle Study Data: Downflow Parallel Ventilation System (Cases 17-24)
Cases 17-24, which analyze the parallel ventilation system, in its various downflow configurations, used a combination of methods to determine how many particles were removed by the ventilation system and how many particles were deposited on surfaces within the bus, as well as the of their ending positions. The reason the previously mentioned method does not work for the upflow cases is due to the physical geometry of the bus and how surface parameters work within the SOLIDWORKS Flow Simulation Space. Surface parameters only allow for the selection of an entire face of an object, which leads to the problem of why this method cannot be used for the upflow cases. In upflow, the particles are being removed through the upper ventilation system, which consists of three main surfaces, the front panel, the slot walls, and the
designed cap which is where air is being removed through. Each of these three surfaces span almost the entirety of the bus and therefore cannot give information on the specific row in which the particles are being removed without modifying the already existing model and rerunning the simulations.
To start, the particle trajectory in the x- and y-directions for each of the 100 particles were extracted through SOLIDWORKS Flow Simulation’s export wizard. This data shows the position of each particle relative to the origin across its entire length of travel. For the analysis of whether the particles are being absorbed by a surface or removed through the ventilation system, the only data points needed are the final ending locations in both the x- and y-axes.
A MATLAB script was written to ease the extraction of each of these last data points for all 100 particles. The ending position of each of these particles was then imported into Microsoft Excel, and the x-positions were shifted 5.55 m so that the zero position represents the front most inner face of the bus, as opposed to the origin which located in some arbitrary location of the bus. The final shifted x-positions were filtered to only include the particles whose y-position partner was below 1.955 m. This is the distance from the origin to the bottom most face of the upper ventilation system being as there is no other structure above this distance; it can be assumed that all the particles whose ending positions are above this point have been removed by the ventilation system.
The remaining particles show the ending positions of particles that were deposited on surfaces within the bus, which were sorted into bins. The sorted data was then compiled into histograms and pie charts, representing the number of particles deposited in each row and ratio of particles removed by the ventilation system to particles deposited, respectively.
Results
Short Summary of All CFD Results
SOLIDWORKS Flow Simulation was used to analyze the airflow within a transit bus to assess the overall effectiveness of the proposed novel parallel ventilation system being installed in the public transit bus under various testing configurations. These conditions include the addition of barriers, the added effect of thermal plume given off by a body, and the differences in flow direction by either having air supplied through the upper vents and removed through the lower system, referred to as ‘downflow’ or the same system but with air being supplied through the lower vents and removed through the upper ventilation system, referred to as ‘upflow’.
The addition of a parallel ventilation system shows an overall effectiveness in reducing the x-direction airflow across each seat row and the overall spread of particles between each row of the bus. Figure 59 and Figure 73 shows a reduction in the overall fluid flow moving in the x-direction throughout the length of the bus with the sole addition of a parallel ventilation system in a standard downflow configuration compared to the baseline case study. Tying in results from particle studies, as seen in Figure 61 and Figure 76, shows a significant reduction in the spread of rows which particles are being deposited in. This effect is especially prominent when looking at coughs projected in the front of the bus and becomes ambiguous when analyzing particles being expelled in the rear of the bus with more particles being deposited within each row but most of them being deposited on rows in which they were initially expelled.
As evident in Figure 73 and Figure 82, the addition of barriers to the downflow parallel ventilation system showed an even further reduction in the overall air flow moving in the x-direction throughout the length of the bus, with larger regions of near stagnant flow, which can be seen in the configuration without barriers. It can be inferred that the barriers themselves aid in stopping the flow throughout each seat row. Results from the particles studies, as seen in the bottom of Figure 76 and Figure 85, for each of rear seated passenger cases showed a decrease in the spread of rows in which particles were being deposited. However, as evident in the top of Figure 76 and Figure 86, the particle studies conducted in the front showed a decrease in the
number of particles being deposited and with a larger spread when the parallel ventilation system is aided with barriers.
The effect of reversing the flow of the ventilation system without the addition of barriers when compared to the parallel ventilation system in downflow, as seen in Figure 73 and Figure 90, shows signs of larger x-velocities throughout the length of the bus causing more air to flow between each row. The top of Figure 76 and Figure 93, which show the particle study results for particles emitted from the front of the bus, support this analysis due to more particles being deposited within the bus and with a larger distribution. However, the results of particles expelled in the rear of the bus, as seen in the bottom of Figure 76 and Figure 93, show complete efficiency at removing particles through the ventilation system with the upflow system. Both parallel ventilation system configurations appear to reduce flow of both particles and air throughout the bus more efficiently than the baseline bus case.
When comparing the effect of adding barriers to the parallel ventilation system in upflow, as seen in Figure 90 and Figure 98, the impact becomes uncertain, revealing larger regions of x-direction airflow in both positive and negative directions. This is supported by the particle study analysis, as seen in Figure 93 and Figure 101, which shows both an increase in the distribution as well as the number of particles that are being deposited throughout the bus.
The overall influence of thermal plume on airflow throughout the bus was studied to determine whether this factor can drastically change the overall flow patterns within the bus. When comparing the parallel ventilation system in downflow with barriers, in Figure 82 and Figure 86, the thermal plume cases show regions of higher velocities in a more erratic pattern as opposed to the cases without thermal plume. This pattern of erraticism is carried throughout most of the parallel ventilation system downflow cases. However, the effect of thermal plume on the configuration of the parallel ventilation system in upflow with barriers, shows similar airflow in the x-direction but larger velocities in the y-direction, which is likely caused by the combined updraft from each mannequin and the ventilation system itself. As seen in Figure 85 and Figure 89, this combined effect shows the greatest overall efficiency at removing particles through the ventilation system and maintaining the smallest spread of particle deposition. The overall trend of greater efficiency and less erratic x-direction movement throughout the bus due to the thermal plume effect is maintained to lesser extents for the other upflow cases.
To summarize, simulation results and analysis show that the implementation of a parallel ventilation system in either upflow or downflow generally shows a reduction in airflow and a narrower distribution of particles across the length of the bus compared to the baseline case. The addition of barriers showed an improved effect on the airflow and particle distribution throughout the bus when the parallel ventilation system is in its downflow configuration but gives questionable results in upflow. Finally, the overall effect of thermal plume on airflow can cause either erratic flow or improve the overall efficiency within the bus and should be evaluated on a case-by-case basis.
CFD Results: General Case Study Setup, Conditions and Explanation
The simulations cases were broken down into five conditions (Figure 57). The differentiating condition being termed the “baseline” and “parallel ventilation” cases. The “baseline” uses the stock ventilation system that supplies air and a fan in the rear which acts as an air return. Where the “parallel ventilation” system maintains the same upper ventilation system that supplies air but with an addition of lower ventilation system consisting of many branches capped with register boxes, which returns the air. Other physical conditions include the addition of 0.82x0.76m “barriers” mounted to the back of each seat. Studies were also conducted in which each mannequin was assigned a real wall surface temperature of 37°C to mimic the heat given off by the average human. The goal of these studies was to determine the overall effect of the thermal plume on the surrounding airflow and in turn the flow of particles throughout the bus. In the case of the parallel ventilation system, the effects of having the air supplied from the upper ventilation and the lower ventilation system returning the air, termed “downflow” was compared to the roles of the two ventilation systems being reversed, termed “upflow.” Finally, for all cases and set of conditions
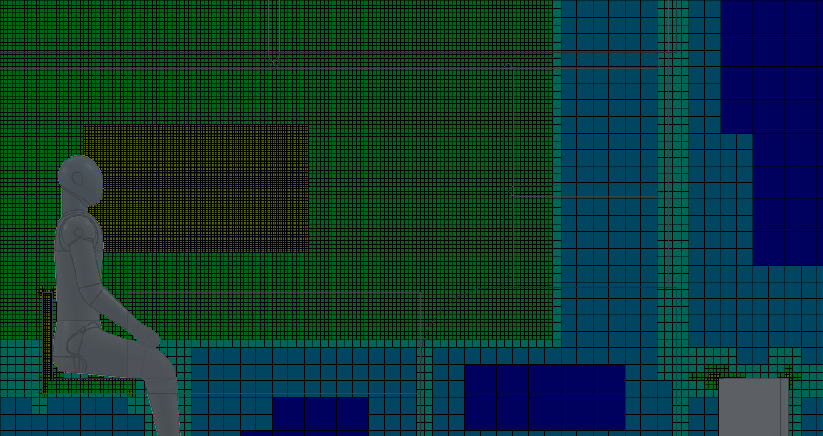
particles were injected from a passenger in the “front” or “rear.” The “front” coughing mannequin is located in the 3rd row on the driver side of the bus. The “rear” coughing mannequin is located in the 9th row on the passenger side of the bus. Both front and rear coughing particle studies were conducted from the same CFD simulations. Instead of breaking the bus into equal sized section, the bus was instead divided into rows containing each set of seat rows (Figure 58). Throughout all simulations the bus is filled to half capacity with one mannequin occupying each two-person bench seat. This is in an attempt to replicate similar loading situations to a bus under standard operation.


Particle studies were conducted for each case study, organized by Figure 57, for each of these cases 100 particles were injected with a diameter of 1µm. The particles were injected at a velocity of around 3.5m/s. This velocity is a product of the two boundary conditions that were required to get the desired particle behavior within the bus. These conditions are the injection velocity and a constant airflow inlet acting as the “cough” assigned to the mouth of the mannequin.
CFD Results: Case 1 & 3 (Baseline, Downflow, No Barriers, Front (1) and Back (3), No Thermal Plume)
Cases 1 and 3 are the baseline case studies in which no modifications have been made to the bus, they use a standard ventilation system, no added barriers, and are filled to half capacity with one person filling every two-person bench seat (Figure 57). Case 1 denotes the particle injection from a passenger seated in row 3 of the bus on the driver side, while case 3 analyzes particles injected from the passenger side of row 9. These case studies are the closest case to the unmodified bus and are what all other cases will be compared to when determining which modifications made to the bus are an effective improvement on reducing the number of airborne particles within the bus.
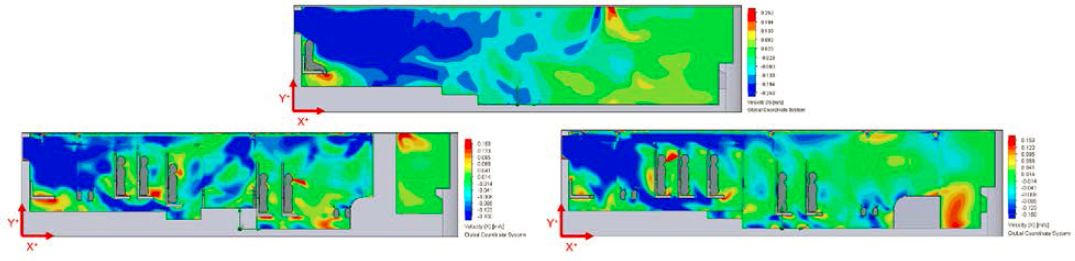
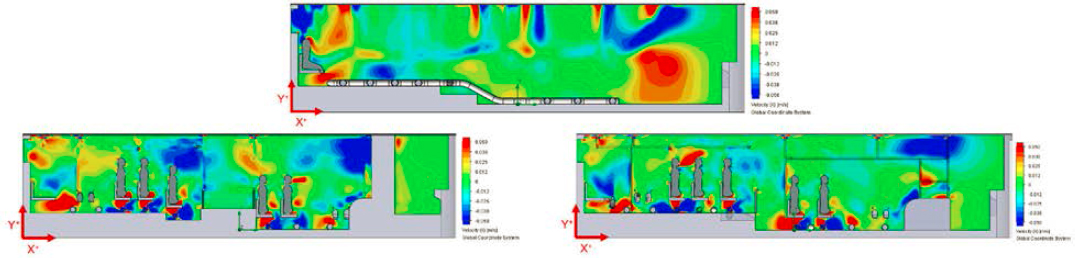
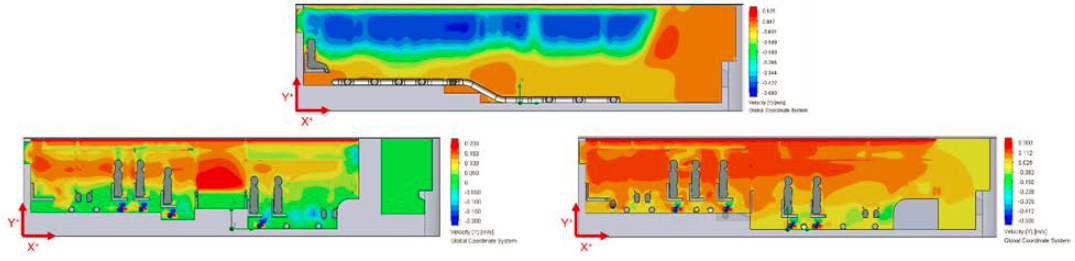
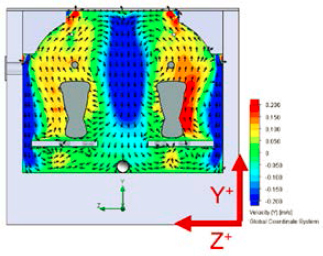
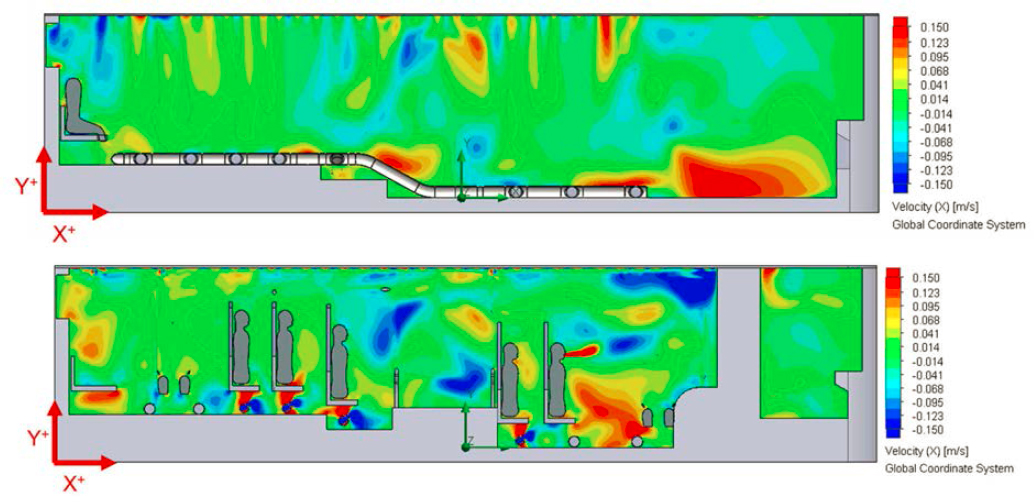
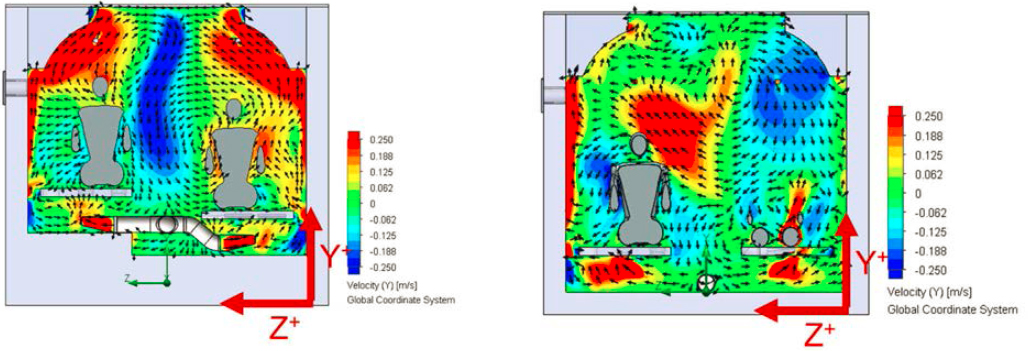
The CFD results from cases 1 and 3 shows flow velocities in the x-direction at a maximum value of around 0.1m/s. The bulk of this airflow, as seen in Figure 59, is in the section aft of the step which flows 0.1m/s in the negative x-direction. In the front of the bus, results show almost stagnant air in the middle plane while small recirculation zones appear on the driver and passenger side towards the ceiling and floor of the bus. Throughout the length of the bus, higher velocities tend to appear closer to the ceiling and floor as well as in the middle aisle of the bus. In the y-direction, regardless of location within the bus, the airflow consistently showed an updraft of around 0.3m/s flowing toward the air return located at the rear of the bus. Looking at the cross section parallel to the bus seat rows a significant downdraft appears coming down directly from the ventilation system throughout the length of the vent itself which is to be expected, however, as seen in Figure 60, a vortex-like artifact only appears on the driver side of the bus.


Overall, the particle studies showed the flow followed the airflow patterns avoiding most objects while depositing on the larger flatter faces such as the bus seats. In case 1, the particles tended to spiral as they moved from front of the bus toward the air return as this was the direction of most of the air flow.
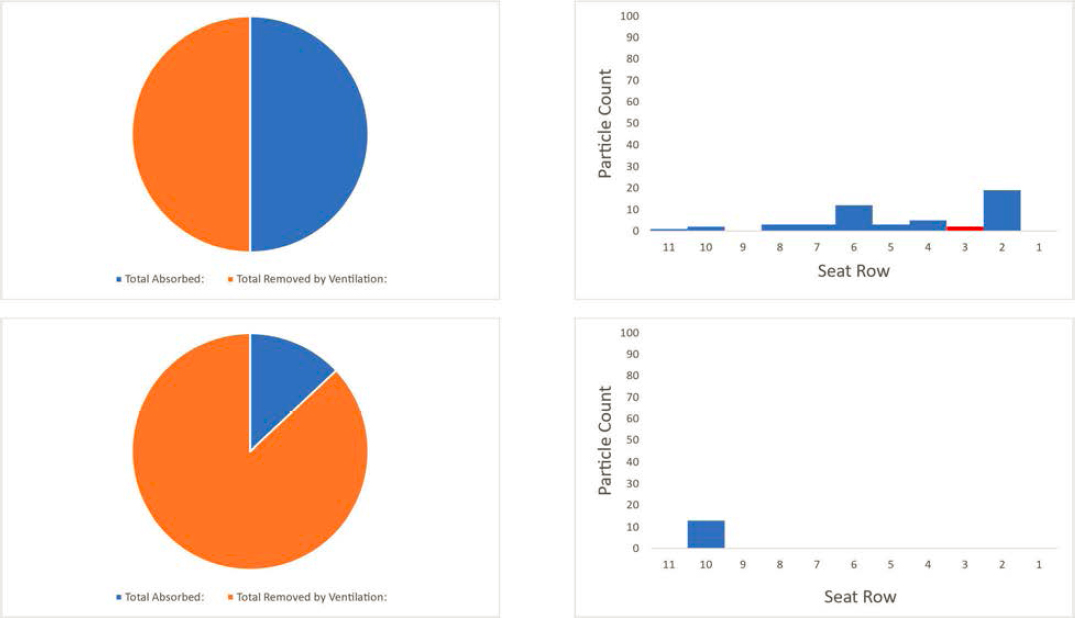
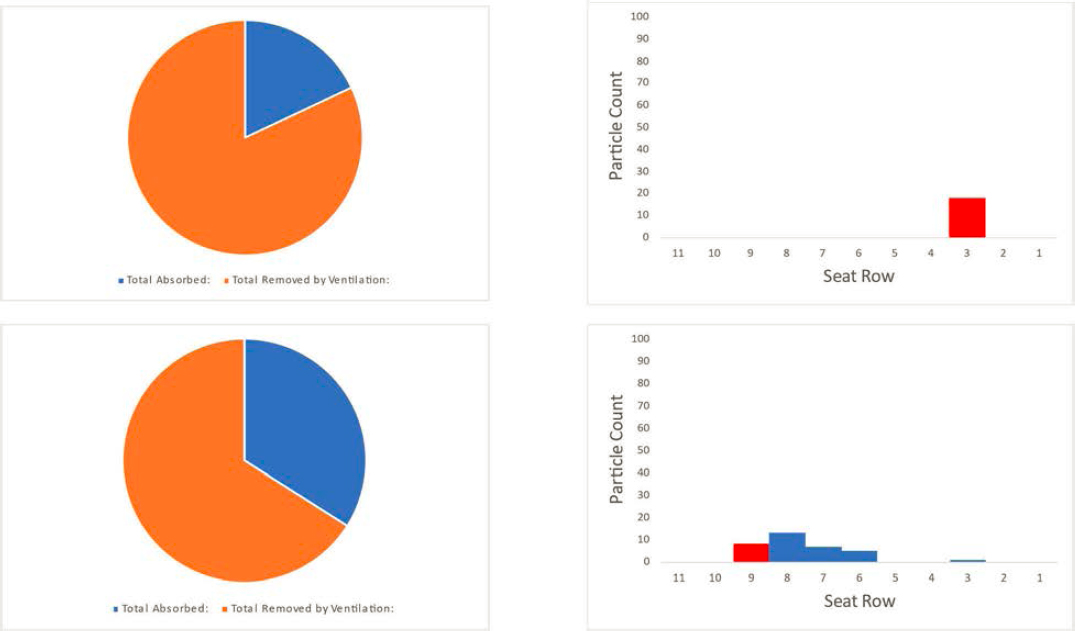
As seen in the top left of Figure 61, Case 1 showed that 50% of the injected particles were absorbed by surfaces within the bus while the rest were removed through the ventilation system. Top right of Figure 61 shows the largest deposit of these particles appeared in the seat row directly in front of the coughing mannequin. These particles were absorbed as the positive x-velocity transitioned to flow in the negative direction, mostly hitting one of the other mannequins in the face region. As the bulk of the remaining particles spiraled backwards smaller portions were deposited on other surfaces, one region that had a slight outlier to this was in row 6 where more particles tended to hit the luggage rack due to its larger flat surfaces. While only half of the particles were absorbed by surfaces of the bus, the remainder spiraled toward the back of the bus just above the heads of the mannequin, which may be a region that could be easily affected by the breathing of real passengers causing more absorption of particles.
As seen in the bottom left of Figure 61, Case 3 showed 87% of the particles were removed from the air by the stock ventilation system. The particles flowed almost directly from the coughing dummies mouth into the air return with minimal spiraling. The bottom right of Figure 61 shows all the particles that were not removed by the ventilation system were adsorbed by the leg of the mannequin located directly behind the row the particles were emitted. It can be inferred that being so close to the vent return allowed for a more-efficient removal of particles due to not having as many obstacles or the distance to form the spiraling behavior like case 1.
CFD Results: Case 2 & 4 (Baseline, Downflow, No Barriers, Front (2) and Back (4), Thermal Plume)
Cases 2 and 4 are the baseline case studies in which no physical modifications have been made to the bus. They use a standard ventilation system, no added barriers and filled to half capacity with one person filling every two-person bench seat. Despite no physical modification being made to the bus, these cases analyze the influence of thermal plume on the surrounding fluid flow, see Figure 57. Case 2 denotes the particle injection from a passenger seated in the driver side of row 3 of the bus on, while case 4 analyzes particles injected from the passenger side of row 9.
CFD results show there is a maximum airflow of approximately 0.2m/s, as seen in the top of Figure 62, throughout the bus in the x-direction. When, looking at the middle plane of the bus, there is a distinct separation of flow directions located near row 5 in which the air aft of this location flows in the negative x-direction, the air in the row is near stagnant, and air forward of this row moves in the positive x-direction. Continuing to look at the middle plane there are some distinct flow patterns coming towards the ceiling of the bus, which is likely caused by the intersecting airflows from the ventilation system. On both the driver and passenger sides of the bus airflow with a smaller magnitude although they form some recirculation zones, especially toward the wall separating the main bus body and the driver’s seat. As illustrated by the bottom of Figure 62, the flow has a general tendency to move through the headspace of the passengers, while occasionally dipping between the seat rows before circulating back up toward the ceiling and moving further backwards.

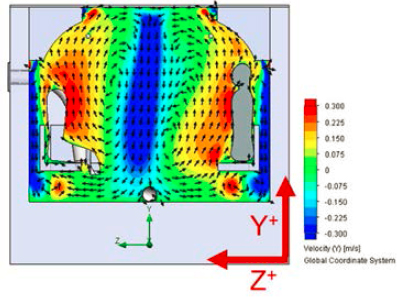
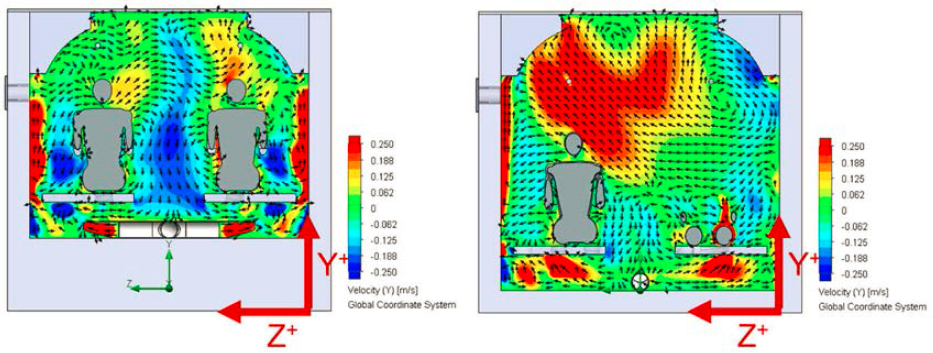
When looking at the cross section of the bus parallel to the seat rows, the airflow has tendency to spiral while mostly not crossing the middle aisle. As seen on the left of Figure 63, the air nearly always flowed in the positive y-direction when near any of mannequin. This flow continues up until nearly meeting the ceiling at which flow begins to circulate downward. This pattern leads to the conclusion that the thermal plume given off by a body has a significant enough effect to manipulate the airflow of its nearby surroundings. The right side of Figure 63 illustrates a significant region of downdraft appears in the rear half of the bus along the middle aisle. In the front of the bus, the driver side of the bus has a larger recirculation zone than the opposite, this is likely due to the asymmetric loading of passengers.

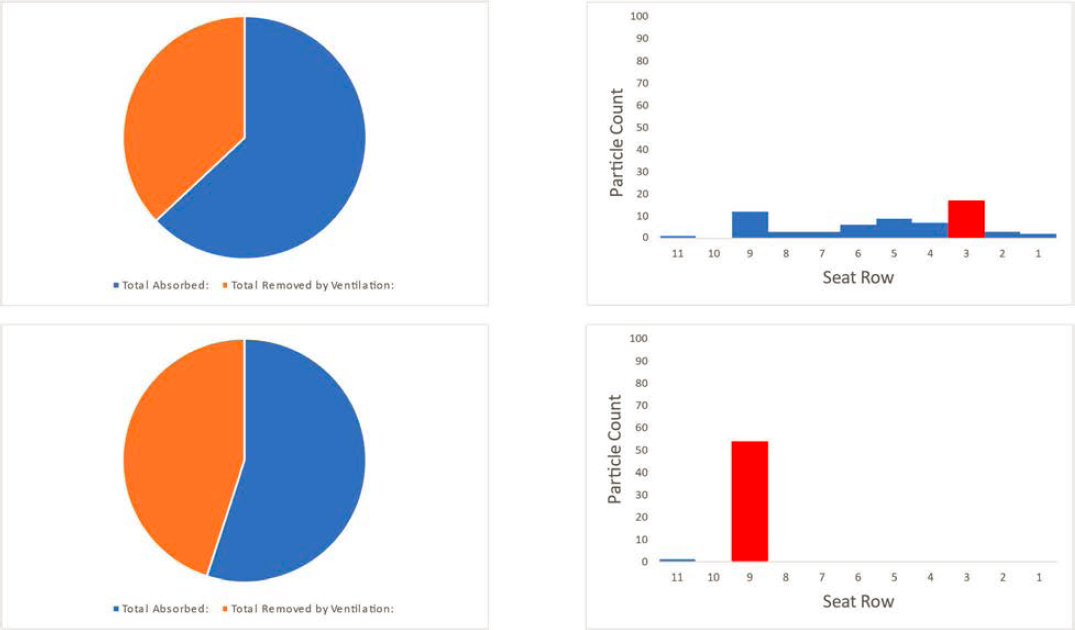
As seen in the top left of Figure 64, Case 2 showed 34% of the particles emitted were absorbed by surfaces within the bus while the rest were removed through the ventilation system. The top right of Figure 64 shows the largest deposition of these particles were in the row where the particles were inserted. The flow of these particles does not follow any pattern outside of moving toward the back of the bus, they cross in between rows, across aisles above and below seats, which leads to deposition on various surfaces.
As seen in the bottom left of Figure 64, Case 4 showed 94% of the particles emitted were removed by the ventilation. The particles overall tended to follow the same flow path. The bottom right of Figure 64 shows the particles moved directly across the aisle, depositing mostly on the mannequin in the same row but on the driver side and on the seat directly behind it, on their way to being removed by the rear vent air return.

CFD Results: Case 5 and 7 (Baseline, Downflow, Barriers, Front (5) and Back (7), No Thermal Plume)
Cases 5 and 7 are the baseline case studies in which 0.82x0.76m barriers are mounted to the rear of each seat back, they use a standard ventilation system, and the bus is filled to half capacity with one person filling every two-person bench seat (Figure 57). Case 5 denotes the particle injection from a passenger seated on the driver side of row 3, while case 7 analyzes particles injected from the passenger side of row 9. These cases will be the basis on determining the effectiveness of the simplest modification of adding barriers.
CFD results show there is a maximum airflow in the x-direction of approximately 0.3m/s, as seen in Figure 65, located in the rear half of the bus. Throughout the length of the bus most of the airflow moves toward the rear vent air return in the negative x-direction. The largest bulk airflow occurs through the middle aisle aft of the step. Most of the positive x-direction airflow occurs in rows 2 and 3 near the floor, these velocities occur below 0.1m/s. The air takes a mostly direct path toward the rear air vent return through the middle aisle. However, on either side of the bus the air flows over the barriers with some of the air circulating into the individual rows. Airflow on the driver side of the bus showed a pattern circulating downwards between the seat rows in the front and upwards in the rear half of the bus, while airflow on the passenger side of the bus circulated upwards between the seat rows, as seen in Figure 66, with y-velocities ranging from 0.05-2m/s.

When looking at a cross section parallel to seat rows, as seen in Figure 67, in the front of the bus where there are no barriers, a figure-eight like circulation zone forms with one loop being in the ceiling passenger side and the other in the floor driver side. This causes air mixing to occur across the entire width of the bus. Moving toward the back of the bus an air barrier with a direction slightly canted towards the driver side forms in the aisle. This behavior occurs throughout most regions to the aft of the first set of barriers in row 2 but becomes more prominent closer to the rear of the bus. This air barrier has velocity in the negative y-direction ranging from 2.8-4.5m/s. Aft of the step, this air barrier becomes prominent enough that recirculation zones form on either side of the aisle. These form mostly above the heads of each mannequin. Most of the air that crosses this air curtain boundary occurs near the floor.

As seen in the top left of Figure 68, Case 5 showed 58% of the particles were removed through the ventilation system while the remaining particles were absorbed by surfaces. The top right of Figure 68 shows the largest deposition of these particles was in the row directly in front of the coughing mannequin. The particles follow the generalized air flow throughout the bus with most of the particles being removed by the ventilation system moving down the center aisle and the particles that were absorbed spiraled between the seat rows impacted either the walls, seats, or barriers.
As seen in the bottom left of Figure 68, Case 7 showed 64% of the particles were removed through the ventilation system while the remaining particles were absorbed by surfaces. The bottom right of Figure 68 shows all the particles deposited on surfaces were in the same row as they were injected. This occurred as 36% of these particles impacted the barrier directly in front of the coughing mannequin. The rest of the particles spiraled backwards toward the rear vent air return.

CFD Results: Case 6 and 8 (Baseline, Downflow, Barriers, Front (6) and Back (8), Thermal Plume)
Cases 6 and 8 are the baseline case studies in which 0.82x0.76m barriers have been mounted to the rear of each seat back, they use a standard ventilation system, the bus is filled to half capacity with one person filling every two-person bench seat, and each mannequin has been prescribed a constant surface temperature (Figure 57). Case 6 denotes the particle injection from a passenger seated in the driver side of row 3, while case 8 analyzes particles injected from the passenger side of row 9. These cases will be used to analyze the combined effect of thermal plume and barrier modifications.
CFD results from cases 6 and 8 show the largest x-velocity, as seen in the top of Figure 69, to be around 2.5-3m/s moving toward the rear of the bus. A separation of flow direction appears in the middle aisle near seat row 2 with the flow aft of this location moving toward the rear while on the other side the flow moves toward the front of the bus. The bottom of Figure 69 illustrates how this behavior does not occur on either side of the middle aisle as most of the airflow trends towards the back of the bus. Analysis of the y-velocities shows downdraft in the middle aisle ranging from 2.5-5m/s, as seen in the top of Figure 70, while airflow trends upwards at y-velocities ranging from 2-5m/s and towards the rear of the bus in the seat areas, see the bottom of Figure 70. However, these areas are less homogenous in flow direction and magnitude with more mixing occurring toward the front of the bus and in between the seat rows.


When looking at the cross section of the bus parallel to the seat rows there is significant updraft flowing directly above and around the mannequins with y-velocities ranging from 0.2-0.35m/s. The top of Figure 71 shows this updraft is more prominent near the mannequin and reduces in velocity as the distance from the mannequin increases. This updraft dissipates more rapidly behind the mannequins than in front, as seen in the bottom left of Figure 71. This behavior is most likely caused by the barriers blocking the thermal updraft from radiating backwards as opposed to having more open space in front of the mannequin. Continuing to look at cross sections parallel to the row seats, like in the bottom right of Figure 71, two separate air curtains develop one in row 3 to half-ways through row 1 and the other aft of the step from rows 7 to 10. Between these two sections the downdraft in the middle is reduced. This is likely caused by the asymmetric geometry of the bus as well as having passengers located on only one side of the bus, which in turn creates unbalanced hot air flow.

As seen in the top left of Figure 72, Case 6 shows 37% of the particles emitted were removed through the ventilation system while the remaining 63% particles were absorbed by surfaces within the bus. Top right of Figure 72 shows the largest deposition of these particles occurred in the row which they were injected. After injection and initial dispersion, the particles had a tendency to stay on either side of the middle aisle and flows in between each seat row as they moved toward the rear air vent return, leading to consistent particles deposition throughout the length of the bus.
As seen in the bottom left of Figure 72, Case 8 particle study results show 45% of the particles emitted were removed through the ventilation system while the remaining 55% of the particles were absorbed by
surfaces within the bus. The bottom right of Figure 72 shows that 98% of the deposited particles were absorbed in the row which they were injected, impacting the barriers directly in front of coughing mannequin while unabsorbed particles flowed directly over the barriers into the rear vent air return.
CFD Results: Case 9 and 11 (Parallel Flow, Downflow, No Barriers, Front (6) and Back (8), No Thermal Plume)
Cases 9 and 11 analyze the effects of a parallel ventilation system, which encompasses a stock upper ventilation system and a lower system located along the floor that branches through each seat row (Figure 57). The bus is filled to half capacity with one person filling every two-person bench seat. Case 9 denotes the particle injection from a passenger seated on the driver side of row 3, while case 11 analyzes particles injected from the passenger side of row 9. These cases will be used to analyze the influence of having a lower ventilation system which actively removes air from the bus in each seat row.
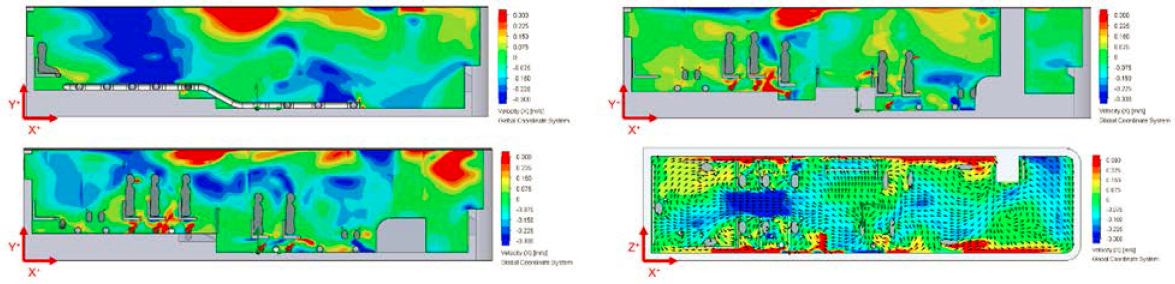
CFD results show most x-velocities throughout the bus are below 0.02m/s. while the maximum airflow velocity in the x-direction is around 0.06m/s, as seen in the top of Figure 73, in select pockets of the bus, specifically near the hall between passenger seating and the driver’s cab. In this hall, a recirculation zone forms within these larger velocities. This behavior is likely due to the difference in cross sectional area that the air flows through. Another cause for this could be that the parallel ventilation system ends in row 2 and the system loses its effect outside of a certain range, allowing the airflow’s x-velocity to increase. In addition to this area of higher x-velocities, the bottom of Figure 73 illustrates that along the ceiling edges of the bus there also appears to be an increase in velocity as the air circulates along the wall. Analysis of the y-velocities, in Figure 74, shows a prominent area of downdraft through the upper third of the middle
bus aisle with values ranging from 0.5-0.3m/s and regions of updraft to varying velocities, on either side of the middle aisle. However, this behavior of updraft is more prominent on the passenger side of the bus with larger regions of these maximum velocities.
When looking at cross sections parallel to the seat rows, there are two distinct recirculation zones that form with an air curtain forming in the middle aisle. This air curtain has a maximum velocity magnitude of 0.45m/s. As seen in Figure 75, these zones form with two vortexes, one slightly above the heads of the mannequin slightly offset toward the middle aisle, and the other nearly seat-level adjacent to the bus walls. The upper vortexes feedback along the ceiling and toward the air curtain, with a magnitude of 0.07-1.1m/s, which recirculates either back through the loop or into the lower vortex. This lower vortex recirculates the air and feeds it back into the lower ventilation system register boxes at lower velocities ranging from 0.03-0.5m/s. Each of these lower ventilation systems register boxes are being fed by the rows both forward and aft the ventilation system branch. In addition to these recirculation zones, significant downdrafts occur along the walls of the bus at y-velocities ranging from 0.3-0.5m/s which also feeds into the register boxes.
As seen in the top left of Figure 76, Case 9 showed 95% of particles removed through the ventilation system while the rest were absorbed by surfaces. The top right of Figure 76 shows the particles that were absorbed by the surfaces of the bus all ended within the row where the particles originated. Most of the particles followed a tight pattern, moving forward and upward then looping directly to the floor to be removed through the register boxes.
As seen in bottom left of Figure 76, Case 11 showed 42% of the particles were removed through the ventilation system while the rest were absorbed by surfaces. The bottom right of Figure 76 shows 44 of the 58 particles absorbed by surfaces within the bus were located within the row where the particles were injected. Most of the particles were absorbed either by the surrounding seats or bus walls, which is likely due to the large spiraling behavior of the particles.

CFD Results: Case 10 and 12 (Parallel Flow, Downflow, No Barriers, Front (10) and Back (12), Thermal Plume)
Cases 10 and 12 analyze the effects of thermal plume in addition to the parallel ventilation system with a stock upper ventilation system and a lower vent system that branches through each seat row (Figure 57). The bus is filled to half capacity with one person filling every two-person bench seat. Case 10 denotes the particle injection from a passenger seated on the driver side of row 3, while case 12 analyzes particles injected from the passenger side of row 9. These cases will be used to analyze the influence of having a lower ventilation system which actively removes air from the bus.
CFD results show most x-velocities throughout the bus are less than 0.1m/s, while the maximum x-velocity is nearly 0.2m/s throughout the length of the bus, as seen in the top of Figure 77. These x-velocities are especially prominent on either side of the middle aisle, as seen in the bottom of Figure 77, the floor in rows 2 and 3. Another significant pocket of larger x-velocities appears in front of the coughing mannequin in row 3. This cloud has x-velocities at 0.17m/s extending nearly 0.9m from the mannequin’s mouth with a diameter approximately 0.5m.

Looking at the y-velocities in Figure 78, there is a significant region of downdraft in the middle aisle with y-velocities ranging from 0.5-0.3m/s. Looking at cross sections parallel to the seat rows, these velocities are creating an air curtain down the middle aisle separating the flow in the driver and passenger side seats. This air curtain is consistent throughout rows 2-11, although, it almost touches the floor throughout the length of row 10. This may be due to the wider space of the middle aisle due to the orientation of the seats as well as the thermal effect of the mannequins feeding along the bus walls into the flow created from the upper ventilation system, as seen in Figure 79, causing a more significant airflow. The bottom of Figure 80 illustrates above each mannequin there are flame shaped y-velocity clouds with updraft velocities ranging from 0.2m/s directly next to the mannequin and 0.3m/s nearer the ceiling. On either side of the middle aisle one recirculation zone forms in the area directly surrounding each mannequin. These vortexes
are centered near the mannequins at 1.2-1.5m above the floor of the bus. The magnitude of velocities throughout these vortexes ranges from 0.03-1.1m/s.


As seen in the top left of Figure 81, Case 10 showed 82% of the injected particles were removed by the ventilation system while the rest were absorbed by surfaces within the bus. The top right of Figure 81 shows all the particles absorbed by surfaces within the row the particles were injected. Most of the particles followed a tight pattern forward and upward then looping directly to the floor to be removed by the register boxes.
As seen in the bottom left of Figure 81, Case 12 showed 62% of the injected particles were removed by the ventilation system while the rest were absorbed by surfaces within the bus. The bottom right of Figure 81 shows the largest area of deposition is in the row directly in front of where the particles were injected. Particle behavior in this study was quite erratic, moving as far forward as row 2 and back as far as row 10, even crossing the middle aisle numerous times.
CFD Results: Case 13 and 15 (Parallel Flow, Downflow, Barriers, Front (13) and Back (15), No Thermal Plume)
Cases 13 and 15 analyze the combined effects of barriers mounted to the rear of each seat and the parallel ventilation system with a stock upper vent and a lower vent system that branches through each seat row (Figure 57). The bus is filled to half capacity with one person filling every two-person bench seat. Case 13 denotes the particle injection from a passenger seated on the driver side of row 3, while case 15 analyzes particles injected from the passenger side of row 9.
CFD results showed most of the x-velocities throughout the length of the bus are maintained within 0.05m/s in either direction. The top of Figure 82 shows the largest x-velocities in the bus appear along the floor in the hall separating the passenger section and driver’s cabin of the bus with velocities of 1.5m/s in the positive direction. There are other pockets within the bus that show velocities higher than the typical x-velocities, as seen in the bottom of Figure 82, in the area above the cargo rack on the driver side of the bus as well as along the ceiling near the wall separating the passenger area and driver’s cabin.
As seen in the top of Figure 83, CFD results show a significant region of downdraft in the middle aisle with velocities as large as 0.5m/s in the section of the bus aft of the step. This downdraft dissipates quickly as the flow enters row 6, which is likely due to there not being a lower vent air return in this row section, as the downdraft reappears in rows 3-5. The bottom of Figure 83 shows y-velocities are larger in the air surrounding the mannequin with velocities ranging from 0.13-0.2m/s in the upward direction. These higher velocities also appear along the back of some of the seats, such as in rows 7, 8, and 10.

When looking at cross sections parallel to seat rows in the back of the bus, as seen in the left of Figure 84, an air curtain boundary appears quite distinctly, flowing nearly straight down, not favoring either side of the bus, with minimal air crossing this boundary along the floor. On either side of this boundary recirculation zones appear, centered around the chest of the seated mannequins. When looking at the front half of the bus, as seen in the right of Figure 84, this air curtain boundary occurs again, although it appears less defined, favoring the driver side and does not reach as close to the floor as in the rear of the bus. This is likely due to two factors, the asymmetrical and inconsistent seating of the front of the bus leading to non-
uniform location for air to be returned through and the greater distance from the floor to the ceiling of the bus due to the step located in the center of the bus.

As seen in top left of Figure 85, Case 13 showed 48% of the injected particles were removed by the ventilation system while the rest were absorbed by surfaces within the bus. The top right of Figure 85 shows most of the particles were absorbed by surfaces within the row the particles were injected. The particles tended to flow throughout the bus and then circulate in the same row until they were ultimately removed by the lower ventilation system or deposited on surfaces.
As seen in, the bottom left of Figure 85, Case 15 showed 42% of the injected particles were removed by the ventilation system while the rest were absorbed by surfaces within the bus. The bottom right of Figure 85 shows all but one of the particles were absorbed by surfaces within the row the particles were injected. None of the particles were able to cross the air curtain located in the middle aisle, so all of the particles were deposited within a range of two rows solely on the passenger side of the bus.
CFD Results: Case 14 and 16 (Parallel Flow, Downflow, Barriers, Front (14) and Back (16), Thermal Plume)
Cases 14 and 16 analyze the combined effects of barriers mounted to the rear of each seat, thermal plume, and the parallel ventilation system with a stock upper ventilation system and a lower vent system that branches through each seat row (Figure 57). The bus is filled to half capacity with one person filling every two-person bench seat. Case 14 denotes the particle injection from a passenger seated on the driver side of row 3, while case 16 analyzes particles injected from the passenger side of row 9.
CFD results showed most of the airflow’s x-velocities were less than 0.15m/s throughout the length of the bus. As seen in the top left of Figure 86, the larger velocities along the middle aisle in rows 1-2 and 7. The top right of Figure 86 shows the larger x-velocity cloud is maintained throughout most of 2 and 3, not just in the region immediately surrounding the coughing mannequin. The bottom of Figure 86 shows significant regions of high flow towards the rear of the bus along the floor of the bus located on either side of the middle aisle in rows 2-4. This region of airflow has flow velocities of up to 0.2m/s in the negative x-direction.
Analysis of the air flow in the y-direction shows the largest air velocities flowing at rates of 0.5m/s downward. The top of Figure 87 shows these larger velocities flowing down the middle aisle in jet-like clouds, reaching nearly halfway toward the floor in the rear of the bus and becoming inconsistent in rows 2-5. As seen in the bottom of Figure 87, there are larger regions of stagnant air with y-velocities of less than 0.02m/s in either direction. In contrast to these regions of lower flow velocities, the area immediately surrounding the mannequins shows y-velocities upwards of 0.2m/s.

Looking at cross sections of the bus parallel to the seat rows 9-10, as seen in the top of Figure 88, the larger y-velocities make a prominent air curtain creating a separation of airflow on either side of the middle aisle. This behavior also occurs in rows 2 and 6. These regions show recirculation zones forming on either side of the aisle, with airflow crossing the air curtain boundary along the floor. This air curtain is quite irregular and, as seen in the bottom of Figure 88, becomes nearly nonexistent allowing air to cross freely between either set of seats.

As seen in the top left of Figure 89, Case 14 showed 59% of the injected particles were removed by the ventilation system while the rest were absorbed by surfaces within the bus. The top right of Figure 89 shows most of the particles were deposited in the row in front of where they were injected, some of which hit the mannequin at this location. The particle flow throughout the bus was quite erratic, crossing seat rows and the aisle multiple times before eventually being removed by the ventilation system.
As seen in the bottom left of Figure 89, Case 16 showed 62% of the injected particles were removed by the ventilation system while the rest were absorbed by surfaces within the bus. The bottom right of Figure 89 shows most of the particles were absorbed by surfaces within the row the particles were injected. The particles mostly spiraled in the air surrounding the mannequin’s head until they were removed by the ventilation system or deposited on surfaces, while a smaller portion of the particles crossed the middle aisle to the other set of seats.

CFD Results: Case 17 and 19 (Parallel Flow, Upflow, No Barriers, Front (17) and Back (19), No Thermal Plume)
Cases 17 and 19 analyze the effects of having a parallel ventilation system with a stock upper ventilation system, acting as the air return and a lower vent system that branches through each seat row supplying air to the bus (Figure 57). The bus is filled to half capacity with one person filling every two-person bench seat. While 17 denotes the particle injection from a passenger seated on the driver side of row 3, while case 19 analyzes particles injected from the passenger side of row 9.
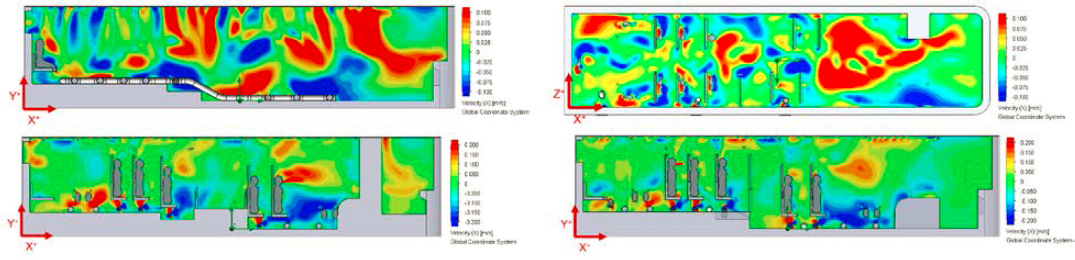
CFD results showed maximum airflow x-velocities of around 0.6m/s in certain pockets, where most of the x-velocities throughout the bus are maintained under 0.2m/s. As seen in the top left of Figure 90, the region of high velocities appears along the ceiling of the bus, in row 6. This pocket of fluid flow is maintained throughout most of the width of the bus. The top right of Figure 90 shows most of the airflow’s x-velocities throughout the driver side of the bus are under 0.1m/s with larger pockets of near stagnant air. However, on the passenger side, as seen in bottom left of Figure 90, there are larger sections of flow moving toward the back of the bus throughout most of the rows at velocities up to 0.25m/s. The bottom right of Figure 90 illustrates the combined effect of these difference in flows, creating a loop cycling fluid flow throughout most regions of the bus.
Analysis of the air flow in the y-direction shows the largest air velocities flowing at rates of 0.35m/s downwards. The top of Figure 91 illustrates this region of higher velocities, which occurs along the middle in rows 6 and 7, however, most of the air’s y-velocities outside of this region are below 0.05m/s in either direction. Looking at the driver side of the bus most of the air is near stagnant with y-velocities of less than 0.1m/s. As seen in the bottom left of Figure 91, there is a pocket of downwards moving air around the mannequin on the driver side of row 4, as well as clouds of significant updraft above the mannequins in rows 3 and 7. This updraft behavior appears in the passenger side of the bus, as seen in the bottom right of Figure 91, with the mannequins in rows 4 and 7-9. These clouds of larger updraft show y-velocities of 0.2-0.35m/s.

Looking at cross sections parallel to the seat rows, as seen in the left of Figure 92, a smaller air curtain appears in row 7 which partially separates airflow on either side of the middle aisle. This phenomenon does not appear anywhere else in the bus, as most of the airflow does not have a generalized tendency to move upwards or downwards, just mixing in many different directions as well as crossing the middle aisle as seen in the right of Figure 92.
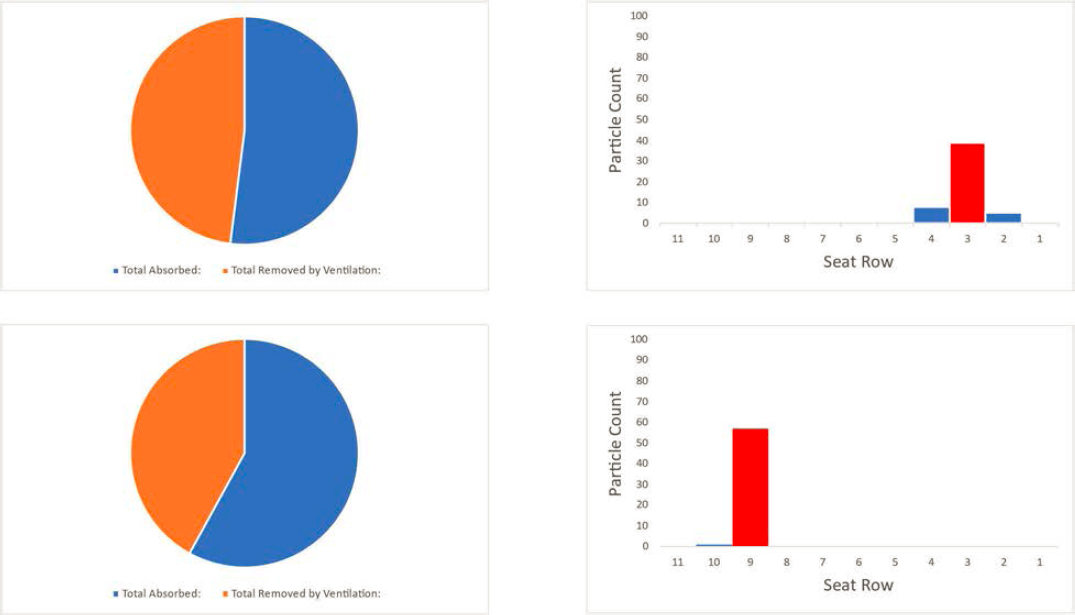
As seen in top left of Figure 93, Case 17 showed 32% of the injected particles were removed by the ventilation system while the rest were absorbed by surfaces within the bus. The top right of Figure 93 shows most of the particles were deposited in the row in front of where they were injected, 35 out of 47 of which hit the mannequin at this location. The particle flow throughout the bus was quite erratic, crossing seat rows and the aisle multiple times before eventually being removed by the ventilation system.
As seen in the bottom of Figure 93, Case 19 showed 100% of the injected particles were removed by the ventilation system while the rest were absorbed by surfaces within the bus. The particle flow followed a tight pattern as the particles moved forward one row before transitioning backwards and being removed by the upper ventilation system in rows 10 and 11.

CFD Results: Case 18 and 20 (Parallel Flow, Upflow, No Barriers, Front (18) and Back (20), Thermal Plume)
Cases 18 and 20 analyze the effects of having a parallel ventilation system with a stock upper ventilation system, acting as the air return and a lower vent system that branches through each seat row supplying air to the bus (Figure 57). The bus is filled to half capacity with one person filling every two-person bench seat. Case 18 denotes the particle injection from a passenger seated on the driver side of row 3, while case 20 analyzes particles injected from the passenger side of row 9.
CFD results showed maximum airflow x-velocities of around 0.4m/s in certain pockets, where most of the x-velocities throughout the bus are maintained under 0.2m/s. As seen in the top of Figure 94, the clouds of higher velocities appear in rows 5-6, moving up to 0.4m/s in the positive x-direction, and in rows 8-9, flowing 0.35m/s in the negative direction. The bottom left of Figure 94 shows lower x-velocities, mostly ranging from 0.02-0.1m/s in rows 2-8, with smaller pockets of 0.2m/s flow in the negative x-direction appearing in row 8. In addition to these smaller pockets of backdraft, a larger cloud appears above the mannequin’s head in row 10, flowing at rates of around 0.25m/s. The passenger side of the bus, as seen in the bottom right of Figure 94, sees many of these smaller pockets of negative x-direction flow throughout rows 2-8. Most of the airflow throughout the passenger side of the bus, outside of these pockets, is maintained under 0.1m/s in either direction.

Analysis of the air flow in the y-direction shows most of the fluid flow is under 0.4m/s, both in the upwards and downwards direction. The top of Figure 95 illustrates a unique phenomenon of high updraft velocities up 0.7m/s located in the middle aisle between rows 2 and 3. Within the middle aisle a significantly sized region of downdraft appears in rows 6-8 at velocities ranging from 0.2-0.35m/s. The bottom left of Figure 95 shows most of the airflow on the driver side of the bus has y-velocities of less than 0.1m/s with clouds of larger updraft around the mannequins in rows 3 and 7-9, with updraft velocities around 0.3m/s. This behavior is also exhibited on the passenger side of the bus, as seen in the bottom right of Figure 95, in rows 4 and 7-9. On both sides of the bus, larger velocities, up 0.7m/s, appear along the backs of the seat of the previously mentioned mannequin. This behavior appears to be caused by the outflow from the lower ventilation directly hitting the back of the seat and directing most of the flow upwards along these surfaces.

Looking at cross sections parallel to the seat rows, as seen in the left of Figure 96, rows 7-9 exhibit a distinct region of downdraft along the middle aisle causing a separation of recirculation zones, with varying degrees of efficiency based on how close to the floor this boundary reaches. Outside of these rows most of the airflow throughout the bus is not inhibited by an air curtain and is therefore free to mix between the aisle, moving both upwards and downwards, as seen in the right of Figure 96.
As seen in the top left of Figure 97, Case 18 showed 56% of the injected particles were removed by the ventilation system while the rest were absorbed by surfaces within the bus. The top right of Figure 97 shows most of the particles were deposited in the row behind where they were injected. The particle flow throughout the bus was quite erratic, crossing seat rows and the aisle multiple times before eventually being removed by the ventilation system or deposited on surfaces.
As seen in the bottom left of Figure 97, Case 20 showed 81% of the injected particles were removed by the ventilation system while the rest were absorbed by surfaces within the bus. The bottom right of Figure 97 shows most of the particles were deposited on the furthest back row of the bus. The particle flow throughout the bus tended to follow a similar pattern, although it had a widespread as it moved along a similar trajectory.

CFD Results: Case 21 and 23 (Parallel Flow, Upflow, Barriers, Front (21) and Back (23), No Thermal Plume)
Cases 21 and 23 analyze the combined effects of having barriers mounted to the rear of each seat and a parallel ventilation system with a stock upper vent system, acting as the air return and a lower vent system that branches through each seat row supplying air to the bus (Figure 57). The bus is filled to half capacity with one person filling every two-person bench seat. Case 21 denotes the particle injection from a passenger seated on the driver side of row 3, while case 23 analyzes particles injected from the passenger side of row 9.
CFD results showed most x-velocities throughout the bus were below 0.2m/s in either direction. As seen in the top of Figure 98, the maximum x-velocities appear along the middle aisle in rows 9 and 10 at up to 0.4m/s towards the rear of the bus. This middle aisle shows another significantly sized region of rear moving flow in rows 1-4 with x-velocities of 0.1-0.25m/s. Looking at the driver side of the bus, as seen in the bottom left of Figure 98, most airflow is below 0.1m/s. Small pockets of larger x-velocities appear in rows 2 and 6, with velocities of 0.2m/s in the negative direction and 0.3m/s in the positive direction, respectively. These pockets are likely created by the lack of barriers inhibiting flow along the length of the bus. The bottom right of Figure 98 shows more of these pockets of backwards moving airflow on the passenger side of the bus, with x-velocities of up 0.25m/s. While one of these pockets also appears in row 2, most of the other pockets appear along the ceiling of the bus, which are especially prominent in the region aft of the step.

Analysis of the air flow in the y-direction shows most of the fluid flow is under 0.45m/s, both in the upwards and downwards direction, with some airflow pockets reaching y-velocities as high as 0.65m/s. The top of Figure 99 shows an irregularly shaped cloud of downflow along the middle aisle in the rear half of the bus with velocities averaging 0.25m/s and three plumes located in the front half of the bus with velocities ranging from 0.2-0.4m/s flowing upwards. As seen in the bottom of Figure 99, most of the airflow is near stagnant with y-velocities of less than 0.05m/s. However, there are significant regions of updraft in the immediate area surrounding the mannequins in rows 2, 4, and 7-8, but not the other mannequins. These higher velocities tend to travel along the backs of the seats before flowing up and over the mannequin’s head before reaching the ceiling.

Looking at cross sections parallel to the seat rows, as seen in the left of Figure 100, rows 9 and part of 10 show significant enough downdraft through the middle aisle to cause a separation of airflow, allowing one recirculation zone to appear on either side of this barrier as air is being removed through the upper ventilation system. This behavior is not maintained throughout the rest of the bus, as seen in the right of Figure 100 with airflow mixing and crossing the middle aisle without any noticeable pattern.

As seen in the top left of Figure 101, Case 21 showed 80% of the injected particles were removed by the ventilation system while the rest were absorbed by surfaces within the bus. The top right of Figure 101 shows that most of the particles were deposited in the first three rows of the bus. The particle flow throughout the bus was quite erratic, crossing seat rows and the middle aisle multiple times before eventually being removed by the ventilation system or deposited on surfaces.
As seen in the bottom left of Figure 101, Case 23 showed 43% of the injected particles were removed by the ventilation system while the rest were absorbed by surfaces within the bus. The bottom right of Figure 101 shows most of the particles were deposited in the row behind where they were injected. The particle flow throughout the bus was mostly contained to the rear half, passenger side of the bus, with a few outliers moving to the front of the driver side of the bus before being removed by the ventilation system or deposited on surfaces.

CFD Results: Case 22 and 24 (Parallel Flow, Upflow, Barriers, Front (22) and Back (24), Thermal Plume)
Cases 22 and 24 analyzes the combined effects of having barriers mounted to the rear of each seat, thermal plume, and a parallel ventilation system with a stock upper ventilation system, acting as the air return and a lower vent system that branches through each seat row supplying air to the bus (Figure 57). The bus is filled to half capacity with one person filling every two-person bench seat. Case 22 denotes the particle injection from a passenger seated on the driver side of row 3, while case 24 analyzes particles injected from the passenger side of row 9.
CFD results showed most x-velocities throughout the bus were below 0.15m/s with pockets reaching as high as 0.4m/s in negative direction. As seen in the top of Figure 102, these larger velocities appear along the ceiling and floor of the middle aisle within rows 9 and 10 as well as along the floor of rows 2-4. Airflow throughout the remainder of this middle aisle region is maintained mostly under x-velocities of 0.1m/s. Looking at the driver side of the bus, as seen in the bottom left of Figure 102, most of the airflow’s x-velocities above the mannequin’s chest are below 0.1m/s, while regions below show significant amount of forward and backwards moving airflow ranging from 0.2-0.3m/s. The bottom right of Figure 102 shows similar airflow along the lower half of the bus of the passenger side of the bus. However, a cloud of airflow appears along the ceiling of rows 8-11, with x-velocities up to 0.3m/s in the negative direction.

Analysis of the air flow in the y-direction shows most of the fluid flow is below 0.15m/s in either direction, with velocities reaching as high as 0.45m/s. The top of Figure 103 shows an irregularly shaped cloud of downflow along the middle aisle in the rear half of the bus with velocities ranging from 0.2-0.45m/s and three plumes located in the front half of the bus with velocities ranging from 0.2-0.7m/s flowing upwards. Looking at the driver and passenger sides of the bus, as seen in the bottom of Figure 103, the mannequins in rows 3-5 and 7-9, show distinct regions of updraft surrounding them, mostly flowing along the backs of the seats, and rolling forward above the mannequin’s head, until the flow reaches the ceiling. The air outside of these plumes have velocities mostly under 0.1m/s except for the area along the step, in row 6 which show negative y-velocities ranging from 0.15-0.25m/s.

Looking at cross sections parallel to the seat rows, as seen in Figure 104, rows 8 and 9 have significant enough downdraft in the middle aisle to form an air curtain which causes a separation of flow on either side of the middle aisle. This behavior does not form regularly shaped recirculation zones, however, one does still form on either side of the bus, just with larger regions of higher flow rates and smaller regions of lower flow rates. As evidenced by Figure 104, this distinct air curtain is not maintained throughout the remainder of the bus, but there are still recirculation zones that appear with slight mixing along the middle aisle.

As seen in the top left of Figure 105, Case 22 showed 95% of the injected particles were removed by the ventilation system while the rest were absorbed by surfaces within the bus. The top right of Figure 105 shows all the particles that were deposited in the row where they were injected. The particles flowed directly forward and were directly removed by the ventilation system, with minimal spiraling or deviations.
As seen in the bottom left of Figure 105, Case 24 showed 93% of the injected particles were removed by the ventilation system while the rest were absorbed by surfaces within the bus. The bottom right of Figure 105 shows most of the particles that were deposited were in the row where they were injected. The particles moved in varying directions with erratic behavior but were removed by the swiftly removed by the ventilation system or deposited on surfaces.

CFD Results: Baseline Ventilation System without Thermal Plume: Barriers vs No Barriers
As seen in Figure 59 and Figure 65, the addition of barriers to the bus with the baseline ventilation system showed a generalized reduction in the x-velocity airflow moving throughout each row. This reduction is especially prominent in the rear of the bus on either side of the middle aisle with pockets of lower x-velocities forming around the clumps of seats. In contrast to the reduction in x-velocities, analysis of the flows in the y-direction showed an increase in both the velocities and regions of higher flow, especially between the seat rows with barriers.
Barrier modifications caused a different set of changes to the particle studies conducted in both the front and rear of the bus. The top of Figure 61 and Figure 68 show that the addition of barriers increased the number of particles being removed by the ventilation system while simultaneously creating a more even distribution of particles throughout each seat row. One explanation for this behavior is the addition of barriers increases the spiraling trajectory throughout the bus and with the particles having larger more consistent obstacles to collide with a more even distribution is created. The bottom of Figure 61 and Figure 68 show that all the particles emitted were already being deposited in a single row, however, with the addition of barriers there is a shift in this deposition forward one row, to where the particles were initially emitted. The cause behind this is when expelled the particles are moving directly forward and immediately impacting the barriers directly in front of the coughing mannequin.
When comparing the front and rear cases of this configuration, the likely cause for the differences in behavior is the magnitude of the x-velocities within the bus at these locations, the front of the bus generally shows lower velocities as opposed to the rear which, due to being closer to the rear air return, has larger x-
velocities. The lower velocities in the front allow for more cross-sectional mixing where in the rear the x-directional flow dominates decreasing the particles’ ability to move around obstacles. From this information, it can be concluded that the sole modification of adding barriers to the baseline configuration has some effect on particle deposition but does not show evidence of being more efficient at removing particles from the bus.
CFD Results: Baseline Ventilation System without Barriers: Thermal vs No Thermal Plume
As seen in Figure 59 and Figure 62, the implementation of thermal plume to the baseline bus configuration showed a general reduction in x-velocity airflow moving throughout each row. This reduction in x-velocity is especially prominent on either side of the middle aisle. Analysis showed larger y-velocities within both the driver and passenger sides of the bus of velocities nearing 0.2m/s as opposed to 0.1m/s. Particle study results, as seen at the top of Figure 61 and Figure 64, showed that the added thermal plume effects increased the number particles removed by the ventilation system when emitted from the front of the bus, while creating a more even distribution with each seat row. This is likely caused by the increase in updraft due to the thermal plume from each mannequin allowing for the particles to move above the seats reducing the number of obstacles available for the particles to deposit upon.
The bottom of Figure 61 and Figure 64 show similar amounts of particles being removed by the ventilation system, but with an increase in the spread of particles distribution throughout the rear of the bus. This behavior is likely caused by the recirculation zones that form in the rear of the bus and form due to the symmetrical effect of the thermal plume given off by each mannequin, causing a more spiraling trajectory as the particles move toward the rear of the bus before being removed by the ventilation system. From this data, it can be inferred that the thermal plume indeed has enough of an effect on the overall airflow throughout the bus to change the trends of particle flow and deposition.
CFD Results: Baseline Ventilation System with Barriers: Thermal vs No Thermal Plume
As evident in Figure 65 and Figure 69, the simulation of thermal plume effects on the baseline bus with barriers cases showed similar patterns of airflow within the x-direction in both magnitude and generalized shapes, with the cases simulating the thermal plume effect having a larger spread of higher airflow in the middle aisle, reaching further towards the front of the bus. Examination of the flow patterns in the y-direction, as seen in Figure 66 and Figure 70, showed an increase in the overall flow throughout the bus while maintaining similar maximum velocities. The general trends and patterns of the y-velocities were maintained with the thermal plume cases having larger regions of these higher velocities surrounding each of the mannequins.
Analysis of the particle studies within these cases showed an increase in the number of particles being deposited on surfaces within the bus when thermal plume was considered (Figure 68), as opposed to the baseline bus configuration with the barrier modification, as seen in Figure 72. One of the larger factors behind this is the mixing induced by the initial downflow of air coming from the ventilation system and the updraft caused in the air immediately surrounding the mannequins. This mixing tends to increase the spiraling behavior of particles as they move toward the rear of the bus. This increased spiraling behavior then leads to a tendency for these particles to impact the added barriers throughout the bus. This leads to the conclusion that the thermal plume given off by each mannequin has enough effect on the airflow in the bus to cause a change in overall trends of airflow throughout the bus.
CFD Results: Parallel Ventilation System in Downflow, without Thermal Plume: Barriers vs No Barriers
As evident in Figure 73 and Figure 82, the addition of barriers to the downflow parallel ventilation system showed a reduction in the overall air flow moving in the x-direction throughout the length of the bus, with larger regions of near stagnant air flow and less of the larger pockets of backdraft which can be seen in the
configuration without barriers. It can be inferred that the barriers themselves aid in stopping the flow throughout each seat row. The addition of barriers to the bus showed a reduction in the number of particles being removed from the newly designed parallel ventilation system, see the top of Figure 76 and Figure 85. As evident in the bottom of Figure 84, this appears to be caused by an increase in spiraling behavior of air and particles within each seat row, due to the separation of airflow both through the middle aisle and between the seats. This spiraling behavior increases the time particles are in a region as opposed to the more direct removal of the particles without the addition of the barriers.
The addition of barriers appears to have less of an effect in the rear of the bus, as seen in the bottom of Figure 76 and Figure 85, where the same number of particles were removed through the ventilation system, the overall distribution changed, with some particles being absorbed in the row directly behind where they were emitted. The overall trajectories of these particles tended to move more erratically in the barrier configuration as opposed to without. One possible reason behind the difference in airflow behavior in the front and rear of the bus is the irregular organization of the seating in the front of the bus, in contrast to the nearly symmetrical layout in the rear. This difference may be leading to unbalanced velocities on either side of the middle aisle, which in turn increases the vortexing within these regions. It can be inferred that the addition of barriers has enough of an effect on the airflow in the bus to cause a change in overall trends of airflow throughout the bus, to varying degrees depending on the longitudinal location within the bus.
CFD Results: Parallel Ventilation System in Downflow, without Barriers: Thermal vs No Thermal Plume
Analysis of the thermal plume effects on the parallel ventilation system in its downflow configuration, depicted in Figure 73 and Figure 77, showed an increase in both the maximum x-velocities as well as the size and number of erratic flow patterns when the thermal plume effect is considered. As seen in Figure 74, Figure 78 and Figure 80, the addition of the thermal plume effect decreases the uniformity of the air curtain formed in the middle aisle and the overall y-velocity magnitude of this downdraft. This disruption to the uniformity of the airflow is carried to either side of the middle aisle by almost eliminating the near constant y-velocity profile which spanned significant sized regions of the bus in the cases not considering thermal plume. This behavior changed to form mixed regions of both up and downdraft throughout various seat rows.
Analysis of the thermal plume effects on the parallel ventilation system bus configuration showed a reduction in the number of particles being removed through the ventilation system while the trend in distribution and trajectories remained the same, as seen in the top of Figure 76 and Figure 81. This phenomenon may be caused by the downflow from the parallel ventilation system outweighing the updraft caused by the thermal plume effects. In contrast to these results, the bottom of Figure 76 and Figure 81 suggest the thermal plume has a far greater effect on the airflow in the rear of the bus, with larger regions of updraft causing particles to flow throughout nearly the entire length of the bus. The difference in thermal plume effect between the front and rear of the bus could be caused by the proximity of the mannequin’s head to the ceiling of the bus, which in the rear is far shorter, allowing for these velocities to accumulate and move along this ceiling boundary. From this information, it can be inferred that thermal plume can have enough effect to influence overall flows throughout the bus.
CFD Results: Parallel Ventilation System in Downflow, with Barriers: Thermal vs No Thermal Plume
Analysis of the thermal plume effects on the parallel ventilation system in its downflow configuration with barriers, as seen in Figure 73, Figure 82 and Figure 86, show similar patterns of airflow within the x-direction in both magnitude and generalized shapes on either side of the aisle. However, within this middle aisle the x-velocities became more extreme with larger pockets of positive and negative directional flow forming throughout the length of the bus. As seen in Figure 83 and Figure 87, the addition of the thermal
plume effect decreases the velocity of the down drafting air curtain while also increasing the effective region in which this downdraft occurs.
On either side of the middle aisle, the y-velocities are mostly the same throughout the bus maintaining similar velocities and flow patterns. Analysis of the thermal plume effects on the parallel ventilation system bus configuration with barriers showed an increase in the number of particles being removed through the ventilation system with the overall pattern of deposition remaining the same, as seen in Figure 85 and Figure 89. The overall trajectories of particles trended along the same direction for both the thermal plume and non-thermal plume cases indicating, that the thermal plume has less of an effect in the parallel ventilation system with barriers than in the previous studies cases. This is most likely caused by the airflow in each row being dominated by the downflow of the ventilation system, overruling the effects of the updraft created by the thermal plume.
CFD Results: Parallel Ventilation System in Upflow without Thermal Plume: Barriers vs No Barriers
When comparing the effect of adding barriers to the parallel ventilation system in upflow, as seen in Figure 90 and Figure 98, the impact becomes uncertain, revealing larger regions of x-direction airflow in both positive and negative directions. Y-velocity analysis showed the result of adding barriers to the upflow configuration, as seen in Figure 91 and Figure 99, showed similar flow patterns to the bus without barriers. Particle study results also showed an improvement in the number of particles emitted from the front of the bus being removed from the parallel ventilation system, as seen in the top of Figure 93 and Figure 101. However, for particles emitted in the rear of the bus, the bottom of Figure 93 and Figure 101 show the addition of the barriers caused the number of particles removed through the ventilation system to decrease from 100% to 55% of the total particles. Comparing the generalized trajectories of the particles emitted from both the front and rear of the bus, it appears the barriers increased the erratic movement throughout the bus causing this wider spread of depositions. From this information, it can be inferred that while the barriers have an influence over the bulk fluid flow throughout the bus, it is not necessarily an improvement when considering the spread and deposition of particles.
CFD Results: Parallel Ventilation System in Upflow, with Barriers: Thermal vs No Thermal
As evident in Figure 98 and Figure 102, the effect of thermal plume on the parallel ventilation system in its upflow configuration with barriers showed similar patterns and x-directional velocities within the middle aisle. However, there was an increase in the size of the maximum airflow regions that form on either side of the middle aisle, while maintaining similar maximum x-velocities. Analysis of flow in the y-direction, as seen in Figure 99 and Figure 103, showed similar y-velocity contours and magnitudes with the cases simulating thermal plume having larger region of these higher velocities, especially within rows 7-9, where the mannequins are mostly closely and regularly spaced throughout the bus. As seen in Figure 101 and Figure 105, the addition of the thermal plume effect to the barriers showed the greatest increase in particles removed through the parallel ventilation system in both particles emitted from the front and rear of the bus. This is likely caused by the upflow from the ventilation system being supplemented with the updraft caused by the thermal plume, all while being constrained between the barriers, channeling the total upwards moving airflow, which in turns removes particles most efficiently. Analysis of the particle trajectories show, that although the particles were not removed in the same row they were emitted, the particles flowed directly from the coughing mannequin’s mouth to the upper ventilation system crossing the middle aisle of the bus. The combined effect not only reduces the overall particles removed but also the spread of where the particles were deposited.


