Protecting Transportation Employees and the Traveling Public from Airborne Diseases (2024)
Chapter: Appendix A: Laboratory Tests
Appendix A
Laboratory Tests
A-1 Indoor CO2 test
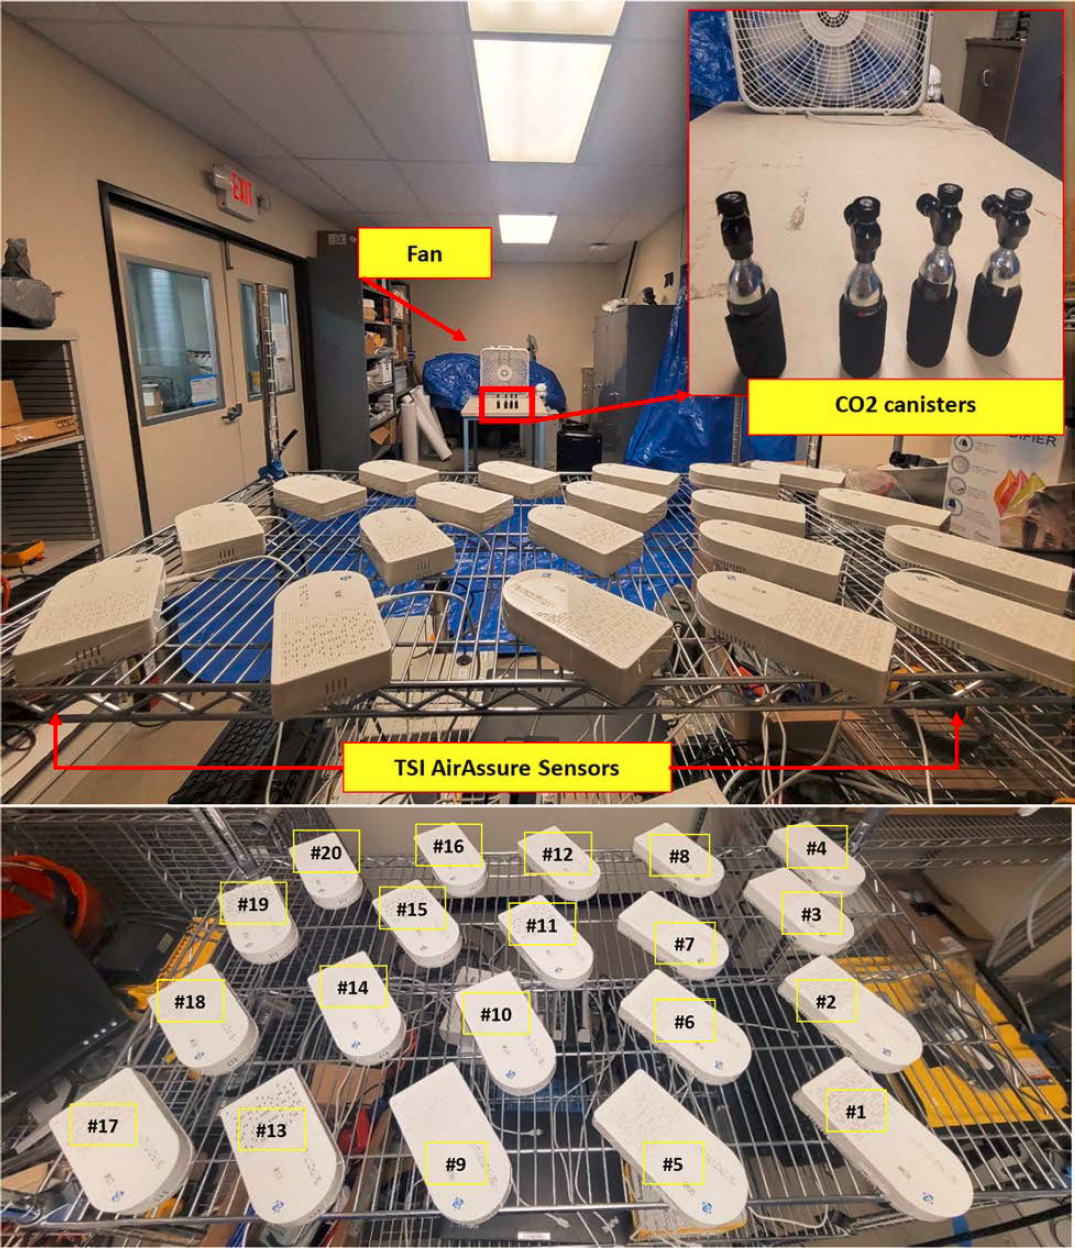
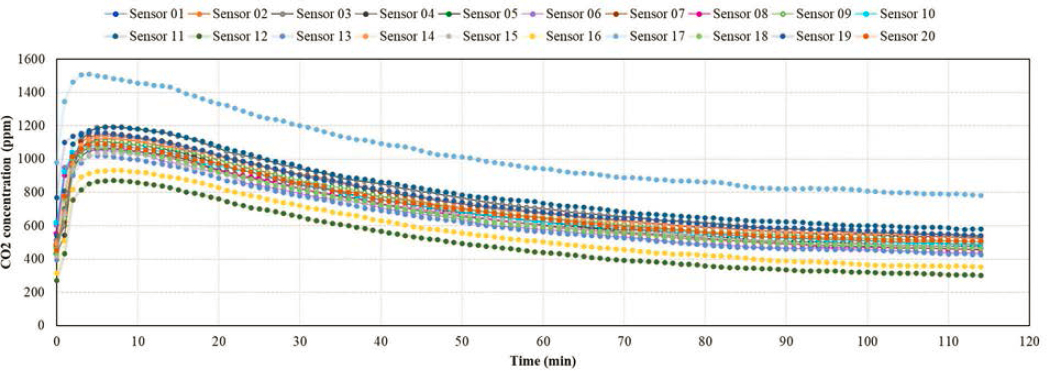
Laboratory CO2 testing was conducted to record gas detection from 20 TSI AirAssure (8144-2) IAQ monitoring sensors. TSI sensors are equipped with a Sensirion SCD30 module that detects CO2 concentrations, humidity, and temperature. The SCD30 uses nondispersive infrared (NDIR) sensory technology for detecting CO2 with specs listed in Table A1. The 20 sensors were spaced on a 48-inch-width by 24-inch-depth steel shelf unit at a height of 5 ft. The sensors were powered on simultaneously to record background concentrations prior to testing. Sensors were spaced 3 inch away from four 25g CO2 canisters shown in Figure A1. The canisters were placed approximately 5 ft away from the inlet of a 20 in x 20 in. fan with airflow directed toward one wall to provide air recirculation and promote mixing of the gas within a 68 m3 space. All canisters were released simultaneously with a fan speed of 4.4 m/s. Air exchange was provided from 1-inch undercuts of the testing space doors. The sensors measured CO2 concentration levels for a period of 2 hours until it reached background concentrations, results are shown in Figure A2.
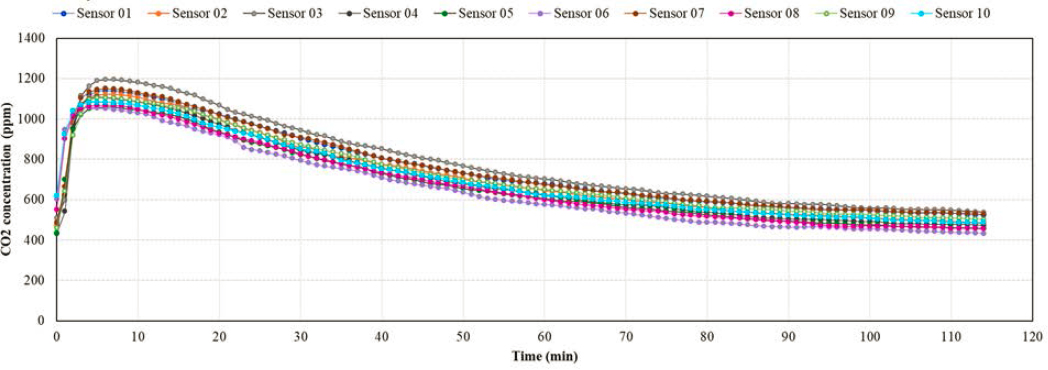
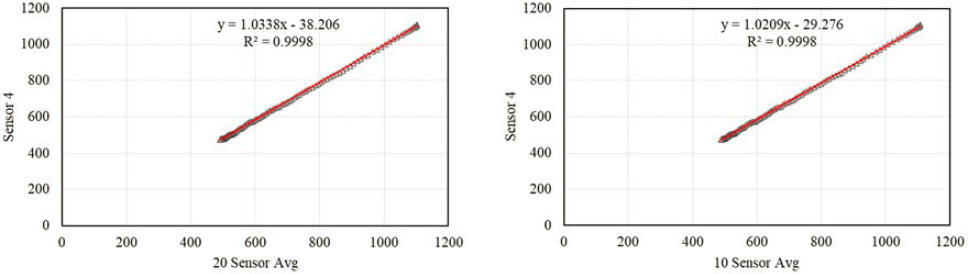
All sensors except for #12, #16, and #17 were within one standard deviation from the average. These sensors showed high correlations of r2 = 0.993 to 0.998 when compared to the average but had large offset concentrations of -126 ppm, -82 ppm, and +267 ppm respectively. When reduced to a ten-sensor average with sensors #1-#10, all were within one standard deviation except for #3 and #6. These sensors also had high correlations to the average but had lower offset concentrations, see Figure A3. Sensor #4 was selected as a baseline due to having a combination of the highest correlation to both 20-sensor and 10-sensor average values, and having minimal offset values, see Figure A4 which shows a subset of Figure A2.
Table A1: Specifications of Sensirion SCD30 Sensor.
| CO2 Range | 400 to 10,000 ppm |
| CO2 Resolution | 1 ppm |
| CO2 Accuracy | ± 3% of reading + 30 ppm |
A-2 Vehicle cabin CO2 test
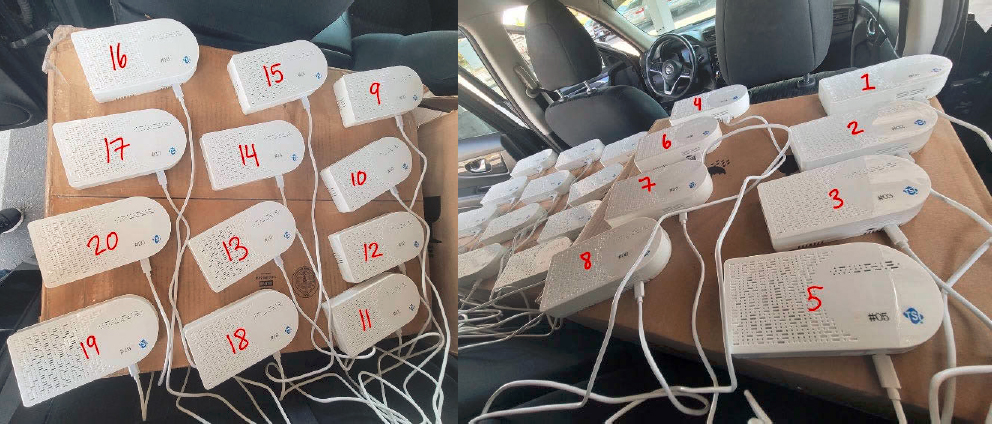
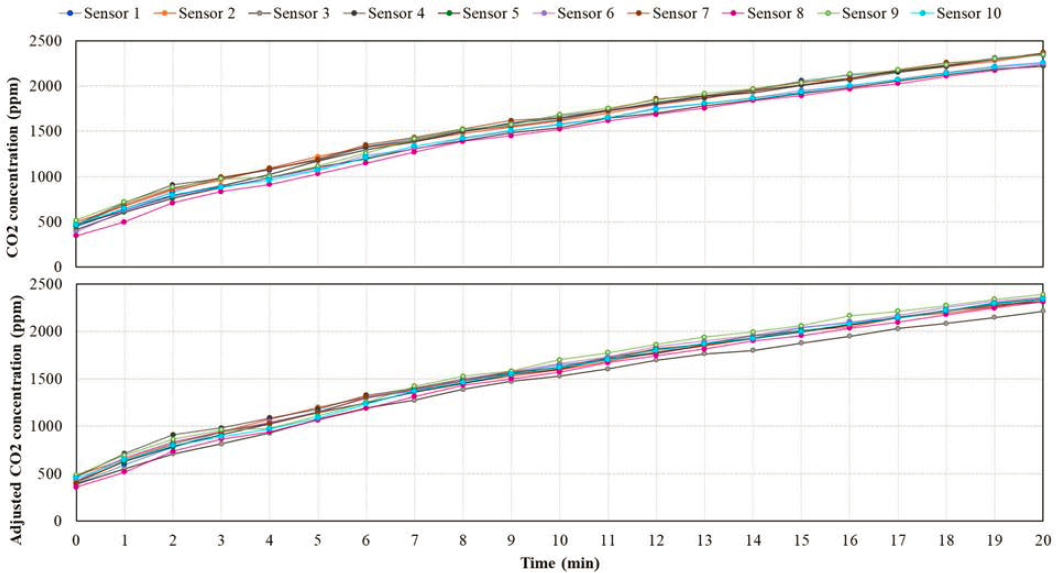
The TSI Air Assure sensors #1-#20 were placed inside a 2017 Nissan Rouge test vehicle with cabin volume of 3.9 m3 to verify repeatability of laboratory tests. Sensors were laid on a flat surface near passenger breathing height in the back seats of the vehicle as shown in Figure A5. A Bluetti EB55, Jackery Explorer 240, and Shell portable power supply units were used to power all sensors. With the vehicle idling, the original HVAC system was set to the lowest temperature 60°F, fan speed at medium, and recirculation mode on. A driver and passenger were inside the vehicle to provide natural CO2 source from exhalation
over a 20-minute period. The CO2 concentration began at an average background level of 446 ppm and gradually increased to 2308 ppm. Using laboratory CO2 data, calibration curves were created for each sensor with respect to the selected baseline sensor #4. The trendline equation from the calibration curve was used to adjust CO2 concentration measured inside the vehicle cabin for sensors #1-#10. Results of CO2 measurements before calibration is shown in Figure A6 (top). Figure A6 (bottom) also shows corrected CO2 data using calibration curves. It shows similar variation compared to uncorrected CO2 data shown in Figure A6. It was concluded the CO2 sensors do not need calibration. However, the sensors chosen show small variations from the previous test as shown in above in Figure A3.
A-3 Indoor Aerosol test
TSI AirAssure (8144-2) sensors are equipped with an optical particle counter Sensirion SPS30 PM unit. Particle measurements are based on light scattering and intensity produced when particles pass through a beam of light. The unit has an internal fan creating a directional flow of ambient samples to pass samples through an inlet, measurement cell, and outlet.
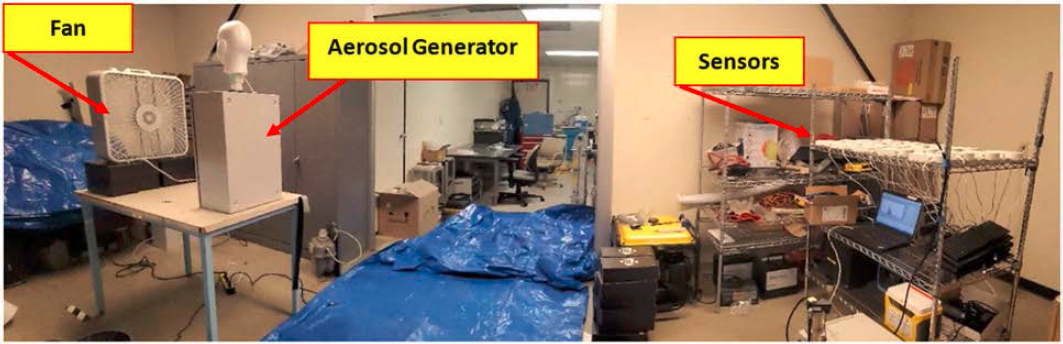
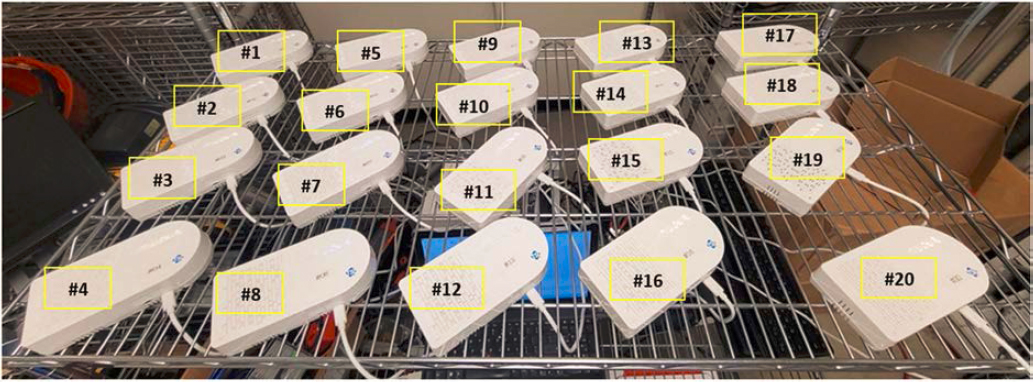
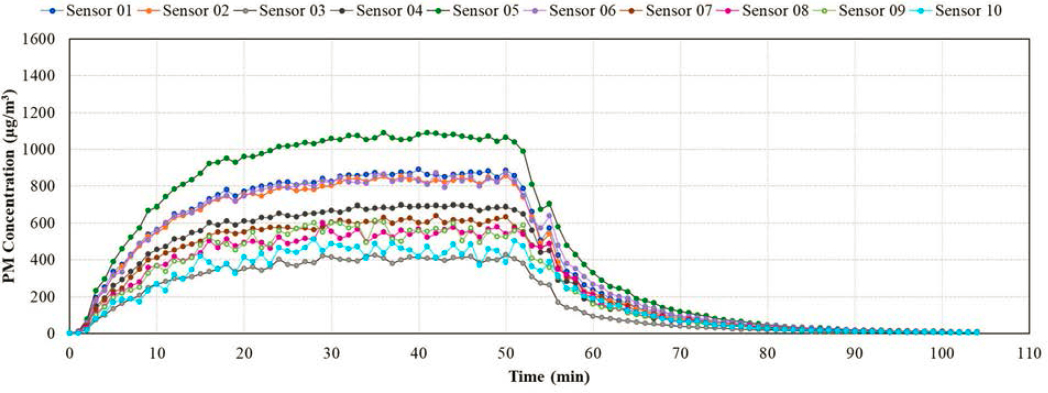
The aerosol generator with 1% NaCl solution, detailed previously, was placed ~2 ft behind the fan. TSI AirAssure sensors #1-#20 were spaced on a 48 inch width by 24 inch depth steel shelf unit at a height of 5 ft. The position of each sensor is shown in Table A2. The laboratory space has a volume of 68 m3. The aerosol generator was powered on for a 30-minute period with the fan speed at 4.4 m/s. PM2.5 was measured during this interval until concentration stabilized at a plateau. The aerosol generator and fan were then powered off simultaneously and PM concentrations were measured until all sensors measured background levels. Using only sensors #1-#10, calibration curves were created with respect to the baseline sensor 4.
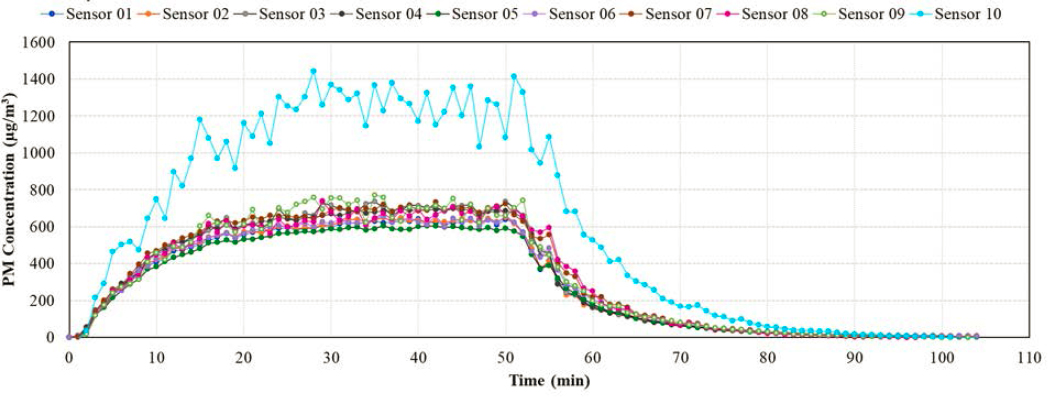
The experiment was repeated using the same set up as shown in Figure A7a but the sensor locations were switched to adjacent locations shown in Figure A7b. The aerosol generator and fan were powered on for a period of 50-minutes and powered off until PM concentrations were level. PM concentrations were measured until each sensor measured background levels. Using calibration curves from the prior test, PM2.5 concentrations were adjusted from Figure A8 and shown in Figure A9. All adjusted measurements were within one standard deviation with the exception of sensor #10. Sensor #10 was excluded in measurement at the bus.
Table A2: Location of TSI AirAssure sensors for the indoor aerosol test.
| 20 | 16 | 12 | 8 | 4 |
| 19 | 15 | 11 | 7 | 3 |
| 18 | 14 | 10 | 6 | 2 |
| 17 | 13 | 9 | 5 | 1 |
| PM sensor inlet facing aerosol generator and fan | ||||
A-4 Data Sheets and Specifications
Table A3: ThermoKing MERV 13 filter specifications.
| Brand | ThermoKing |
| Dimensions | 46 in x 20.6 in |
| Part number | 938652 |
| Electrostatic charged | Yes |
| Particle size capture efficiency | 90% of particles between |
| 3–10 microns in size | |
| 85% of particles between | |
| 1–3 microns in size | |
| 50% of particles between | |
| 0.3–1 microns in size |
Table A4: Synthetic MERV13 Filtration Media Specification.
| Brand | Air Filters Inc |
| Dimensions | 23.75 x 36 |
| Part number | M13FMP-2436 |
| Electrostatic charged | No |
| Particle size capture efficiency | 90% of particles between |
| 3–10 microns in size | |
| 85% of particles between | |
| 1–3 microns in size | |
| 50% of particles between | |
| 0.3–1 microns in size |


