Strategies to Improve Pedestrian Safety at Night: A Guide (2025)
Chapter: 4 Beyond Roadway Design

CHAPTER 4
Beyond Roadway Design
Pedestrian safety at night is also affected by the remaining two pillars of the Safe System Approach: safe vehicles and post-crash care. Technology, design, and research related to these two areas continue to rapidly evolve, particularly with regard to vehicle safety for nonoccupants. While these two areas are beyond the direct influence of most city, regional, and state transportation planners and engineers, practitioners can still take important steps to mitigate harms related to current vehicle design trends in the near term. This chapter presents an understanding of related research to date and focuses on actions within the direct influence of these practitioners.
Vehicle Design
 Vehicle design and changes in the vehicle fleet composition are growing concerns for pedestrian safety. While crash analyses, including this studyʼs research, have consistently found that sedans are more likely to be associated with pedestrian fatalities at night (Sanders et al. 2022; Schneider 2020), several studies have linked increased vehicle size, mass, and shape to the increase in pedestrian deaths over the past decade (e.g., Ferenchak and Abadi 2021; Tyndall 2021, 2024; Hu et al. 2024). These findings likely reflect fleet exposure to some degree: Sedans have historically been the predominant passenger vehicle in the United States, although sport utility vehicles (SUVs) and light trucks have constituted an increasing portion of the passenger vehicle fleet for years, with recent figures showing that they represent 80% of new passenger vehicle sales (Shilling 2022).
The increasing size of vehicles within the United States fleet has several consequences for safety. The contribution of mass to kinetic energy transfer (kinetic energy = 0.5 × mass × velocity2) guarantees that a person hit by a heavier vehicle will sustain more bodily injury than someone hit by a lighter vehicle, all else equal. Yet recent research suggests that vehicle shape and height—particularly taller vehicles with higher and boxier or blunt hoods, as shown in Figure 27—present an even greater risk than vehicle weight (Tyndall 2024). Such vehicles are considered higher-risk vehicles and are the current predominant style of SUVs and light trucks. As shown in Figure 28, these higher-risk vehicles are more likely to damage precious organs in the torso and head than extremities such as the legs in the event of a collision (Monfort and Mueller 2020) and are more likely to push someone under the vehicle, where they will be more seriously injured than if flipped on top of the hood, as in crashes with lower vehicles with sloped hoods (Hu et al. 2024).
Larger vehicles also require more force to slow down, all else equal, and have increasingly large blind spots that make it harder to see pedestrians trying to cross or walking along the street—particularly smaller pedestrians such as children (Hu and Cicchino 2022). These challenges are all exacerbated in darkness, when driver vision and detection–reaction time are already compromised. As vehicle size increases and these vehicles permeate and replace the fleet, their associated
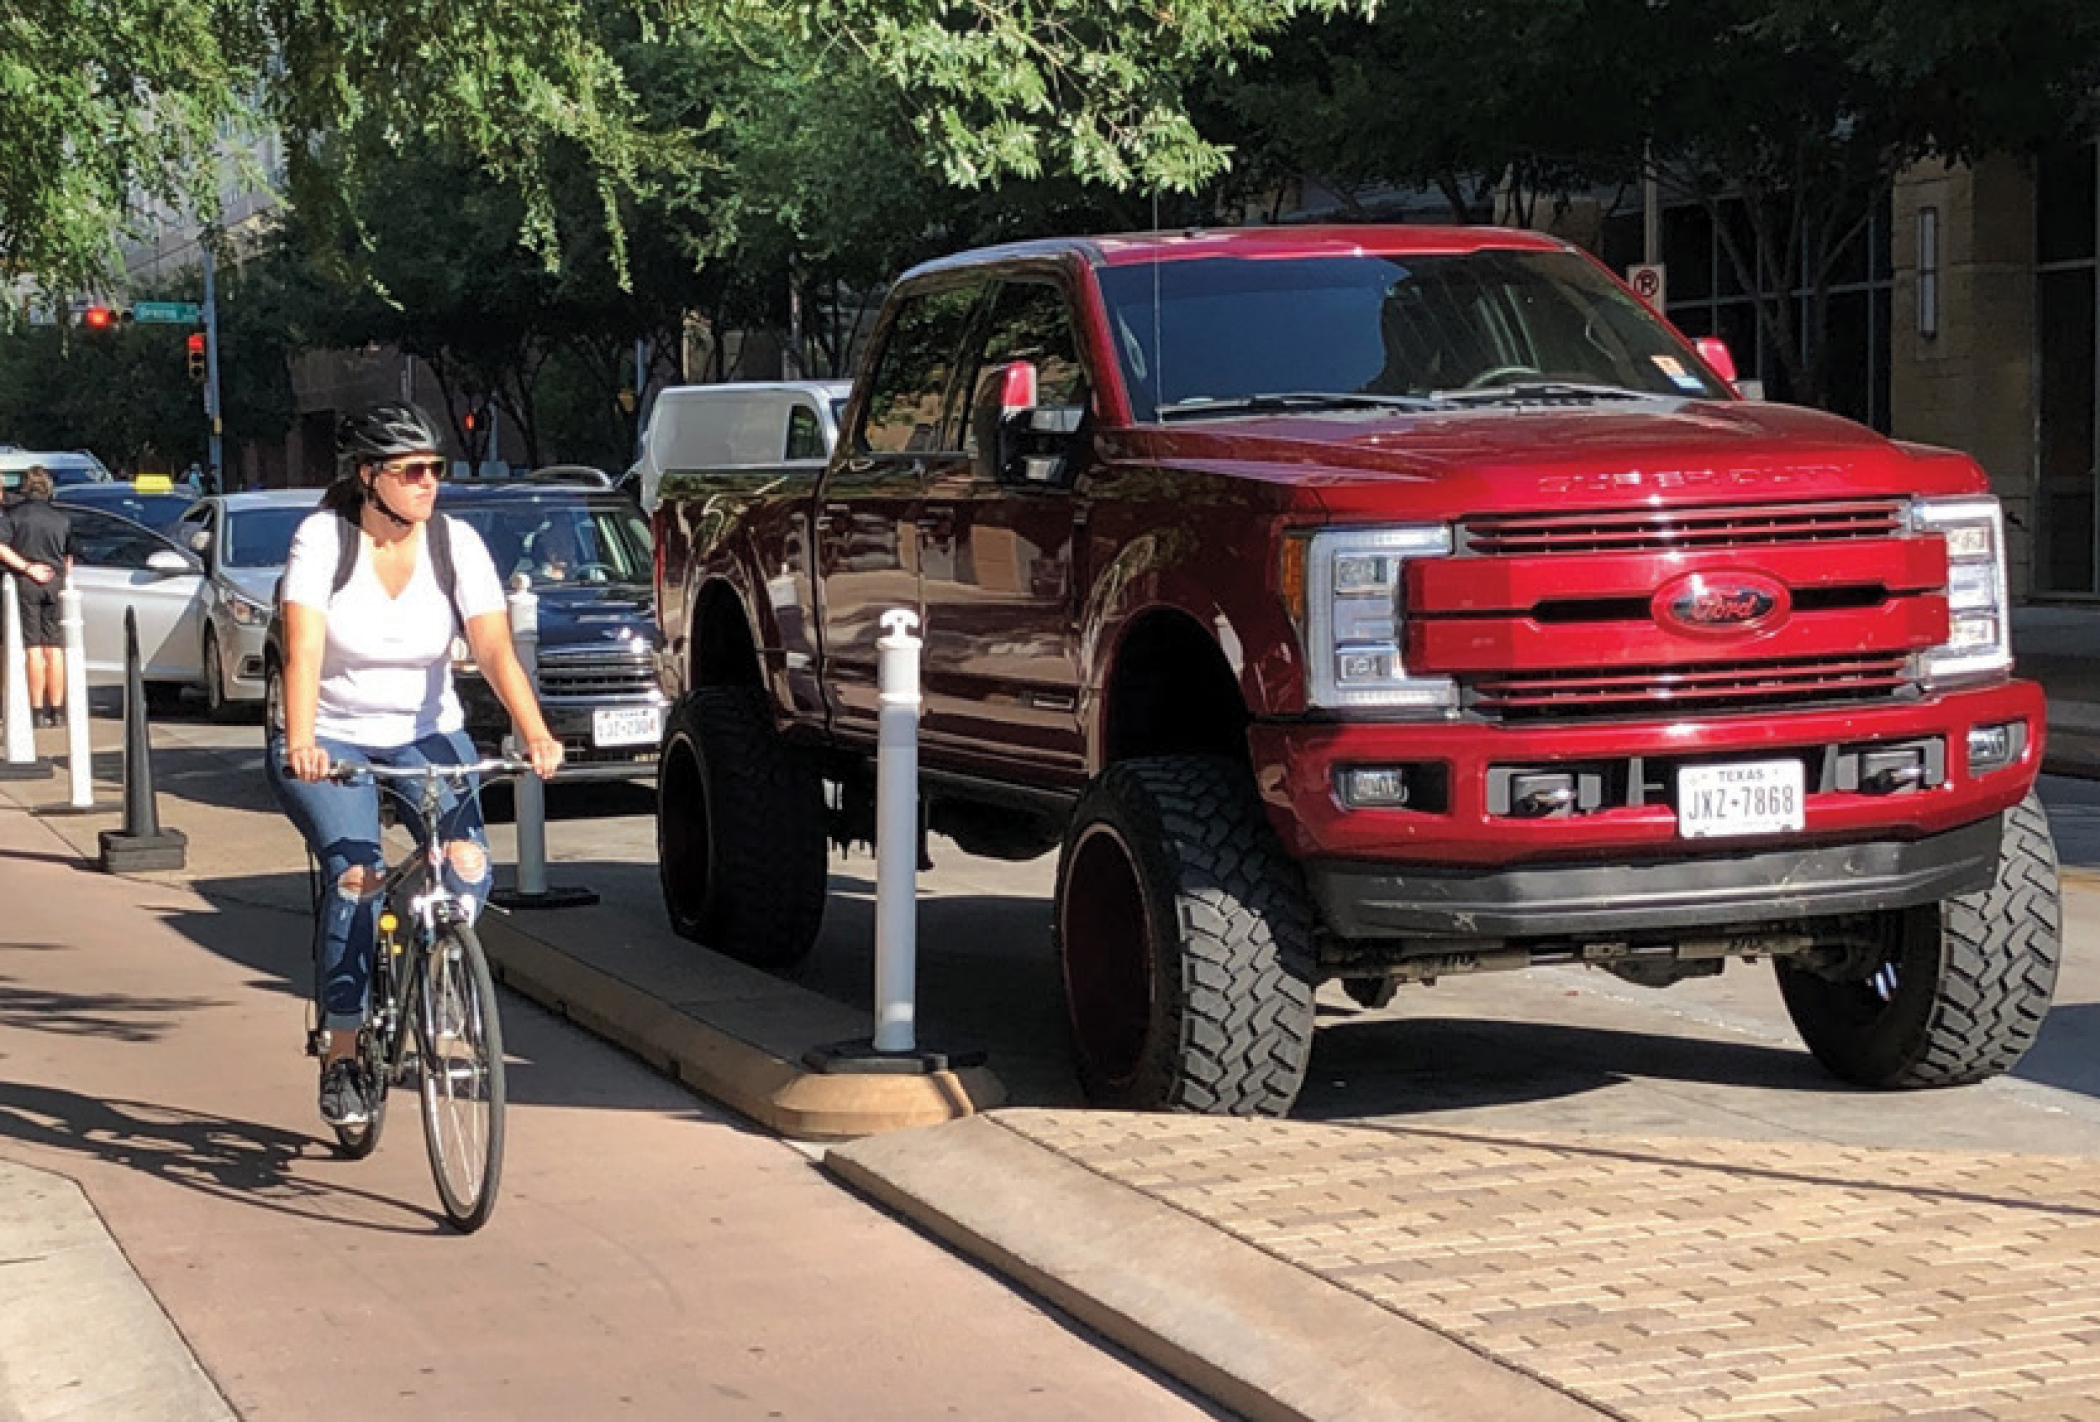
Long Description.
A large, lifted red pickup truck is parked next to a bike lane separated from the vehicle lane by flexible posts. A cyclist wearing a helmet and backpack rides in the bike lane. The truck has an elevated height with large wheels and a large, boxy body. The top of the cyclist's head comes to the bottom of the truck's side window. Trees and other vehicles are visible in the background on a sunny day.
challenges will result in ever-growing risk to people walking and bicycling—particularly in darkness and in populated areas. Note, however, that these findings also provide some hope that the continuing electrification of the fleet does not have to result in greater danger for people walking and bicycling. Electric vehicles can stop more quickly than gas-powered vehicles, and their greater weight can be mitigated by thoughtful design that includes shorter, sloped hoods and good driver visibility.
Another worrying trend is that while some of these vehicle designs may be promoted as safe for families, others may be explicitly being marketed by promoting aggression in vehicle design and driver behavior (NTSB 2023). Many vehicles are also designed and marketed to emphasize power and acceleration abilities, with the most common metric being how fast they can accelerate from 0 to 60 mph—a speed many vehicles can achieve in just a few seconds. Research has indicated that these practices influence motorist behavior (Donovan et al. 2010). Speeding is one of the most common factors associated with crashes, and aggressive driving is a harmful behavior in all contexts. Auto advertisements featuring reckless driving, such as we commonly see in the United States, have been banned in several other countries (Shrager Sachs and Blanco 2021), and the NTSB has called for the IIHS to evaluate the influence of marketing on safety outcomes in the United States (NTSB 2023).

Long Description.
An illustration compares the pedestrian impact zones of a higher-risk vehicle and a sedan. The illustration shows silhouettes of an adult and a child on the left standing in front of profile outlines of a sedan and a higher-risk vehicle to the right. The sedanʼs impact zone, shown in orange, is lower and affects the child from the neck down and the lower body of the adult. The higher-risk vehicleʼs impact zone, shown in grey, is taller and affects the adult from the shoulders down and the child's complete body.
Additional concerns related to vehicle design include headlight design (see “A Note About Glare”) and the influx of dashboards and other infotainment systems in newer vehicles that may exacerbate driver distraction (see Chapter 2). There is increasing risk related to these features and to the taller, boxier, and heavier shell designs. Advanced driver assistance systems (ADAS) offer some promise to mitigate the increased harm of larger vehicles (Schoner et al. 2024). In particular, crash avoidance systems (including those specifically for pedestrians), intelligent speed assistance (ISA), and ignition interlocks (a non-ADAS technology) have demonstrably reduced crash incidence, speeding, and impaired driving, respectively, when in use (IIHS 2023; Kirley et al. 2023). Additionally, adaptive headlights have long been used in other countries and are a proven technology to increase safety in darkness (Bullough and Skinner 2012; Reagan and Brumbelow 2017). Yet, vehicle design regulation and full adoption of these various technologies are years, if not decades, away. Waiting and relying on these technologies to improve safety outcomes when they are not required in vehicles may extend the safety crisis and make it difficult to achieve safety goals and Vision Zero. The strategies described in the following sections can help reduce pedestrian risk associated with high-risk vehicles. For additional information and insight into the rapidly evolving area of vehicle design–related risks, countermeasures, and recommended policies, see Massive Hazards: How Bigger, Heavier Light Trucks Endanger Lives on American Roads (Road to Zero Coalition 2024).
Countermeasure Implementation and Retrofitting
The two most important strategies jurisdictions can take to protect people walking in darkness from higher-risk vehicle designs are the same strategies necessary to increase pedestrian safety in general: reducing driver speeds and providing separation in time and space at points where conflicts can be expected. Critical design and operational countermeasures to address these two issues are discussed in Chapter 3. Technological countermeasures like ISA may also play an increasingly important role over time, as discussed above. However, higher-risk vehicles also necessitate mitigating the specific risks related to height and hood designs, particularly sight distance (for both the pedestrian and driver), right-turn-on-red policies, and other size-related dimensions such as turning radii. This section poses important questions to help practitioners evaluate whether current countermeasures need to be adjusted or enhanced to maintain effectiveness when higher-risk vehicles are present. Each question is followed by suggested counter measures to mitigate the relevant area of risk.
There is currently little research or established best practice on this evolving topic, so cities may need to collect local data through targeted countermeasure safety audits using, for example, larger city fleet vehicles. Design guidelines related to commercial vehicles may also be helpful for this evaluation [see, for example, Direct Vision Transition Guide (Together for Safer Roads 2024)]. The overarching question for evaluation is whether current countermeasure dimensions sufficiently protect pedestrians from drivers in larger vehicles. Specific questions include the following:
- Can drivers in vehicles with tall, boxy hoods see people walking in front of them in crosswalks? See the Boston Blind Zone Safety Initiative (Brodeur et al. 2023) for details of an example evaluation. If drivers in such vehicles cannot see people walking in front of them, the following countermeasures can mitigate the sight distance restriction created by the vehicle design:
- Widening crosswalks,
- Locating stop bars farther back from the crosswalk than the 4-ft minimum (FHWA 2023a) to ensure a sight line is available between the driver and the entire crosswalk,
- Implementing leading pedestrian intervals or pedestrian-only phases, and
- Restricting right turn on red at signalized locations.
- Are right turns encouraging motorist encroachment into the crosswalk? Allowing right-turn-on-red movements encourages and requires motorists to enter crosswalks to execute the movement while the crossing pedestrians have the right-of-way, putting pedestrians at greater risk. In locations where sight distance is restricted or vehicle volumes on the cross street are high with few gaps, this can result in motorists blocking crosswalks for significant periods of time, denying pedestrians the right-of-way or requiring them to cross outside the crosswalk area and increase their exposure to potential conflicts.
- Where a large percentage of the vehicle fleet consists of vehicles that do not have adequate sight lines to see people crossing within 10 ft of the front of the vehicle, restrict right turn on red.
- Where motorists routinely block crosswalks at an intersection, consider
- Restricting right turn on red within the area where pedestrian activity is consistent and vehicle blocking is pervasive (for example—a downtown area, school zone, or commercial corridor);
- Evaluating signal cycle length to determine whether shorter signal cycles can reduce crosswalk encroachments by right-turning motorists, especially during off-peak hours; and
- Implementing targeted crosswalk enforcement and education campaigns—if in coordination with community groups and being used as a stopgap before infrastructure changes are possible—to reduce crosswalk encroachment in affected areas.
- Are pedestrians waiting to cross the street visible to oncoming drivers if larger vehicles are parked at the corner? Examine this element with sensitivity to the roadway speed. More sight distance is needed for drivers to detect and react in time on higher-speed roadways. If waiting pedestrians are not visible, consider the following:
- Daylighting intersections to increase pedestrian visibility. Tailor daylighting requirements to roadway speed to ensure that drivers can detect and react in time—drivers traveling at higher speeds need more daylit space to ensure visibility.
- Daylighting best practice includes both a restriction on vehicle parking and some physical symbol (e.g., paint, stanchions, bike or micromobility parking, planters) to ensure that drivers do not park illegally and block pedestrian visibility.
- Do current corner designs and radii protect pedestrians from turning drivers? If not, consider
- Installing centerline hardening to protect visibility for left turns,
- Restricting right turn on red at signalized intersections,
- Adding leading pedestrian (and bicyclist) intervals to all signalized intersections, and
- Adding curb extensions (with truck aprons if necessary to accommodate larger vehicles) where parking is allowed.
- Are signs and signals sufficiently visible to drivers in taller vehicles? If not, consider
- Raising the sign height,
- Placing vehicular signal indications at locations and heights that are visible for drivers of all vehicle sizes,
- Installing retroreflective signs for increased visibility for drivers, and
- Installing backplates to signals for increased visibility for drivers.
City and State Ordinances and Laws
Several cities and states are enacting ordinances and laws to help manage vehicle size and driver behavior via vehicle technology. An important aspect of these laws and ordinances is that they often apply first to the organizationʼs own fleet, so that they lead by example. Key examples include weight regulation and municipal and state fleet selection.
Weight Regulation
Several jurisdictions have adopted or are contemplating a weight tax to discourage purchases of larger vehicles. While these taxes are too new to know of their long-term effectiveness, interested readers can find more information at the following sites:
- Washington, DC, vehicle registration fees (District of Columbia DMV n.d.);
- “Drive a heavy vehicle? Youʼll now pay more for a parking permit in the Plateau” (CBC News 2024); and
- Vulnerable Road User Protection Enterprise (State of Colorado 2024).
Municipal and State Fleet Selection
It is also important for city- and state-owned fleets to lead by example. How large do fleet vehicles need to be to do the job without contributing to vehicle bloat? How can cities and states encourage contractors to be part of the solution? Some agencies are starting to reevaluate the designs of emergency response vehicles, such as fire department vehicles, to right-size them to the task or help them achieve other community goals, such as the provision of narrower streets. This rightsizing is resulting in the use of some smaller-sized vehicles for emergency medical services (EMS) first-response services instead of full-size fire trucks and in the purchase of fire trucks with a smaller wheelbase to allow greater design flexibility for urban streets.
Vehicle electrification also provides an opportunity to shrink vehicle size while maintaining horsepower and torque. See New York Cityʼs Executive Order 39 to learn more about a comprehensive municipal approach to fleet and contractor vehicle and driver safety (City of New York 2024).
Intelligent Speed Assistance
Several cities and states have now developed or passed legislation to require municipal and contractor fleets to be equipped with ISA, whether through purchase of a new vehicle or the installation of after-market devices. A key example is New York Cityʼs Executive Order 39 (City of New York 2024). Relatedly, Washington, DC, passed legislation in 2024 [the Strengthening Traffic Enforcement, Education, and Responsibility (STEER) Amendment Act] requiring drivers who were convicted in court of criminal violations related to aggravated or reckless aggravated driving to install speed governors on their cars (Moody 2024). A similar effort is being pursued in New York State.
Crash Avoidance Systems
Similar to efforts to equip municipal and contractor fleets with ISA, cities can mandate that all new vehicles are equipped with crash avoidance systems and that older vehicles are retrofitted with aftermarket crash avoidance systems. In all cases, both municipal and contractor drivers need to be required to keep the system turned on at all times.
Alcohol Ignition Interlocks
Several states already require alcohol ignition interlocks for repeat impaired driving offenses (Kirley et al. 2023). Research shows that these devices help prevent recidivism.
Crash Response
 Post-crash care includes strategies both to provide immediate aid to those injured by crashes, for example, through EMS, and to evaluate crash conditions to help prevent future crashes and mitigate injury potential. While improvements to EMS and crash data collection and analysis are generally beyond the scope of this guide, this section covers elements of all three that may be within or related to most transportation plannersʼ and engineersʼ purview related to pedestrian safety.
Emergency Services Routes
Emergency vehicles are critical for life-saving care, and emergency routes are necessary for those vehicles to access hospitals and crisis scenes to deliver such care. Emergency service planning is particularly important given the significant association between immediacy of care and survival after a crash represented by the term “the golden hour.” Transportation and planning practitioners are advised to map crashes along with the drive time to the nearest hospital to understand and be able to address EMS service gaps. This practice may be particularly important in suburbs and more rural areas, which tend to have a lower density of healthcare facilities, but may also reveal important gaps in urban areas that need to be addressed to help all people access important services.
In addition to understanding service gaps, it is also important to evaluate the role of emergency vehicle size and the location of emergency routes to understand their holistic impacts on community safety. For example, large emergency vehicles have at times encouraged or required communities to build wide streets that, in turn, encourage driver speeding and increase the potential for pedestrian fatalities when not in active use as an emergency route (see the earlier section “Municipal and State Fleet Selection”). This conflict between two community safety goals can be mitigated so that jurisdictions can have the emergency routes they need while ensuring that pedestrian safety is prioritized.
To improve pedestrian safety related to emergency services, practitioners are encouraged to evaluate current emergency routes with a pedestrian safety lens using the following questions:
- Can route planning be considered more holistically? For example, can stations be sited differently or routes assigned in an alternative manner to reduce the need for wide, straight streets that serve emergency responders?
- Can the roadways serving as emergency routes be retrofitted with countermeasures to reduce driver speed and increase pedestrian safety throughout day and night? For example, in addition to street lighting, sidewalks, and adequately spaced high-visibility crossings, what counter measures could be implemented to protect people walking from higher driver speeds while still
- allowing ambulances to travel quickly when needed? The City of Portland, OR, uses split speed bumps to slow vehicles while providing quick access for emergency responders (Mulder 1998). Mountable curbs and inset parking also allow for narrower lane widths while maintaining access, as described in Best Practices: Emergency Access in Healthy Streets (Snyder et al. 2013).
- Can roadway designs be reimagined and redesigned to provide maximum flexibility for emergency situations while constraining the daily use? For example, Takushi et al. (2024) proposed redesign of a traditional four-lane roadway with parking or a three-lane roadway with parking and bike lanes to a narrower three-lane roadway with parking that can be completely repurposed or redirected in the event of an emergency. In this example, separated bike lanes were created outside of the right-of-way to provide protected space for people walking and bicycling while simultaneously narrowing the right-of-way and maintaining flexibility for emergency vehicle throughput or redirection for civilian vehicles.
These and similar questions can help ensure that emergency access and pedestrian safety are prioritized in U.S. cities and regions.
Crash and Supporting Data Collection
The understanding of traffic risk is significantly influenced by the quality of the data analyzed once crashes have occurred. As safety analysis has evolved, it has become clear that it is as important
to analyze features of the site where the crash occurred as it is to analyze crash and victim characteristics, behaviors, and contributing factors. Efforts to join EMS and hospital data to crash data have also led to a new understanding of underreporting and gaps in crash datasets, particularly for less-severe crashes involving pedestrians and bicyclists in which a vehicle was not damaged. While detailed information on data collection is beyond the scope of this guide, the following steps can help ensure that agencies have the most accurate and helpful data for analyzing and addressing pedestrian safety at night.
- Work with your state Traffic Records Coordinating Committee (FHWA n.d.-h) to incorporate as many of the Model Minimum Uniform Crash Criteria (MMUCC) (NHTSA 2024) as possible into your state crash form. While voluntary, MMUCC guidelines are data driven and include information about essential and optional data elements to facilitate crash analysis locally and move jurisdictions toward standardized crash data across the country.
- Work to incorporate injury surveillance data into your crash data to help fill in gaps and provide important insights about lower-severity crashes that are often underreported or miscoded, particularly for people walking and bicycling. The MMUCC provides guidelines specifically about integration with the National Emergency Medical Services Information System (NEMSIS) and the National Trauma Data Bank (NHTSA 2024). Examples of best practices in integration of injury surveillance data and crash data include San Franciscoʼs Vision Zero program (Vision Zero SF n.d.) and the NC Transportation Safety and Public Health Data Dashboard (Carolina Center for Health Informatics n.d.).
- Create a database of roadway data to allow systemic safety analysis and the ability to analyze a system for combinations of risk factors to be addressed to mitigate the potential for future crashes. FHWA has recommended collecting specific roadway elements in the Model Inventory of Roadway Elements (MIRE) (FHWA 2024a, n.d.-b). MIRE data elements are specifically geared to facilitate safety analysis and will be useful for many other aspects of transportation planning and design. In particular, data on lighting (presence, frequency, and quality), pedestrian infrastructure (intersection and segment), volumes (driver and pedestrian), roadway operations (number of lanes, operating speed, functional class), and land uses are important for understanding and addressing pedestrian safety at night. Other safety data can also be collected, depending on specific local or state needs.
See FHWAʼs Roadway Safety Data Program for additional resources and to learn more about improving data quality and collection standards (FHWA n.d.-e).
Crash and Supporting Data Analysis
Data analysis is key to understanding the risk factors (built environment features, surrounding land uses, behaviors, and person vulnerabilities) that lead to a collision, how commonly those risk factors combine throughout the system to create additional crash and injury potential, and how these issues can be addressed. In recent years, the transportation safety field has moved from reactive, hotspot-based crash analysis toward proactive or systemic risk-factor-based analysis.
Reactive crash analysis includes an evaluation of crash data to understand crash types, contributing factors, and behaviors and focuses on addressing locations where crashes have occurred, particularly if they have occurred in clusters. This type of analysis can provide important insights into risk factors but is limited if the analysis is conducted on crashes of all severities, rather than severe crashes, and if the results are only used to adjust locations where crashes have occurred in the past. In contrast, proactive or systemic safety analysis includes an evaluation of crash data to understand the same contributing factors and crash dynamics but focuses more on how risk factors are associated with crashes—particularly fatal and severe crashes. Systemic analysis also aims to address locations with those risk factors in the network, whether or not those locations have experienced a crash.
Systemic analysis is more data intensive and methodologically challenging than reactive crash analysis, given that it incorporates roadway and operational characteristics, volume estimates, land uses, and other factors that may influence crash frequency and severity into the crash data. However, its results allow for network screening and more proactive planning, and it is particularly useful for investigating and developing strategies to address crash risk that may otherwise appear ubiquitous. For example, understanding the combinations of features that are more likely to be associated with pedestrian fatalities at night, such as convenience or grocery stores along multilane, higher-speed roadways without sufficient protected pedestrian crossings, will help jurisdictions prioritize investments in pedestrian safety improvements.
Another important evaluation tool is a road safety audit (RSA), an FHWA-proven safety countermeasure that employs an independent, multidisciplinary team to examine a corridorʼs risk factors and evaluate the safety of pedestrians and other roadway users. RSAs can be conducted before, during, and after design to illuminate potential issues and solutions. While originally developed as a reactive tool for post hoc evaluation of identified safety issues, RSAs are increasingly conducted proactively to identify and address problems before a roadway is built or redesigned.
Indeed, RSAs have played a key part in increasing pedestrian safety in Australasia (Chiarenza et al. 2023). In Australia and New Zealand, independent audit teams conduct three RSAs per project at key stages: in the initial design, to identify safety concerns before substantial design work is completed; in the detailed design, to identify specific elements that may increase crash risk; and before opening, to assess sight distances and other unforeseen hazards prior to opening to the public. The goal is to identify and address issues as early as possible to increase safety proactively and prevent costly future retrofits. The planning and design phases could draw on a framework such as Movement and Place (see the discussion of transportation network planning in Chapter 3) and best practices for safe design, such as articulated in NCHRP Research Report 1036: Roadway Cross-Section Reallocation: A Guide (Semler et al. 2023), to minimize the need for rework. More information about RSAs is available on the FHWA website (FHWA n.d.-d).
Irrespective of the analysis type, it is crucial to examine pedestrian safety by lighting condition. Research conducted for this project found that few jurisdictions explicitly examined nighttime safety for each mode, perhaps because practitioners were not aware of how disproportionately risky nighttime conditions are for users—and particularly for pedestrians. Analysis that digs deeper into bivariate and multivariate relationships would help clarify the scope and scale of traffic risk in communities. It is worth noting that dawn and dusk are separate, low-light conditions generally associated with small sample sizes. They can be analyzed separately if sample size allows, excluded from analysis, or combined with crashes in either daytime or darkness, depending on the specific question being analyzed.
It is also important for agencies to collect pedestrian exposure data at night through counts, surveys, automated sensors, and other methods, where possible. These volume data can help provide important information about overall pedestrian crash rates at night versus during the day and can eventually be used to better understand which roadway design and other treatments are most effective at reducing nighttime pedestrian crash rates.
The following resources are suggested for further review:
- The FHWA website Pedestrian and Bicycle Safety (FHWA n.d.-c) includes subpages of helpful resources, including one specifically on tools to diagnose and solve the problem (FHWA n.d.-f).
- NCHRP Research Report 893: Systemic Pedestrian Safety Analysis provides practitioners with a framework to implement a systemic pedestrian safety program (Thomas et al. 2018).
- The Highway Safety Manual also provides helpful guidelines on safety analysis, although at the time of this writing, it is more focused on driver safety than pedestrian and bicyclist safety (AASHTO 2010). Recent and ongoing NCHRP projects will be incorporated into future versions of the Highway Safety Manual to improve its pedestrian and bicyclist methodologies and guidelines.
It can also be helpful to see examples of various types of pedestrian safety analysis in practice. NCHRP Web-Only Document 430: Improving Pedestrian Safety at Night, a companion document to the present report, includes a comprehensive, national-level pedestrian crash analysis that focuses on pedestrian safety in darkness (Sanders et al. 2025). For an example of a city-level systemic safety analysis, see the City of Seattle Bicycle and Pedestrian Safety Analysis, Phase I Phase II (Toole Design Group 2016 and 2020, respectively). For an example of a city-level, in-depth study of pedestrian fatalities at night, see the Oregon Walks Fatal Pedestrian Crash Report (Oregon Walks n.d.).
Incorporating and Standardizing Lessons Learned
Post-crash care would also benefit from the incorporation of lessons learned from the various analyses into current planning and design practices, including design standards at the local, state, and federal levels. For example, the data from myriad studies are clear that pedestrians face greater risk of death at night, particularly along multilane, higher-speed roadways such as arterials and freeways. This nighttime risk is compounded at pedestrian attractors and where other risk factors co-occur, such as transit stops, convenience stores, grocery stores, and liquor stores. Instead of waiting for crashes to occur before implementing countermeasures on a single high-crash corridor or even several different corridors that share the same high-risk features, designing for nighttime conditions and limited visibility needs to be the standard, including self-enforcing lower-speed designs, context-appropriate and frequently spaced lighting, frequent protected pedestrian crossings, and sidewalks. While change takes time, transportation practices and standards must adapt to reflect the stated values of transportation professionals: death and serious injury are unacceptable outcomes in the U.S. transportation system.


