Strategies to Improve Pedestrian Safety at Night: A Guide (2025)
Chapter: 3 Safe Roadway Design

CHAPTER 3
Safe Roadway Design
With the development of suburban communities designed around automobility in the 1950s, transportation professionals began to widely consider walking (and biking) to be primarily recreational activities and not primary methods of transportation. To support this outcome, national roadway design standards prioritized the efficiency and movement of motor vehicles and mostly provided no accommodation for pedestrians. As a result, thousands of miles of roadway infrastructure in the United States were built without providing for people walking or bicycling, thereby leading to an unsafe transportation system for all roadway users, and particularly for any person traveling outside of a vehicle.
The lack of consideration for pedestrians in design guidance and standards has been particularly harmful in higher-risk conditions. More than 75% of pedestrian fatalities in the United States occurred at night in 2022 (NHTSA 2024), yet national guidance often does not address how darkness or inadequate lighting affects the safety of the traveling public. For example, despite research showing that driver detection–reaction time is significantly diminished in dark conditions, roadways are designed for peak hour traffic in daytime conditions. The result is roadways that are far overbuilt for nighttime conditions and that encourage higher speeds that necessitate greater reaction time precisely when drivers are the least able to detect people walking and bicycling.
Transportation professionals can improve safety for all roadway users, and the most vulnerable ones, by designing for the challenges presented by walking at night. Roadway design directly influences how people travel and experience a community, with demonstrable effects: roadways that aim to safely, comfortably, and conveniently accommodate people walking and biking are safer than roadways that focus on fast-moving vehicles. This chapter focuses on how roadway design and operations relate to pedestrian risk at night and the countermeasures that can be implemented to increase pedestrian safety in darkness.
Implement Nighttime Countermeasures
Nighttime fatality rates are three times the daytime fatality rates in the United States, and roadway characteristics combined with driversʼ inability to detect pedestrians and react in time to prevent a crash are clear contributing factors (FHWA 2022). To increase pedestrian safety at night, implementation of effective countermeasures to modify the transportation network would be helpful. As noted in Chapter 1, for transportation practitioners, addressing pedestrian risk means reducing the potential for a severe outcome through managing vehicular speeds, decreasing the likelihood of a crash through increasing driver awareness of pedestrians (enhancing visibility), and reducing pedestrian exposure (i.e., the time pedestrians spend in the roadway).
Note: Decreasing the likelihood of a pedestrian crash is addressed as an issue of enhancing visibility because this guide is specifically concerned with pedestrian safety in darkness.
Implementing these priorities and incorporating nighttime countermeasures to increase pedestrian safety in high-risk or high-exposure locations includes consideration of the following issues:
- Proximity to commercial districts, convenience stores, grocery stores, liquor stores, and transit stations or stops; in entertainment districts; and near high-density residential areas (Sanders et al. 2025; Long and Ferenchak 2021);
- Higher posted speed limits, especially on arterials (Sanders et al. 2022, 2025);
- Multiple lanes, especially on arterials (Sanders et al. 2022, 2025);
- Wider lane widths (Fitzpatrick and Park 2021); and
- Lack of sidewalks (Long and Ferenchak 2021).
Table 1 organizes proven and promising countermeasures for reducing pedestrian traffic risk in darkness by the pedestrian risk category each countermeasure aims to address. To improve pedestrian safety at night, transportation professionals could implement countermeasures from each category (i.e., to manage speed, enhance visibility, and reduce exposure) to the degree feasible, as these countermeasures will be more effective in combination than alone. If a countermeasure is deemed infeasible, another countermeasure from the same risk category could be implemented, or even more substantial countermeasures from other categories might be necessary to mitigate risk. For more information on implementation, see “Putting It All Together” at the end of this chapter.
The countermeasures discussed in this section are proven or promising for improving pedestrian safety at night. There are many other roadway safety countermeasures that are effective in daytime conditions but have not been evaluated for pedestrian safety in nighttime conditions; those countermeasures are not included in this guide but maybe used if future research shows their effectiveness for pedestrians at night.
Countermeasure |
Pedestrian Risk Category |
||
|---|---|---|---|
Manage Vehicular Speed |
Enhance Visibility |
Reduce Pedestrian Exposure |
|
Road reallocation |
√ |
* |
|
Speed feedback signs |
√ |
||
Automatic speed enforcement |
√ |
||
Lower speed limits |
√ |
||
Lighting |
√ |
||
Marked crosswalks |
√ |
||
Traffic signals |
√ |
||
Pedestrian hybrid beacons |
√ |
||
Rectangular rapid flashing beacons |
√ |
||
Daylighting/curb extensions |
* |
* |
√ |
Crossing islands |
* |
√ |
|
Sidewalks/walkways/shared use paths |
* |
* |
√ |
|
Note: √ indicates the primary pedestrian risk category for that countermeasure;* indicates a secondary pedestrian risk category or categories. |
|||
Manage Vehicular Speeds
 Driver speed is significantly correlated with pedestrian crash risk (Sullivan and Flannagan 2007; Guerra et al. 2020) and the severity level of pedestrian injuries (Rosén et al. 2011; Tefft 2013). However, less is known about how drivers consider and select their speed when traveling in darkness and how that affects pedestrian safety outcomes (Pour et al. 2017). The research teamʼs detailed crash analysis found that roadway design features that facilitate higher speeds are consistently associated with pedestrian injury severity, particularly in darkness. Other research also found that darkness exacerbates pedestrian fatality risk on higher-speed roadways (Sanders et al. 2022).
Higher vehicular speeds increase the distance necessary for a vehicle to stop safely before striking a pedestrian. For example, according to National Association of City Transportation Officialsʼ (NACTOʼs) City Limits: Setting Safe Speed Limits on Urban Streets (2020), a driver traveling at 40 mph needs approximately 164 ft to stop the vehicle, whereas a driver traveling at half that speed (20 mph) needs approximately 63 ft to stop the vehicle. This distance increases nonlinearly as vehicular speeds increase in daytime conditions. Additionally, these distances do not include the extra amount of distance traveled by the vehicle before the driver reacts to seeing the pedestrian at night, when visibility is limited (NACTO 2020). Figure 9 illustrates the distances drivers travel at different speeds under different conditions. At higher speeds in dark conditions, the driver may not even have begun to brake before reaching the pedestrian.
The posted speed limit is closely related to driver speeds in most circumstances, and higher posted speeds are significantly correlated with pedestrian fatalities and severe injuries at night (Sanders et al. 2022). Additionally, over the past two decades, pedestrian fatalities at night have significantly increased on roadways with recorded posted speed limits of 40 to 45 mph (54.6% of total known increase in fatalities) (Ferenchak and Abadi 2021). However, relatively few studies have focused on how speed limits influence drivers at night, including whether lower nighttime speed limits could significantly affect driver behavior and increase roadway safety.
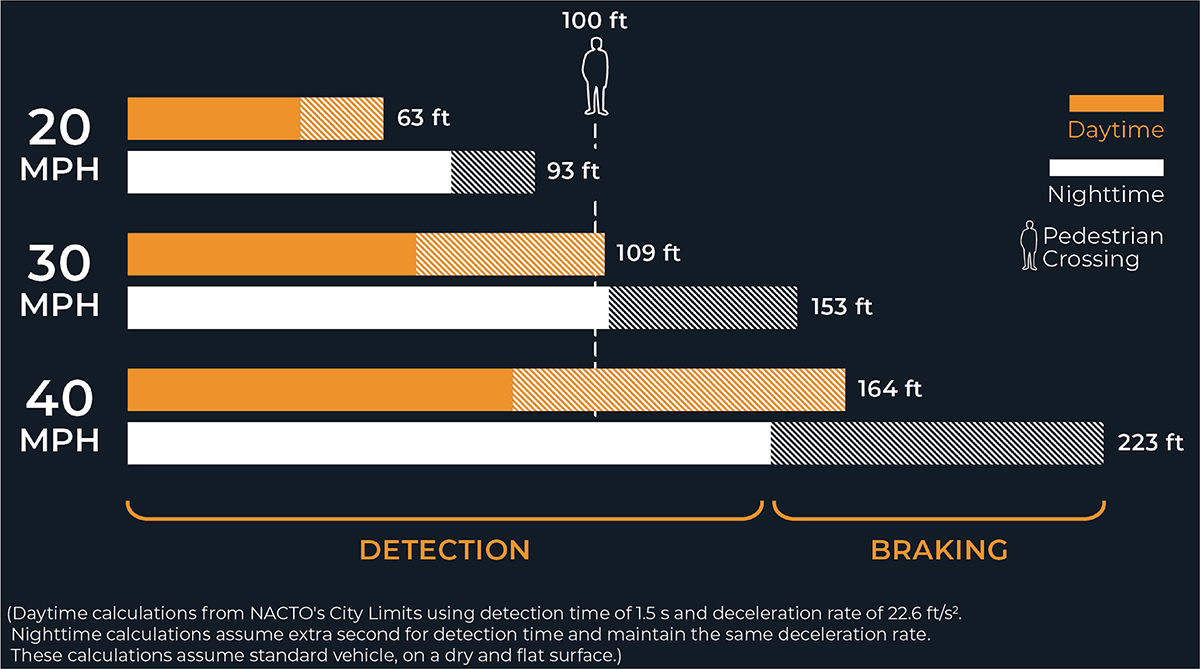
Source: NACTO 2020; Sanders et al. 2025.
Long Description.
A horizontal bar graph shows the distance covered at different vehicular speeds under daytime and nighttime conditions. The graph does not have a horizontal axis. The vertical axis shows three speed limits from 20 to 40 miles per hour in increments of 10. Each speed limit shows two bars representing daytime and nighttime, respectively. Each bar consists of two sections: Detection and Braking. The total distance for detection and braking shown at each speed is as follows: 20 miles per hour: daytime, 63 feet, and nighttime 93 feet. 30 miles per hour: daytime, 109 feet, and nighttime, 153 feet. 40 miles per hour: daytime, 164 feet, and nighttime, 223 feet. A vertical dotted line marked Pedestrian crossing is drawn along 100 feet. The note at the bottom of the graph reads as follows: Daytime calculations from NACTOʼs City Limits using a detection time of 1.5 seconds and a deceleration rate of 22.6 feet per second squared. Nighttime calculations assume extra seconds for detection time and maintain the same deceleration rate. These calculations assume a standard vehicle on a dry and flat surface.
Designing roadways to result in lower operating speeds has the highest likelihood of increasing pedestrian safety, especially at night. The driving simulator research conducted for this project found that drivers
- Were able to identify pedestrians and yield more quickly at 25 mph than at 40 mph;
- Were significantly more likely to have a crash in the simulator at 40 mph than at 25 mph;
- Were more stressed while looking for a pedestrian at 40 mph, especially at unmarked crossings;
- Spent less time on average looking for a pedestrian at crossings with a flashing rectangular rapid flashing beacon (RRFB) at 40 mph as compared with 25 mph; and
- Spent less time on average looking at unmarked locations in dark conditions at 40 mph.
In other words, slower vehicular speeds allowed drivers to scan more for other roadway users and potential hazards, as shown in Figure 10. This correlates with most participants (79%) indicating that they found it more difficult to recognize a pedestrian when the speed limit was 40 mph because of visibility limitations and higher travel speeds. Relatedly, focus group participants acknowledged routinely driving above the speed limit and stated that changes in roadway design would generally be required for them to change their behavior in the absence of speed enforcement.
Proactive speed management is necessary to create a safe system. Speed management starts from an understanding that speed is the primary mechanism for injury severity and a belief that people deserve to live in areas with safe speeds. From this shared commitment to safe roadways for all, practitioners work to match the speed to the context, adopting policies to reinforce the need to manage speed to ensure the safety of roadway users and employing design, operations, and technology strategies to both passively and actively manage speeds in a context-dependent manner.
Proactive speed management is necessary to create a safe system.
FHWAʼs Safe System Approach for Speed Management (FHWA 2023b) recommends the following five-step process for creating safe speeds within a network (see Figure 11):
- Establishing a vision and building consensus for speed management;
- Collecting and analyzing speed and safety data;
- Prioritizing locations for speed management proactively;
- Selecting speed management countermeasures; and
- Conducting ongoing monitoring, evaluation, and adjustment.
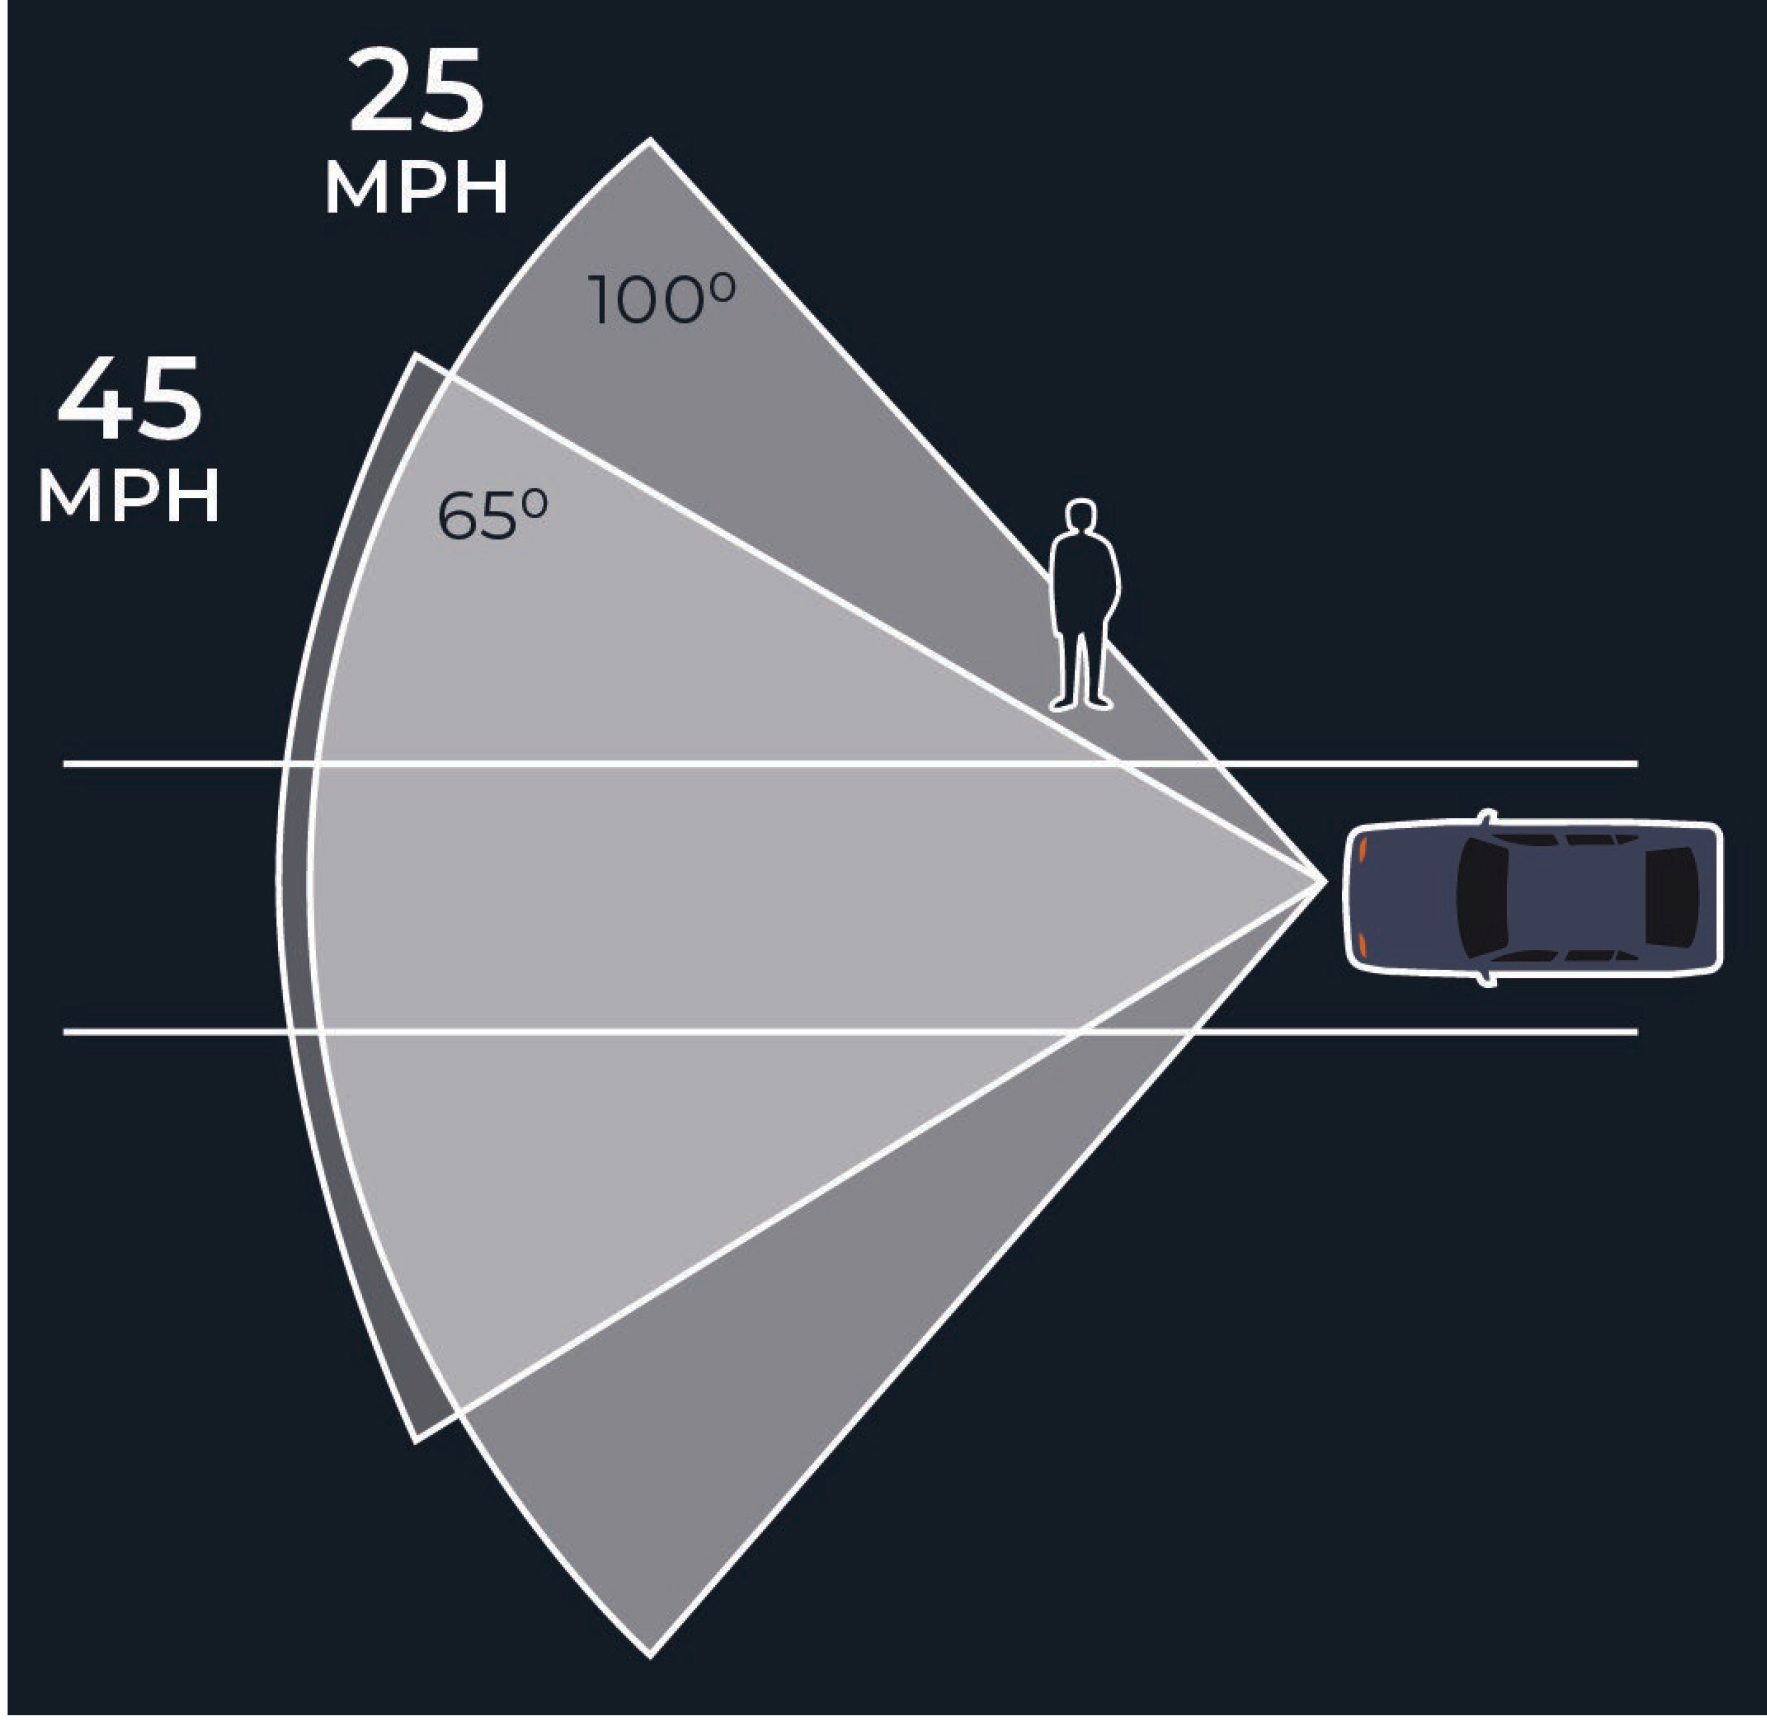
Source: NACTO 2020.
Long Description.
An illustration depicts the driver's field of vision. The illustration shows the top view of a car placed on a road. The driver's field of vision covers a cone of 65 degrees with a speed limit of 45 miles per hour and a cone of 100 degrees with a speed limit of 25 miles per hour. A silhouette of a person is drawn at 100 degrees from the driver.
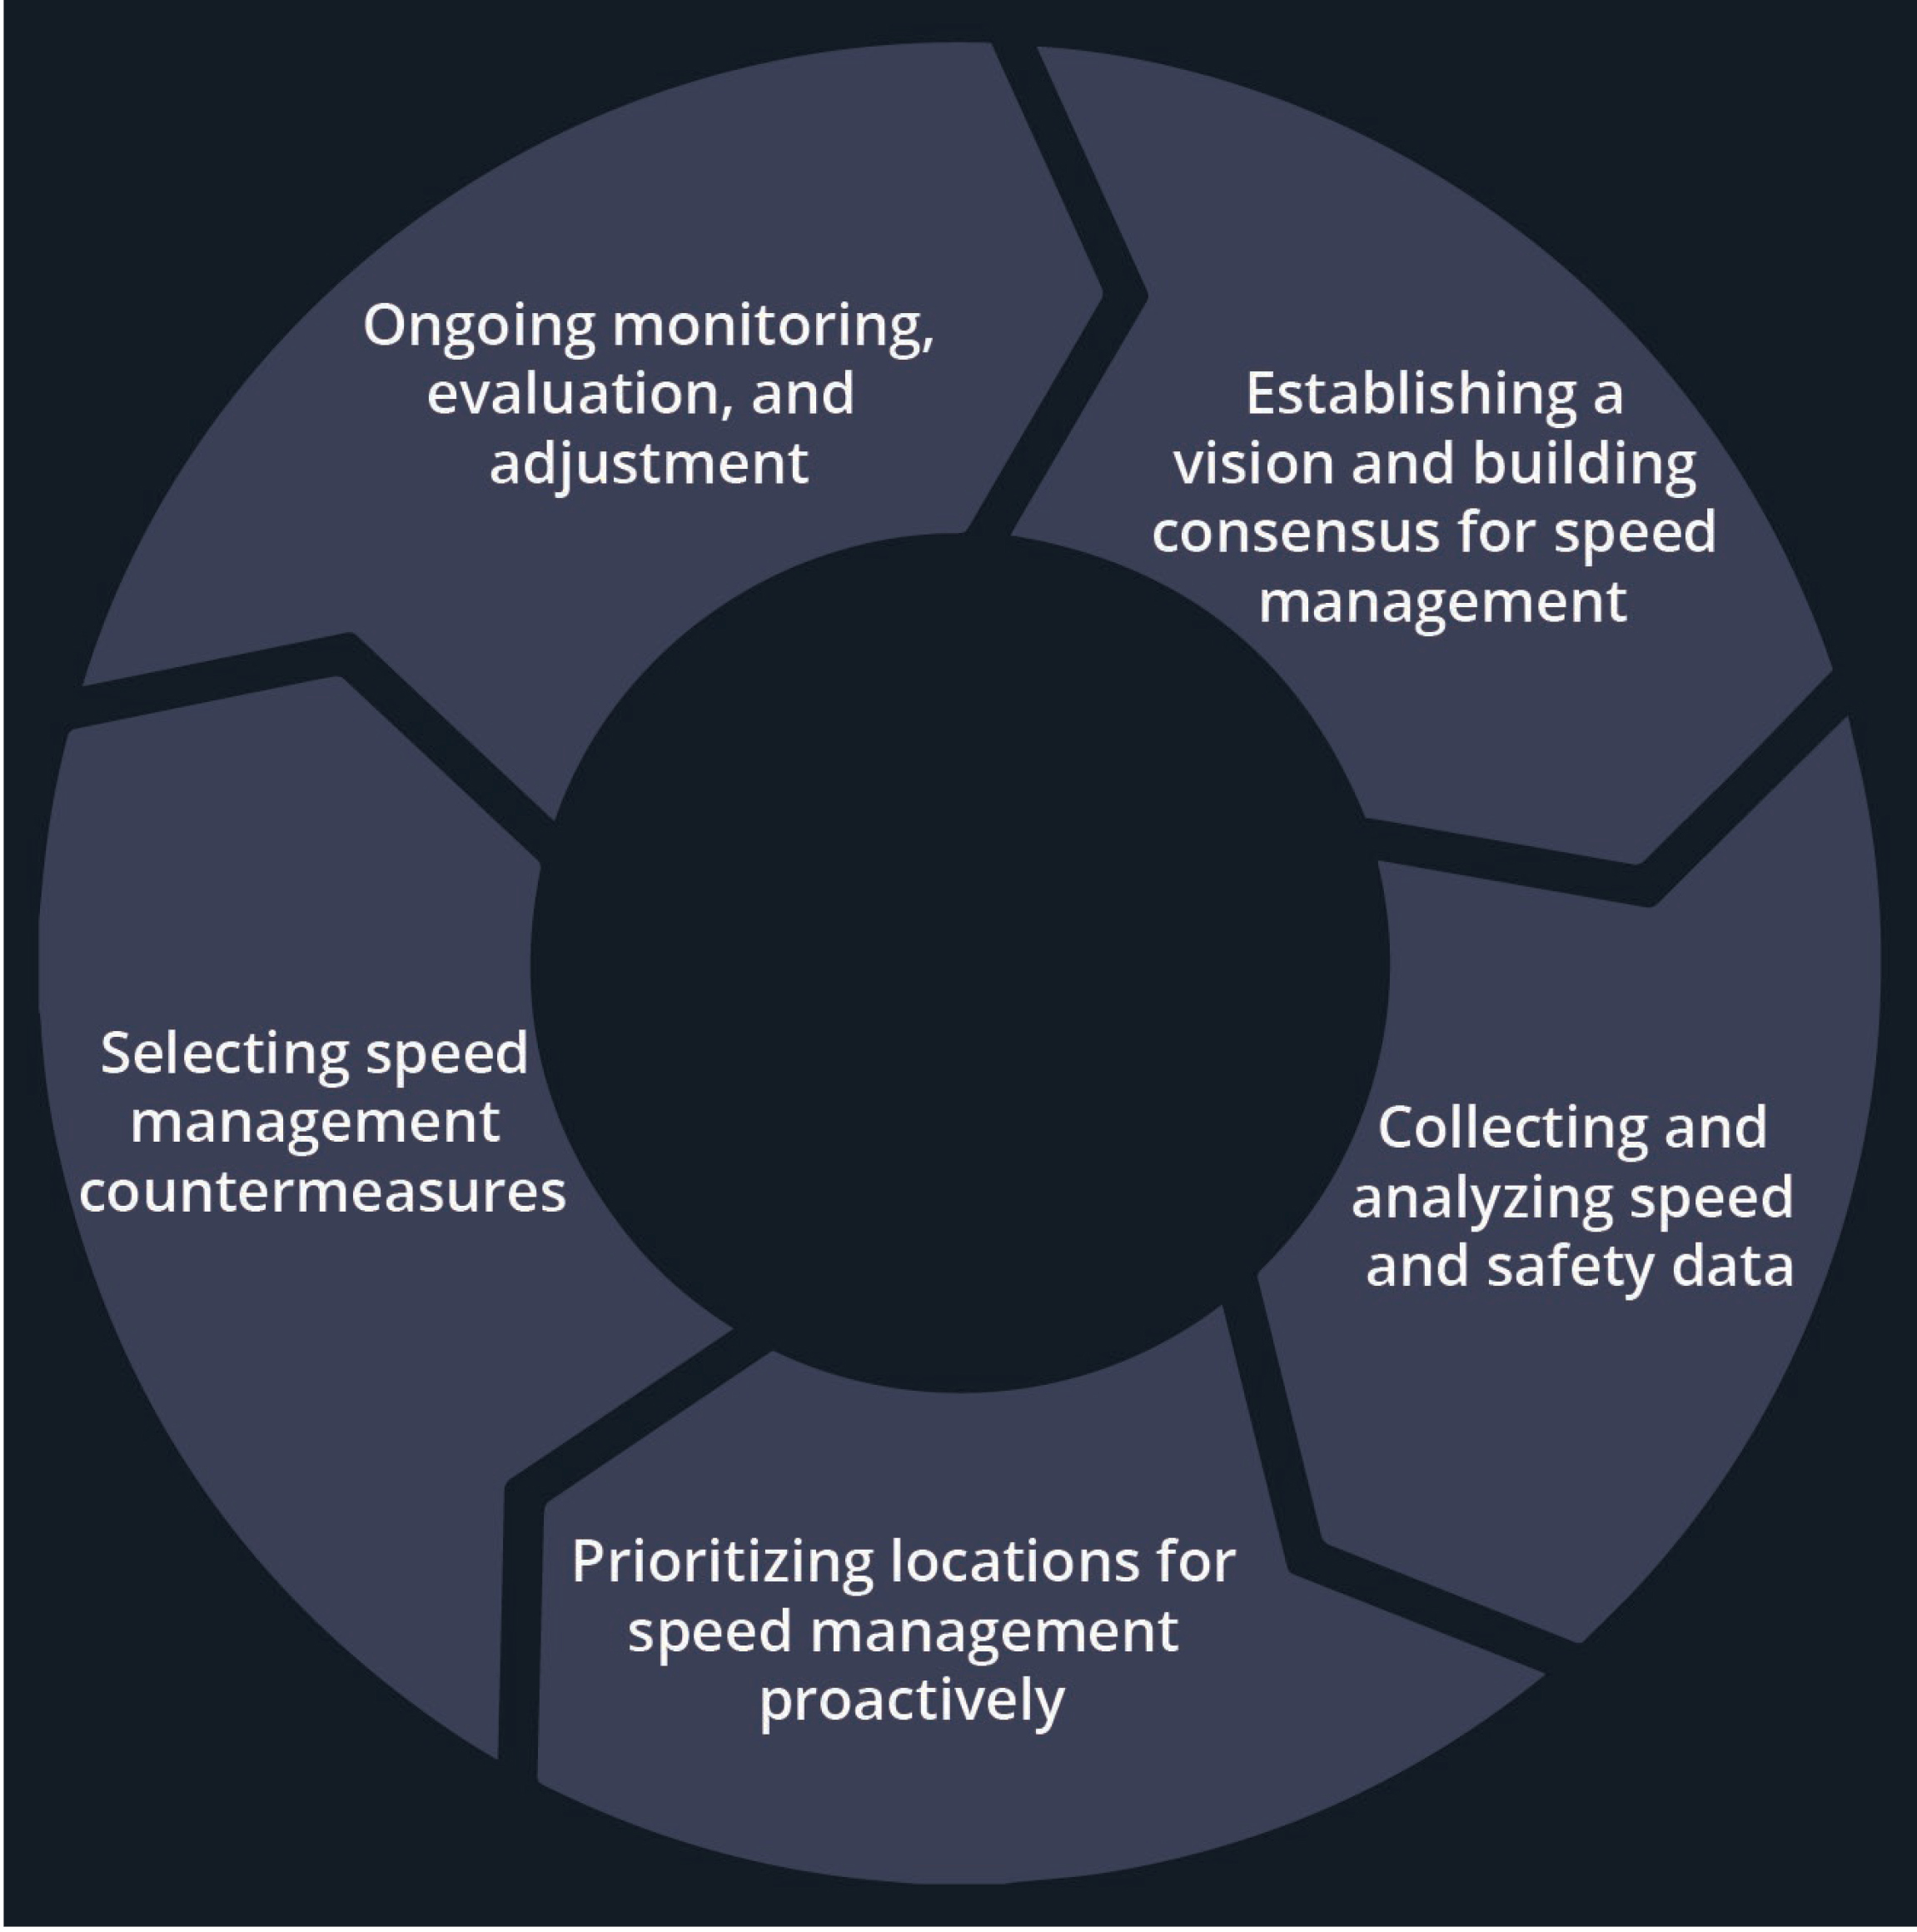
Source: FHWA 2023b.
Long Description.
An illustration of a donut chart with five sections shows the framework of the Safe System Approach for Speed Management. The text in each of the five sections is as follows: Establishing a vision and building consensus for speed management; Collecting and analyzing speed and safety data; Prioritizing locations for speed management proactively; Selecting speed management countermeasures; and Ongoing monitoring, evaluation, and adjustment.
This process can take time and may need iterations before the end result is achieved. For example, a blanket reduction in the speed limit as a policy may be effective in some areas but not in others. Evaluating where such an action is ineffective then provides information about the types of countermeasures that will be needed to reinforce the lower speeds, whether that be a roadway reallocation, automated speed enforcement, or a combination of those measures and other actions.
The following speed management countermeasures target a driverʼs behavior to reduce operating speeds and thereby reduce the likelihood of a crash:
- Road reallocation,
- Speed feedback signs,
- Automatic speed enforcement,
- Lower speed limits, and
- Other traffic-calming measures.
Road Reallocation
A proven safety countermeasure, road reallocation—also known as a road diet—reduces the number of vehicular travel lanes by reallocating roadway space to different roadway users. Typically, the converted roadway space is used to incorporate bike lanes, turn lanes, shoulders, transit lanes, and pedestrian crossing islands. As discussed in FHWAʼs Road Diet Informational Guide (2014), the safety benefits of road reallocation include reducing vehicular speeds while also reducing the pedestrian crossing distance (i.e., exposure).
As shown in Figure 12, pedestrians crossing multiple vehicular lanes are at increased risk of being hit by a driver who cannot see the pedestrian due to a stopped vehicle blocking their view (this is often called a multiple threat crash). Reallocating roadway space can greatly enhance pedestrian safety by eliminating or reducing the potential for multiple threat crashes and by slowing vehicle traffic in general. While no research has studied the risks associated specifically with multiple threat pedestrian crashes at night, research has found that pedestrians have difficulty accurately judging gaps between vehicles, which can exacerbate the risk of crossing multiple travel lanes (FHWA 2014). Additionally, reallocating roadway space is associated with lower vehicular speeds, which will improve pedestrian safety across all metrics.
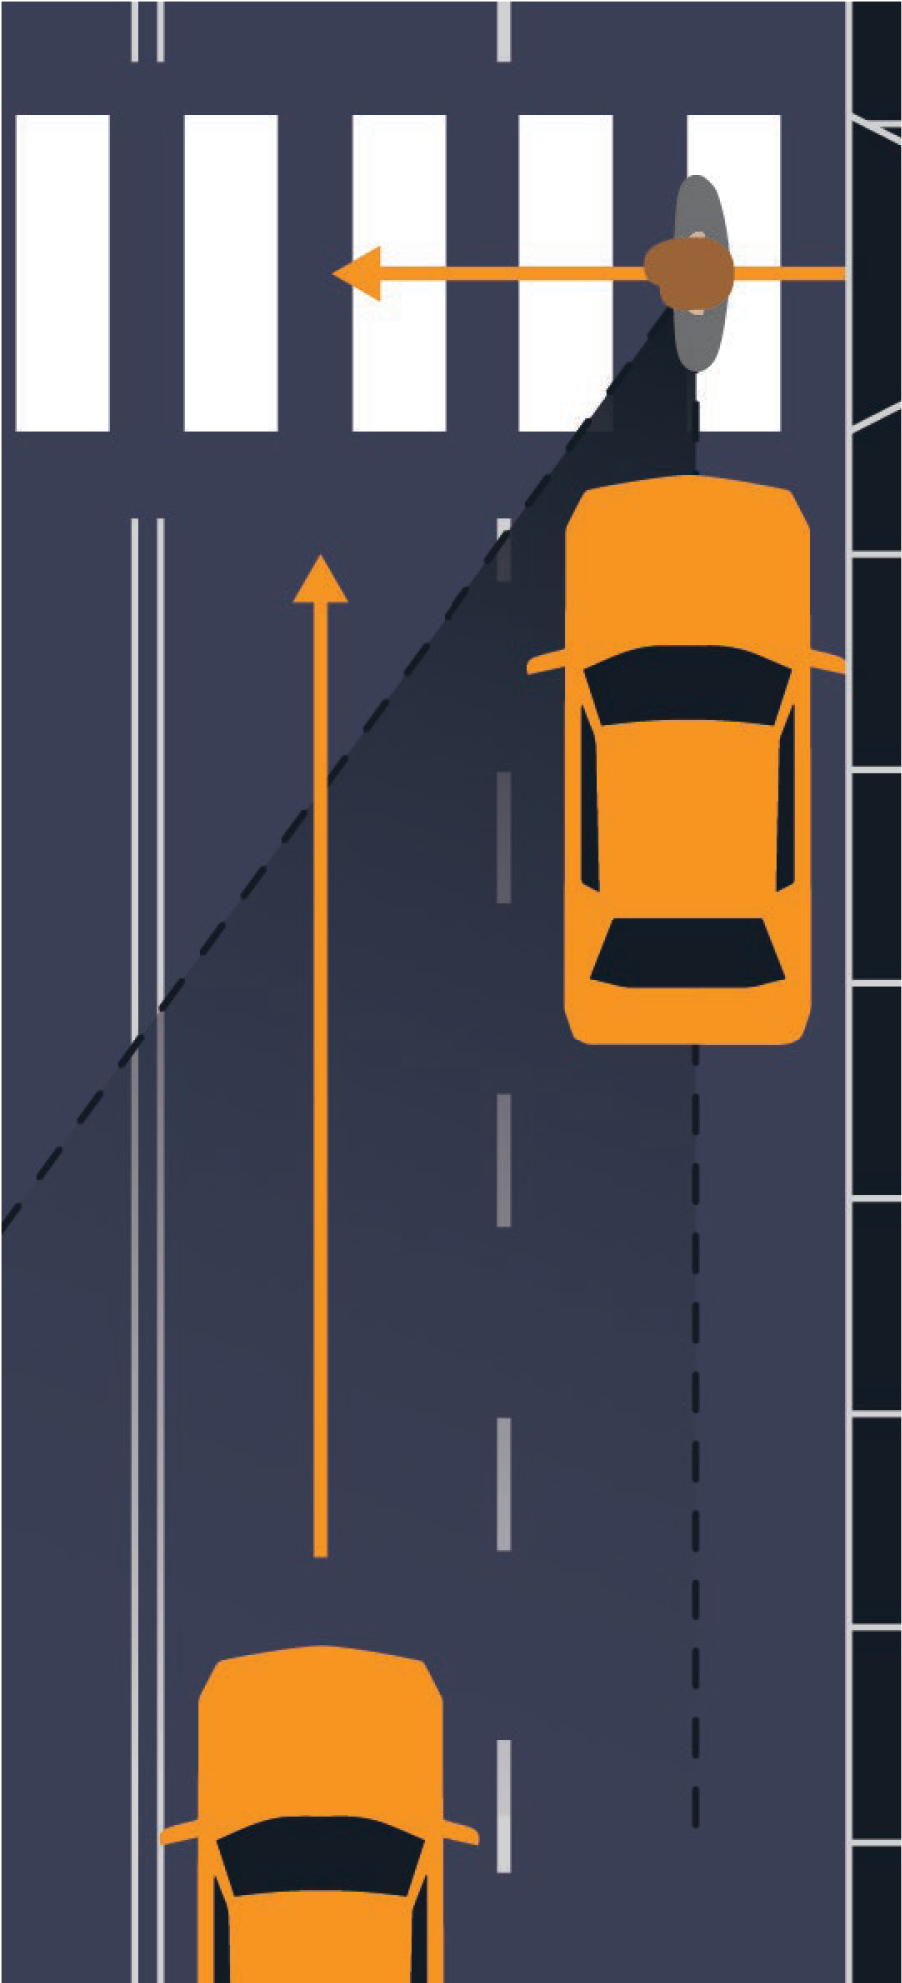
Long Description.
An illustration depicts a multiple-threat crash type. The illustration shows a top view of a crosswalk with a pedestrian crossing from right to left in front of a stopped vehicle in the right lane. The pedestrian's path is marked by an arrow. A second car is approaching the crosswalk in the left lane, and an arrow extends from this car to the crosswalk. The arrows indicate a potential point of collision on the crosswalk.
The most common scenario is reallocating a roadway with four general vehicular lanes to a roadway with two general vehicular travel lanes and a two-way left turn lane. Roadways with five or more lanes can also be reduced to fewer vehicular travel lanes, with the remaining roadway space reallocated to other purposes. In some instances, the remaining space is reallocated to include shoulders, bicycle lanes, separated bicycle lanes, a shared use path, turn lanes, a center turn lane, or pedestrian crossing islands, as shown in Figure 13 and later in this chapter in Figure 26.
Traffic volume considerations must be evaluated on a project-by-project basis. Reallocating four-lane to two-lane roadways is most common on multilane roadways with average daily traffic volumes between 8,000 and 20,000 vehicles per day (vpd). Lower-volume roadways may not need much traffic volume analysis to inform the decision. Four-lane roadways that have average daily traffic volumes of more than 20,000 vpd and other roadway configurations may require additional vehicular traffic analysis or public outreach.
Many road reallocation projects can be implemented quickly with modifications to markings and signs with potential changes to signal operations. These projects are often referred to as “rapid implementation projects,” “demonstration projects,” or “quick-builds.” In some cases, traffic signals or pedestrian-activated traffic control devices may also be incorporated into these projects. Quick-build projects are discussed later in this chapter in the section on crossing islands.
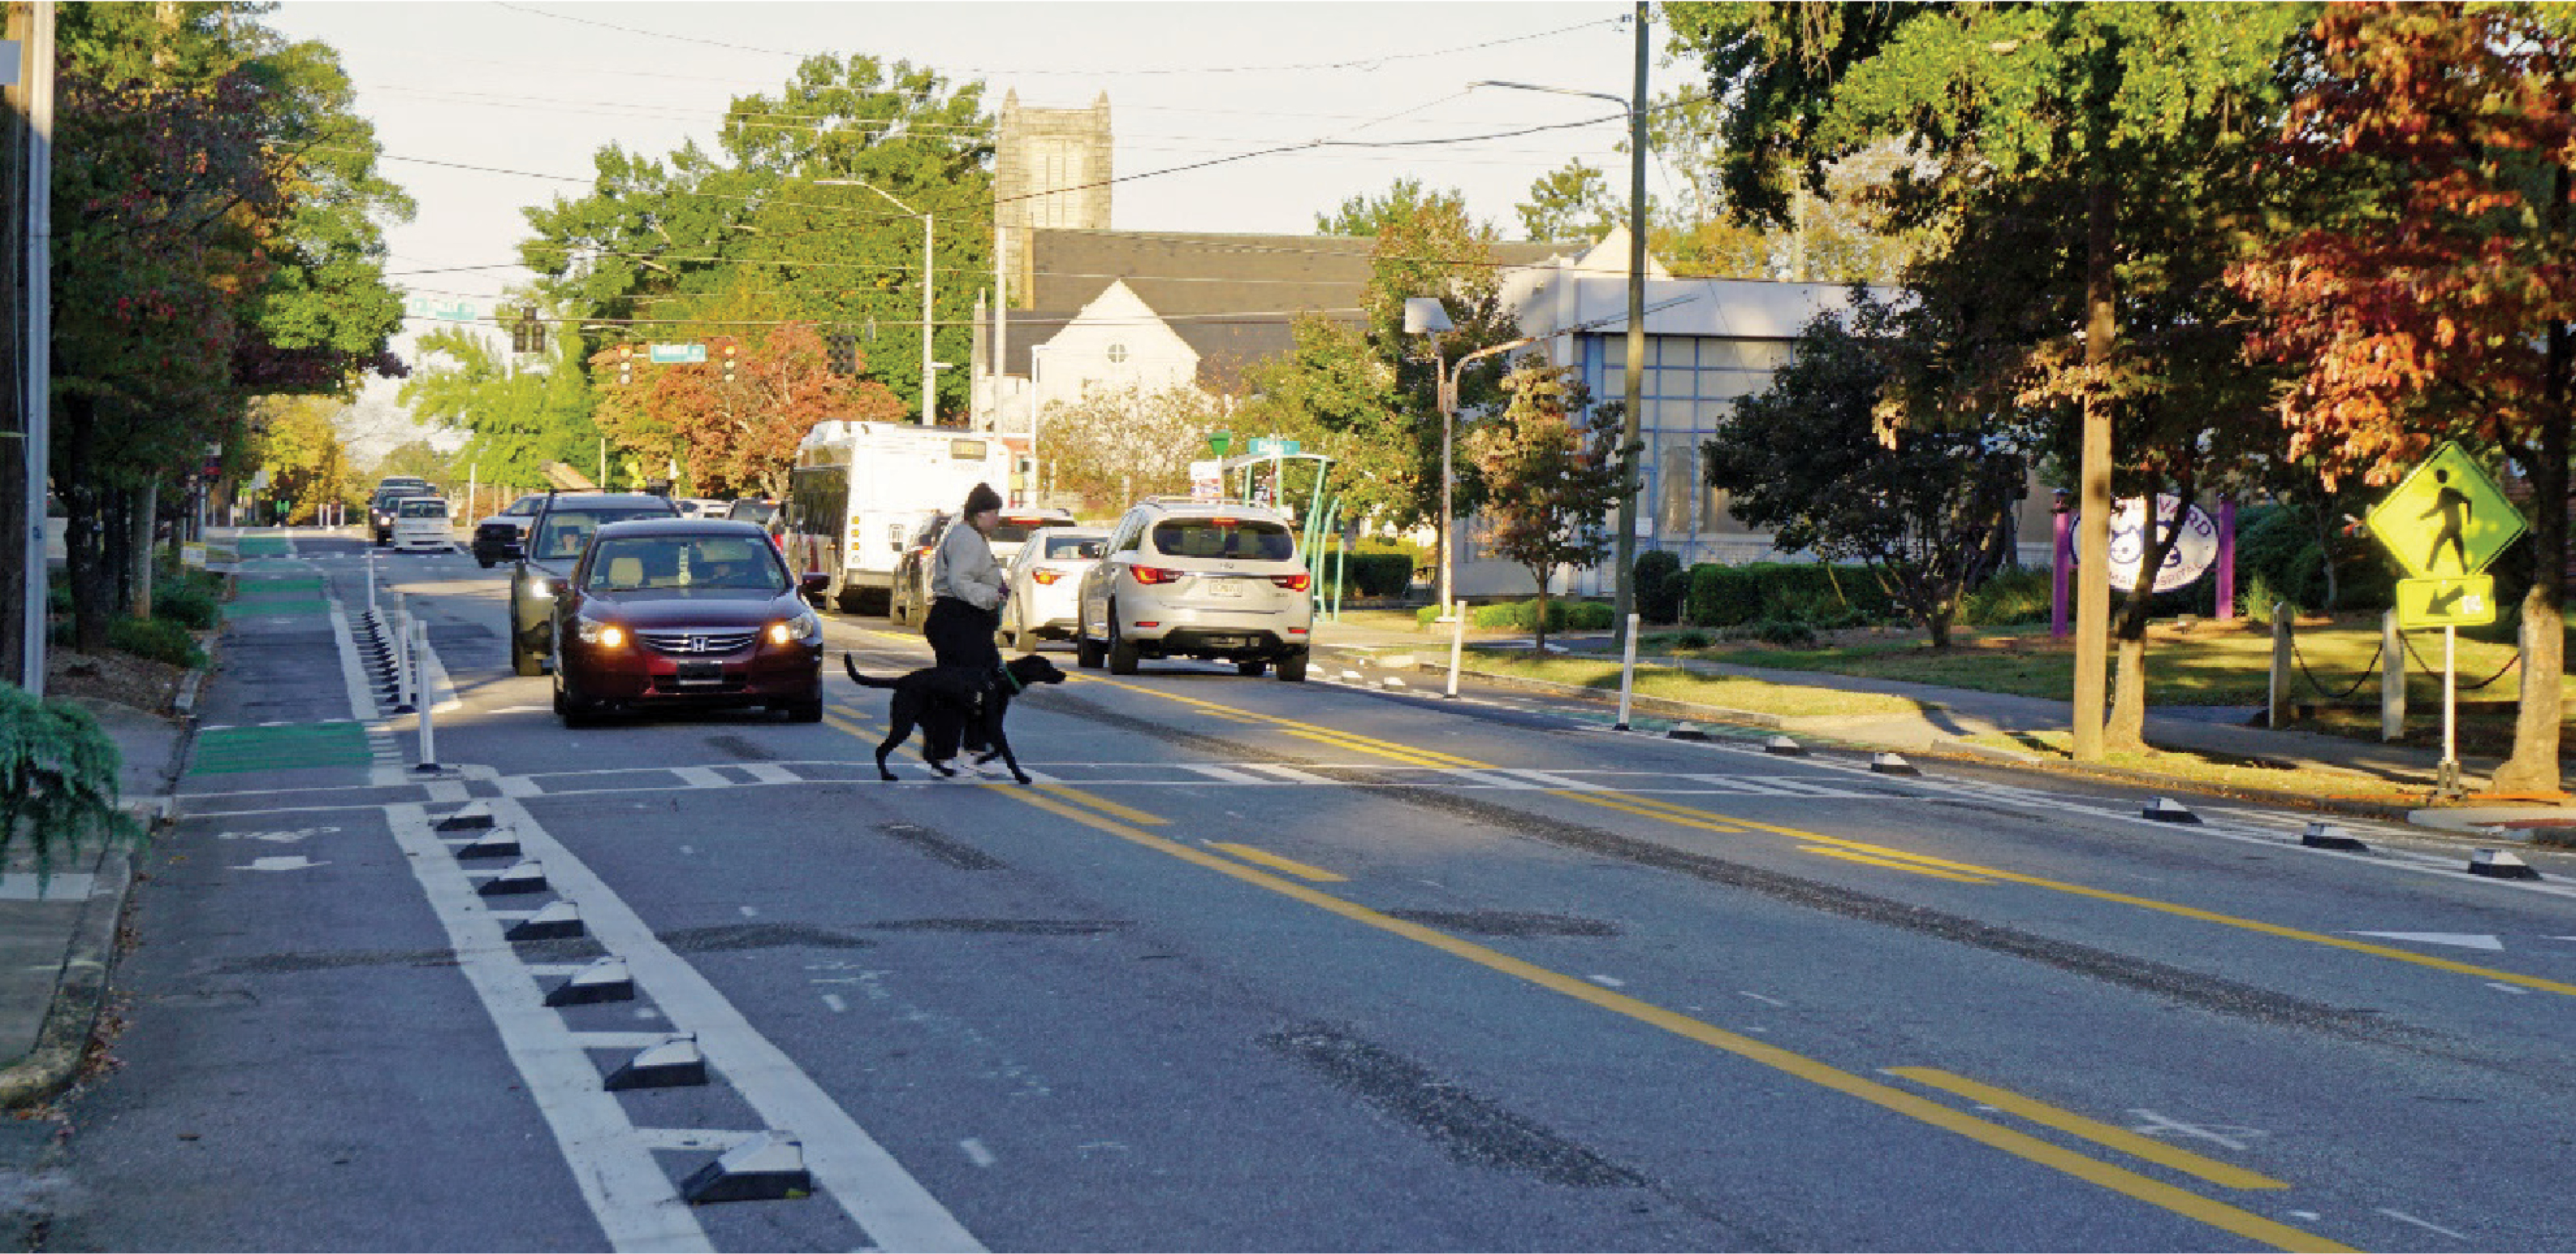
Long Description.
A wide view of a reconfigured urban street where roadway space has been reallocated. The street includes a center turn lane, two vehicle lanes, and separated bike lanes protected by flex posts and buffers. A pedestrian with a dog is crossing the street at a marked crosswalk, while cars yield. Trees, signage, and buildings line the sidewalk.
Speed Feedback Signs
A speed feedback sign dynamically displays a driverʼs real-time travel speed along with the posted speed limit, typically flashing the travel speed if it is above the posted speed. The sign serves to inform the driver and bring the driverʼs attention to their travel speed to prompt them to adjust it appropriately. This countermeasure provides a level of self-enforcement and driver accountability; however, it is not as effective as physically changing the geometry of the road to obtain slower vehicular speeds.
According to the Manual on Uniform Traffic Control Devices (MUTCD), Section 2C.13, speed feedback signs should be yellow (see Figure 14) and may be installed below the posted speed limit (FHWA 2023a).
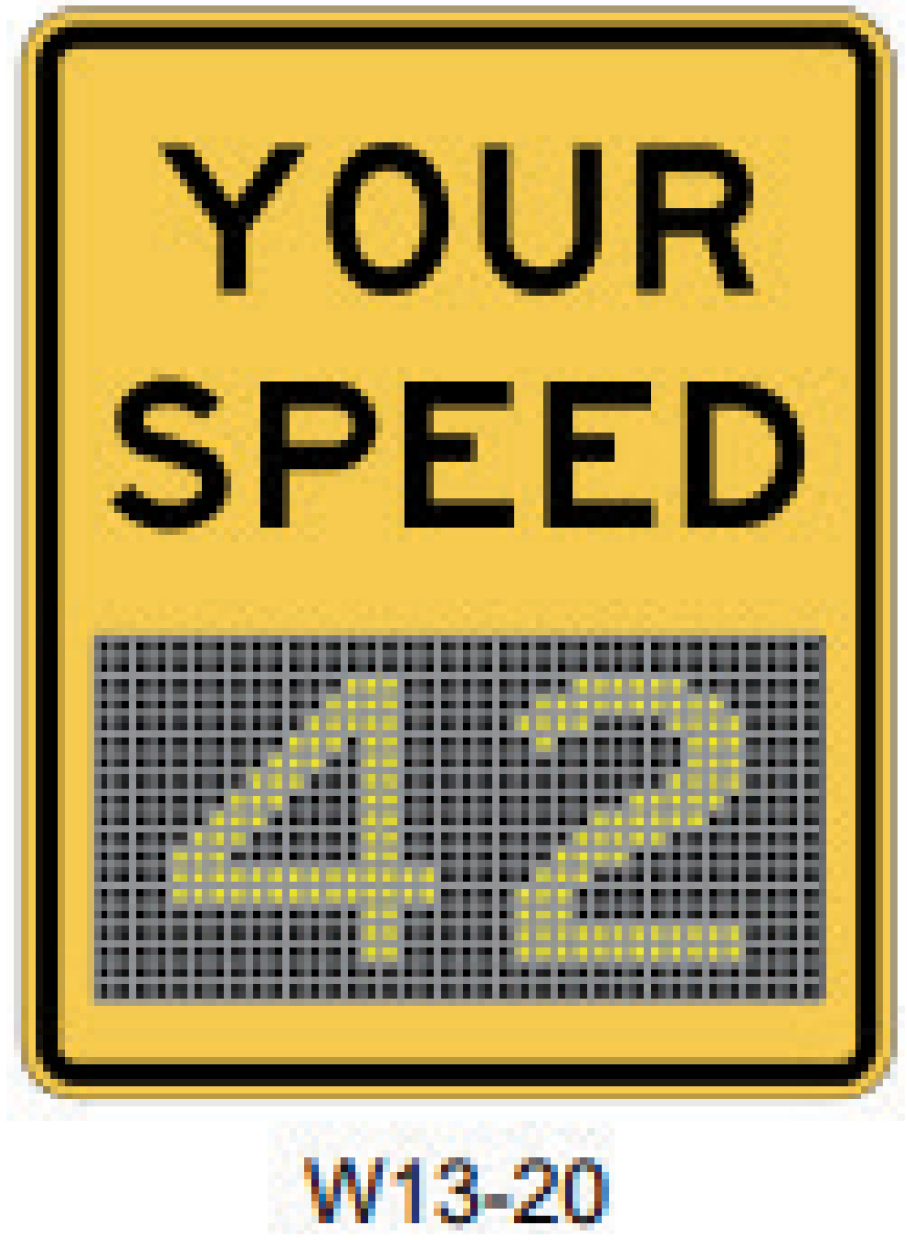
Source: FHWA 2023a.
Automatic Speed Enforcement
Automatic speed enforcement is an effective countermeasure for reducing vehicular operating speeds and is more reliable and impartial than manual enforcement. NACTOʼs synthesis of research on speed enforcement cameras, City Limits: Setting Safe Speed Limits on Urban Streets, found that these cameras reduced the percentage of speeding vehicles by 14% to 65% (NACTO 2020).
Automatic speed enforcement requires legislative action to permit cameras for enforcement. Currently, automatic speed cameras are permitted in about half of the states, as shown in Figure 15.
More details on automatic speed enforcement can be found in the following resources:
- City Limits: Setting Safe Speed Limits on Urban Streets (NACTO 2020) and
- Automated Enforcement in a New Era (GHSA and State Farm 2023).
Lower Speed Limits
The most recent MUTCD states that the 85th percentile speed should not be used to set speed limits “on urban and suburban arterials, (or) on rural arterials that serve as main streets through developed areas.” Instead, an engineering study to establish a speed limit must consider the roadway context such as the environment, transit service, pedestrian and bicycle activity, and other factors (FHWA 2023a). The 85th percentile method for setting roadway speed limits used the traveling speed of 85% of free-flowing drivers which research found increased the roadway speed limit over time (NACTO 2020). Research has found that changing the speed limit sign may

Source: IIHS n.d.
Long Description.
A U. S. map shows the states that use and do not use automated speed enforcement technologies. The legend of the map shows the states using said technologies (Yes) represented in orange and not using them (No) in white. The data given in the map area are as follows: Yes: Washington, Oregon, California, Nevada, Utah, Colorado, Arizona, New Mexico, Iowa, Missouri, Arkansas, Louisiana, Illinois, Indiana, Ohio, Tennessee, Alabama, Georgia, Florida, New York, Pennsylvania, Connecticut, Rhode Island, Delaware, Maryland, District of Columbia, and Virginia. No: Idaho, Montana, Wyoming, North Dakota, South Dakota, Nebraska, Kansas, Oklahoma, Texas, Alaska, Hawaii, Minnesota, Wisconsin, Michigan, Mississippi, Maine, New Hampshire, Vermont, Massachusetts, New Jersey, West Virginia, Kentucky, North Carolina, and South Carolina.
deter some drivers from exceeding the posted speed limit; however, physical changes are more effective (Caltrans 2023).
While night speed limits were used in the United States during parts of the twentieth century (Stein 2015), only Tucson, AZ, was found to post night speed limits; they are sited on more than 20 corridors with limited street lighting (Tinsley 2019). However, no safety studies of the effectiveness of night speed limits have been conducted, and few studies have suggested night speed limits as a practical pedestrian safety strategy (Schneider 2020; Sanders et al. 2022), despite three-quarters of pedestrian fatalities occurring at night. In practice, transportation professionals have historically conducted speed studies in the daytime, during periods when travel speeds were highest, to establish overall corridor speed limits. Section 2B.23 of the MUTCD (FHWA 2023a) allows for a nighttime posted speed limit to be displayed below the daytime speed limit sign (Figure 16). It would be helpful to conduct speed studies during nighttime conditions at locations with safety issues to determine whether an alternative posted speed limit or additional countermeasures to enforce speeds could be considered.
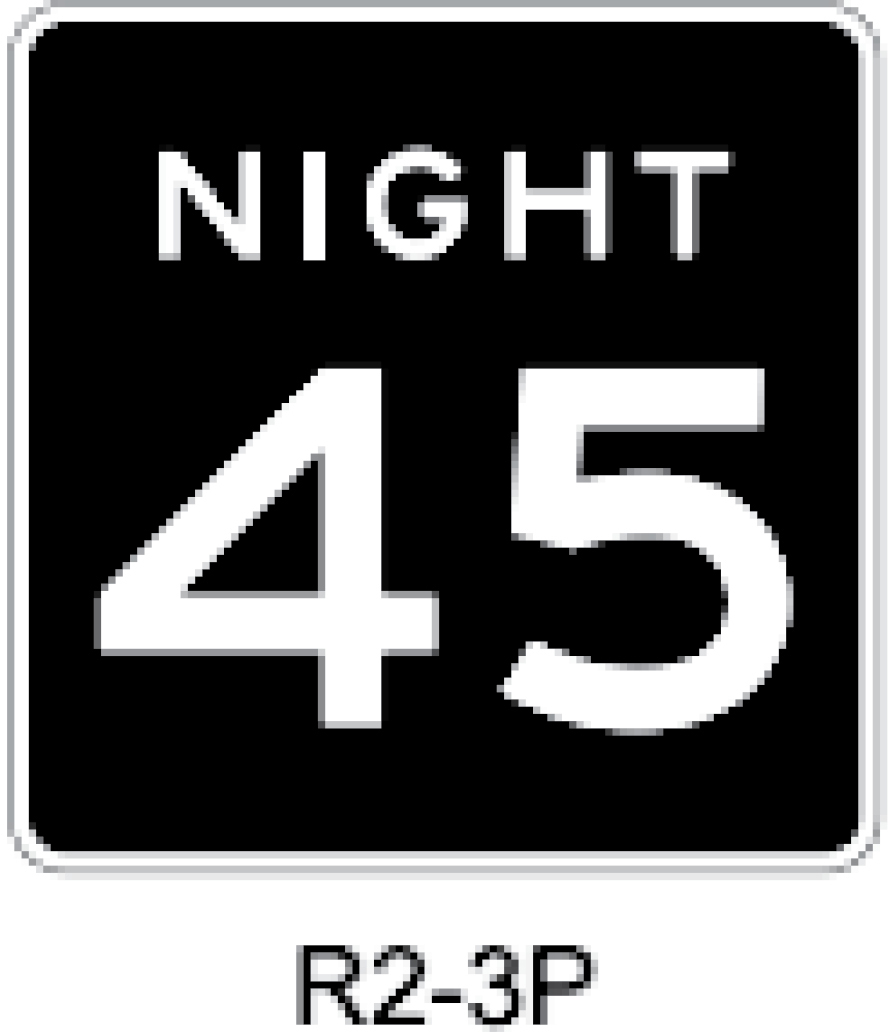
Source: FHWA 2023a.
For more design guidance on speed limits, refer to the following:
- MUTCD, 11th ed. (FHWA 2023a) and
- City Limits: Setting Safe Speed Limits on Urban Streets (NACTO 2020).
Other Traffic-Calming Countermeasures
There are other traffic-calming countermeasures that are effective at reducing vehicular speeds, but which have not been specifically evaluated in nighttime conditions. To ensure maximum effectiveness at night, traffic-calming devices such as chicanes, speed humps, traffic circles, and curb extensions need to be visible to drivers in darkness. In addition, traffic-calming devices need to be implemented to achieve the same level of effectiveness as in daytime conditions and eliminate the ability for drivers to avoid or drive around the traffic-calming device when vehicular volumes are reduced. For more design guidance details on traffic calming elements, refer to the following:
- Traffic Calming ePrimer (FHWA and ITE n.d.) and
- Urban Street Design Guide (NACTO 2013).
Enhance Visibility
 Drivers obtain cues on how to navigate a roadway from the roadwayʼs characteristics and surroundings. Every roadway where pedestrians are present must clearly communicate the potential risk of a person walking and crossing in both daytime and nighttime conditions.
The following proven and promising countermeasures target a driverʼs ability to see a pedestrian and reduce the likelihood of a crash:
- Lighting;
- Marked crosswalks; and
- Traffic control devices, including:
- Traffic signals,
- PHBs, and
- RRFBs.
Lighting
Roadway lighting is a proven safety countermeasure for reducing pedestrian crash risk at night (Polus and Katz 1978; Bush 1985; Kim et al. 2010; Haleem et al. 2015; Kemnitzer et al. 2019;
Hennessy and Ai 2021). Participants in the research teamʼs driving simulator experiment had a higher level of stress in darker roadway conditions as compared with brighter conditions. Additionally, 86% of participants indicated in the post-driving survey that additional roadway lighting helped with visibility. Lighting gives drivers more time to see and react to pedestrians, and, in slower-speed conditions, the addition of lighting alone may sufficiently improve pedestrian safety at night. However, the high percentage of pedestrian fatalities that occur in darkness with roadway lighting makes clear that roadways with underlying risk factors such as higher posted speeds and multiple lanes will not become safe simply with the addition of street lighting (Sanders et al. 2022, 2025). In addition to adding lighting where pedestrians are expected or directed to walk or cross, transportation practitioners also may want to work to manage vehicular speeds and reduce pedestrian exposure to vehicles.
Corridor-wide Lighting
The research team found that roadways with multiple travel lanes, higher vehicular speeds, and commercial destinations could benefit from corridor-wide, context-sensitive lighting. However, current design guidance in the United States prioritizes lighting on freeways, interchanges, and roundabouts with little information on when to implement lighting in other contexts. On the basis of the teamʼs research and available lighting references from AASHTO, NACTO, and Canadian guidance, corridor-wide lighting needs to be installed if one of the following conditions is applicable:
- Corridor has high-density housing, grocery stores, or is a commercial district with nighttime activity and destinations;
- Corridor experiences a high volume of pedestrian activity during darkness;
- Corridor is within one-half mile of a transportation center;
- Corridor is within one-quarter mile of a major transit stop or station; or
- Corridor is within one-half mile of an institution or educational facility that generates nighttime pedestrian trips.
Spot Lighting
Spot lighting is essential to illuminate aspects of the transportation system and may be necessary whether continuous corridor lighting is provided or not. Spot lighting needs to be considered where the paths of pedestrians and drivers cross, such as at intersections, midblock crossings, and driveways, or where there are known pedestrian safety or security concerns, such as bridges, underpasses, and tunnels (see Figure 17).

Long Description.
A well-lit street intersection at dusk. The intersection consists of visible traffic lights, a pedestrian sidewalk, a crosswalk, a bus stop shelter on the left, and a few vehicles and commercial buildings in the background. The sky is dark blue and streetlights are lit.
When spot lighting is implemented, light pole placement helps ensure driver visibility is increased and not decreased. Lighting needs to be located so that drivers can detect and react to a crossing pedestrian. Improper placement can negatively affect a driverʼs visibility and put pedestrians at further risk due to backlighting or shadows. Light poles need to be installed on the approaching side of the crossing at intersections and midblock locations (see Figures 25 and 26 later in this chapter). This placement will illuminate the front of the pedestrian and allow drivers to better see the person crossing.
Lighting Design Considerations
- Install roadway lighting on both sides of the roadway.
- Install roadway lighting to illuminate all roadway travel lanes and facilities such as bicycle lanes and sidewalks.
- Illuminate key aspects of the roadway such as user conflict areas, intersections, and complex roadway conditions.
- Install lighting in advance of midblock crossings and intersections to illuminate the front of a crossing pedestrian.
- Illuminate locations with known pedestrian safety or security issues, such as bridges, underpasses, and tunnels.
- Maintain street trees and other vegetation to keep them from blocking the light from the roadway and pedestrian facilities.
- Ensure that signs and other obstructions do not block the light from reaching roadway and pedestrian facilities.
- Consider pedestrian-scale lighting (typically mounted at a lower height), especially if street trees are present.
- Conduct a nighttime site visit to ensure that pedestrians are visible.
- Provide uniform lighting levels along the roadway and eliminate dark spots, especially in commercial districts or areas with nighttime pedestrian activity.
- Consider lighting technologies such as LED and automatically adjusting lights.
- Consider energy usage, the impact on wildlife, and human health when selecting light fixtures, color temperature (e.g., yellow light versus blue light), and placement.
- Minimize light pollution by limiting light trespass (how much light spreads) onto private property or into the sky.
For lighting standards and details, refer to the following sources:
- FHWA Lighting Handbook (Gibbons et al. 2023);
- Pedestrian Lighting Primer (VHB, VTTI, and FHWA Office of Safety 2022);
- Recommended Practice: Lighting Roadway and Parking Facilities (IES 2022); and
- Roadway Lighting Design Guide, 7th ed. (AASHTO 2018).
Marked Crosswalks
People walking need to be able to safely cross the roadway at convenient locations within commercial districts and near housing complexes, schools, transit stops, and other pedestrian destinations without being expected to walk long distances out of their way. Crossings must be visible and have the appropriate traffic control devices provided to ensure that drivers see and stop for people crossing, especially at night. According to FHWAʼs Crosswalk Marking Selection Guide, high-visibility crosswalk markings (see Figure 18) had an 8% higher yielding rate at night than a crosswalk marked with only two transverse lines (Schroeder et al. 2023). Similarly, the research teamʼs driver simulator experiment found that
- Most driving participants (72%) reported that high-visibility markings helped them detect the crossing pedestrian.
- Participants yielded earlier for midblock crossings with high-visibility markings than for unmarked crossings for both tested posted speed limits (25 mph and 40 mph).
- Unmarked crosswalks were associated with a higher average operating speed.
- Participants tended to have a higher level of stress at unmarked crosswalks as compared with locations with marked crosswalks alone or combined with RRFBs.

Source: Schroeder et al. 2023.
Long Description.
An illustration shows high-visibility crosswalk markings. Three types of markings are shown, as follows: 1, Bar pair, which consists of pairs of horizontal white bars placed evenly. 2, Ladder, which consists of two vertical white lines connected by horizontal bars resembling ladder rungs. 3, Longitudinal, which consists of evenly spaced horizontal white bars. The background is dark in contrast.
- Participants appeared to need more time to look for pedestrians in locations where infrastructure did not clearly indicate their potential presence (i.e., at an unmarked crossing as compared with a high-visibility crossing or an RRFB).
Pedestrian fatalities at night at nonintersection unmarked locations significantly increased over the past decade (Ferenchak and Abadi 2021). There are likely many factors that influenced this increase, including that pedestrian crosswalks are not always provided where pedestrians want to cross, and pedestrians will not walk significantly out of their way to another crossing if they gauge the risk to be low (Demiroz et al. 2015). Installing marked crosswalks with appropriate daytime and nighttime countermeasures to increase pedestrian safety at locations where pedestrians want and are permitted to cross is important. Design considerations for marked crosswalks include the following:
- Install crosswalks at key pedestrian desire lines, such as within commercial districts, near schools, at transit stations and stops, at housing complexes, and at other pedestrian destinations.
- Install crosswalks at appropriate spacing depending on context and land use [see NCHRP Research Report 1036: Roadway Cross-Section Reallocation: A Guide (Semler et al. 2023)]:
- In the urban core, the maximum crosswalk spacing is 300 feet (ft) (or one block).
- In other urban contexts, the maximum crosswalk spacing is 500 ft (or two blocks).
- In suburban context, the maximum crosswalk spacing is 1,000 ft (or three to four blocks).
- Install crosswalks using high-visibility patterns to make the crossing more visible and alert drivers to scan for pedestrians.
- Mark crosswalks on all legs of the intersection.
- Install advanced stop or yield lines at approximately 20 to 50 ft ahead of an uncontrolled crossing with either the “Yield Here to Pedestrians” (R1-5) or “Stop Here for Pedestrians” (R1-5b) regulatory sign (Figure 19).
- Install crosswalks, curb ramps, and other appropriate countermeasures at pedestrian desire lines or appropriate frequencies.
- Mark crosswalks as wide or wider than the curb ramp.
- Restrict parking adjacent to a crosswalk on roads where parking is allowed (see the discussion of daylighting under the section “Reduce Pedestrian Exposure”).
- Refer to Guide for Improving Pedestrian Safety at Uncontrolled Crossing Locations (FHWA 2018a).
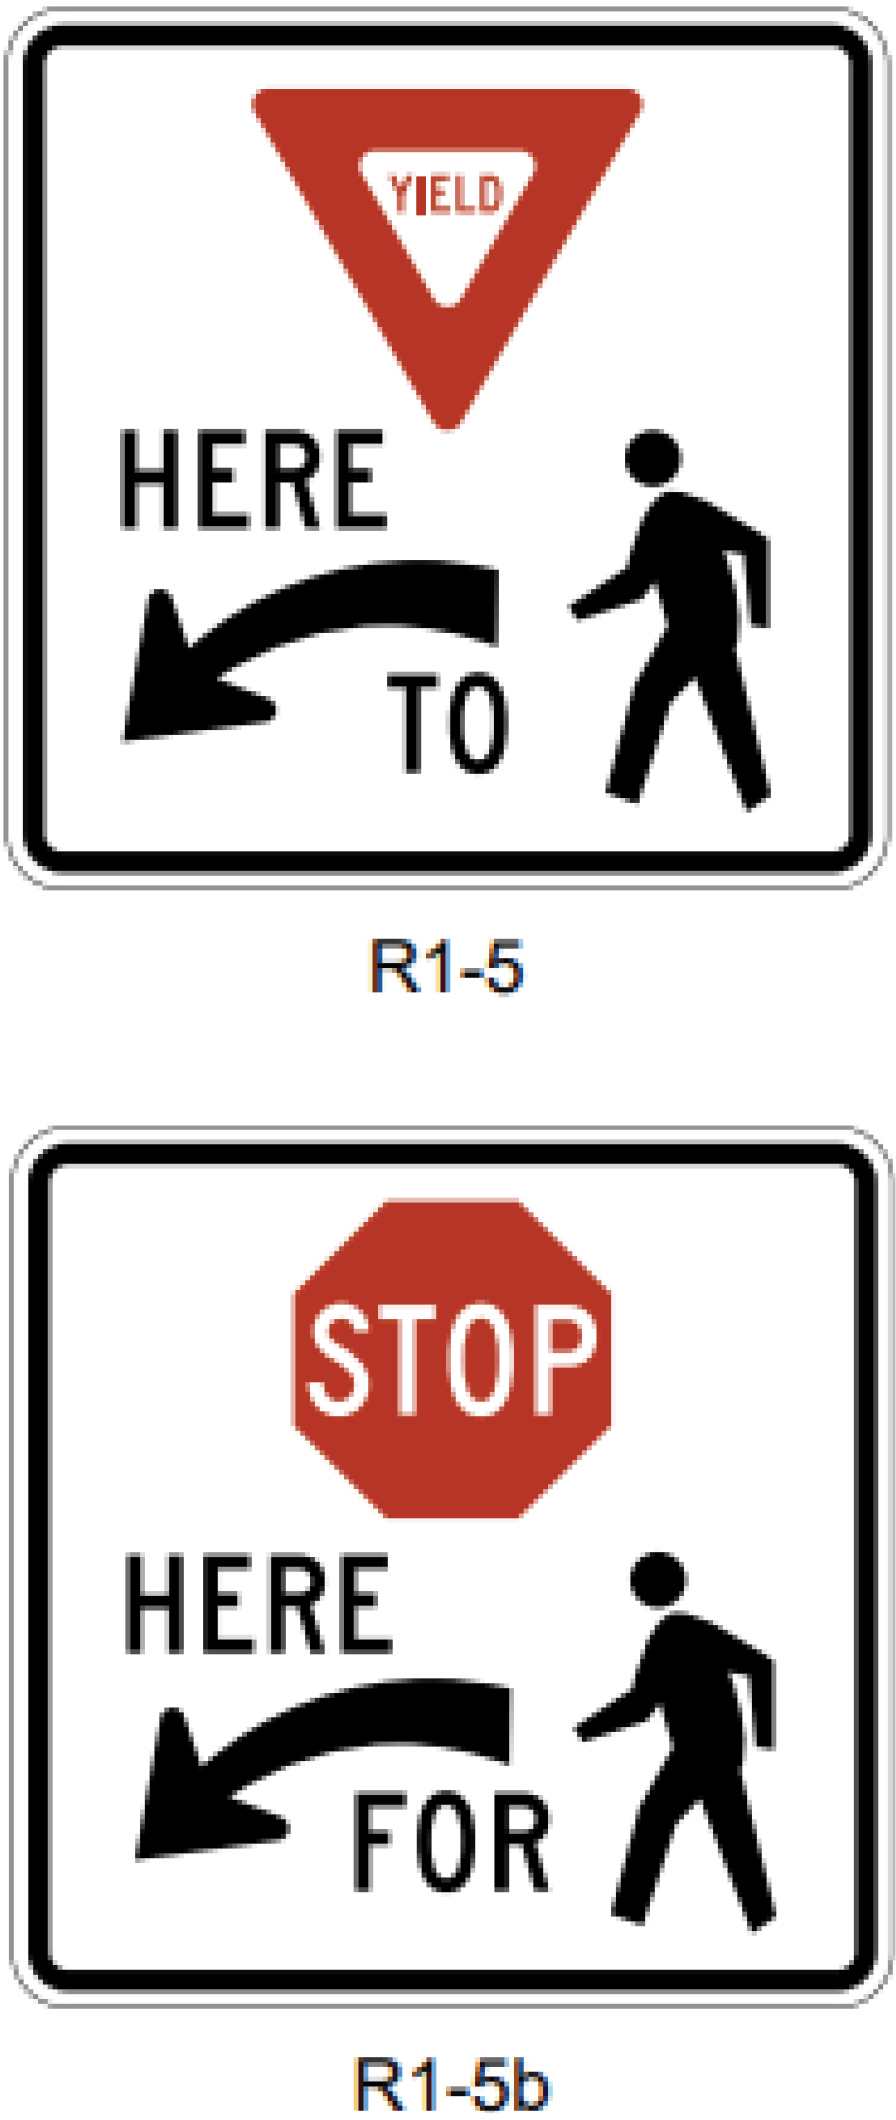
Source: FHWA 2023a.
Long Description.
Two examples of pedestrian crossing signs are shown. The first sign, labeled R - 1 5, shows the image of a red "Yield" sign in the center at the top. Below it to the right is the silhouette of a person walking. To the left of the silhouette is a curved left arrow with the words "Here to." The message of the sign is "Yield here to pedestrians." The second sign, labeled R 1 - 5 b, shows the image of a red "Stop" sign in the center at the top. Below it to the right is the silhouette of a person walking. To the left of the silhouette is a curved left arrow with the words "Here for." The message of the sign is "Stop here for pedestrians."
Traffic Control Devices
Vehicle–pedestrian conflict areas are best designed such that drivers can travel at a speed that allows them to see a crossing pedestrian with enough time to react, brake, and stop, especially when visibility is limited at night. Pedestrian crossings that are poorly designed can increase risky pedestrian decision-making and degrade pedestriansʼ trust that the transportation system is designed for them, as confirmed in the research teamʼs focus groups. Focus group members discussed that they do not trust that most drivers will comply with any traffic control device.
At midblock locations, motorists often travel at higher speeds and may be less likely to expect pedestrians to cross. At intersection locations, traffic signals may decrease pedestrian risk at night as compared with uncontrolled locations (Sanders et al. 2022), although future research considering pedestrian exposure at night would help further clarify these differences. The following sections discuss operational countermeasures that may be implemented to alert drivers to pedestrian crossings.
Traffic Signals
For pedestrian crossings that are controlled with traffic signals, pedestrian countdown indications need to be included to inform pedestrians about when to cross the street (Figure 20). Pedestrian crosswalks and indications need to be provided for every leg of an intersection, as people will often cross an unmarked leg rather than increase their delay and exposure by walking across multiple legs of an intersection.
Signalized intersections that do not provide marked crosswalks on all legs or that create high pedestrian delay because of cycle length or detection features can increase pedestrian risk taking. Research has found that many people will not wait more than 40 seconds for the pedestrian indication to inform them they may cross the roadway (NACTO 2013). Signalized intersections can improve a pedestrianʼs ability to cross an arterial roadway, but conflicts may remain where motorists are allowed to turn across a crosswalk while a pedestrian walk indication is provided, or a vehicle is allowed to turn right on red.
Following are considerations for pedestrian safety at night at signalized intersections:
- Minimize the cycle lengths of traffic signals and put signals on pedestrian recall mode to reduce pedestrian delays.
- Provide pedestrian countdown indications for every crosswalk leg with appropriate walk phasing and timing.
- Install leading pedestrian intervals to increase pedestrian visibility.
- Restrict right-turn-on-red movements by installing one of the “No Turn on Red” (R10-11, R10-11a, or R10-11b) series signs.
- Provide adequate intersection lighting to illuminate the intersection, including approaches and all crosswalks.
- Provide protected left-turn phases separate from crossing pedestrians.
- Reduce curb radii or provide crossing islands and other treatments to reduce the intersection geometry and ensure slow-turning vehicles.

Long Description.
A nighttime scene at a crosswalk with a pedestrian crossing a wet street. A person wearing a pink jacket and holding an umbrella is crossing the road in a crosswalk. The traffic signal at the junction of the crosswalk and sidewalk shows the red signal facing left for vehicles and the pedestrian crossing signal in bright white. Streetlights are lit, and the surrounding trees are illuminated. Another person can be seen on the far sidewalk.
- Provide exclusive pedestrian phasing with “No Turn on Red” signs to eliminate any potential conflicts with vehicular movements.
- Ensure pedestrian crossings are adequately lit for drivers to see crossing pedestrians where concurrent pedestrian phases are provided.
- Consider nighttime signal-timing strategies that reduce pedestrian delay, such as rest-in-walk or other recall options.
Pedestrian Hybrid Beacons
A PHB is a beacon that consists of two red lenses above a yellow lens. The red lenses are dark until they are activated by a pedestrian (Figure 21). When a PHB is installed at a crossing, indications must be provided to communicate to pedestrians when to walk. When activated by pedestrian detection or a push button, the vehicular beacon cycles through a pattern of flashing and solid red or yellow lights to alert drivers to stop or yield for crossing pedestrians while the pedestrian indications cycle through “Walk” and flashing “Donʼt Walk.” Upon completion of the walk interval, the vehicular indication returns to dark while the pedestrian indications rest in “Donʼt Walk.” PHBs are effective at crosswalks at night due to the flashing light patterns that alert and require drivers to stop or yield (Fitzpatrick et al. 2006).
PHBs are typically used at unsignalized crossings on high-speed roadways (those with speeds greater than 35 mph) with multiple travel lanes, which are unsafe and challenging for crossing pedestrians. The Guide for Improving Pedestrian Safety at Uncontrolled Crossing Locations (FHWA 2018a) provides guidance on when a PHB should be considered according to posted speed limit, average daily traffic volumes, and roadway configuration. However, it refers to the MUTCD (FHWA 2023a), which suggests installing a PHB on any roadway when a minimum of 20 pedestrians per hour have been observed to cross. This pedestrian volume criteria limits implementation of a known safety countermeasure that reduces pedestrian risk, especially at night and at locations where pedestrian demand is likely suppressed due to existing roadway conditions. The work of the research team suggests that transportation professionals use the guidelines shown in Figure 22,
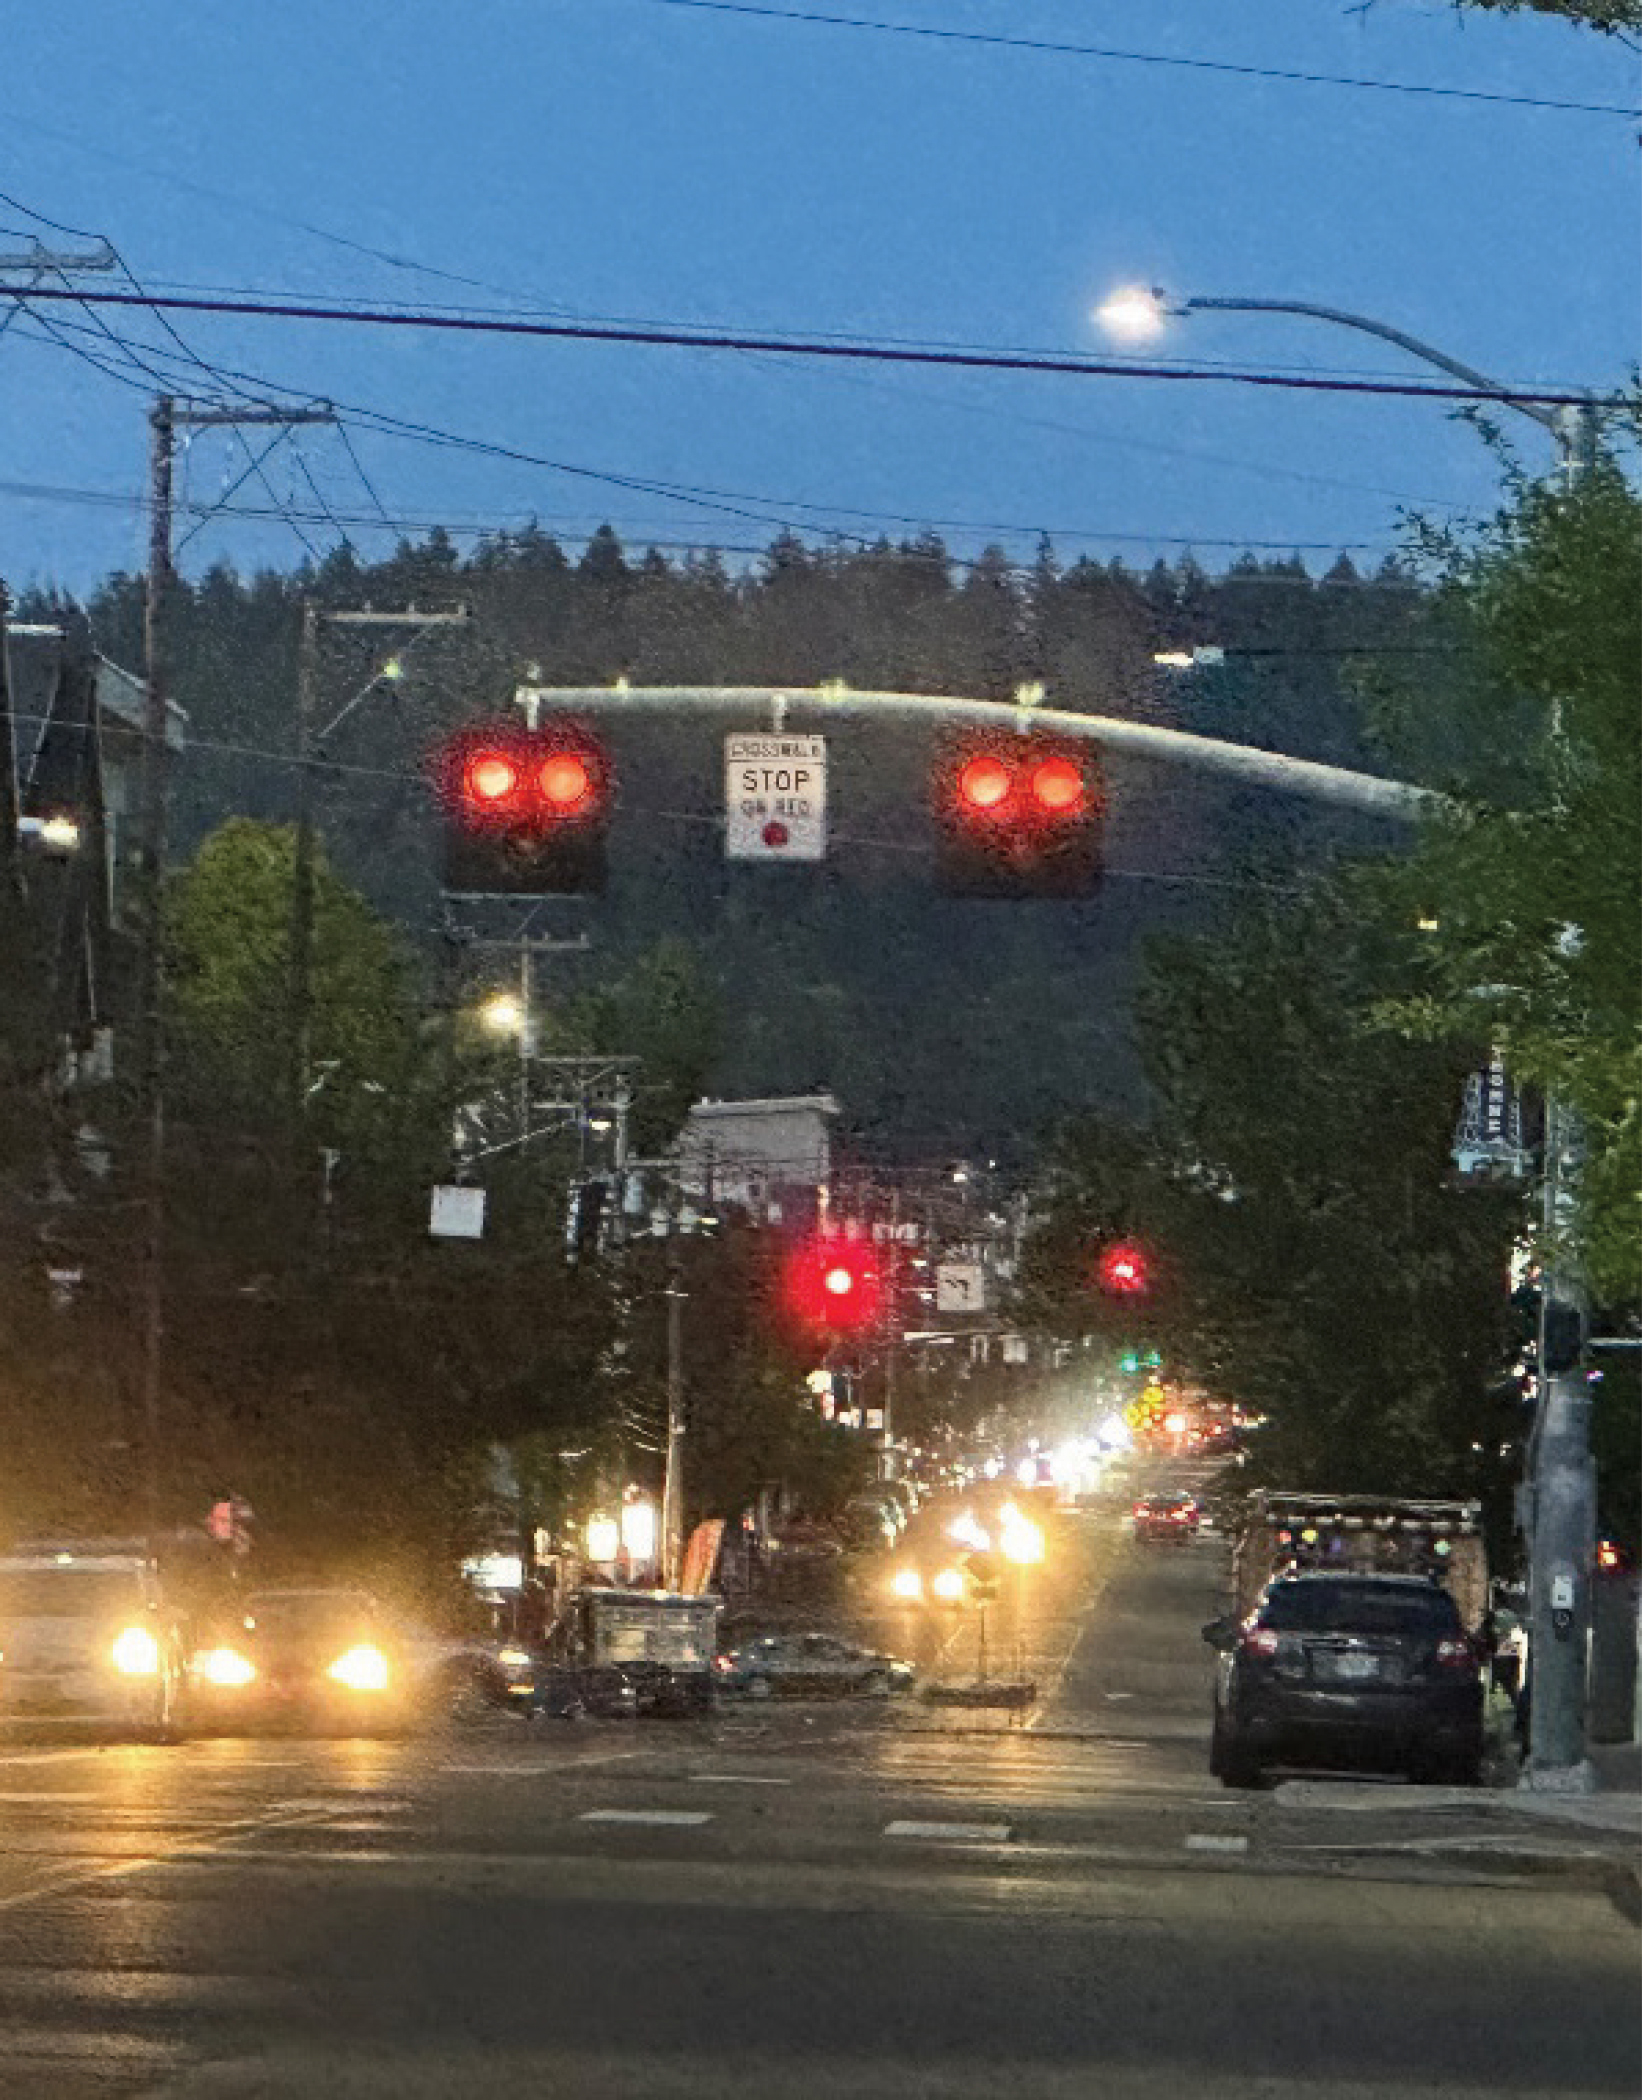
Source: Safe Streets Research and Consulting.
Long Description.
A nighttime urban street scene showcasing a pedestrian hybrid beacon, or PHB. The PHB is suspended above the road, displaying two solid red lights and a central sign reading "Stop on Red." Cars are stopped at the intersection and headlights line the street. The background shows tree-lined hills under a darkening blue sky, with city lights, vehicle lights, and traffic signals visible down the road.
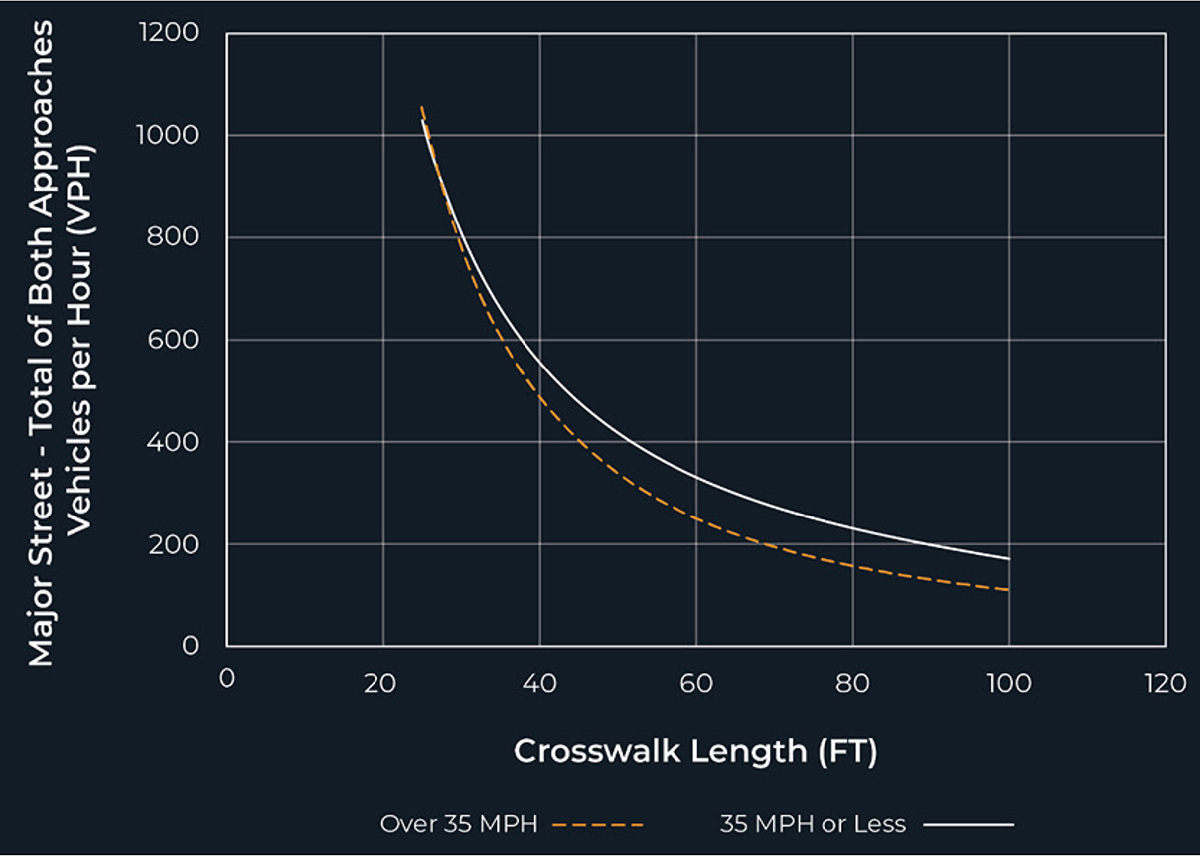
Long Description.
A line graph shows data on guidelines for the installation of pedestrian hybrid beacons. The horizontal axis shows crosswalk length in feet from 0 to 120 in increments of 20. The vertical axis label is "Major street - Total of Both Approaches, Vehicles per Hour (VPH) and the axis goes from 0 to 1,200 in increments of 200. Two line trends marked "Over 35 miles per hour" and "35 miles per hour or less" are drawn in the graph. The line for over 35 miles per hour begins at Point (25, 1,050), reaches Point (68, 200), and ends at Point (100, 100). The line for 35 miles per hour or less begins at Point (24, 1,045), reaches Point (70, 260), and ends at Point (100, 180). Note that the coordinate values are approximate.
in which the minimum pedestrian volume has been removed, to evaluate whether a PHB is applicable to improve pedestrian safety at the crossing location. In this revised approach, a PHB needs to be considered if the plotted point representing the vehicles per hour on the major street (total of both approaches) and the length of the crosswalk falls above the applicable curve, depending on the known vehicular speeds. This revised approach allows transportation professionals to use engineering judgment to provide a safe pedestrian crossing for both daytime and nighttime conditions. After the signal is operational, follow-up studies can reevaluate the pedestrian demand.
Several focus group members stated dissatisfaction with PHBs and a lack of driver compliance. These findings underscore the importance of education and engagement campaigns prior to implementation to help drivers and pedestrians understand the functionality of PHBs and how to correctly use them.
PHB design considerations include the following:
- Install a PHB at a marked crosswalk.
- Mark a stop line for each approach.
- Consider installing a PHB if the intersection of the vehicular volume and crosswalk length falls within the curve in Figure 22.
- Consider installing signs that inform drivers how to operate at the beacon, such as “Crosswalk—Stop on Red” (R10-23) or “Stop on Red—Yield on Flashing Red After Stop (R10-23a).”
- Provide a pedestrian detection system, such as video or infrared or a push button for a pedestrian to activate the beacon.
- Consider providing a pedestrian detection system or a push button in the median at a crossing.
- Provide a stop sign (R1-1) on the minor approach if the PHB is installed at an intersection.
- Consider daylighting the crossing to enhance pedestrian and driver visibility.
- Conduct a driver education and outreach campaign to encourage appropriate compliancy.
Rectangular Rapid Flashing Beacons
An RRFB is a pedestrian-actuated warning beacon that includes pedestrian warning signs and alternating high-frequency yellow lights that increase driver awareness of a crossing pedestrian. RRFBs need to be implemented at uncontrolled, marked crosswalks (Figure 23). In the teamʼs driver simulator research, most participants reported that the RRFB helped them detect the pedestrian crossing at night, regardless of posted speed (25 mph and 40 mph). In addition, of the 10 simulator crashes, none occurred in segments with RRFBs.
These results indicate that RRFBs need to be considered at crossings associated with nighttime trip generators to increase the safety and visibility of a crossing pedestrian. They may also be desirable as an interim or permanent strategy in locations where PHBs or traffic signals are not desired or recommended.
RRFB design considerations include the following:
- Place RRFBs on both sides of the crosswalk facing each approach.
- RRFBs need to be activated with a pedestrian detection system such as video or infrared or a push button.
- Install an additional RRFB on the crossing island if one is present.
- Consider solar-powered RRFBs and evaluate whether they generate enough power to illuminate during nighttime hours.
- Consider adding a light fixture to the RRFB post to add additional crosswalk lighting at night.
- Consider advance placement warning signs and markings at crossings on higher speed roadways.
For additional design considerations for pedestrian crossings, refer to the following:
- MUTCD (FHWA 2023a),
- Guide for Improving Pedestrian Safety at Uncontrolled Crossing Locations (FHWA 2018a),
- Crosswalk Marking Selection Guide (Schroeder et al. 2023),
- Pedestrian Refuge Island (FHWA 2018b),
- Pedestrian Hybrid Beacons (FHWA 2021a),
- Rectangular Rapid Flashing Beacons (FHWA 2021b), and
- Achieving Multimodal Networks: Applying Design Flexibility and Reducing Conflicts (Porter et al. 2016).
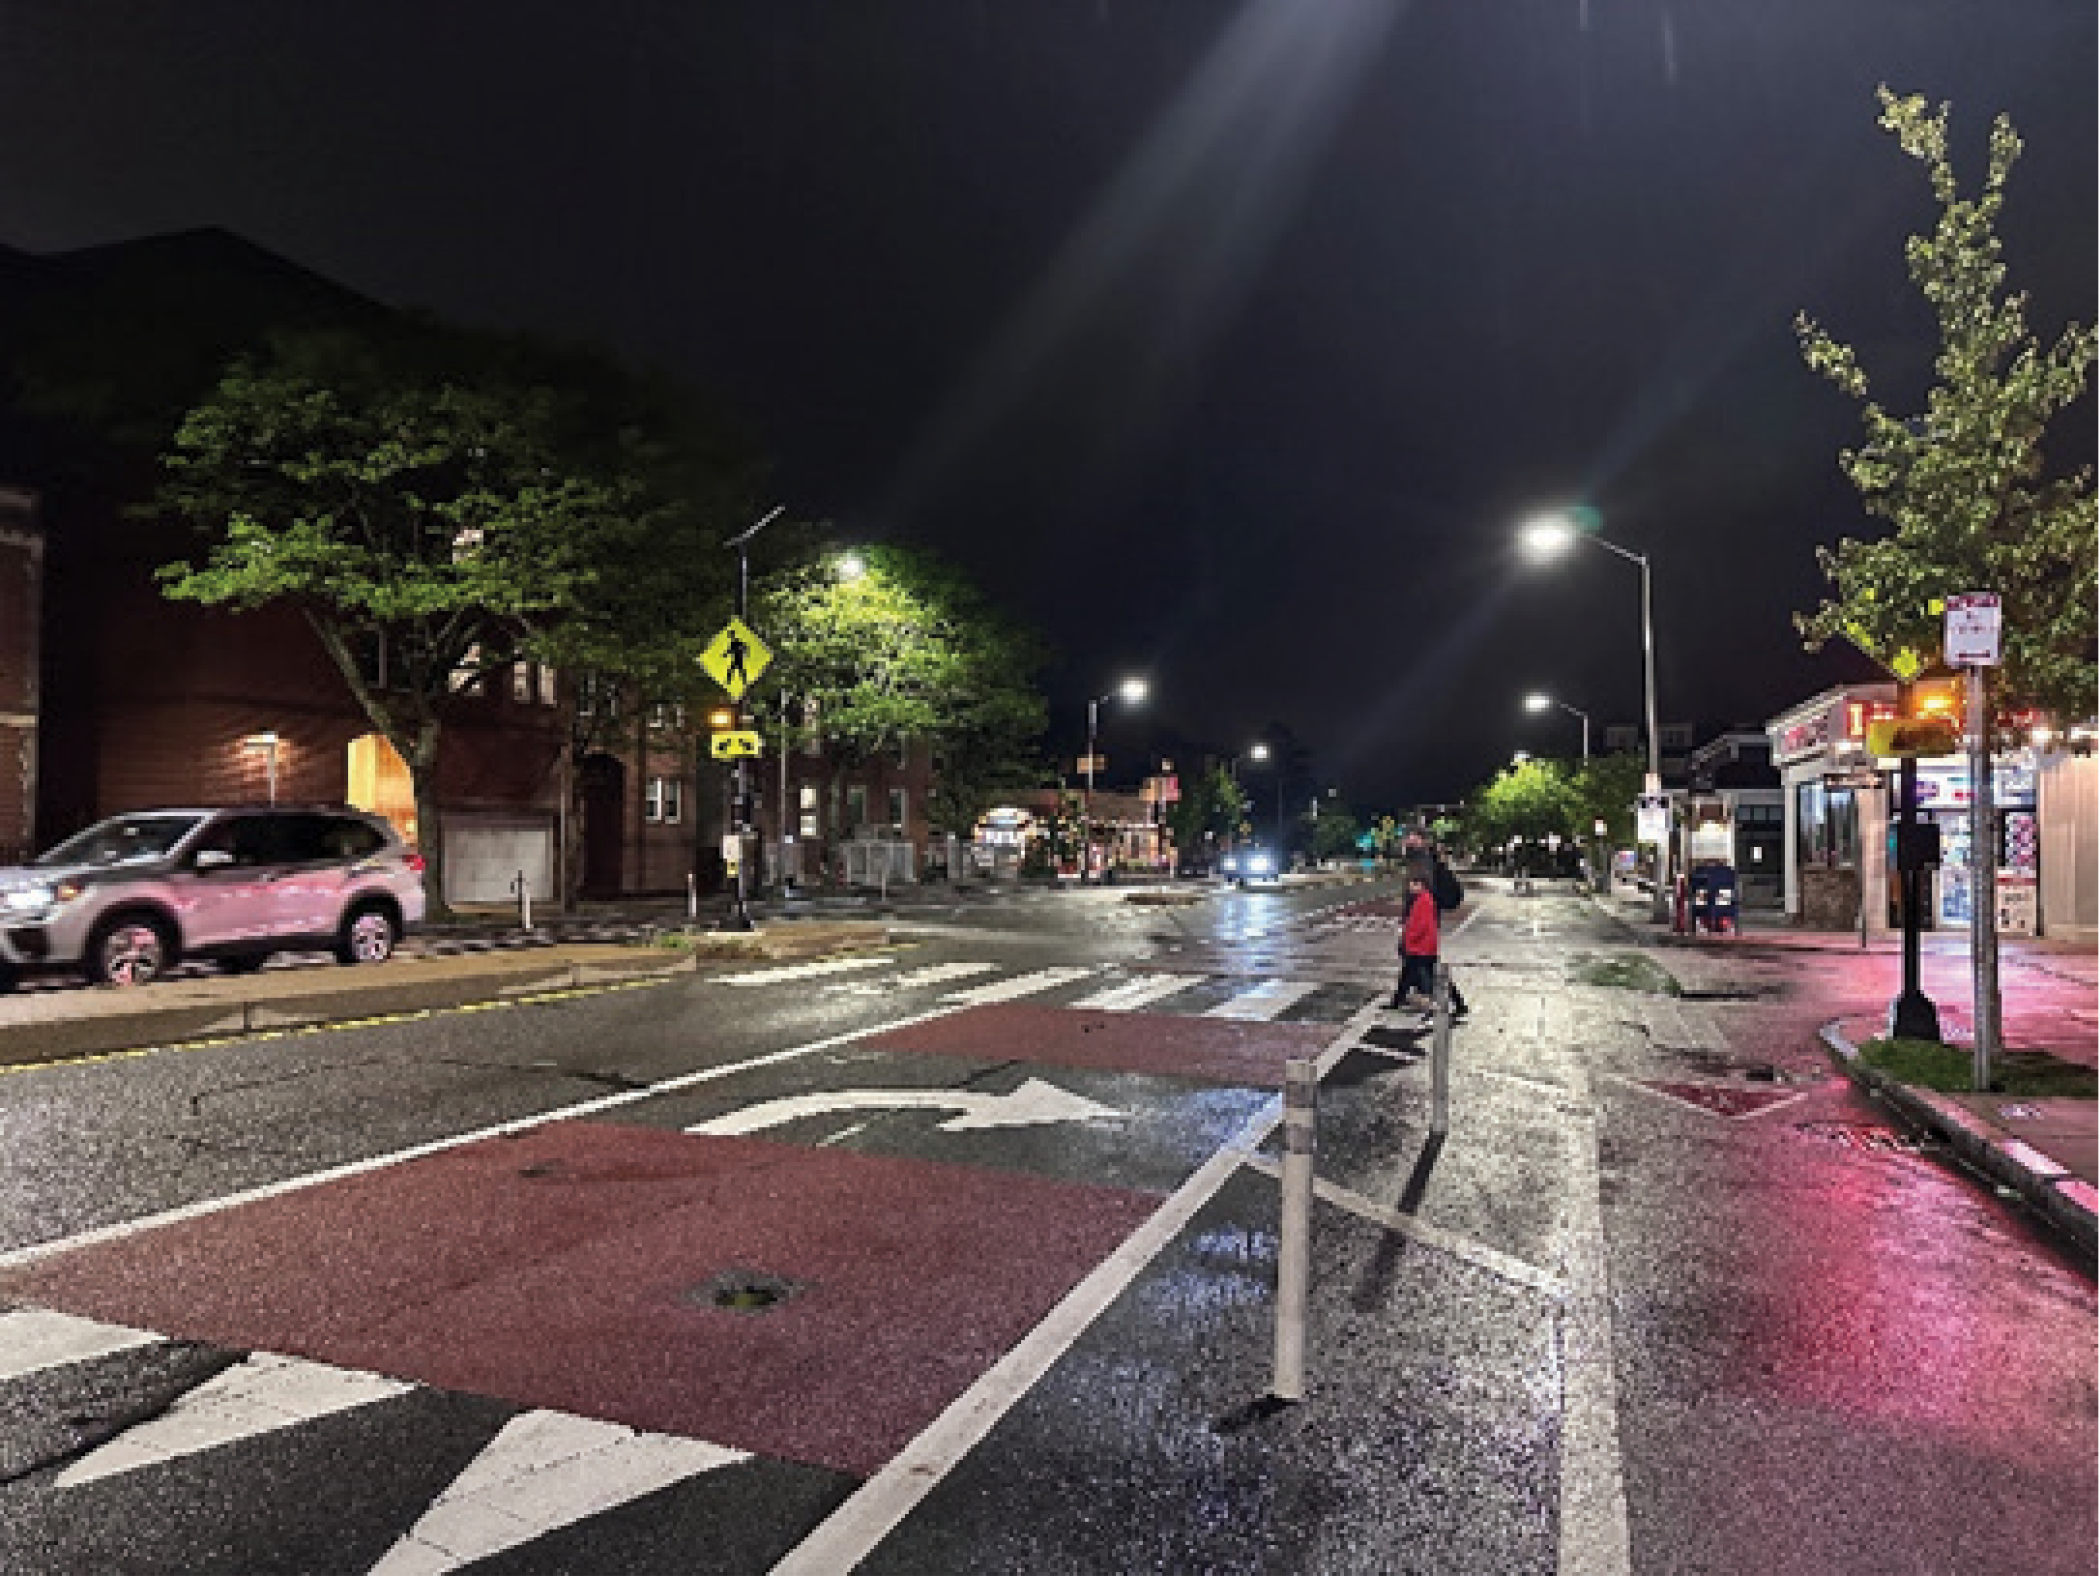
Long Description.
A nighttime street scene of pedestrians crossing at a rectangular rapid flashing beacon. An adult and child are walking in a crosswalk across a wet road. The crossing area is marked with white arrows and red pavement. The beacon is mounted on a pole with pedestrian signage. Streetlights and building lights illuminate the area.
Reduce Pedestrian Exposure
 Pedestrians are at risk when they walk along vehicular traffic or cross a street. Increasing pedestrian safety involves reducing the amount of time the pedestrian spends in the roadway (i.e., exposure). This is even more essential at night, when driver visibility is limited due to darkness. The following proven and promising countermeasures target reducing pedestrian exposure to vehicular traffic at night:
- Daylighting and curb extensions,
- Crossing islands, and
- Sidewalks, walkways, and shared use paths.
Daylighting and Curb Extensions
Daylighting and curb extensions are the practice of removing obstructions at a crosswalk to both reduce the distance a pedestrian needs to cross the street (i.e., exposure) and to improve visibility between the pedestrian and driver. It also narrows the roadway, which can reduce vehicular speeds. Most often, obstructions are parked vehicles that can block the sightlines between an approaching driver and a crossing pedestrian. Parking restrictions at crossings can eliminate this obstruction. Parking restrictions may be implemented with temporary materials such as pavement markings and flexible delineator posts or by building permanent curb extensions. Typically, the parking restriction is stipulated in local regulations (common restrictions are 20 ft from the crosswalk). However, if larger vehicles such as loading vans or trucks may park adjacent to the crosswalk, longer restrictions may be desirable. See the discussion of vehicle design in Chapter 4 for more details.
Design considerations for daylighting include the following:
- Restricting parking for at least 20 ft prior to the crosswalk;
- Installing vertical barriers to self-enforce and reduce encroachment from vehicles; barriers are typically offset from the adjacent travel lane by 1 to 2 ft; and
- Installing “No Parking,” “Stop,” or “Loading Zone” signs if vertical barriers are not placed or if required by regulation.
If built as a curb extension, the daylit area may require drainage modifications or a drainage pass-by channel. Street furniture, bicycle parking, or stormwater management treatments can be considered for placement within the curb extension area, as long as they do not affect sightlines between the crossing pedestrian and an approaching driver.
Crossing Islands
The research found that multilane roadways were significantly associated with pedestrian fatalities at night. Multilane roadways create multiple threat conditions (see Figure 12) and have longer crossing distances for pedestrians, meaning that the pedestrian spends more time in the roadway. A pedestrian crossing island (or pedestrian refuge island) provides a waiting area in the middle of a roadway that allows pedestrians to cross one direction of vehicular traffic at a time, thereby reducing the pedestrian exposure. Crossing islands also narrow the roadway, which can reduce vehicular speeds. Crossing islands have been found to decrease pedestrian crashes by 32%; however, their effectiveness at reducing nighttime crashes has not been specifically evaluated (FHWA 2018b).
Crossing islands can be implemented in all contexts and roadway classifications (see Figure 24) but often are implemented on arterial or other multilane roadways. Guidance for crossing island design includes the following:
- Install the crossing island with a minimum width of 6 ft, although 8 to 10 ft is preferred and a minimum length of 20 ft will better protect pedestrians.
- Include an accessible path with width equal to the crosswalk width through the island with cut through or curb ramps.
- Consider constructing a raised median with ADA-compliant curb ramps.

Source: Safe Streets Research and Consulting.
Long Description.
A nighttime urban street scene depicting a crossing island at the center of the road. The island contains a reflective pedestrian crossing sign and is ringed with vertical delineators. There is another reflective pedestrian crossing sign at the curb. Vehicles are parked along both sides of the street, with a few cars driving in either direction. Streetlights cast a warm glow, and shops and trees line the sidewalks under a dark blue sky.
- Consider creating a temporary median using pavement markings and flexible delineator posts that are located out of the way of vehicular travel lanes.
- Consider incorporating landscape features such as low plantings or stormwater management.
- Incorporate the traffic control device appropriate for the roadway characteristics (see the discussion of traffic control devices earlier in this chapter).
- Include street lighting that adequately illuminates crossing pedestrians (see the discussion of lighting earlier in this chapter).
Sidewalks, Walkways, and Shared Use Paths
Pedestrian infrastructure such as sidewalks, walkways, and shared use paths reduces pedestrian exposure by providing dedicated space for people walking or using a wheeled mobility device along the roadway. As a proven safety countermeasure, the inclusion of exclusive space for pedestrian travel in the transportation system is important. Similar to driversʼ need for a vehicular network, pedestrians need to have a seamless, connected, and comfortable network of exclusive pedestrian infrastructure that connects to commercial districts, neighborhoods, schools, transit, recreation facilities, and other destinations. While this network exists in many places, many communities are still underserved in this way. In particular, research has found that people living in low-income communities are less likely to encounter walkways and other pedestrian-friendly features, and this lack increases their traffic risk (Gibbs et al. 2012). Implementing pedestrian infrastructure may reduce vehicular speeds and pedestrian exposure if vehicular space is reallocated and the roadway is narrowed for motorists.
A majority of pedestrian fatalities at night over the past decade occurred when the pedestrian was crossing the road (Tefft et al. 2021); however, many pedestrians are also killed when the pedestrian and driver are traveling in the same direction on the roadway. These crash types typically occur when a pedestrian is forced to walk in the roadway to reach their destination because no facilities have been provided for them. Exclusive pedestrian infrastructure physically separates people walking from vehicular travel, thereby providing safe accommodations, particularly at night. All pedestrian facilities must comply with the public right-of-way accessibility guidelines (Architectural and Transportation Barriers Compliance Board 2023).
Separated pedestrian space is still desired on low-volume and -speed roadways, but the roadway shoulder may be adequate as space for people walking in these contexts. In this scenario, a retroreflective marked edge line must be provided to indicate the separation of space between drivers and pedestrians at night.
Design considerations for pedestrian infrastructure include the following:
- Provide continuous and connected exclusive space for people walking that complies with the Public Right-of-Way Accessibility Guidelines.
- Provide sidewalks on both sides of the street, especially on arterials and major collectors in commercial districts.
- Provide pedestrian facilities to connect directly to housing complexes, schools, transit stops and stations, commercial districts, and other pedestrian trip generators.
- Consider providing pedestrian scale lighting to illuminate sidewalks, especially within commercial districts and near pedestrian generators and attractors (see the discussion of lighting earlier in this chapter).
- Provide directional curb ramps or other transitions from sidewalks to crossings or other facility types.
Putting It All Together
Pedestrian safety at night needs to be achieved through effective countermeasures that provide drivers the visual cues in darkness to detect, react, and stop for pedestrians. Research has found a higher concentration of severe pedestrian crashes at night on urban and suburban arterials, but the degree to which this is due to increased generators of night traffic on these corridors, driversʼ preferences for traveling on these corridors, or a lack of safe pedestrian infrastructure on these corridors is unclear. Regardless, higher-density areas have a higher pedestrian risk at night, so designing these roadways to account for pedestrian travel at night and factoring in the nighttime visibility constraints is essential. In addition, the research team found that lighting alone is not enough to increase pedestrian safety. Additional nighttime pedestrian countermeasures are important elements to complement lighting and overcome heightened pedestrian risk at night and, especially, to reduce vehicular speeds.
It is important to incorporate nighttime countermeasures in corridors where pedestrians have a greater risk at night. Land use and context affect the potential for people to walk at night, as more people will walk if destinations are close by. For example, in very dense urban communities, it is likely that people live within walking distance of a corner store, restaurants, parks, or schools and are, therefore, more likely to be out walking. Additionally, other elements of urban spaces—a (relatively) higher cost of owning and parking a vehicle in combination with more convenient and reliable transit service—make it more likely that individuals will live in car-free or car-lite households, thereby making walking a more necessary mode for all types of trips, no matter the time of day (Berrill et al. 2024). As communities become less dense, destinations become further apart, and walking trips become a less feasible and attractive option. Yet every community has people who, by choice or necessity, need to walk because they do not drive. Outer urban and suburban corridors are more likely to have high-speed, multilane roadways with less sidewalk coverage and pedestrian crossing infrastructure. Along these roads, pedestrians must walk on the roadway or shoulder and cross at unmarked locations if they do not want to walk even further to a signalized crossing. These high-speed, multilane roads are dangerous for pedestrians during the day, but especially at night.
This studyʼs focus group participants identified areas where they are most likely to walk at night or regularly expect people to be walking at night. These locations included transit stops and stations; colleges, especially campuses that have evening classes; schools, including those that have evening sports and activities; entertainment centers; and grocery stores. These locations aligned with the research teamʼs detailed crash analysis findings, which showed that roadways near commercial districts, convenience stores, grocery stores, liquor stores, and transit stations or stops, as well as near high-density residential areas, have a greater pedestrian risk at night.
Table 1 at the beginning of this chapter shows countermeasures for reducing pedestrian risk at night by managing vehicular speed, enhancing visibility, and reducing exposure). When implemented to the degree feasible, these countermeasures will be more effective in combination than alone. Figure 25 and Figure 26 provide scenarios of high-speed, multilane arterials for a signalized intersection and for a midblock crosswalk, respectively. These scenarios show countermeasures that will reduce pedestrian risk at night by providing appropriate pedestrian infrastructure, traffic control devices, lighting placement, and other safe roadway elements.
Safe System Roadway Design Hierarchy
FHWAʼs Safe System Roadway Design Hierarchy categorizes countermeasures into tiers that allow transportation professionals to prioritize and implement effective countermeasures for reducing fatal and severe crashes (Hopwood et al. 2024). The four tiers of the hierarchy are as follows:
- Tier 1: Remove severe conflicts.
- Tier 2: Reduce vehicle speeds.
- Tier 3: Manage conflicts in time.
- Tier 4: Increase attentiveness and awareness.
In general, Tiers 1 and 2 are considered the most effective countermeasures for removing potential conflicts, followed by Tier 3, whereas Tier 4 focuses on providing the road user with important information but will not generally address crash severity (Hopwood et al. 2024). The research for this project suggests that Tiers 1 to 3 are effective for prevention of daytime pedestrian crashes and would be most helpful if combined with Tier 4 countermeasures in darkness to increase driver awareness of pedestrians and ultimately improve pedestrian safety at night. (See the appendix for this guideʼs recommended nighttime countermeasures organized by the Safe System Roadway Design Hierarchy tiers.)
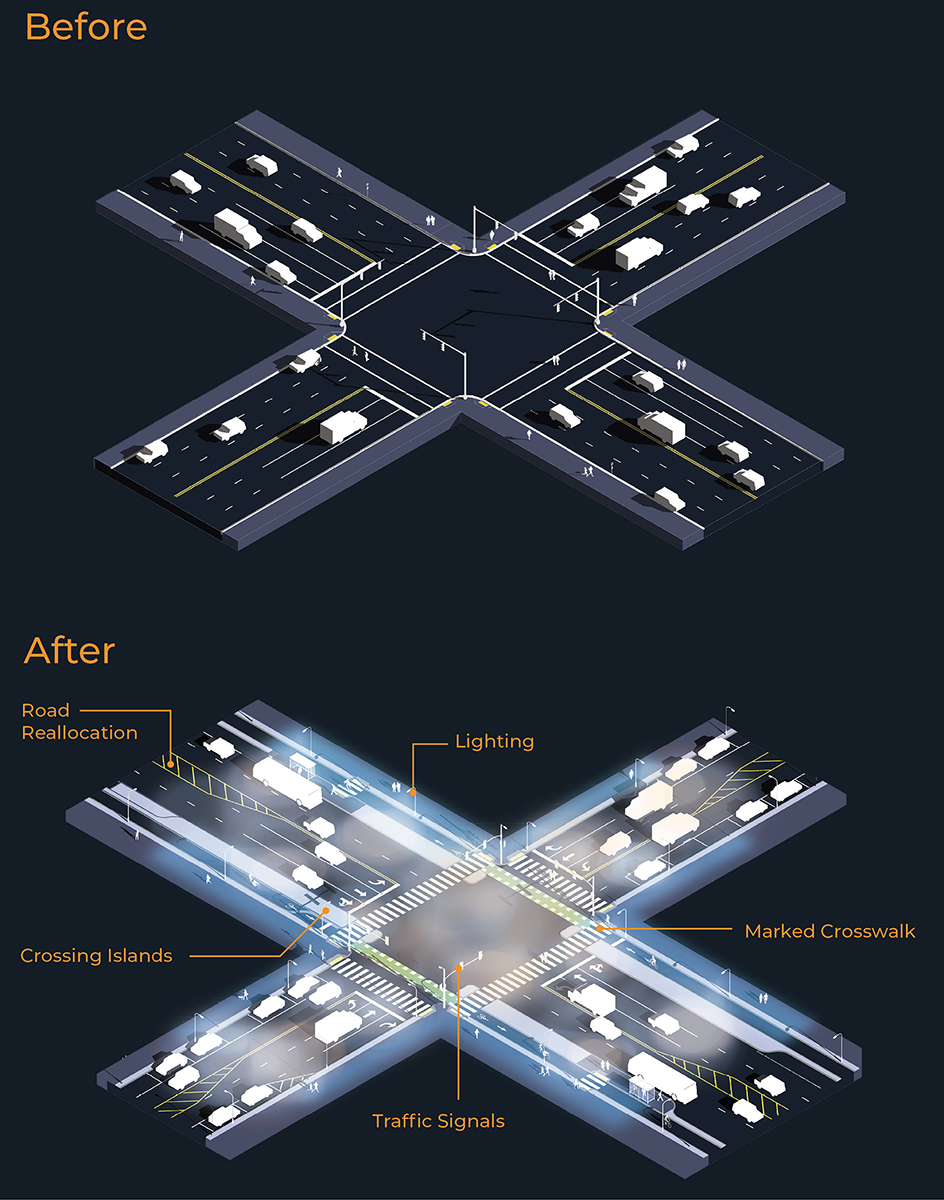
Long Description.
Illustrations of a signalized intersection before and after application of nighttime countermeasures. The "before" image shows a basic intersection with minimal lighting and road features. Vehicles are in motion along the roads. The "after" image highlights improvements including road reallocation, added lighting, marked crosswalks, crossing islands, and enhanced traffic signals.
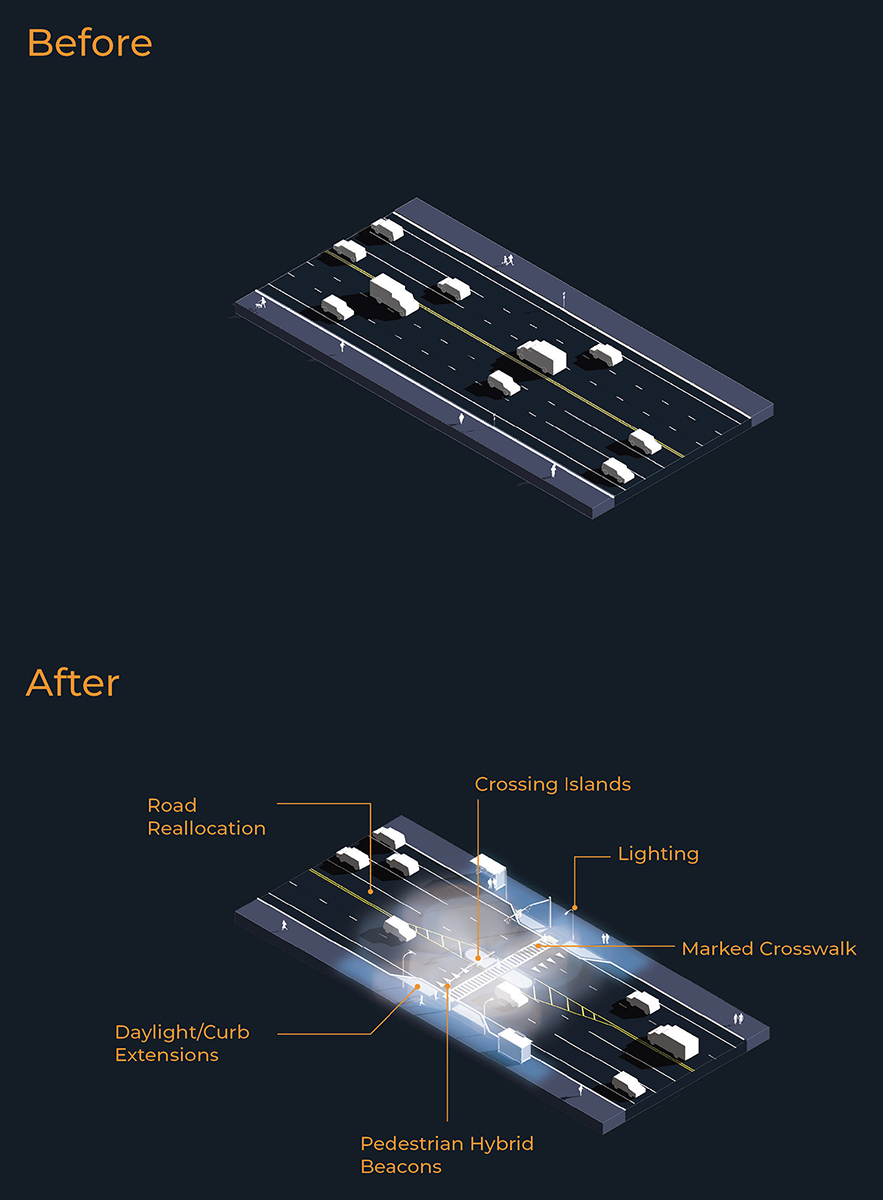
Long Description.
Illustrations of a midblock pedestrian crossing at night before and after application of nighttime countermeasures. The "before" image shows a basic road segment with vehicles but no crossing features. The "after" image illustrates several nighttime safety countermeasures, including road reallocation, crossing islands, lighting, marked crosswalks, pedestrian hybrid beacons, and daylighting or curb extensions.
Transportation Network Planning
As discussed in Chapter 2, transportation planning and engineering professionals can significantly increase pedestrian safety through the provision of robust transit service and thoughtful planning in roadway design and operations to reduce pedestrian exposure and safely accommodate pedestrians along key routes and near attractors and generators. Australia and New Zealand, two auto-oriented countries like the United States, provide a blueprint for this approach. Over the past 20 years, they have employed the Safe System Approach to meaningfully improve pedestrian safety by reducing speeds, separating pedestrians and bicyclists from motorists in time and space; and incorporating considerations in areas such as land use, economics, climate, and health into their projects. A key strategy is their Movement and Place Framework (Chiarenza et al. 2023).
The Movement and Place Framework recognizes that transportation and land use are intricately connected and reinforce one another. Therefore, lower-speed roadways that are designed so that people can access many destinations, such as downtown urban cores, work well for that purpose. Similarly, higher-speed roadways that are designed primarily for movement with no destinations, such as freeways, work well on the basis of vehicle miles traveled. As with urban arterials in the United States, however, problems arise when higher-speed roadways designed primarily for moving autos are used in areas with many destinations. In these hybrid areas, severe conflicts inevitably result as people walk, bicycle, take transit, and drive to these destinations, although the roadways are built for high-speed, through vehicular travel.
The Movement and Place Framework works to mitigate these conflicts by helping practitioners make clear, data-driven decisions about maximum speeds and roadway designs, depending on the land use context. In this framework, pedestrians and bicyclists are separated from motorists in time and space as needed, and all road users are provided with safe conditions to access their destinations. This framework is expected to be revisited as land uses change over time, so that roadways co-evolve with the land use. Furthermore, this framework is only successful if people use it faithfully. A context classification framework will not work if areas avoid safety investments. Readers can learn more about this comprehensive strategy in FHWAʼs Global Benchmarking Program: Improving Pedestrian Safety on Urban Arterials (Chiarenza et al. 2023).
Irrespective of a Movement and Place or context classification type of framework for the roadways in a jurisdiction, it is helpful to consider the impact of land use and nighttime pedestrian generators when designing roadways. To ensure pedestrian safety in areas with high amounts of pedestrian activity at night, the person walking at night needs to be the basis for decisions made regarding design, such as speeds, infrastructure, and lighting. Even in areas with low rates of walking, considerations to help those pedestrians arrive safely are critical in a Safe System.
State, local, and regional transportation plans are often most helpful if they include policies directly aimed at enhancing pedestrian safety at night, especially in areas where pedestrian travel at night is expected, encouraged, or necessitated due to incomplete networks, to cement this practice in policy. Additional policy resources include the following:
- Safe System Policy-Based Alignment Framework (FHWA 2024d),
- Vision Zero Toolkit (FHWA 2024f), and
- The Complete Streets Policy Framework (Smart Growth America and National Complete Streets Coalition n.d.).


