Strategies to Improve Pedestrian Safety at Night: A Guide (2025)
Chapter: 1 Introduction

CHAPTER 1
Introduction
Supporting walking activity (including the use of mobility devices such as wheelchairs) is important in a healthy, sustainable transportation system. Humans evolved to walk as their primary mode, and walking is positively associated with satisfaction and mental wellbeing (Kelly et al. 2018) and physical health (Lee and Buchner 2008), in addition to having few downsides other than distance limitations. At the community level, increased walking is associated with increased social cohesion, opportunity, health, and environmental quality (Zhu et al. 2013). Additionally, an estimated 30% of people in the United States cannot drive due to age, disability, or lack of resources (Hedges and Company 2024; U.S. Census Bureau 2022), and must depend on walking, bicycling, public transit, or othersʼ willingness to drive them in order to travel.
Yet walking is too often inaccessible, uncomfortable, or unsafe as a practical option for large numbers of people because of traffic risk, discomfort, or inconvenience. This is the result of decades of auto-centric planning and engineering in the United States that has encouraged sprawl and prioritized motorist throughput and speed over pedestrian access and safety. The main elements of this approach—multilane roadways, higher design and posted speeds, and a lack of safe and convenient pedestrian walking and crossing facilities and operations, even at known attractors such as bus stops and grocery stores—are consistently associated with pedestrian fatalities in the United States (Sanders et al. 2022, 2025; Ferenchak and Abadi 2021; Dumbaugh et al. 2023).
Walking is too often inaccessible, uncomfortable, or unsafe as a practical option for large numbers of people because of traffic risk, discomfort, or inconvenience.
Despite decades of improvements to vehicle occupant safety in the United States during the late 20th century, the United States has the highest number of traffic fatalities per capita of any similarly developed nation (World Health Organization 2024). Yet, for people walking, safety outcomes are far worse: even in 2009, when U.S. pedestrian fatalities hit a 30-year low, the United States experienced far more pedestrian fatalities per capita than similarly developed nations (Buehler and Pucher 2017). Pedestrian fatalities in the United States increased sharply in recent years—by 83% from 2009 to 2022—while fatalities in other countries have fallen (NCSA 2024b).
This guide defines darkness as ambient dark conditions, with or without artificial lighting.
This differential between U.S. safety outcomes for pedestrians and motorists compared with those of peer nations is significantly associated with the auto-centric roadway design standards and policies in the United States that prioritize motorist convenience and throughput. Far too often, the result is roadways designed for vehicular speeds that result in kinetic energy risk unsafe for anyone outside of a vehicle. Yet the sharp increase in pedestrian fatalities since 2009—a time during which U.S. roadway design standards and policies increasingly prioritized pedestrian safety—suggests that other factors have interacted with these baseline conditions to substantially contribute to increased pedestrian risk. Furthermore, the risk of pedestrian fatality appears to have increased specifically in darkness (defined here as ambient dark conditions, with or without artificial lighting). Seventy-six percent of pedestrian fatalities from 2018 to 2022 occurred in darkness (including both lit and unlit conditions), compared with 63% during the period

Source: Fatality Analysis Reporting System (FARS).
Long Description.
A line graph shows data on U. S. pedestrian fatalities. The horizontal axis shows the years from 1993 to 2022 in increments of 1. The vertical axis shows pedestrian fatalities from 0 to 6,000 in increments of 100. The graph shows two trend lines: one rising line labeled "Nighttime" and a lower, flatter line labeled "Daytime," both tracking pedestrian fatalities over time. The line for Nighttime begins at 62 percent and reaches 77 percent. The line for Daytime begins at 33 percent and ends at 19 percent.
from 1993 to 1997, and nearly 90% of the increase in pedestrian fatalities since 2009 occurred in darkness (Figure 1) (Hu and Cicchino 2018; Retting 2020; Ferenchak and Abadi 2021; Tefft et al. 2021).
Understanding the Rise in Pedestrian Fatalities at Night
Researchers are still investigating the many factors associated with this increase in pedestrian fatalities, specifically in darkness, but the emerging understanding is one of a confluence of factors. FHWAʼs Safe System Project Alignment Framework (2024e) is useful for organizing the main elements of risk that comprise this convergence:
- Exposure: the presence or potential presence of someone to be involved in a crash and the length of time they are exposed,
- Likelihood: elements that affect the probability of crash occurrence, and
- Severity: factors that affect the potential for a severe outcome.
76% of fatalities occur in darkness.
—FARS, 2018–2022
In the past 15 years, several influential trends have begun or increased that have contributed in varying degrees to increasing pedestriansʼ exposure to risk, increasing the likelihood of that risk, or increasing the severity of that risk—particularly in what were already higher-risk environments for people walking (Figure 2). In terms of increased pedestrian exposure, studies have found a link between pedestrian fatalities and factors such as the following:
- Location, particularly areas outside of downtowns with lower-income, minority populations (Rodriguez and Ferenchak 2024)—a trend some have called the “suburbanization of poverty”;
- Increased visible houselessness (FHWA 2024b); and
- Increased substance use (Sanders et al. 2025).
In terms of the likelihood of risk, there have been increases in
- Speeding and aggressive driving, particularly during and since the COVID-19 pandemic (Tefft 2024; Tefft et al. 2022);
- Impaired driving (Sanders et al. 2025; Tefft 2024);
- Distracted driving (Cambridge Mobile Telematics 2023); and
- Vehicle risk including taller hood heights and boxier hood designs (IIHS 2023).
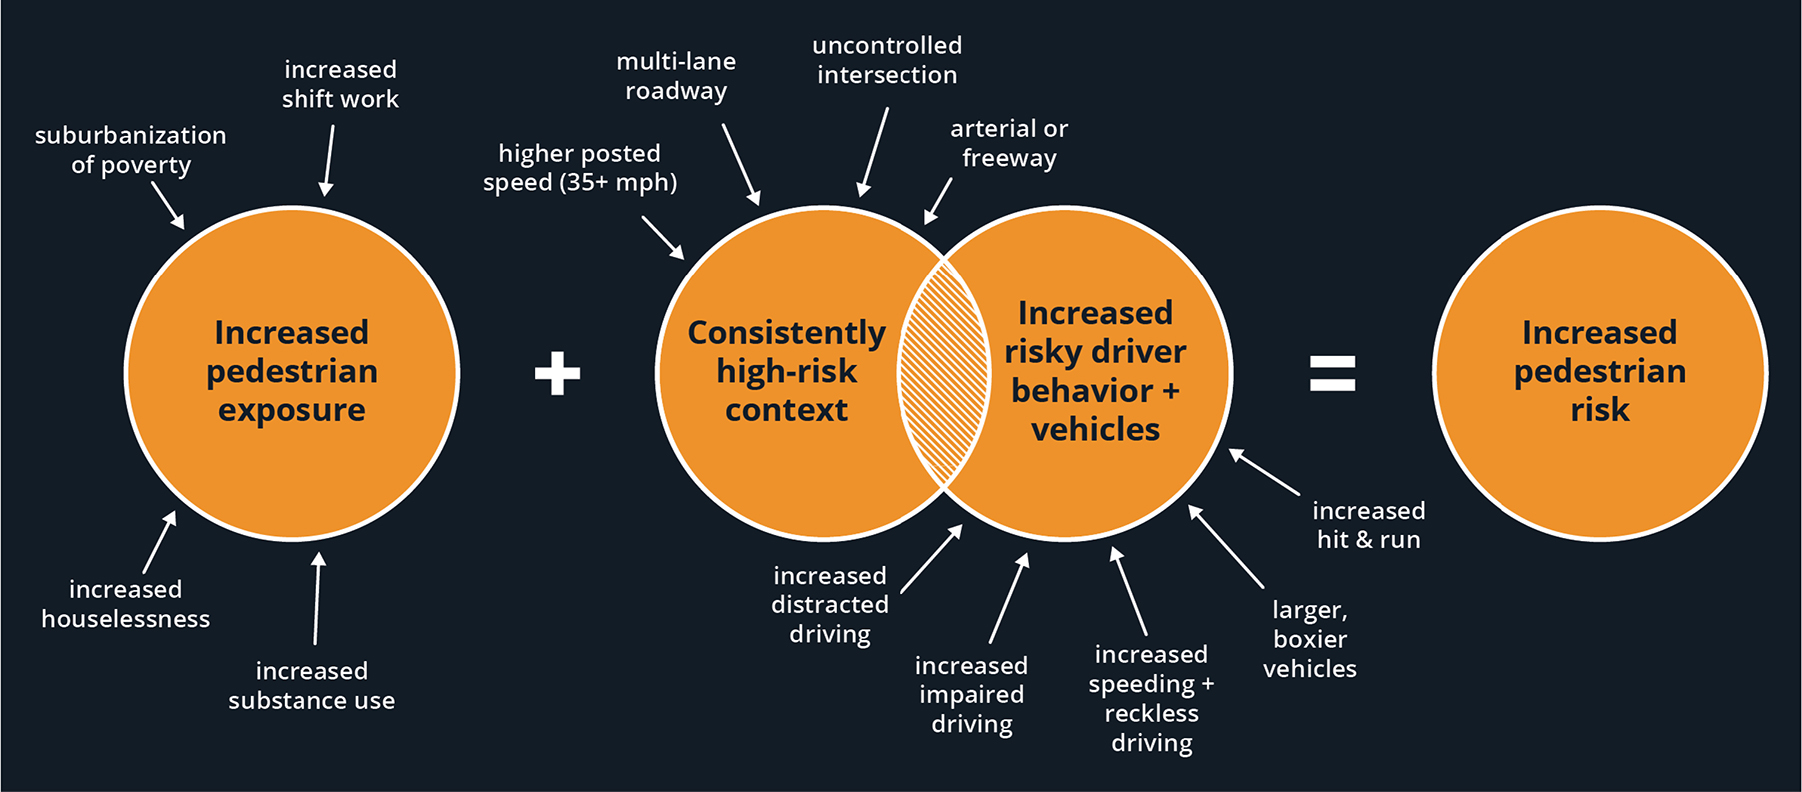
Source: Safe Streets Research and Consulting.
Long Description.
The illustration consists of three components in the form of an equation: Component 1, “Increased pedestrian exposure” plus Component 2, “Consistently high-risk context” in combination with “Increased risky driver behavior plus vehicles” equals Component 3, “Increased pedestrian risk.” Component 1 is a circle labeled “Increased pedestrian exposure.” Surrounding this circle are the words “increased shift work,” “suburbanization of poverty,” “increased houselessness,” and “increased substance use,” each pointing to the circle with an arrow. Component 2 consists of a Venn diagram with two circles. The first circle is “Consistently high-risk context.” Pointing to it are the words “higher posted speed (35 plus miles per hour),” “multi-lane roadway,” “uncontrolled intersection,” and “arterial or freeway.” The second circle is “Increased risky driver behavior plus vehicles.” Pointing to it are the words “increased distracted driving,” “increased impaired driving,” “increased speeding plus reckless driving,” “larger and boxier vehicles,” and “increased hit and run.” Components 1 and 2 together lead to Component 3, a circle labeled “Increased pedestrian risk.”
Additional study of some of these factors may be needed to understand the magnitude of their relationships to pedestrian fatalities at night, and there may be other influential factors not captured in Figure 2. For example, while the research team did not find studies that directly examined pedestrian fatalities and increasing shift work or drowsy driving, both are plausible avenues, given the inherent risk of nighttime travel. At least one study found an association between the introduction of rideshare companies and an increase in pedestrian fatalities in cities (Barrios et al. 2020).
The aforementioned exposure and likelihood elements interact to increase the potential for a severe outcome within the context of a system that prioritizes driver speed and throughput—especially in darkness, when many of these factors are more prevalent, yet drivers cannot see as well or as far. This combination manifests in the reality that pedestrian fatalities, particularly in darkness, predominantly occur on roadways with at least one of the following characteristics: posted speed limits of 35 miles per hour (mph) or more, multiple lanes, arterial or freeway classification, and uncontrolled intersections (Sanders et al. 2025; Tefft et al. 2021; Sanders et al. 2022).
Missing or disconnected infrastructure creates barriers to safe and convenient walking and is often concentrated in neighborhoods where a majority of residents have low incomes or are Black, Indigenous, and people of color (BIPOC), or both. These neighborhoods also often have fewer travel options, so residents are exposed to more hazardous conditions while traveling (Taylor et al. 2023), as is evidenced in the greater association of these neighborhoods with pedestrian fatality hotspots (Schneider et al. 2021). These conditions can force a choice between mobility and safety for residents.
There are many actions that transportation practitioners can take in the shorter term to address transportation risk while other, longer-term programs work to address complex issues related to exposure and likelihood, such as houselessness, poverty, and substance use. First, practitioners can address darkness and its negative impact on visibility as a primary barrier to nighttime traffic safety. Humans receive approximately 90% of information visually (Sivak 1996)—a process that is substantially hindered in darkness. At lower speeds, drivers may still have enough time to slow and avoid a crash, despite the longer detection–reaction time needed due to limited visibility in darkness. On a higher-speed roadway, however, driversʼ ability to stop is significantly impaired by the reduced detection–reaction time in darkness, while their kinetic energy is simultaneously increased by the higher speed. The significant impact of darkness on driversʼ detection–reaction time, which is the total time needed for drivers to see (detect) pedestrians and yield, stop, or
Darkness is an impairment to a driverʼs ability to detect pedestrians and react in time to avoid a collision, particularly at higher speeds.
evade (react) in time to prevent a crash, is a type of impairment that is important for the transportation profession to consider—particularly where pedestrians are expected, encouraged, or functionally required to travel owing to adjacent land uses or route availability. Note: The word “impairment” is used intentionally here to help practitioners understand how harmful darkness is to a driverʼs ability to detect pedestrians and react in time to avoid a collision, particularly at higher speeds.
The addition and evolution of vehicle headlights and streetlights over time are examples of efforts to address darkness impairment. However, headlights and streetlights have tended to fall particularly short at higher speeds, for several reasons related to detection–reaction time. In terms of detection time, drivers tend to focus directly in front of the vehicle, where their head beams shine (Olson et al. 1989), and thus may miss pedestrians approaching from the side, even in lit conditions. Additionally, humans cannot take in as much peripheral information in darkness or at higher speeds as they can in daylight or at lower speeds, and this interferes with their ability to detect pedestrians, even when roadway lighting is used. High-speed environments also communicate modal priority via their design: drivers are more important than pedestrians, and driver expectation for pedestrians walking along or crossing these roadways is therefore reduced. Given that motorists operating at higher speeds require longer distances to stop, they correspondingly require more reaction time to be able to stop a vehicle before a potential conflict, and this increase in necessary reaction time can diminish the effectiveness of provided lighting. Thus, while roadway lighting is an important countermeasure, lighting cannot completely offset the risk of traveling at night at higher speeds. Speed management, including supporting roadway design, is essential to pedestrian safety.
Creating a Safe System
The magnitude and complexity of the increase in pedestrian fatalities shows how a holistic and comprehensive approach to an integrated set of solutions would be helpful. To meet this challenge, this research project and guide are organized around the Safe System Approach (FHWA 2024g), which offers a vision to eliminate deaths and serious injuries on U.S. roadways, and the Safe System Pyramid (Ederer et al. 2023), which infuses the Safe System Approach with a public health lens to shape actions and strategies.
The Safe System Approach (Figure 3) is based on six key principles related to traffic safety:
- Death and serious injury are unacceptable.
- Humans make mistakes.
- Humans are vulnerable.
- Responsibility is shared.
- Safety is proactive.
- Redundancy is crucial.
These principles are woven into the following five pillars of the Safe System Approach (adapted from Doctor and Ngo 2022) and noted throughout this guide:
 Safe road users behave safely and predictably to the best of their ability on the roadway, supported by roadway operations, design, and policy that recognizes that humans are vulnerable and make mistakes.
 Safe vehicles are designed and regulated with safety measures that use the latest technology and design to mitigate both crash risk and injury severity in the event of a crash.
 Safepeeds give drivers more time to detect and react in time to avoid a crash, improve visibility, and reduce the injury severity of crashes when they do occur. Safe speeds are critical to eliminating severe injuries.
 Safe roads are designed to mitigate crash risk by physically or temporally separating users and alerting users to hazards or pattern changes. If a driver makes a mistake that leads to a crash, the safe roadway features lead to reduced injury severity.
 Post-crash care includes elements that help to mitigate injury severity after a crash occurs as well as to inform practitioners about risk factors so that they can implement proactive, systemic measures to mitigate future risk.

Source: FHWA 2024g.
Long Description.
A circular illustration explains the Safe System Approach. The center of the circle reads "Safe System Approach." The circle is divided into five sections: Safe Road Users, Safe Vehicles, Safe Speeds, Safe Roads, and Post-Crash Care. The text around the circle reads as follows: Death or serious injury is unacceptable. Humans make mistakes. Humans are vulnerable. Responsibility is shared. Safety is proactive. Redundancy is crucial.
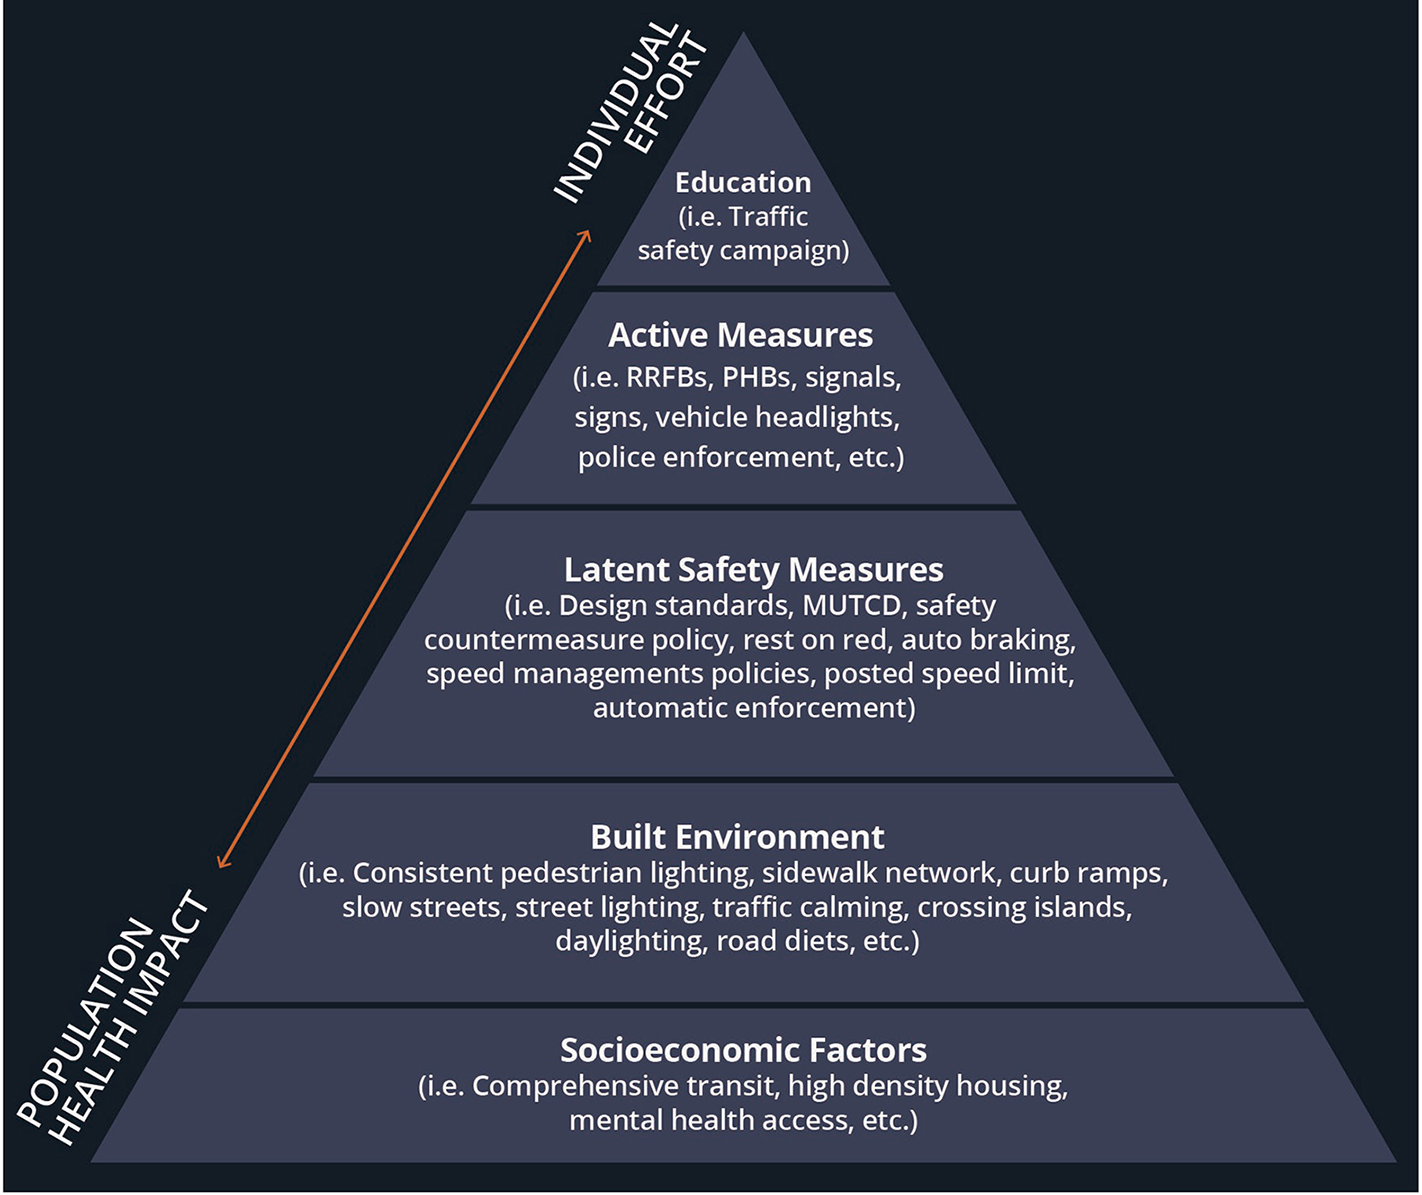
Note: RRFB = rectangular rapid flashing beacon; PHB = pedestrian hybrid beacon; MUTCD = Manual on Uniform Traffic Control Devices.
Source: Adapted from Ederer et al. 2023.
Long Description.
An illustration shows the Safe System Pyramid for pedestrian safety at night. The pyramid consists of five tiers with text. The text given in the pyramid from bottom tier to the top is as follows: Tier 1, the base of the pyramid, is Socioeconomic Factors, that is, comprehensive transit, high-density housing, mental health access, etc. Tier 2 is the Built Environment, that is, consistent pedestrian lighting, sidewalk network, curb ramps, slow streets, street lighting, traffic calming, crossing islands, daylights, road diets, etc. Tier 3 is Latent Safety Measures, that is, design standards, MUTCD, safety countermeasure policy, rest on red, auto braking, speed management policies, posted speed limit, automatic enforcement. Tier 2 is Active Measures, that is, rectangular rapid flashing beacons, pedestrian hybrid beacons, signals, signs, vehicle headlights, police enforcement, etc. Tier 1, the top of the pyramid, is Education, that is, traffic safety campaign. Along the left side of the pyramid, a continuum is shown with the words “Population Health Impact” at the base and the words “Individual Effort” at the top and a double-sided arrow between these labels.
Figure 4 shows the Safe System Pyramid adapted for pedestrian safety at night; each level of the pyramid includes potential strategies based on the breadth of the impact on the population (Ederer et al. 2023). Each level of the pyramid may have strategies within each of the Safe System pillars. For example, safe roadways are designed and built by transportation agencies and have a broad impact, affecting all users traveling along that roadway—they are near the bottom of the pyramid as part of the “built environment.” Traffic signals and signs that are used to control user movements in specific locations are examples of “active measures” within the safe roads and safe speeds pillars. In contrast, driver education programs target road users at an individual level and are thus actions at the top of the pyramid in the safe road users pillar.
The bottom level of the pyramid, which includes exposure and likelihood factors, such as houselessness and substance use, is beyond the purview of this guide. However, this guide can help transportation practitioners mitigate the potential for a severe outcome through addressing risk related to roadway design and operations as part of a Safe System Approach (FHWA 2024g). Figure 5 shows an example of the Safe System Approach in practice.
Using This Guide
This guide primarily focuses on how to improve pedestrian safety at night through the provision of safe roadways operating at safe speeds. In addition to addressing roadway design and operations, the guide briefly covers factors beyond the roadway (i.e., the other pillars of the

Long Description.
An illustration demonstrates the Safe System Approach in an urban environment. The illustration shows a woman crossing a road through a crosswalk from a building on one side of the road to a building on the other side of it. Her path is marked by a dotted line. A car is at a junction, placed before the stop sign and crosswalk. The illustration also includes a speed feedback sign, leading pedestrian intervals, narrow roadways, and high-visibility sidewalks. Pedestrians, vehicles, and buildings are connected by a dotted orange line indicating system integration. To the right these safety measures are listed under the header “Safe System Approach in Practice.” They are Speed feedback signs; Stop signs; Leading pedestrian intervals; Narrow Roadways, high-visibility sidewalks, crossings; and Affordable housing near transit or job centers.
Safe System Approach) and areas of coordination at the local, regional, state, and federal levels. Traffic safety culture and other important aspects of pedestrian safety related to the Safe System Pyramid are also discussed at a high level. The remainder of this guide is organized as follows:
- Chapter 2, “The Human Factor,” covers safe roadway users, the core mechanism for injury severity, and how various aspects of the transportation system work together to influence roadway user behavior. This chapter also describes characteristics of the victims of the pedestrian fatality crisis, roadway user behaviors associated with fatal pedestrian crashes in darkness, and important context for understanding how the crisis affects different sociodemographic groups.
- Chapter 3, “Safe Roadway Design,” covers the safe roads and safe speeds pillars of the Safe System Approach and is the heart of this guide. The chapter provides an understanding of how speed and roadway design interact and elaborates on proven and promising countermeasure options to help turn the tide toward pedestrian safety in darkness.
- Chapter 4, “Beyond Roadway Design,” covers the safe vehicles and post-crash care pillars of the Safe System Approach. While major direct action in these two areas is beyond the purview of most transportation engineers and planners, this chapter covers high-level strategies and actions that practitioners can take to help mitigate the harms associated with these pillars.
- Chapter 5, “Looking Forward: New Standards to Meet Todayʼs Safety Challenges,” summarizes key points from the prior chapters and discusses new design standards to support efforts to dramatically improve pedestrian safety at night.
References; a list of acronyms and abbreviations used in the report; and an appendix, “Nighttime Countermeasures by the Safe System Roadway Design Hierarchy,” complete the report.


