Evaluating Traffic Safety Campaigns: A Guide (2025)
Chapter: 4 Media Metrics and Other Analytics

CHAPTER 4
Media Metrics and Other Analytics
Relying on metrics typically collected by companies that disseminate messages and materials is another method for evaluating the performance of traffic safety messaging campaigns. These metrics can be used for formative, process, and outcome evaluation. Applying these metrics often begins before the campaign is launched, with the establishment of campaign goals and objectives, defining the audiences for the campaigns, and identifying channels to reach them. This sets up which key performance indicators (KPIs) will be used to evaluate the performance of the campaign as the campaign is being implemented, and afterward to measure its impact. The following sections describe the steps necessary to implement and evaluate various media channels as part of a traffic safety messaging and communication campaign, including social media, radio, television, out-of-home media, and digital media. They provide an overview for effectively planning, implementing, monitoring, and evaluating these various channels in their effectiveness for targeting and reaching priority audience segments. Steps will include researching effective and efficient media channels for the target audiences, using these channels to deliver traffic safety messaging and communication campaign materials, monitoring campaign performance metrics and optimizing the campaign throughout, and conducting post-campaign evaluation and analysis. The quick reference guide for using the media metrics costing tool is available in BTSCRP Web-Only Document 7.
Appendix A, Tab 3, Media Metrics Costing Tool (Exhibit 4.1) estimates the labor hours for personnel for each of the following steps described below that relate to media planning and communication campaign plan development, implementation, performance analysis, and reporting. Additionally, the tab also includes ODCs beyond labor that may be needed to fulfill each task. This includes estimated costs for pre-campaign messaging research and analysis services. It also includes costs associated with implementing a campaign, including ad buys and media monitoring tools, which can be used to increase the reach and effectiveness of media buys throughout the campaign. The selection of tools and ad buys will depend on the available budget.
Long Description.
Staffing
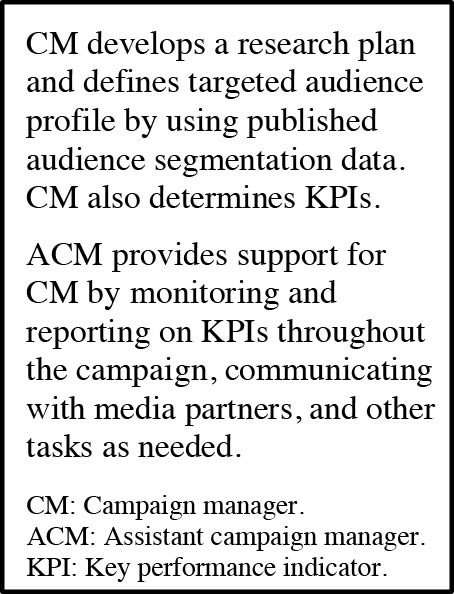
As described in Exhibit 4.2, deploying an effective traffic safety messaging campaign requires at least two key team members: the campaign manager (CM) and assistant campaign manager (ACM).
Long Description.
The data given in the table row-wise are as follows: Row 1: CM develops a research plan and defines a targeted audience profile by using published audience segmentation data. CM also determines KPIs. Row 2: ACM provides support for CM by monitoring and reporting on KPI throughout the campaign, communicating with media partners, and other tasks as needed.
Ideally, the CM should have the following:
- At least 3 years of experience in implementing and evaluating multi-channel health promotion or traffic safety campaigns.
- Expertise in digital ad creation, monitoring, and optimization (Facebook, Google, etc.).
- Expertise and connections in working with other partners to promote messaging, like news media, celebrities, influencers, radio, and local organizations.
- Connections with various media resources, where needed, like graphic designers.
Ideally, the ACM should have the following:
- Approximately 1 year of experience in monitoring and supporting evaluation of health promotion or traffic safety campaigns.
- Familiarity with creating and monitoring ad buys on Facebook, Google, and so forth, and experience in digital and other forms of media.
The responsibilities for each role are as follows:
- The CM identifies and analyzes overarching campaign objectives and reviews marketing and advertising goals based on available market data.
- The CM is responsible for reviewing objectives and goals throughout the media planning and advertising placement process. The ongoing process is instrumental in optimizing the following:
- Number of people the campaign reaches, and awareness of the campaign among the target population.
- Advertising message recall and engagement among the campaignʼs target audiences.
- Web traffic to SHSOsʼ designated web pages and sources where targeted audiences can learn more.
- The ACM assists with logistics and presents insights and determinations around important KPIs during the campaign.
- The ACM is also responsible for supporting the team member(s) in research development, data analysis, and reporting. The ACM assists in scheduling meetings and key campaign milestone check-ins, notetaking, keeping track of the campaign timeline, and sharing those updates with the CM and other stakeholders.
These bullet items describe the ideal experience, expertise, and skills that each team member should have to understand and manage the campaign evaluation. If the CM and ACM do not have all this experience or knowledge, they should plan to rely a bit more on market research and dissemination partners. More information is provided in Step 3c.
Type of Metrics
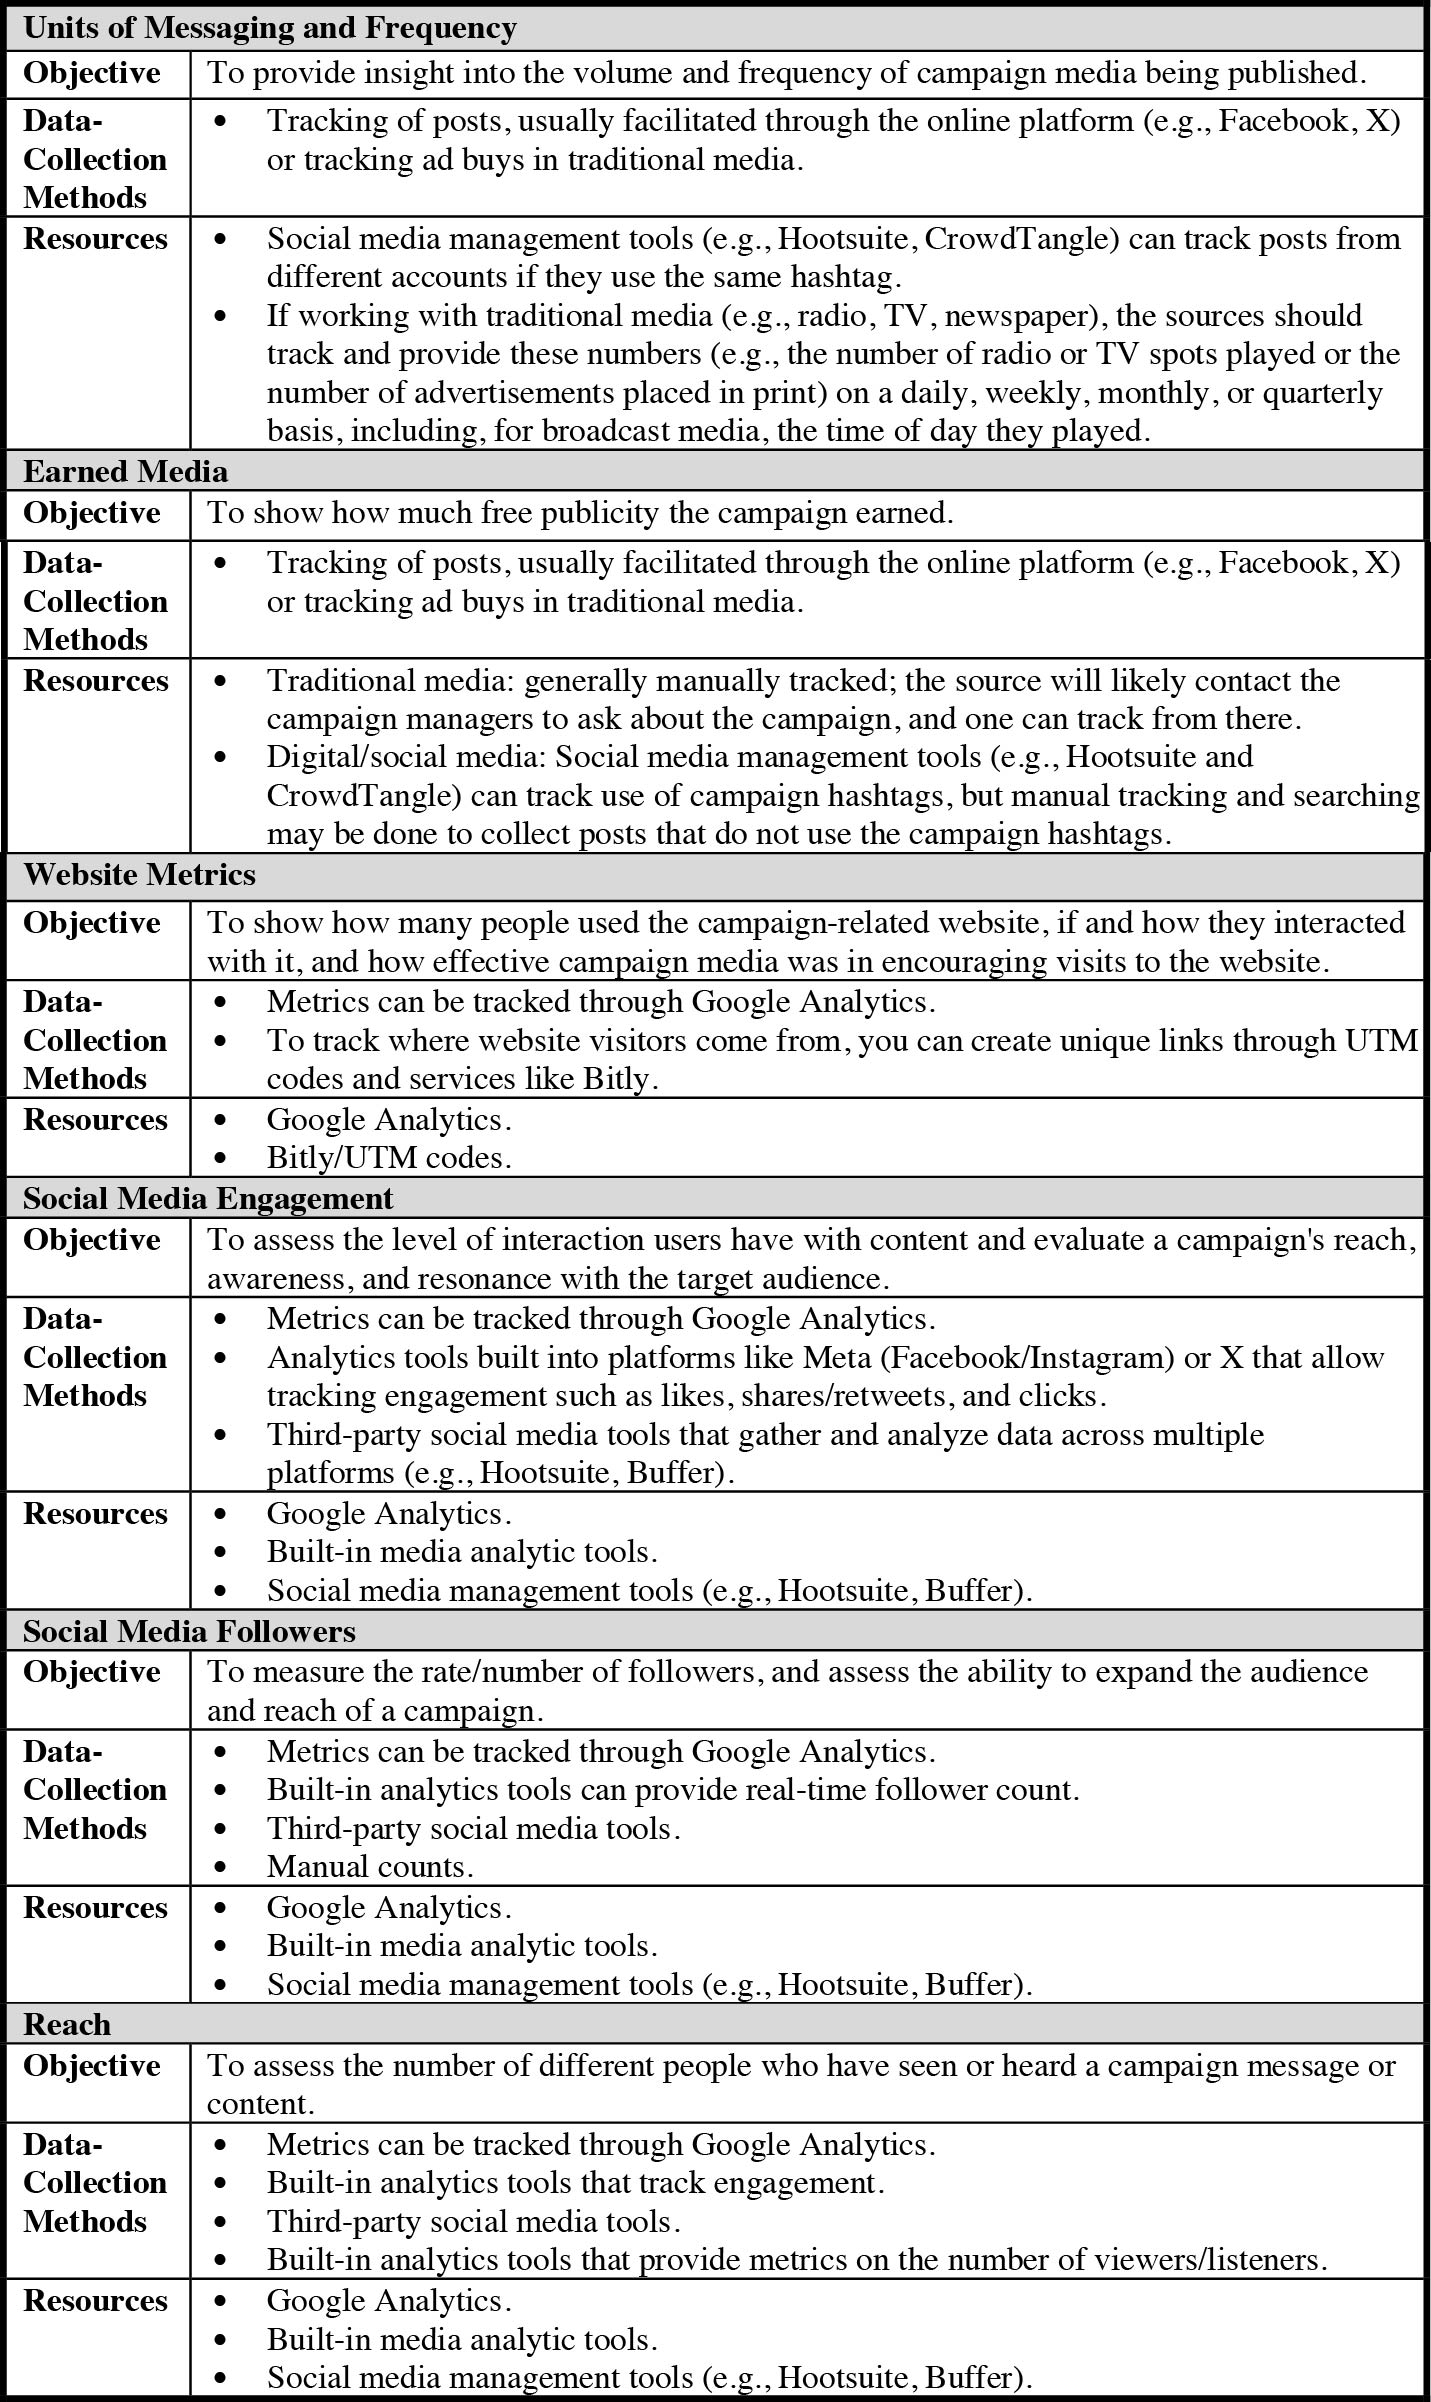
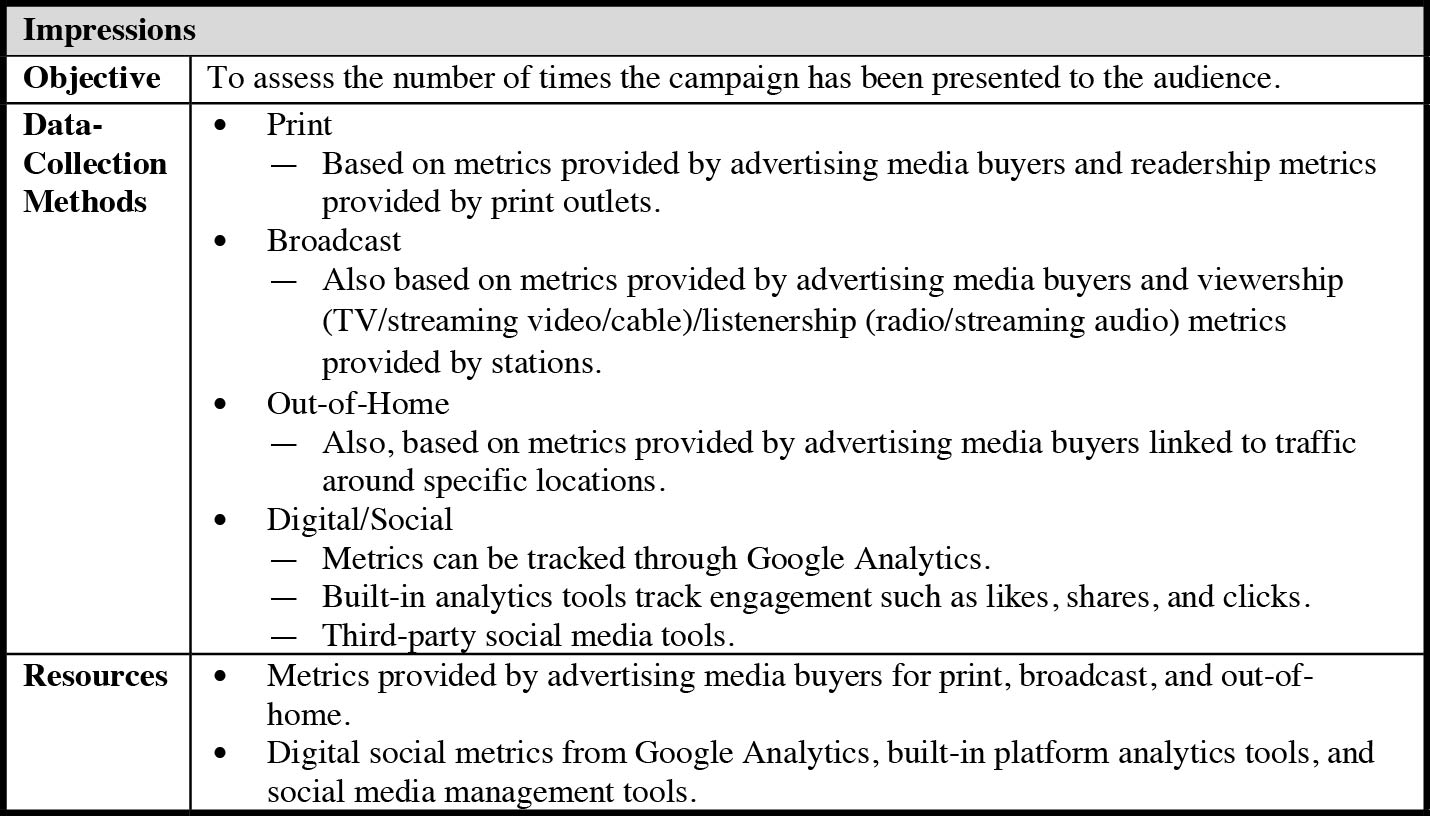
Exhibit 4.3 provides an overview of various media metrics that are important for evaluating campaign effectiveness. The exhibit is tailored to specific aspects of campaign analysis, including the units and frequency of messaging, earned media, website metrics, social media engagement, social media followers, reach, and impressions. These metrics can be gathered through a combination of tracking mechanisms and analytical tools. Using a range of data-collection methods—from social media management tools like Hootsuite and CrowdTangle to traditional tracking and Google Analytics—these metrics offer actionable insights into the volume, visibility, and impact of media efforts across platforms. When selecting KPIs for ongoing monitoring, it is essential to align them with the campaignʼs specific goals and objectives. KPIs should be chosen based on their relevance to desired outcomes, their measurability, and their ability to provide actionable insights. Regular review and adjustment of KPIs ensure they remain aligned with evolving campaign dynamics and strategic priorities.
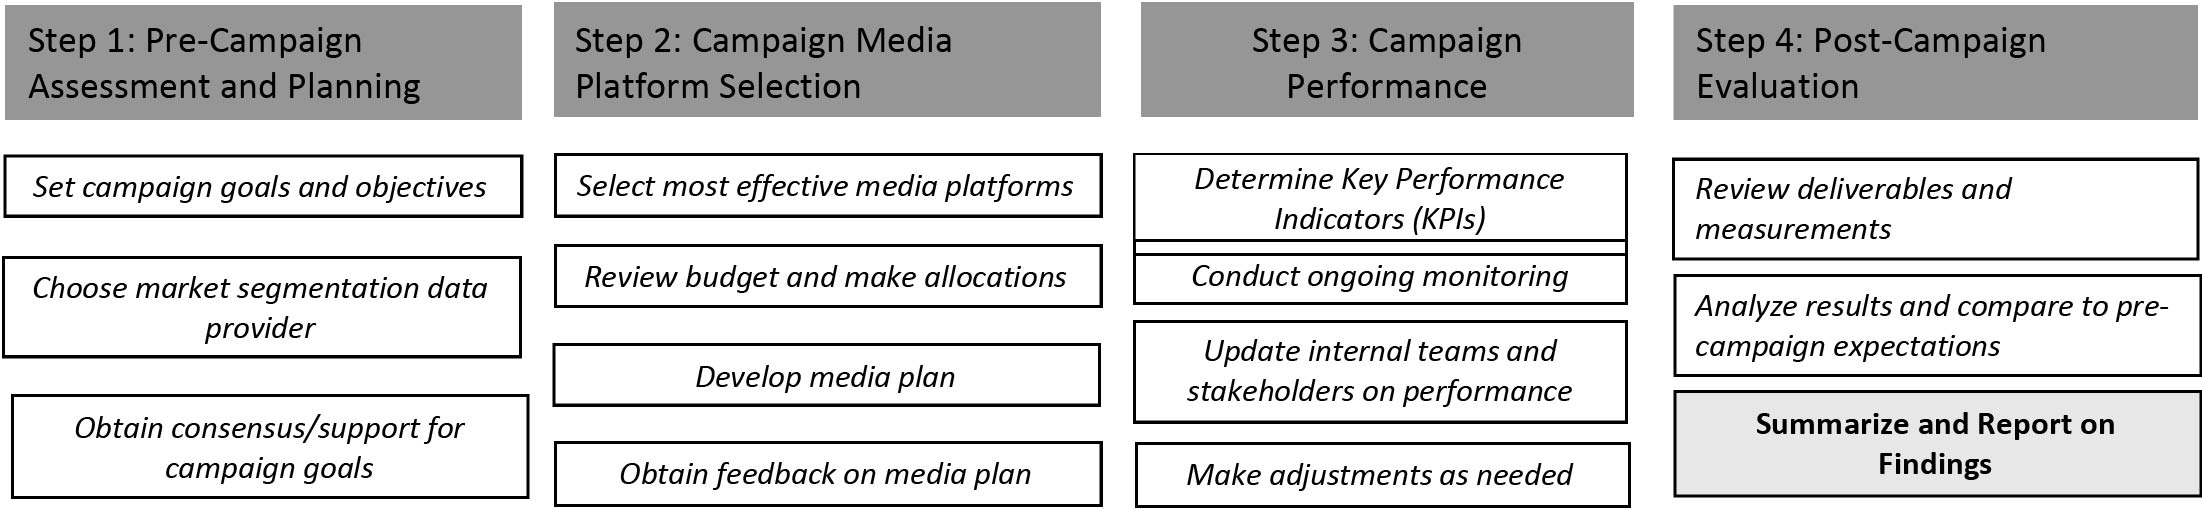
Exhibit 4.4 displays the steps involved in using media metrics to monitor and evaluate traffic safety messaging campaigns.
Step 1: Pre-Campaign Assessment and Planning
- Set campaign goals and objectives based on crash/citation data. Reviewing crash/citation data allows the team to identify the risky behaviors to target and the demographic characteristics
(continued on next page)
Long Description.
Each row has sub-rows. The data given in the table row-wise are as follows: Row 1: Units of Messaging or Frequency: Objective: To provide insight on the volume and frequency of campaign media being published; Data Collection Methods; Tracking of posts, usually facilitated through the online platform (e.g., Facebook, Twitter) or tracking ad buys in traditional media; Resources: Social media management tools (e.g., Hootsuite, CrowdTangle) and can track posts from different accounts if they use the same hashtag; If working with traditional media (e.g., Radio, T V, newspaper), the sources should track and provide these numbers, for instance, the number of radio or TV spots played or the number of advertisements placed on in print on a daily, weekly, monthly or quarterly basis, including, for broadcast media, the time of day they played. Row 2: Earned Media: Objective: Shows how much free publicity the campaign earned; Data Collection Methods: Tracking of posts, usually facilitated through the online platform (e.g., Facebook, Twitter) or tracking ad buys in traditional media; Resources: Traditional media: generally manually tracked; the source will likely contact the campaign managers to ask about the campaign and one can track from there; Digital or social media: Social media management tools (e.g., Hootsuite and CrowdTangle) can track use of campaign hashtags, but manual tracking and searching may be done to collect posts that do not use the campaign hashtags. Row 3: Website Metrics: Objective: Shows how many people used the campaign-related website, if and how they interacted with it; how effective campaign media was in encouraging visits the website; Data Collection Methods: Metrics can be tracked through Google Analytics; To track where website visitors come from, you can create unique links through UTM codes and services like Bitly; Resources: Google Analytics; Bitly or UTM codes. Row 4: Social Media Engagement: Objective: Assess the level of interaction users have with content and evaluate a campaign's reach, awareness, and resonance with the target audience; Data Collection Methods: Metrics can be tracked through Google Analytics; Analytics tools built-in to platforms like Meta (Facebook or Instagram) or X or Twitter that allow tracking engagement such as likes, shares or re-tweets, and clicks; Third-party social media tools that gather and analyze data across multiple platforms (e.g., Hootsuite, Buffer); Resources: Google Analytics; Built-in media analytic tools; Social media management tools (e.g., Hootsuite, Buffer). Row 5: Social Media Followers: Objective: Measure the rate or number of followers; assess the ability to expand audience and reach of a campaign; Data Collection Methods: Metrics can be tracked through Google Analytics; Built-in analytics tools can provide real-time follower count; Third-party social media tools; Manual counts. Row 6: Social Media Followers, Continued: Resources: Google Analytics; Built-in media analytic tools; Social media management tools (e.g., Hootsuite, Buffer). Row 7: Reach: Objective; Assess the number of different people who have seen or heard a campaign message or content; Data Collection Methods: Metrics can be tracked through Google Analytics; Built-in analytics tools that track engagement; Third-party social media tools; Built-in analytics tools that provide metrics on number of viewers or listeners; Resources: Google Analytics; Built-in media analytic tools; Social media management tools (e.g., Hootsuite, Buffer). Row 8: Impressions: Objective: Assess the number of times the campaign has been presented to audience; Data Collection Methods: Print: Based on metrics provided by advertising media buyers and readership metrics provided by print outlets; Broadcast: Also based on metrics provided by advertising media buyers and viewership (T V or Streaming Video or Cable)or listenership (Radio or Streaming Audio) metrics provided by stations; Out-of-Home: Also based on metrics provided by advertising media buyers linked to traffic around specific locations; Digital or Social: Metrics can be tracked through Google Analytics; Built-in analytics tools tracking engagement such as likes, shares, and clicks; Third-party social media tools; Resources: Metrics provided by advertising media buyers for print, broadcast and out-of-home; Digital social metrics from Google Analytics, built-in platform analytic tools, and social media management tools.
Long Description.
Step 1 is pre-campaign assessment and planning. Step 2 is campaign media platform selection. Step 3 is campaign performance. Step 4 is post-campaign evaluation.

Long Description.
The data given in the table are as follows: These steps enable the CM to understand the overall impact of the campaign in their designated market area, based on available FY budgets, total size of population, and audience reach and engagement goals.
- of those most affected by that behavior, which in turn will begin to define the audience that needs to be reached. Exhibit 4.5 highlights the importance of this step. However, to reach that audience, it is important to first learn more about them, including both what media they consume and what motivates them. To gather this information and to understand if the campaign is ultimately reaching the audience via the selected media, it is important to identify relevant market segmentation data and best campaign performance tools that ensure the feasibility of achieving campaign goals.
Goals may include the following:
- Maximizing the number of people within the targeted audience segments that the campaign aims to reach over a period of time (reach).
- Maximizing how frequently the campaign is seen or heard (impressions).
- Creating certain audience engagements (liking, commenting, sharing, etc.).
- Generating other specific results (website visits, document downloads, registering to receive newsletters, registering for traffic safety classes, etc.).
- Choose a market segmentation data provider. Analysis of market segmentation data can guide the CM and ACM throughout the planning, ad placement, and post-media buy performance reporting process. Market segmentation data is commonly purchased from market research providers (see Exhibit 4.6). It is recommended that the CM use widely known audience research providers that feature national and local market data points. Broadly known market
- research providers include Claritas, Experian, Nielsen Scarborough, and MRI Simmons, among others (Exhibit 4.6). It is recommended that CMs review their budget and consider using more than one research company for different channels to ensure audience characteristics found in their market segmentation data meet optimum campaign outcome goals.
On top of informing the design of the campaign and selection of campaign channels, the chosen market segmentation data provider(s) also assist in the evaluation throughout the campaign. When subscribing to market research services, the CM and ACM should request and receive a guided tutorial from the platformʼs representatives to help define and establish campaign goals, audience geography and profile, timing, and duration. Coordinating with the help of representatives ensures optimum campaign results and final deliveries. This collaboration can help determine what metrics to measure and provide actionable steps for optimizing campaign performance. Within this phase, the CM should
- Select one or more market research companies that fit within their budget and that best reach the target audience;
- Work with the selected market research company to review services and build a formative evaluation plan for each audience segment; and
- Work with the market research company to build an audience profile, using both their market research data and traffic safety data from the SHSO.
The target audience profile provides clarity on who the campaign will reach. This includes insights into the audienceʼs social habits, the platforms and channels they frequent, and how different audience segments may interact with the advertising campaign.
- Obtain consensus and support from internal team members/stakeholders who are related to the overall final goals and objectives of the campaign. Before, during, and after the campaign, it is important for the CM to communicate with stakeholders who coordinate, create, and implement public policy objectives. These administrators may include the governorʼs highway safety office, state DOTs and public health, law enforcement, city planning services, emergency services, and communications services personnel. Simultaneously, the ACM works to inform internal teams and administrators of the campaignʼs objectives, goals, and progress to ensure the audience profile characteristics in each market are accurately identified and the campaign is supported.
Audience and media research data and insights can be overwhelming. While audience segmentation data is important, being able to speak with members of the local community who are affected by particular traffic safety issues can provide common-sense insights that can be better for the campaign overall. To navigate this process, consider constituting a community advisory board (CAB) with a diverse group of local community representatives with a range of perspectives, backgrounds, and experience. CMs and ACMs can leverage the CAB to gain valuable local insights that might not be evident in data alone. It is important in this process to document decisions, feedback, and rationale, maintaining transparency in the decision-making process. Likewise, it is also critical to continuously refine the campaign strategy and integrate data-driven insights with regular check-ins with the CAB. For costs for forming a CAB, refer to the focus group costing tab and assume the cost of recruiting and conducting two focus groups.
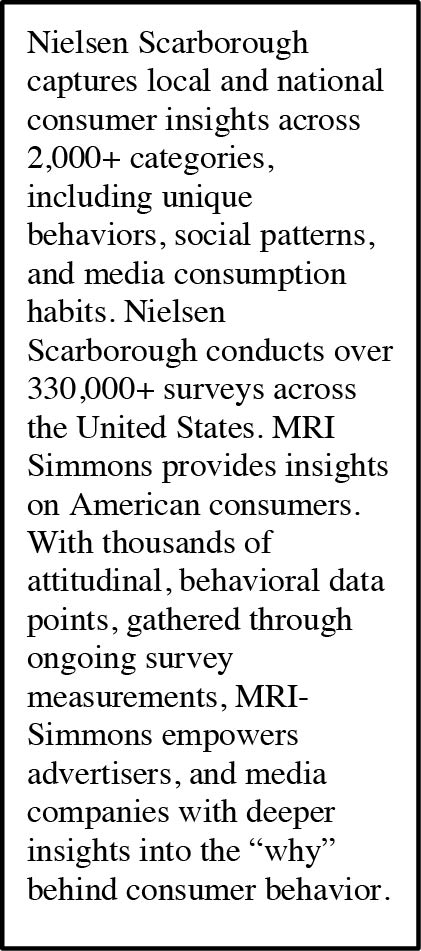
Long Description.
The data given in the table are as follows: Nielsen Scarborough captures local and national consumer insights across 2,000-plus categories, including unique behaviors, social patterns, and media consumption habits. Nielsen Scarborough conducts over 330,000 plus surveys across the United States. MRI Simmons provides insights on American consumers. With thousands of attitudinal, behavioral data points gathered through ongoing survey measurements, MRI-Simmons empowers advertisers and media companies with deeper insights into the “why” behind consumer behavior.
Step 2: Select the Media Platforms for the Campaign
- Select media platforms that will be most effective (within budget) for meeting campaign goals. The CM selects the media channels that will reach the target audience (according to the market and audience segmentation data points, based on Step 1c, using market data and audiencesʼ media usage/consumption habits) and allow for evaluation in accordance with campaign goals. For example, if the goal is to achieve a certain number of audience engagements, social media channels may be ideal. Other considerations for selecting media platforms are included in Exhibit 4.7.
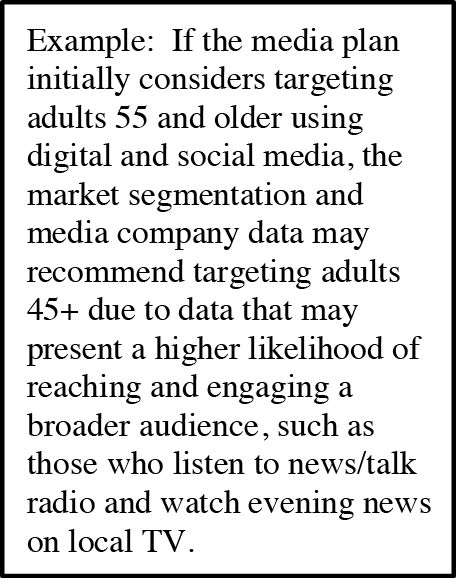
Long Description.
The data given in the table are as follows: Example: If the media plan initially considers targeting Adults 55 and older using digital and social media, the market segmentation and media company data may recommend targeting Adults 45 plus due to data that may present a higher likelihood of reaching and engaging a broader audience, such as those who listen to news or talk-radio, and watch evening news on local T V.
- Review the budget and allocate spending. The CM directs selected media companies to optimize campaign performance based on available budget goals. This includes setting optimal audience reach, audience engagement, and audience action, goals, and expectations.
- The CM and ACM should confirm that the correct audience characteristics, geography, and timing have been identified and selected during this step. This may include traditional media such as TV, radio and out-of-home, and digital and social media to be implemented via the CMsʼ and ACMsʼ accounts (i.e., Facebook, Instagram, Pinterest, LinkedIn, Google, YouTube, and more).
- The CM and ACM can review the projected results of the campaign based on audience characteristics, geography, timing, and media usage presented by traditional media companies.
- Develop the media implementation plan. Based on proposals from selected media companies and platforms, the CM and ACM create a flowchart that shows estimated costs, estimated audience deliveries, and projected cost efficiencies. The CM and ACM can then begin the media planning process by creating a media implementation plan. This document will be updated throughout the campaign to optimize campaign performance. The media implementation plan should include the following:
- Topline objectives, goals, and summary of expectations during the campaign, such as increasing reach and engagement of targeted audiences over time.
- Baseline of expectations of selected media platforms and channels via monitoring KPIsʼ data goals that were established during the onset of the campaign.
- Timeline for reporting and progress reports from CM and ACM that show team members how the campaign is performing from beginning to end.
- Obtain feedback from internal stakeholders on the media implementation plan. Feedback is an important factor in that it helps validate or dispel commonly known data points and earn support from those who work in the community. In this phase, the CM and ACM should consider the following:
- Share data and insights regarding the chosen media mix, including the rationale behind each selection.
- Facilitate a collaborative feedback process, where internal team members can discuss and evaluate the media mix.
- Seek input from the CAB.
- Use the feedback received to refine the media mix.
- Ensure the selected media mix aligns with the campaignʼs overall goals and objectives.
- Work toward a final consensus among internal team members, stakeholders, and the CAB, considering the refined strategy and community insights.
Step 3: Campaign Performance Monitoring and Adjustments
The following actions not only help the CM and ACM optimize campaign performance throughout its run but also set up for the final evaluation process, giving insight into how campaign reach, engagement, and cost efficiency goals were ultimately met.
- Determine KPIs for campaign effectiveness. KPIs must be measurable and relevant to the campaignʼs objectives and reflective of the target populationʼs needs. In addition, the CM should ensure that the KPIs are flexible to accommodate changing insights and allow for adjustment as needed.
- Communicate with internal teams. Establishing ongoing, clear communication internally with team members and administrators is instrumental in rallying support for the campaign. This enables active community members in influential roles to leverage their positions to inform and engage the citizens within the campaignʼs target population. The following are a few key considerations for the CMs to establish consistent and constructive channels of communication.
-
- Provide regular updates on the campaignʼs progress, challenges, and achievements to keep internal team members informed and engaged. Tab 3Ai and 3Aii in Appendix A provide a Paid Media Monthly Budget Planning and Reporting template that can be used for this purpose.
Tab 3Ai provides an example of a completed template, and Tab 3Aii provides a monthly template that can be copy-and-pasted to cover the duration of the campaign. - Recognize the role of internal team members as community liaisons. Encourage them to use their positions to inform and engage citizens within the target population.
- Establish a feedback mechanism that allows internal team members to share their insights, concerns, and suggestions.
- Provide regular updates on the campaignʼs progress, challenges, and achievements to keep internal team members informed and engaged. Tab 3Ai and 3Aii in Appendix A provide a Paid Media Monthly Budget Planning and Reporting template that can be used for this purpose.
- Establish methods for measuring KPIs and attribution studies with selected media platforms. For example, if your goal is to reach as many people as possible to raise awareness (usually during the start of the campaign), KPIs such as media impressions and reach are important to track. On the other hand, if your goal is to get a response from your targeted audience(s), indicators such as engagement or website traffic are important to monitor. In addition to monitoring KPIs, the CM should collaborate with advertising representatives to execute attribution studies during the campaign. Attribution studies conducted by the media platforms provide valuable insights for CMs and ACMs. These studies shed light on the specific touchpoints that contribute to the campaignʼs overall performance. This information allows the campaign team to make data-driven adjustments, such as reallocating resources to channels that are more effective and optimizing the use of digital and social media. Attribution study touchpoints encompass a range of factors, including the effectiveness of creative ad materials (A/B testing), messaging materials, and the timing of ad placements.
If the CM or ACM is not skilled at setting up and managing social media campaigns, it is advised for the CM to consider granting limited administrative access to media implementation partners or outside, expert representatives for the campaign activity dashboard(s), which may include Facebook, Google, or other platforms. This access, which does not permit changes by anyone other than the CM and ACM, enables selected partners to review the campaignʼs status and performance. This review includes data points such as the number of people reached and the performance of website traffic. This access ensures transparency and facilitates real-time assessments of the campaignʼs progress. CMs may also want to consider conducting social listening (see Exhibit 4.8) to monitor public perceptions of campaigns on social media. - Conduct ongoing monitoring. Effective campaign management involves monitoring using KPIs. This includes setting audience reach and engagement targets as benchmarks for performance and tracking progress toward these objectives. Managing with KPIs often means working to improve performance using leading indicators, which serve as baseline metrics for predicting future success and influencing desired outcomes.
- Leverage attribution studies. Media research partners can provide attribution studies for digital and social media ads (refer to Step 3c).
- Use ad platformsʼ [Meta (i.e., Facebook and Instagram), X, Google ads] monitoring systems.
- Access additional data services. Subscribing to other data services (Exhibit 4.9) can provide a more comprehensive view of the campaign performance, especially as managing and reviewing performance of the campaign is time-consuming.
- Review KPI data. This review involves a detailed analysis of performance metrics, such as audience reach (number of people), audience engagement (number of people that reacted to media), website click-thru (responded), and conversions (i.e., if someone navigates your site to sign up or register for an event). This ongoing review allows for a better understanding of what is working and where improvements can be made in real time throughout the campaign.
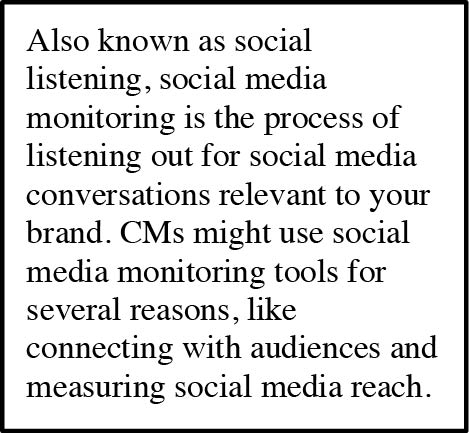
Long Description.
The data given in the table are as follows: Also known as social listening, social media monitoring is the process of listening out for social media conversations relevant to your brand. C Ms might use social media monitoring tools for several reasons, like connecting with audiences and or to measure social media.
Long Description.
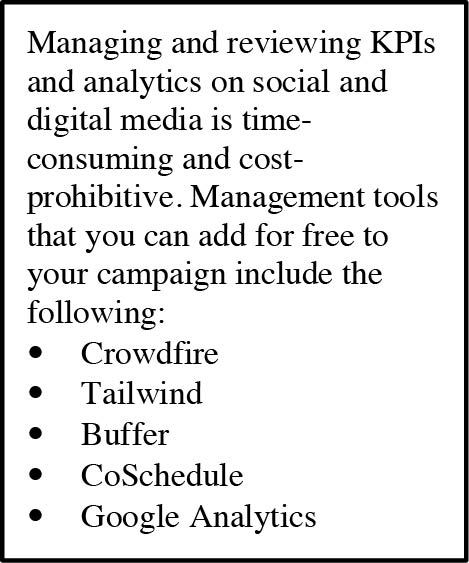
The data given in the table are as follows: Managing and reviewing KPIs and analytics on social and digital media are time-consuming and cost-prohibitive. Management tools in 2023 that you can add for free to your campaign include: Crowdfire, Tailwind, Buffer, CoSchedule, and Google Analytics.
- Update internal stakeholders on current performance and adjustments to maintain campaign support. The CM and ACM should provide weekly progress reports and findings to internal stakeholders. These reports can be in the form of a summary such as an increase in audience reach and engagement or a specific activity such as website visits, downloads, and event registrations. The CM and ACM can download automated reports generated by platforms such as Facebook or Google that show how well the campaign is performing and the likelihood of reaching or exceeding campaign goals.
- Update other stakeholders such as community leaders or other local agencies and departments, including first responders during the onset of the campaign. This can help raise awareness and support of campaign efforts by inviting stakeholders to promote the campaign throughout the community, especially reaching at-risk audiences, to optimize awareness and increase prevention/reduce collisions and fatalities by increasing web traffic and ad campaign recall. This can be done by sharing names of platforms, and key tags/hashtags to be used throughout the campaign, including paid and non-paid posts on social media. However, there can be challenges with sharing too much (Exhibit 4.10). The CM and ACM can work with internal communications personnel to deliver timely content materials that stakeholders can organically post themselves as available.
- Make adjustments to optimize campaign performance. In response to feedback from the internal teams and decision-makers, the CM should be prepared to make adjustments to the campaign to align with its objectives and goals. The CM and ACM can use insights from KPI data analysis as a guide for improvement and make adjustments weekly through the following:
- Direct adjustments via the SHSOʼs advertising and marketing account portal (i.e., Facebook, Instagram, Google, YouTube, X), streamlining the adjustment process.
- Communicate and collaborate with media platform sales representatives as they provide KPI results and attribution study reporting every week.
Long Description.
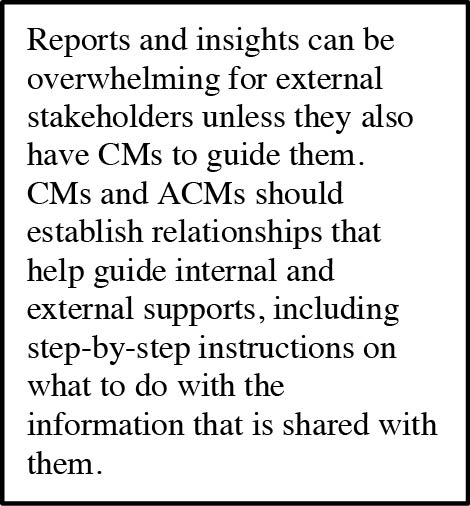
The data given in the table are as follows: Reports and insights can be overwhelming for external stakeholders unless they also have C Ms to guide them. C Ms and ACMs should establish a relationship that helps guide internal and external supports, including step-by-step instructions on what to do with the information that is shared with them.
This step can involve considering potential shifts in media allocations, such as moving resources from radio to digital media, if the data indicates better performance. Making ongoing and active changes, whether tactical adjustments or messaging refinements, does not incur additional costs. This process is continuous and an integral part of ongoing monitoring, as outlined in Step 3d. This process has the potential to add hours of work to apply the changes.
ODC considerations for monitoring tools are detailed in Appendix A, Tab 3 of the Media Metrics Costing Tool, which estimates expenses associated with monitoring media metrics. For social media metrics, it is noteworthy that most social media platforms offer engagement metrics as part of their platform, typically at no additional cost to advertisers or campaign implementers. However, for enhanced functionality, services like Hootsuite and Loomly are available, with costs ranging between $64 to $249, see Cell H15 (see Exhibit 4.9). In contrast, digital media metrics such as website visits, time on-site, and email opens, clicks, and shares are often free through tools like Google Analytics or included in the pricing of email marketing services such as MailChimp or Constant Contact. Costs for email marketing services can vary based on factors like the number of emails sent, with sample costs for a team of three members ranging from $13 to $35, see Cell H16 (see Exhibit 4.11).
Step 4: Post-Campaign Evaluation to Measure Effectiveness of Strategy and Tactics
As targeted campaigns conclude, CMs and ACMs gain valuable insights into the campaignʼs performance, gauging its effectiveness in achieving the campaign objectives and goals. This evaluation revolves around three essential elements: review, analysis, and comparison.

Long Description.
The column headers under columns G, H, and I are subscription costs, ranges, and actuals. Two headers in rows 9 and 14 are market research companies and digital or social media metrics monitoring services. The data are given until row 16.
- Review media deliverables and performance measurements. Based on the ongoing KPI reporting, and final campaign results, CMs assess the campaignʼs effectiveness in reaching and engaging the target audience and meeting campaign goals. This includes evaluating the frequency of ad exposure across various media platforms and channels as well as audience reaction, which encompasses engagement with ads and website traffic. Other ways to measure audience engagement or impact include surveys, focus groups, and interviews during and after the campaign (see Chapters 2 and 3). Audience engagement includes a wide spectrum: advertising recall, social media sharing, and direct interactions such as comments and messages to administrators. These elements collectively influence the target audienceʼs response to the campaign.
- Analyze media analytics, insights, and audience engagement. Within the overall media deliverables and performance reporting, there will be a clear view of how the targeted audiences responded to campaign ads across traditional television, radio, billboard, and public transit ads that highlight website addresses, and digital and social media platform reporting. This may include the following:
- The percentage of targeted audiences who engage with the campaign by visiting the SHSO website, and click through the landing page, navigating (their) website.
- The percentage of targeted audiences that took further action such as downloading materials, registering for newsletters, attending events, or sharing information from their own social media accounts.
- Compare post-campaign findings with pre-campaign expectations. By using the media plan flowchart, the media deliverablesʼ projected data points can be overlaid with actual data points from the advertising campaign to identify where expectations were met or fell short. This includes the following:
- Did the campaign reach the number of people expected?
- Did the campaign reach the impression levels that were estimated?
- Did the campaign deliver a high percentage of clicks on the SHSO website?
- Summarize and report results. Share results with internal team members and external stakeholders. The comprehensive evaluation, suitable for both internal team members and external stakeholders, can be shared with administrators and presented to external partners such as first responders in targeted communities. Key considerations for this final post-buy analysis report include the following:
- The reportʼs format can be tailored to meet the specific needs of the internal and external audiences. This internal report should include the following observations:
- What impressions did the campaign achieve and what percentage of the total population did the campaign reach?
- The reportʼs format can be tailored to meet the specific needs of the internal and external audiences. This internal report should include the following observations:
-
-
- How many people reacted to the campaign (likes, shares, comments), and how many clicked through to SHSOʼs website?
- Did the campaign reach the targeted audiences, based on campaign performance? If not, explain why this may have occurred and lessons learned.
- Were the costs associated with each platform worth the expenditure, or could certain media platforms have been eliminated?
- The summary of the final report can be discussed with community leaders, including first responders such as fire and rescue, law enforcement, hospitals and urgent care organizations, business leaders, faith leaders, and community-based groups. Sharing results may help build partnerships between the SHSO and these entities by informing them of the SHSOʼs activities as well as sharing learning and best practices on communication regarding the topic of the campaign. These partnerships can also support additional campaigns on related traffic safety issues.
-


