Evaluating Traffic Safety Campaigns: A Guide (2025)
Chapter: 3 Surveys

CHAPTER 3
Surveys
Using surveys to evaluate traffic safety messaging can be a complex, time- and resource-intensive approach, but can also gather valuable data from a much wider group than focus groups. This can lead to more generalizable results that can provide a more accurate picture of the reach and impact of a given traffic safety messaging campaign.
There are several different options, or modes, for conducting surveys. These include the following:
- Pen-and-Paper Personal Interview (PAPI). Typically, PAPIs are self-administered surveys mailed to respondents, filled out in person by respondents, and mailed back to evaluators.
- Computer-Assisted Web Interviewing (CAWI). CAWI is a web-based survey that respondents access through a URL shared via email, on a website, via text or social media, or on a personal electronic device like a tablet, laptop, or smartphone.
- CAWI-plus-mailing. CAWI-plus-mailing is a hybrid approach where respondents may be mailed a postcard or letter that provides them with a URL link to a CAWI survey.
- Computer-Assisted Telephone Interview (CATI). CATIs involve interviewers calling respondents and asking them to answer questions over the phone.
- Intercept Surveys. These are surveys where interviewers approach respondents in public and ask them to answer questions, which the interviewers then record, either on paper or on a handheld electronic device like a phone.
Traffic safety practitioners may choose one or more of these modes to collect data via a survey. Each mode comes with its own benefits and challenges, and sometimes multiple modes are used to maximize benefits and minimize challenges. For instance, evaluators may use a web-based survey to reach younger members of an audience who are more technologically savvy and a CATI survey to capture data from older respondents who may be averse to filling out a survey online. The research team describes several key factors to consider when using surveys and when choosing which mode(s) to use. In addition, the team describes staffing roles that may apply to different modes and common steps to follow in planning for survey data collection, sampling, recruitment, administration, and analysis. The quick reference guide for the Survey Costing Tool is available in BTSCRP Web-Only Document 7.
When using the Survey Costing Tool (Tab 2 in Appendix A) (see Exhibit 3.1), the selection of modes affects whether hours are included for specific staff roles and whether specific supplies and ODCs are included in the budget calculations. For example, the level of effort represented by the number of hours allotted for each step and activity for members of the core project team managing a survey from start to finish remains relatively static, but the number of hours for the sampling/methodology/analysis team or the IT support team varies depending on the number of modes used. On the other hand, the mailing, field, and telephone interviewer teams only need hours if those modes are being used. ODCs also change depending on the modes selected.

Long Description.
The tab reads '2 survey costing tool.'
Long Description.
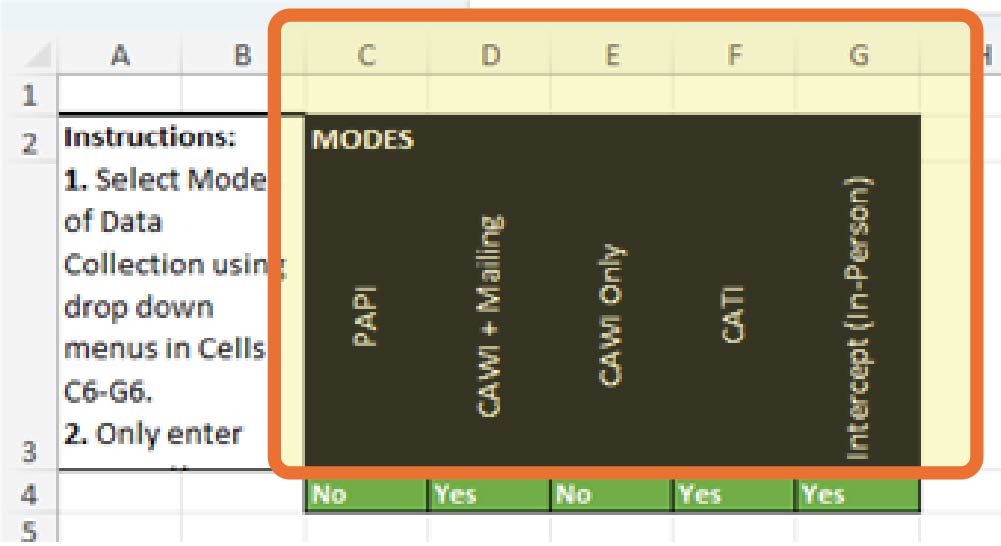
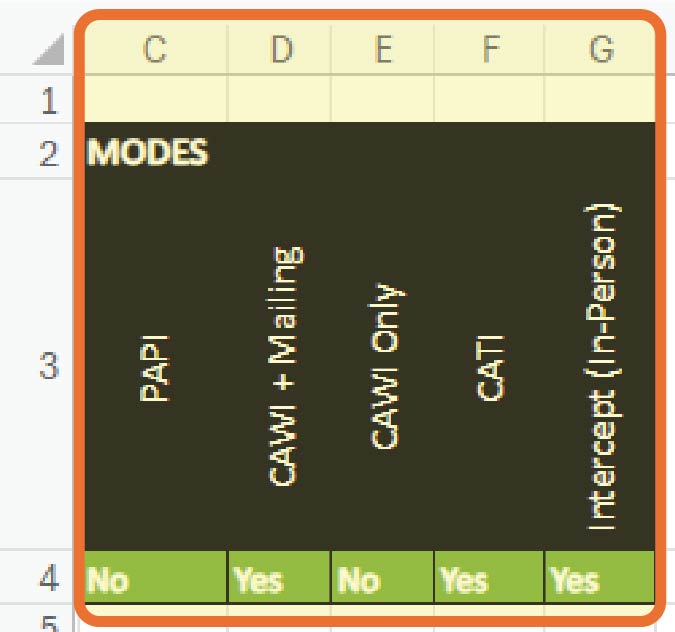
The selecting modes given below columns C through G are PAPI, CAWI plus mailing, CAWI only, CATI, and intercept (in-person).
Including a PAPI mode adds costs for purchasing envelopes and paper as well as printing, mailing, and specific data entry costs, but using a CAWI survey incurs software subscription costs, but not other ODCs. To automatically calculate total hours and costs based on which modes are being used, modes can be selected via the “yes” or “no” dropdowns for each mode in Cells C4–G4 in Tab 2 (see Exhibit 3.2). Cells C3–H3 label the relevant modes.
Staffing
Staffing is a key consideration when selecting surveys as an appropriate methodology. Your survey team needs a three-person project team that includes a leader (referred to as a subject matter expert in Appendix A, who is knowledgeable about the traffic safety behavior and/or evaluation), a project manager, who is responsible for the day-to-day oversight of the project, and a project support person. Often, the project manager can also play the role of the subject matter expert, but it may be helpful to have these roles filled by different people. In addition, the project team is often the same team responsible for initiating, planning, and, with the support of advertising agencies and media buyers, implementing the campaign. Thus, all three roles may be filled by traffic safety practitioners with varying levels of experience and seniority within an organization.
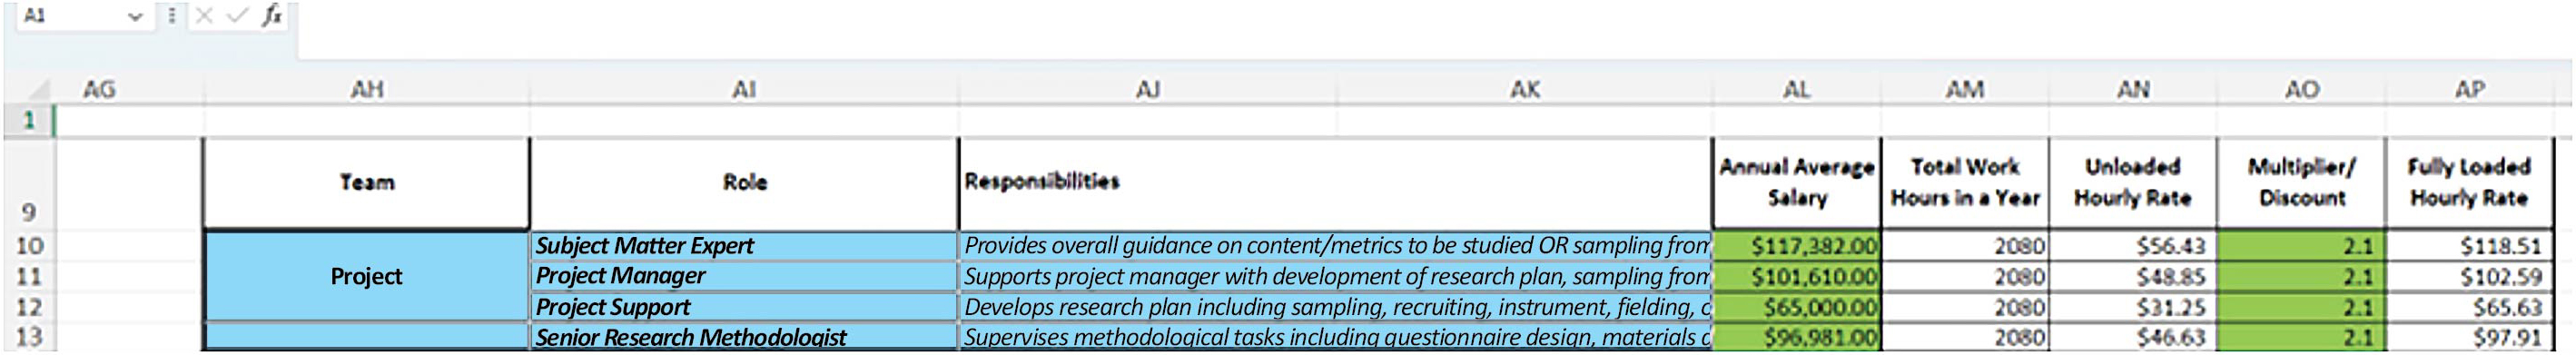
Appendix A, Tab 2, Survey Costing Tool, provides further information on the responsibilities for these positions (Cells AJ10–AJ12) as well as typical salaries for individuals in these roles based on Department of Labor statistics (Cells AL10–AL12), as shown in Exhibit 3.3. The research team recommends that SHSOs using this tool research annual salaries in their jurisdictions that are realistic for these roles and input them into the green cells in Column AL. Formulas in Columns AM and AN will calculate a basic hourly rate based on how many hours a given person is expected to work in a year. This rate can then be adjusted (or loaded) to include fringe benefits and overhead rates per organization by inputting an appropriate figure into Column AO. These hourly rates are then used to calculate labor totals per step in Cells AJ113, AJ114, AJ116, AJ118, and AJ119.
Long Description.
The column headers from AH to AP are team, role, responsibilities, annual average salary, total work hours in a year, unloaded hourly rate, multiplier or discount, and fully loaded hourly rate. The data are represented from rows 10 to 13.
However, surveys may require additional team members with specialized training and skills. While the team describes those roles and skills in the next few paragraphs, it is important to note that not all traffic safety practitioners will have the necessary knowledge and skills to fill these roles. Indeed, acquiring some aspects of the knowledge and skills described may take additional time for professional development, up to and including seeking academic qualifications (which come with added costs). Instead, traffic safety practitioners (based on their budget) have the option of contracting these roles and tasks to vendors who may include academic institutions or research organizations with experience conducting surveys.
One set of roles that requires specialized training and skills is the sampling methodology and analysis team. Depending on the complexity of the survey used to evaluate a traffic safety messaging campaign and the number of modes, this team may require up to six team members with varying degrees of experience and training, including senior, mid-level, and junior research methodologists and senior, mid-level, and junior statisticians. This group will be responsible for determining what size sample is needed to be able to generalize the survey findings to a broader audience (for example, all drivers in a given state) and what characteristics members should have for the sample to be representative of that larger group (e.g., in terms of age, race/ethnicity, and length of time driving). Likewise, this group will also be responsible for analyzing survey responses and identifying which results are statistically significant, that is, which results show an effect on road usersʼ awareness that the campaign may have had versus those that may be chance occurrences.
Another key team that may be involved is an IT support team. IT support is needed for all survey types: CAWI surveys that need to be programmed, PAPI surveys that require surveys to be printed and mailed to a database of potential respondents, CATI survey calls that are made to a random sample of telephone numbers, and data entry for PAPI, CATI, and intercept surveys. (Note: for CAWI surveys, respondents enter their own data.) This support may come from an existing team working at SHSOs and other organizations responsible for traffic safety, who may have some applicable skills and knowledge that could be used to support surveys. Some of the roles in the IT support team include an IT project manager, a survey programmer, a data solutions developer, a network systems engineer, someone responsible for quality assurance (QA), a senior software engineer (SSE), a systems architect, and a database analyst.
PAPI surveys and CAWI surveys that rely on an initial postcard or letter to introduce the survey also need a large mailing team that comprises a production manager and an assistant production manager responsible for QA as well as several production clerks and depending on the number of clerks, an additional supervisor or supervisors, as well as someone else responsible for monitoring and other QA. The production manager and assistant production manager/QA lead are responsible for planning the mail-out of introduction letters, pre-incentives, surveys, reminder letters, and thank-you/post-incentive letters as well as preparing for and managing the return of surveys that will then be sent for data entry. The production clerks and supervisors may be responsible for printing mailing addresses onto envelopes, stuffing the envelopes, and processing returned surveys and unopened mail that has been returned to sender, including removing those addresses with unopened mail from subsequent mailings of reminders. This role may be played by employees who are part-time workers. Cells AJ30–AP30 present the roles and responsibilities of production clerks. Cell AM30 can be used to calculate discounts for rates for this role by specifying the number of hours that part-time or full-time production clerks are anticipated to work (Exhibit 3.4). Full-time hours for this role are assumed to be 2,080 hours per year, but this can be reduced as needed.
Like the sampling methodology and analysis team, it may be possible for SHSOs to contract with a vendor to provide mailing and printing services if they are supplied with a database of addresses and all the text of the materials to be mailed.

Long Description.
The column headers from A H to A P are team, role, responsibilities, annual average salary, total work hours in a year, unloaded hourly rate, multiplier or discount, and fully loaded hourly rate. The data are represented from rows 27 to 34 in which row 30 is highlighted.
Like PAPI surveys, CATI and intercept surveys also require a large field team. Interviewers need to be trained on how to recruit members of the public to respond, either in person or over the phone, to ask questions in the survey, and to input answers from respondents consistently. Similar to mailing production clerks, interviewers may also be part-time employees. To calculate labor costs for part-time employees, the number of working hours for interviewers (Cell AM33) can also be adjusted. Monitoring and QA for these types of surveys are important so that responses can be compared and contrasted accurately. In addition, given that not everyone approached in public or called on the phone will want to respond to a survey, it may take some time for these interviewers to recruit respondents and complete surveys. Keeping these teams on track requires a manager.
Like the project team, descriptions of the roles for each of the other teams have been provided in Column AJ (Cells AJ13–AJ34) in Appendix A, Tab 2, Survey Costing Tool (Exhibit 3.5). Typical salaries for individuals in these roles based on Department of Labor statistics are provided in Column AL (Cells AL13–34), which allow unloaded and loaded hourly rates to be calculated in Columns AN and AP (Cells AN13–34 and AP13–34, respectively) based the multiplier in Column AO that covers applicable fringe and overhead rates. Based on the hours per role for each step and activity in Columns C through AA, the spreadsheet calculates overall labor totals per step in Cells AJ113, AJ114, AJ116, AJ118, and AJ119. The research team recommends that SHSOs research and input realistic annual salaries and fringe/overhead rates in their jurisdictions into the green cells in Columns AL and AO to calculate more applicable overall costs.
Other Direct Costs
Just as different survey modes require different teams, different survey modes require different supplies and ODCs. For example, when budgeting for PAPI surveys, evaluators should include costs for the purchase of envelopes, paper, printing, and mailing costs:
- PAPI surveys may require larger envelopes for mailing the surveys as well as smaller envelopes for introductory letters, reminders, and thank-you letters.
- Printing for PAPI surveys included printing of surveys, introductory letters, reminders, and thank-you letters, as well as printing of mailing addresses on envelopes.
- Mailing costs for PAPIs should cover both outgoing and return mail and can include an address lookup service to ensure accuracy and avoid the costs of mailing materials to invalid addresses (for instance to businesses rather than individuals) as well as postage in the form of physical stamps or permit imprints, used for large volumes of mail, that are printed directly onto envelopes, but come with an annual cost for their use.
CAWI surveys that rely on postcards or letters to introduce the survey and send reminders also incur similar envelope and paper costs (or postcard costs), printing, and outgoing mail costs, but avoid return mail fees. However, costs for CAWI surveys (whether introduced by letter or postcard, or shared via email, social media, text, or other means) would include subscription costs for web survey platforms like SurveyMonkey or Qualtrics. While it is possible to have a skilled IT team build a web survey from scratch, it is often more cost-effective and convenient to purchase a subscription to an existing service. CATI surveys incur a per-minute telephone call cost, and intercept surveys that rely on paper forms incur similar costs to those for PAPI surveys for printing the surveys themselves as well as additional costs for hiring interviewers (advertisements and background checks), mileage, tolls, and parking for interviewers to travel to locations where they might expect to encounter eligible respondents. If intercept surveys are conducted using an electronic device, it may also be necessary to purchase laptops or tablets for the interviewers to use.

Long Description.
The column headers from A H to A P are team, role, responsibilities, annual average salary, total work hours in a year, unloaded hourly rate, multiplier or discount, and fully loaded hourly rate. The data are represented from rows 27 to 34. The entire sheet is highlighted.
Purchasing sample frames or access to existing sample frames may also be a cost to consider for all survey modes. This includes obtaining a list of addresses for address-based samples (ABS) for PAPI or CAWI surveys that involve introductory letters or postcards, or purchasing lists of telephone numbers for CATI surveys or email addresses for CAWI-only surveys if the URL will be distributed via emails or listservs. Other costs include fees for using optical character recognition (OCR) services to scan in PAPI surveys that have been completed and returned, or statistical software packages like SPSS, Stata, or R that are used to analyze data once it has been cleaned and entered. These packages can often be purchased on a subscription basis for an organization that allows multiple users to access the software.
The amount and form of incentives are another consideration. Incentives may differ based on mode. Incentives offered for CAWI surveys, especially those conducted with existing online panels (see Recruitment), can be lower but may be higher for CATI or intercept surveys, as respondents need to spend some time on the phone or in person with interviewers completing surveys. On the other hand, some PAPI surveys use pre-incentives to encourage respondents to agree to participate as well as post-completion incentives. Pre-incentives may be sent to a larger number of people who may not ultimately respond and thus should be lower than the post-incentive for the same survey to save on budget. Cash is typically the best form of incentive to offer, though some surveys use gift cards, either physical or virtual. However, it should be noted that there is often a fee associated with processing gift cards that should also be accounted for in the budget.
These and other costs beyond labor are referred to as ODCs. They are included in Tab 2, Survey Costing Tool, of Appendix A in Column AH (Cells AH58–AH110), with notes on sample costs and the nature of costs in Column AJ (Cells 58–110), as shown in Exhibit 3.6. Like with the salaries in Cells AL10–AL34, SHSOs are encouraged to research more local costs for these ODCs and input them into the green cells in Column AJ between Row 58 and Row 110. This will allow the spreadsheet to calculate more specific jurisdictional level costs for each activity and step in Column AC and provide more accurate total ODC costs per step in Cells AJ 115 and 117.
Like other forms of evaluation, using surveys to measure the effectiveness of traffic safety messaging campaigns involves a series of steps (Exhibit 3.7). This series of steps begins with designing the study, developing an instrument, selecting the mode(s) for the survey, and defining and drawing a sample. The next step involves obtaining clearance to collect data from human subjects. Thereafter, depending on the mode of data collection, the subsequent step is to enlist IT support (which applies regardless of mode). Then, recruitment, fielding, and administration of the survey begin. After the fielding period closes, the final steps are to prepare for data analysis, which may involve activities like cleaning and coding the data, analyzing that data, and drafting and finalizing a report. Projected labor hours for each role in these steps are reflected in Tab 2, Survey Costing Tool, in Appendix A. The hours for many of these steps do not change based on the number of people who respond to the survey, but they may increase as the number of modes increases. However, other costs are reliant on the number of respondents sought and the response rate associated with that mode.
Survey Development
Step 1. Design Study
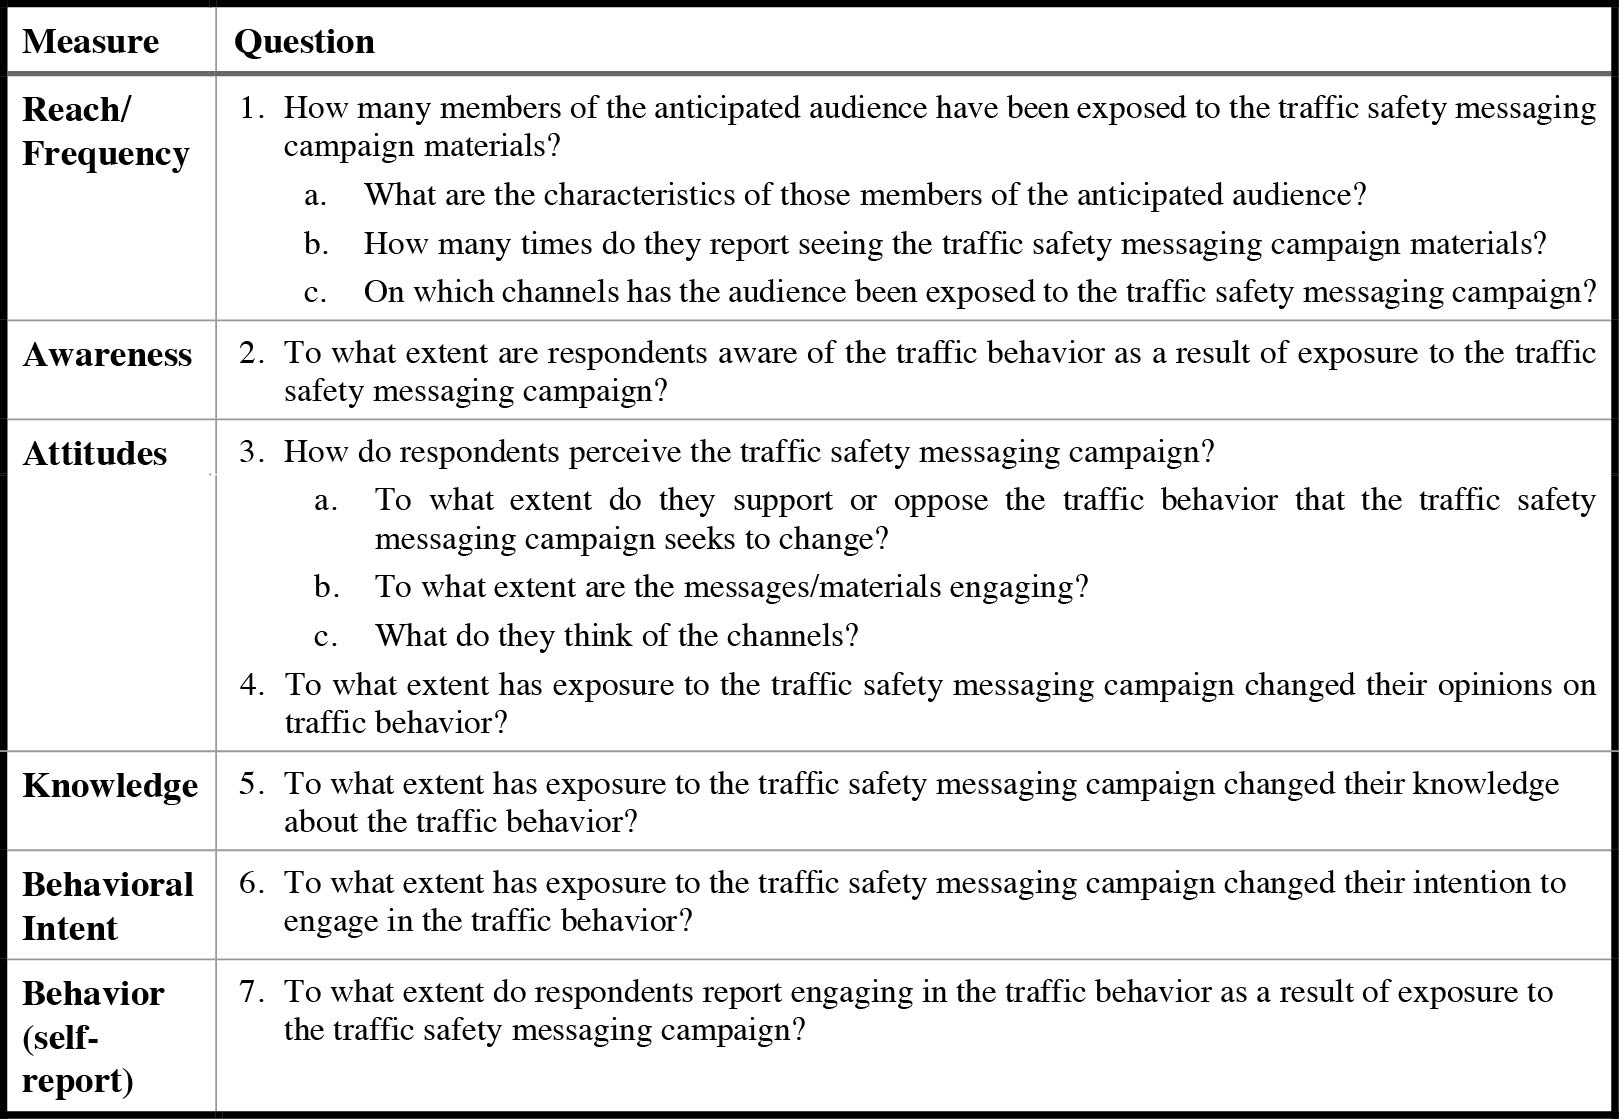
Assessing traffic safety messaging campaign effectiveness using surveys requires developing research goals and research questions for the study, which then influences the questions to ask in the survey and the types and numbers of potential respondents to recruit. These research goals and questions should focus on measures like reach, frequency, awareness, attitudes, and effectiveness. Exhibit 3.8 lists some common evaluation questions used to guide summative evaluations using surveys.

Long Description.
The column headers from AH to AJ are ODCs, notes, and costs. The data are represented from rows 58 to 110. The row headers provided in between are PAPI: pricing, envelopes, mailing services such as stuffing envelopes and postages, outgoing postages, return mail; CAVI plus Mail: pricing (postcard), envelopes, mailing services such as stuffing envelopes and postages, outgoing postages; CAVI: subscription; CATI: calls; Intercept; incentives.

Long Description.
Step 1 is survey development. Step 2 is survey administration. Step 3 is preparation for data analysis.
The selected research goals and questions guide the development of the survey instrument using existing survey items or developing new ones. Likewise, these research goals and questions can also inform the sampling plan for a survey, that is, the particular features of the people who should complete the survey and how many of them are needed.
Step 2. Develop Survey Instrument
Development of a survey instrument, also referred to as a questionnaire design can rely on common metrics used to evaluate traffic safety messaging campaigns, such as reach, awareness, attitude, or behavior change (see Exhibit 3.8) as well as existing survey questions that have already been validated (shown to work elsewhere to accurately capture the necessary data). Typically, survey questions are close-ended, offering respondents a limited number of responses to choose
Long Description.
The column headers of the table are Measure and Question. The data given in the table row-wise are as follows: Row 1: Reach or Frequency: 1. How many members of the anticipated audience have been exposed to the Traffic Safety Messaging Campaign materials? a. What are the characteristics of those members of the anticipated audience? b. How many times do they report seeing the Traffic Safety Messaging Campaign materials? c. On which channels has the audience been exposed to the Traffic Safety Messaging Campaign? Row 2: Awareness: 2. To what extent are respondents aware of the Traffic Behavior as a result of exposure to the Traffic Safety Messaging Campaign? Row 3: Attitudes: 3. How do respondents perceive the Traffic Safety Messaging Campaign? a. To what extent do they support or oppose the Traffic Behavior that the Traffic Safety Messaging Campaign seeks to change? b. To what extent are the messages or materials engaging? c. What do they think of the channels? 4. To what extent has exposure to the Traffic Safety Messaging Campaign changed their opinions on the Traffic Behavior? Row 4: Knowledge: 5. To what extent has exposure to the Traffic Safety Messaging Campaign changed their knowledge about the Traffic Behavior? Row 5: Behavioral Intent: 6. To what extent has exposure to the Traffic Safety Messaging Campaign changed their intention to engage in the Traffic Behavior? Row 6: Behavior (self-report): 7. To what extent do respondents report engaging in the Traffic Behavior as a result of exposure to the Traffic Safety Messaging Campaign?
from. These are easier for respondents to complete quickly and make data entry, coding, and analysis easier for the project team. Surveys rely on multiple-choice questions, check-all-that-apply questions, and even scales where respondents indicate the degree to which they agree or disagree with a statement or the likelihood of a given behavior being enacted. However, surveys can also include questions that ask respondents to rank or order different responses, as well as questions that ask respondents to compare their current perceptions of campaign materials or behaviors with their perceptions of the same items/activities in the past. Surveys can also include questions where the answer to one question determines whether the respondent sees a particular set of questions next or skips those questions (referred to as skip logic); these relationships between questions also need to be programmed.
For instance, saying “yes” to having seen the traffic safety message campaign materials on a billboard leads to the respondent being asked questions about their perceptions of the billboard, by saying “no,” they skip over the questions about the billboard and move onto questions about seeing other types of campaign materials, such as a television advertisement. Skip logic can increase the complexity of a survey, but it can also decrease the length of the survey for respondents who meet certain conditions, making it more likely that they will complete the survey. Skip logic applies to all survey modes. On paper, there would be instructions for respondents to skip certain questions and to move on to a specific question depending on their answer, but when the same survey is conducted over the phone or in person as an intercept survey, the interviewers would see those instructions, but the respondents would not. Similarly, CAWI surveys on the web would be programmed so that the respondents see the appropriate question next without seeing the instructions or skipped questions. This can help with perceptions of survey length and complexity. Surveys that are too long or too complex may discourage potential respondents from taking the survey or not completing the survey if they begin taking it.
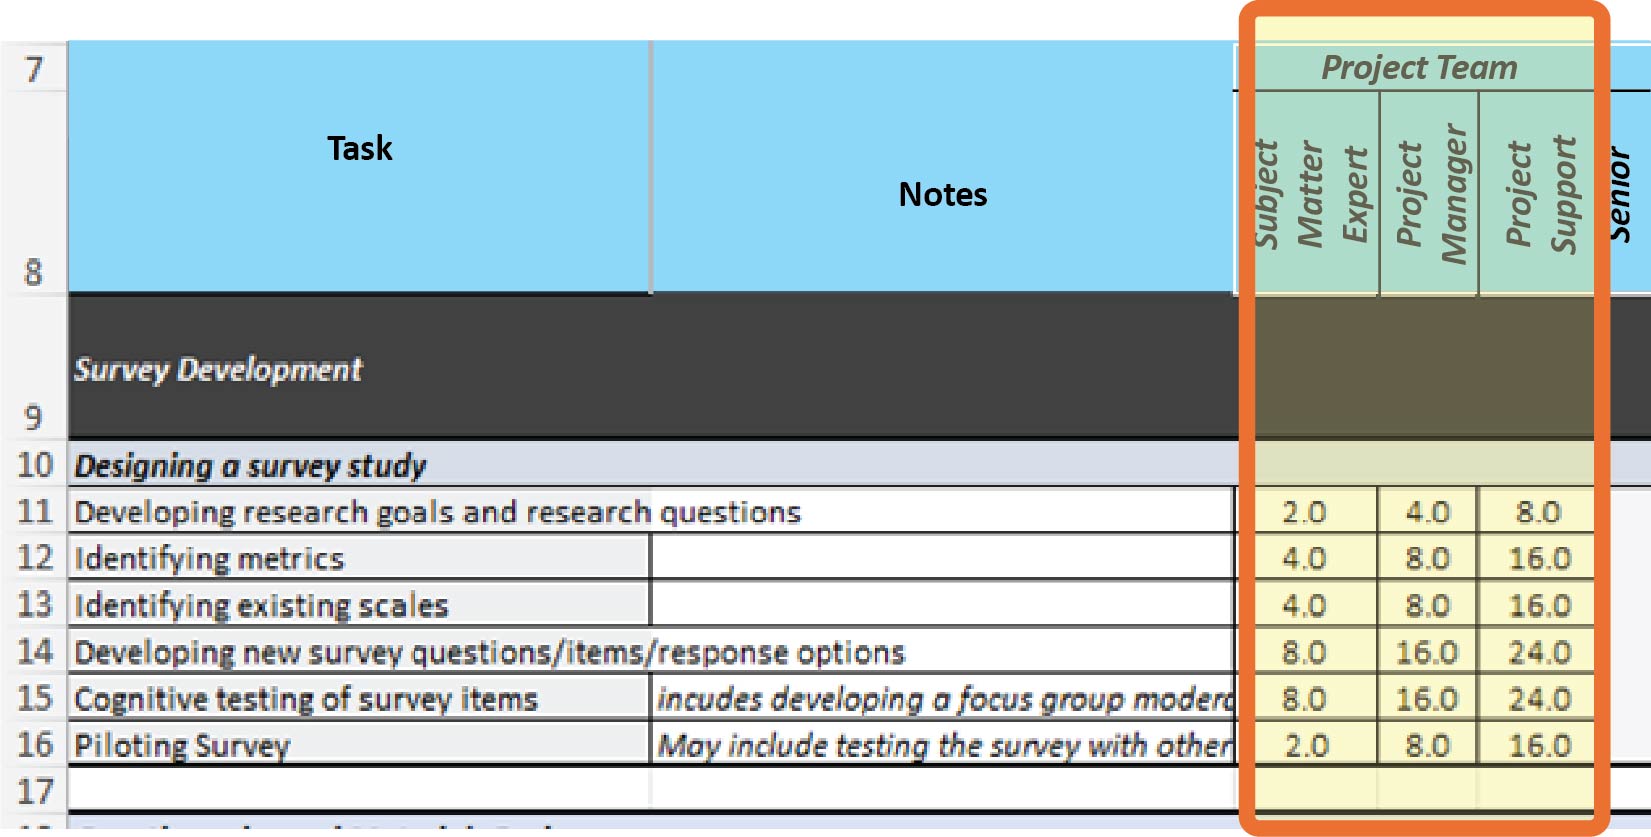
Relying on existing survey questions allows survey responses to be compared with similar survey results in other settings or at different times, which can help show changes over time or regional differences. As a first step, traffic safety practitioners should use the research goals and questions to select priority measures to focus on to keep the survey short. They may also want to review prior surveys used to evaluate traffic safety messaging campaigns to identify existing measures, scales, and survey items to either reuse or adapt. The quick reference guide, available in BTSCRP Web-Only Document 7, presents a generic campaign evaluation survey that can be adapted and used to evaluate a variety of different traffic safety messaging campaigns, with the sources of particular items listed where relevant. When adapting survey items or creating new ones, it may be helpful to consult with survey experts or colleagues to determine whether those items are easily understood. Anticipated hours for the project team, including the subject matter expert, the project manager, and the project support person for these first four activities within this step are detailed in Cells C11–C14, D11–D14 and E11–E14, respectively, in Tab 2, Survey Costing Tool, in Appendix A (see Exhibit 3.9). They are based on the assumption that the project manager is leading the work, with input and review from the subject matter expert, and that they will be directing the work of the project support person as they develop the first draft of the survey.
These three project team roles are also involved in questionnaire and materials design, but these activities also involve members of the sampling/methodology/analysis team, including three research methodology experts (also called methodologists) at different levels: a senior, mid-level, and junior research methodologist. Depending on the complexity of the survey, not all of these roles may be needed, but at least a team member with some experience designing and conducting surveys (i.e., a mid-level research methodologist) should be included in the evaluation team. If this expertise is not already available among the staff of the organization conducting the evaluation, it may be possible to contract with an independent consultant, a research organization, or an academic institution to access this expertise.
Long Description.
The column headers are task, notes, and project team. The project team column contains three sub-columns titled subject matter expert, project manager, and product support. Two headers given below are survey development followed by designing a survey study. The data are represented from rows 11 to 16. The columns under the project team are highlighted.
During the questionnaire and materials design phase, the project team consults with these members of the sampling/methodology/analysis team to decide on which mode(s) to use; which modes will be applied in which order (i.e., the flow of modes), for instance, beginning with a PAPI survey, but adding CATI and intercept modes at a certain time to increase responses and control sampling; and what incentive structure will be used (e.g., will the survey offer a pre-incentive, an early response incentive, or a post-incentive only, and will the amount vary by mode).
Likewise, these members of the sampling/methodology/analysis team will be able to provide input on how the questionnaire should be structured or ordered and on how different materials may be designed or produced, based on the mode(s) selected, to allow for responses (or non-responses) to be tracked, or to facilitate consistent data entry, later in the survey process. This includes advising on how letters, postcards, envelopes, and other materials should look, including wording, graphics, scratch-off areas for respondent ID codes or URLs, and whether pre-incentives should be visible through envelope windows. Projected labor hours for the project team and for these members of the sampling/methodology/analysis team are included in Cells C19–H21 in Tab 2, Survey Costing Tool (see Exhibits 3.10 and 3.11).

Long Description.
The column headers are task, notes, and a third column. The third column is divided into two sections titled Project Team and Sampling or Methodology. The project team column shows three sub-columns titled subject matter expert, project manager, and product support. The sampling or methodology contains three sub-columns titled research methodology, research methodology, and research methodology. Two row headers given below the column headers are survey development followed by questionnaire and materials design. The data are represented from rows 18 to 21. The columns under project team and sampling or methodology are highlighted.

Long Description.
The tab reads sampling support hours.
The project allotment of hours for the project team (Cells C19–E19) is fairly static across modes. However, the number of hours for the research methodologists varies by the number of modes being used. Hours for each type of mode per role are included in Tab 2A, Sampling Support Hours, in Appendix A (see Exhibit 3.10). Total hours for research methodologists across modes are automatically calculated when each mode is selected in Cells C4–G4 at the top of Tab 2 (see Exhibit 3.12). The project team will also consult with other members of this team to develop a sampling plan and frames (the next activity in this step after designing the survey study and designing the questionnaire), and later on (as part of the survey administration step) to monitor the sample as respondents complete surveys and make adaptations as necessary during fielding. However, while they provide valuable input on sampling and sample monitoring, these other members of the sampling/methodology/analysis team, including a senior, mid-level, and junior statistician, come into play during the analysis step.
When creating a survey, the survey mode has a substantial impact on the design of the questionnaire. As a reminder, typical survey modes include the following:
- PAPIs: Surveys are mailed to respondents.
- CAWIs: Respondents complete surveys online.
- CATIs: Surveys are conducted by interviewers over the phone.
- Intercept surveys: Interviewers collect data in person.
- CAWI-plus-mailing: Respondents are mailed a postcard or letter with a link to a CAWI survey.
Each mode comes with its own benefits and challenges. Some surveys rely on only one mode, while others use multiple modes, which can add to the complexity of a survey study but can also mitigate the challenges associated with a single mode. For example, PAPI surveys can be resource- and time-intensive as they require supplies like paper and envelopes, costs for printing and mailing surveys to respondents, and for respondents to mail surveys back. These costs can increase if introduction and reminder letters are used, but can also be mitigated if the organizations conducting the survey can rely on bulk mailing. PAPI surveys may also incur costs for data entry of completed surveys, whether this relies on automatic OCR technology or human
Long Description.
The selecting modes given below the columns C through G are PAPI, CAWI plus mailing, CAWI only, CATI, and intercept (in-person) out of which PAPI and CAWI only are given as no and the rest of them as yes.
beings to input the data. It may also be possible to reduce mailing costs by using the CAWI-plus-mailing approach if letters or postcards are mailed without the need to pay for return mail, and if postcards are used instead of letters, which require envelopes. On the other hand, CAWI-only surveys are often much cheaper to administer. Respondents enter the data themselves, and there are typically no mailing costs. However, CAWI surveys do require software for programming them and websites to host the surveys on, and costs associated with these elements or subscriptions to services that provide both programming and hosting.
CATI surveys may work best for respondents who are reluctant to spend the time filling out a paper survey and mailing it back, or who may not have access to the internet or the technological literacy to respond to a web-based survey. However, CATI surveys do require more staff and more staff time to administer, and they incur telephone costs that other surveys do not. CATI surveys may also require additional upfront effort from the project team to create scripts for the phone interview, lists of frequently asked questions for interviewers to use when answering questions from potential respondents about the survey, scripts in case they need to leave voicemails when calls are not answered, and protocols for how many times a given number will be called if there is no answer. For example, the protocol could call for up to three attempts to call a number to reach potential respondents and for interviewers to leave messages mentioning the post-paid incentive for completing the survey, to increase the likelihood of response.
In addition, CATI surveys need telephone numbers to call. Whether this relies on software to randomly dial telephone numbers or an existing list of verified telephone numbers, both come with a cost. Those costs may change depending on whether landlines or cellphone numbers are used, and the labor needed to make those calls can increase depending on how many respondents answer the calls from the interviewers and then choose or decline to respond. However, like with intercept surveys, potential respondents may find it harder to decline a person asking them to complete a survey than to ignore a survey mailed to them, emailed to them, or shared on the web. Intercept surveys also have the benefit of being able to be conducted in a place relevant to the questions being asked, for instance, near a billboard or bus shelter displaying campaign materials, or a location frequented by different types of road users. However, they may face additional costs for interviewer time, travel, and per diem. The relative costs of all of these modes are also influenced by whether an incentive (pre- and/or post-completion) is offered and by the typical response rates for each mode.
Another important consideration is the length of the fielding period, which is the time period during which the survey is in the field or available to the public to complete. This time period should be sufficient for the team to conduct outreach to and recruit potential respondents, to disseminate the survey to those respondents, for respondents to complete the survey, for several reminders, and for the completed surveys to be returned. The length of time is influenced by the speed of the method of dissemination and return. Mailed PAPI surveys take longer to reach potential respondents and therefore require a longer fielding period, whereas respondents can begin completing CATI, CAWI, or intercept surveys as soon as the team reaches out to them and recruits them. The other major factors in determining the length of the fielding period are the response rate for each mode and the number of survey completions sought. Fielding periods for those modes with lower response rates, for instance, PAPI and CAWI studies that rely on a letter or postcard to introduce the survey should be longer to allow more time to collect enough responses to meet the sample requirements.
Fielding periods for other modes (like CAWI surveys) can be shorter but should still allow time for several reminders to be shared in bi-weekly or weekly increments (and perhaps every 2 to 3 days in the last week) before the survey closes. The length of fielding periods for intercept CATI surveys is somewhere between these two ends of the spectrum and is based not only on the response rate and number of completions sought but also on the number of interviewers,

Long Description.
The tab reads intercept support hours plus ODC.

Long Description.
hours in the day that they can conduct interviews, the length of each interview, and for intercept surveys, by the numbers of sites where data is being collected. Tabs 2D, Intercept Support Hrs+ODC, and 2E, Telephone Support Hrs Calcs, provide green cells where assumptions about some factors can be input (see Exhibits 3.13 and 3.14).
These assumptions are used to calculate hours and ODCs per mode on each tab. If these modes are selected in Tab 2 (Cells C4–G4) (see Exhibit 3.12), the hours and costs from Tabs 2D and 2E are then updated in Tab 2. However, these assumptions can also be used to calculate fielding periods for these modes. The ideal number of days/weeks needed to complete intercept surveys to achieve a given number of survey completions appears in Cells B30 (days) and B35 (weeks) in Tab 2D (see Exhibit 3.15), and the number of days to complete sufficient CATI surveys via telephone to meet the same goal appears in Cell B33 in Tab E.
In addition to designing the instrument, another important activity in developing a survey study that uses CAWI as at least one of the modes is to program the instrument. Programming the instrument refers to transferring the questions from a static document that describes the questions and response options for each question into a web-based interface where respondents will be able to answer those questions. That interface may allow the survey to be rendered differently if it is accessed via a laptop or desktop computer or if it is accessed via a smartphone or tablet. In that interface, when building or programming a survey, selecting the types of questions may restrict respondentsʼ options for answering (e.g., limiting them to select only one option versus checking all that apply). Similarly, programming a survey also allows for skip logic to be applied. This makes the survey more complex, and it is important to have team members test the survey programming by completing it several times and selecting different answers each time that trigger different skip logic relationships between questions.
It may also be helpful to conduct cognitive testing of new/adapted survey items to make sure that potential respondents are interpreting and answering the questions as intended. Cognitive testing involves asking a small group of potential respondents a given question and interviewing them about their answer choices and the thought process they used. It includes developing an

Long Description.
The headers in column A, rows 28 and 32 are the 'Number days on-site needed to meet goal' and 'Number of weeks in the field needed to meet goal', respectively. The data on rows 30 and 35 are highlighted. They are Active days: 8 and Weeks needed to complete data collection: 2.
interview guide for testing, recruiting for interviews, conducting interviews, reviewing results, and revising the survey instrument/questionnaire. Tab 1, Focus Group Costing Tool, in Appendix A, can be used to budget for cognitive testing interviews. The research team recommends conducting 10 interviews to test new survey questions.
Finally, conducting a pilot of the survey is also an important part of this step. The pilot may include testing the skip logic as well as testing how long it takes for members of the survey sample to complete the survey (which may affect the incentive offered) by asking other staff or recruiting 20 to 30 potential respondents to complete the survey and provide feedback on their experience. For the latter, assume double the incentive for any mode being used. Piloting may reveal the need to reorder or cut questions depending on responses from the pilot group. Additionally, given that the survey will be collected from human beings, it needs to be reviewed by an IRB and receive human subjectsʼ research approval or exemption. However, hours for IRB review are not included, as it can be hard to estimate how much effort applying for IRB review will take because there is considerable variation in how different organizations handle this aspect of evaluation.
Step 3. Sampling
The next step in designing a survey study is to develop a sampling plan that describes how many and what types of respondents the study is looking for. Both the number of respondents and their characteristics affect the extent to which the survey results can be viewed as representative of the audience for the traffic safety messaging campaign. In terms of the types of people who are asked to complete the survey, the sample frame should reflect the audience that the campaign seeks to reach in terms of demographics like age, race/ethnicity, and gender. Therefore, if the campaign has been implemented on a statewide basis, the sampling should take into account the demographic makeup of the state and include similar proportions of respondents based on their demographics. Alternately, if the evaluation intends to understand how different groups of people within the state, based on their location (e.g., rural or urban, or specific counties), modes of transportation (e.g., drivers versus pedestrians), and demographics (if the campaign was targeted at younger, male drivers), the sampling plan should ensure that the appropriate proportions of each group are represented among the respondents, and the plan may call for oversampling some groups who may typically be harder to reach.
The size of the sample may also vary, based on how many responses it takes for the survey results to be considered representative and how likely members of the public are to respond to a survey, depending on the mode(s) used. For example, response rates for paper surveys range from 5% to 8%, depending on the type of sampling used, but can be as high as 25% to 30% if using social media to recruit for and share links to web-based surveys. In addition, the sample size can affect the ability to determine whether differences between different groupsʼ survey results are statistically significant (i.e., due to actual group differences rather than random chance) as well as the ability to detect statistically significant changes resulting from exposure to the campaign). Sampling can be a complex process that requires specific skills, experience, and qualifications, which SHSO staff may not have, and thus, SHSOs may want to consider contracting with a research organization or partnering with a local academic research institution to develop the sampling plan and draw a sampling frame.
Activities that need to be conducted to develop a sampling plan include identifying relevant respondent characteristics (e.g., age, gender, race/ethnicity, income, mode of transportation, area of residence) for design and weighting. These characteristics will be based on the characteristic audience for the campaign. Next, the team conducting the survey needs to identify and quantify the broader audience for the campaign or a population with the same relevant characteristics. This can involve comparing the characteristics of anticipated respondents to population, census,
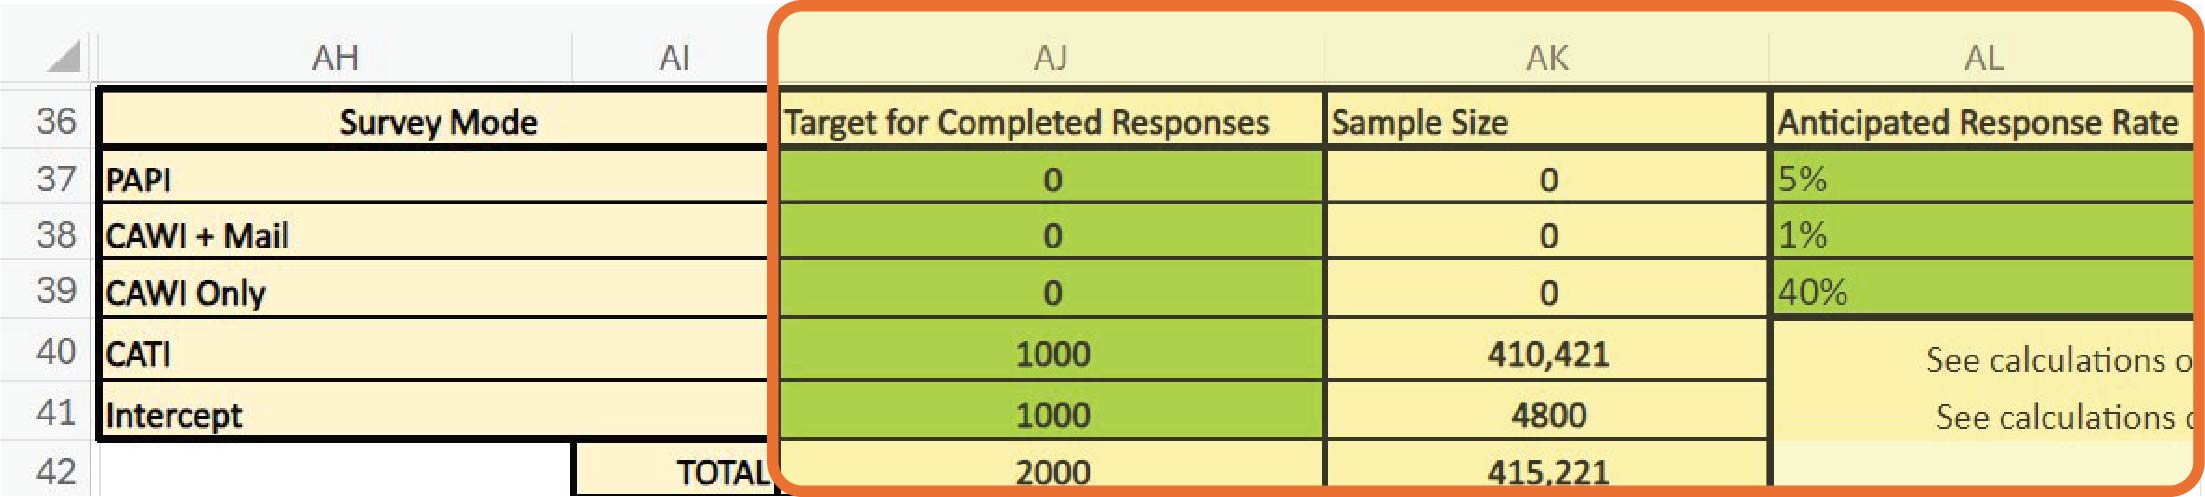
or Department of Motor Vehicles (DMV) data to identify how many members of the population fit those criteria. This informs the sample size and the numbers or proportions of members of specific subgroups within the sample. The sample size can also be informed by reviewing published evaluations of similar studies to determine what proportion of the population should complete the survey for the results to be representative as well as typical response rates per mode. This can help to identify the number of potential respondents that the survey should be sent to and the ideal modes for the survey. Users can input their targeted number for completed survey responses into Cells AJ37–AJ39 in Tab 2, Survey Costing Tool, and their anticipated response rates in Cells AL37–AL39 for PAPI, CAWI-plus-mailing, and CAWI-only surveys, respectively, to yield the total sample size they need in Cells AK37–AK39 (see Exhibit 3.16). Anticipated response rates may be based either on their research into local surveys or on the ranges recommended in the notes in Cells AM37–AM39.
For intercept and CATI surveys, there are some additional factors to consider in determining sample size. For intercept surveys, these include foot traffic in a given area, likelihood of potential respondents stopping to talk to interviewers after being greeted, screener completion rates, eligibility rates, interviewer commute times, and planned days on-site. For CATI surveys, this can include the number of adults with cellphones or landlines, the number of residential numbers, and how many people answer the phone as well as screener completion and eligibility rates. Calculating the ideal sample size for intercept and CATI interviews begins with identifying the number of completed surveys sought for each mode in Cell AJ40 and AJ41 in Tab 2, Survey Costing Tool (see Exhibit 3.16). However, users should navigate to the respective tabs (Tab 2D, Intercept Support Hrs+ODC, and Tab 2E, Telephone Support Hrs Calcs), and input their assumptions into the relevant cells in green on those tabs to determine the sample sizes, which will be calculated based on those assumptions and reflected in Tab 2 in Cells AK40 and AK41.
Determining the sample size also involves determining the number of respondents in specific groups (or proportions of those groups relative to the total sample) who should be recruited to complete the survey. These proportions may need to be adjusted to account for groups who are known to be reluctant to complete surveys. Recruiting a higher proportion of members of those groups to ensure that enough responses from these groups are collected to be representative is referred to as oversampling.
The next steps involve determining the type of sample frames and sampling methods. Sampling frames refer to those members of the population that can be contacted and/or from whom information can be collected. These can come from the following:
- For PAPI/CAWI-plus-mailing surveys, via
- Existing lists of mailing addresses, maintained by various organizations, including state tax agencies or the Department of Motor Vehicles.
Long Description.
The column headers from A H to A L are survey mode, Target for completed responses, sample size, and anticipated response rate. The data are provided from rows 37 to 42. The columns A J through A L are highlighted.
-
- ABS, which provides a list of addresses within a given geographic area, often based on information from the U.S. Postal Serviceʼs (USPS) Computerized Delivery Sequence (CDS) file that contains all the addresses served by the USPS.
- For CATI surveys, via
- Existing lists of telephone numbers, which could come from similar sources to the lists of mailing addresses, or could come from vendors that supply a list of verified landline or cellphone numbers.
- Random digit dialing (RDD), where software is used to randomly generate 7- to 10-digit strings that could be potential telephone numbers, dial these, and connect an interviewer if someone answers. RDD number generation can be limited to specific area codes for a geographic focus, and landlines can be autodialed, but cellphone numbers must be dialed manually (according to law), and hence, evaluators may opt for pre-verified lists.
- For CAWI surveys, samples can come from existing lists of email addresses or targeted social media advertisements where social media platforms promote the survey to users of their platforms, from whom they have gathered demographic information.
Like sampling frames, sampling methods also vary. Sampling methods can be divided into probability and non-probability methods. The former assumes that members of a sampling frame are being randomly selected for outreach about the survey, while the latter focuses on reaching out to potential respondents who meet specific characteristics.
In terms of probability methods, approaches to selecting potential respondents include randomly selecting them on an individual basis or dividing the body of potential respondents into smaller groups, called clusters, based on preexisting criteria like their place of residence (e.g., neighborhoods, zip codes, or even towns and cities) and then randomly selecting among those clusters. The clusters should display similar diversity to the whole sample frame for this approach to be effective. This approach may apply to evaluating traffic safety messaging campaigns that seek to reach all adult drivers in a state (e.g., the sample frame is large and spread across a wide geographic area). Stratified sampling is another probability sampling method that begins by stratifying members of the sample frame according to specific criteria like age, race/ethnicity, gender, and place of residence, and then applying cluster or simple random sampling. This can ensure that the sample includes people with the relevant characteristics.
Options for non-probability samples include purposive sampling, where efforts are made to recruit specific types of respondents selected by the evaluators, to ensure that people with specific characteristics are included in the sample. Other non-probability sampling methods include convenience sampling, where respondents are included based on ease of access to them (e.g., based on existing relationships as well as their availability or presence in a given location, which is used for intercept surveys); or relying on members of the sample to self-select or volunteer to take the survey. Another non-probability option is snowball sampling, which is typically used when there is no list of people to randomly choose from (i.e., no sampling frame to apply). This often happens with hard-to-reach or mobile populations (e.g., people who move frequently or are not easily found). Snowball sampling means one person from the target group completes the survey then is asked to introduce the survey to others, and they are, in turn, also asked to share the survey.
Hours for the project team to engage in these activities are listed in Cells C24–E28 in Tab 2, Survey Costing Tool. Hours for the members of the sampling/methodology/analysis team to engage in these activities are included in Cell F24–K28 (see Exhibit 3.17). The allotted hours for the project team (Cells C24–E28) remain the same across modes, but the number of hours for the sampling/methodology/analysis team (Cells D24–K28) varies by the number of modes being used.

Long Description.
The column headers are task, notes, and a third column. The third column is divided into two sections. The first section is titled Project Team and contains three sub-headers titled subject matter expert, project manager, and product support. The second section is titled Sampling or Methodology or Analysis Team and contains six sub-columns titled research methodology, research methodology, research methodology, senior satisfaction, mid-level satisfaction, and junior satisfaction. Two headers given below are survey development followed by developing a sampling plan. The data are represented from rows 24 to 29.
Hours for each type of mode per role are included in Tab 2A, Sampling Support Hours, in Appendix A. Total Hours for sampling/methodology/analysis team across modes are automatically calculated and carried from Tab 2A into Tab 2 when each mode is selected in Cells C4–G4 at the top of Tab 2.
The final activity in developing a sample plan involves preparing load and mail files for PAPI and CAWI studies that rely on an initial introductory letter or postcard. This activity is not required for other modes. Surveys that involve mailing typically have a list of addresses (see ABS or list-based samples in Exhibit 3.17) that need to be loaded into a customer management database system that links addresses with unique participant identification numbers (PINs) so that outgoing and return mail can be tracked. The mailing team (or vendor if one is involved in mailing) needs access to these files to print and batch the letters, postcards, or surveys as well as reminder and thank-you letters. This step can also involve the creation of experimental variables to organize the surveys according to those PINs and conduct quality control tests to ensure that PINs and other identifiers for outgoing mail can be correctly linked to return mail. A junior statistician on the sampling/methodology/analysis team is usually responsible for creating and checking these files at the start of data collection or when a new batch of mail is sent.
Hours for the project and the sampling/methodology/analysis teams to engage in these activities are included in Cells C29–K29, with some additional hours for the mailing team involved in the preparation and loading of mail files in Cells T29–V29. The hours for the sampling/methodology/analysis and mailing teams are influenced by the number of modes being used for the survey and hours for each type of mode per role are drawn into Tab 2 from Tab 2A, Sampling Support Hours, and Tab 2C, Mail Support Hours (see Exhibit 3.18), depending on which mode is selected in Cells C4–G4 at the top of Tab 2 (see Exhibit 3.2).

Long Description.
The tab reads mail support hours.
Step 4. IT Support
Teams conducting surveys will likely need support from IT specialists, regardless of the mode of survey data collection:
- For PAPI surveys, IT professionals can help develop and manage databases of cases. These unique addresses make up the sample to which surveys will be sent. These databases are used to track which addresses have been sent surveys and reminders, which have responded, and
- which need to be sent thank-you letters and incentives. Likewise, IT support is needed for data entry for PAPI surveys so that the data collected from completed surveys can be correctly entered into databases that allow those responses to be analyzed, whether this is being done via OCR software or entered by hand by coders.
- For CAWI surveys, IT support is needed to program the web interface for collecting data, disseminate the survey, collect and clean the data that is gathered, and prepare it for analysis.
- Intercept surveys may also need a similar level of support if they are collecting data via laptops or tablets. In this case, data would be entered into a web interface by interviewers rather than by respondents. If responses are being collected on paper, an IT team would create similar data entry systems to those previously described for PAPI surveys.
- Likewise, CATI surveys would also need IT support to set up databases to track cases, including unique telephone numbers and whether telephone numbers called were still in use, whether they were connected to residences or businesses, and which callers had responded to the survey. The IT team will also need to create a web interface for interviewers to enter the data collected.
An IT support team includes several key roles:
- An IT project manager coordinates all activities to ensure the success of the project.
- A survey programmer is responsible for the design, development, launch, and maintenance of all questionnaires, including programming skips, branching, and tabular formatting for all modes of survey data collection.
- A data solutions developer is responsible for the output of the information collected for reporting, analysis, and delivery to the client.
- A network systems engineer is responsible for supporting and developing IT infrastructure for data collection, maintaining that infrastructure, monitoring its performance, troubleshooting, and diagnosing and resolving difficult and complex IT system problems.
- A QA analyst develops test plans and executes test scripts to ensure that new applications meet all defined requirements.
- A senior software engineer leads application developers and ensures business needs are coded properly and that the most applicable software programs and platforms are used to meet the business requirements.
- A systems architect is in charge of devising, configuring, operating, and maintaining computer and networking systems and will ensure the appropriate software and integrated systems are in place to foster quality automation.
- The database analyst works with other programmers, researchers, and statisticians to develop and maintain systems that extract data and prepare these data for delivery to internal and external clients, including designing and maintaining databases, managing large amounts of data, identifying, and establishing data relationships, and delivering well-organized, structured output for analysis.
Some of these roles, for instance, network systems engineers, software engineers, and system architects, already exist in organizational IT teams and are responsible for managing IT systems. Only some of these roles will be involved in survey data collection on an extensive basis, and not all roles will be needed for all modes. Typically, the bulk of the effort for IT support for surveys falls on the IT project manager and the survey programmer, who will liaise with the survey project team to set up the necessary systems for data collection and entry. Other roles come into play when there are more complex needs. Cells AH19–AK26 in Tab 2, Survey Costing Tool, in Appendix A, describe these IT support roles in additional detail (see Exhibit 3.5).
Tab 2B, IT Support Hours, describes the hours per role per mode for the activities needed to support survey administration. Some of these activities are conducted before surveys are fielded. This typically begins with an initial IT kickoff meeting where the survey project team meets with the IT project manager to discuss the specifications of any IT systems that need to be built. Thereafter, the IT team develops an IT project framework and process, where the actual systems
are built. For PAPI surveys, this step includes programming a receipt control module if needed, including a task to link received surveys to the cases or addresses to which it was sent, and doing some basic testing to make sure everything is working.
For CAWI, CATI, and intercept surveys, programming a receipt control module is part of the subsequent step, survey development, which also involves programming the survey instrument created in the prior steps. The next set of activities conducted before fielding focuses on quality automation, which involves developing or configuring an automated testing program to conform to the questionnaire and running the programmed questionnaire through automated quality testing. Automated testing can detect a wide variety of possible errors and is much more thorough than manual testing. Once it is configured, automated testing can be run an unlimited number of times, making it far more efficient than manual testing.
Other activities are conducted to support data collection during fielding and can include case management for intercept surveys as well as general data-collection support for all modes. Case management for intercept surveys involves developing an automated case management system for interviewers to keep track of their cases. General data-collection support from the IT team is needed for maintenance and troubleshooting if something goes wrong after data collection begins.
Tab 2B describes the hours per role per mode for each of these activities. The hours have been calculated, assuming a 6-week fielding period. There is no need to change the hours in any fields on this tab, and therefore it has been locked. The survey costing tab (Tab 2) will draw the hours indicated for each survey mode based on the selections in Cells C5–G5 on that tab and populate the appropriate cells for each phase (Cells L32–S35 for pre-fielding IT support, and L112–S113 for survey administration IT support), as shown in Exhibit 3.19.
Step 5. Recruit Respondents
For surveys, respondents are typically recruited and asked to complete the survey in the same step, though sometimes an introductory letter can be used in advance of a PAPI survey being mailed out. Recruiting survey respondents involves various methods tailored to reach diverse populations effectively. Teams may rely on randomized approaches like ABS or RDD, purposive, snowball, or convenience sampling. Some randomized approaches rely on sample frames based on existing lists of addresses or telephone numbers, which often have to be purchased from companies that collect and verify this information. In these instances, individuals are selected to be contacted using probability-based methods like simple random sampling, cluster sampling, or stratified sampling, all described in the Sampling Plan section.
Purposive sampling approaches can include paying market research companies for access to their existing pools of respondents who have already agreed to participate in surveys or other data-collection activities, or paying groups that represent particular types of audience members, for instance, healthcare providers, for access to their membership lists. Relying on existing databases like these streamlines identification and recruitment of potential respondents but may limit diversity in respondent profiles without additional outreach efforts. In addition to the cost of access to these databases, survey project teams should also account for labor hours spent identifying organizations like these (both market research companies and representative organizations), reaching out to them, establishing contracts or memoranda of understanding (MOUs), and monitoring recruitment via these organizations. Another purposive approach that SHSOs may be able to use involves leveraging DMV lists, which provide access to a broad demographic of licensed drivers. Using DMV lists offers a unique opportunity for SHSOs to target respondents based on traffic-related behavior (driving) in specific geographical areas or demographic groups pertinent to the projectʼs objectives. However, accessing DMV lists may present logistic challenges, such as ensuring data privacy compliance and obtaining updated contact information.

Long Description.
The column headers are task, notes, and a third column. The third column contains three sub-headers titled project team, sampling or methodology or analysis team, and I T team. The project team column contains three sub-headers titled subject matter expert, project manager, and product support. The sampling or methodology column contains six sub-headers research methodology, research methodology, research methodology, senior satisfaction, mid-level satisfaction, and junior satisfaction. The I T team contains eight sub-headers titled I T project manager, survey programmer, data solutions developer, network system engineer, assurance analyst, software engineer, systems architect, and database analyst. Two headers given below are survey development followed by pre-fielding I T support. Another header given in row 11 is survey administration I T support. The data are represented from rows 32 to 35 and 12 and 13. The sub-columns under the I T team are highlighted.
Social media platforms may also be effective for recruitment for convenience samples due to their large user bases and targeted advertising capabilities. For example, teams can deploy targeted advertising and posts to reach survey participants. The flexibility and reach of social media make it a versatile tool for recruitment, although managing engagement and ensuring the quality of responses can be a challenge. Additionally, costs vary based on advertising budgets and platform strategies, with additional expenses for content creation and monitoring.
Once recruitment methods are selected, they should be included in a recruitment plan that identifies how, where, and when respondents will be recruited as well as how many respondents and the criteria for inclusion based on the sample frames identified in the sampling plan and the mode of the survey. The plan should also detail what will be communicated to potential respondents, whether an incentive (and/or pre-incentive) will be offered, how much the incentive will be, and how many attempts will be made to reach potential respondents or remind them to take the survey. In addition, the recruitment plan should also describe how incoming responses will be screened to ensure representativeness. If a survey relies on an adaptive design, where recruitment and outreach methods change depending on the types of respondents who complete the survey during the fielding period to ensure representativeness or oversampling particular groups, these methods and the circumstances in which they will be applied can be included in the recruitment plan. It will also be helpful to create recruitment materials and include these in the plan. These include the images and text to be used in letters, postcards, social media advertising, emails, or phone/intercept scripts that describe the survey. The descriptions in these materials should include what topic the survey is asking about, who is eligible to complete the survey, the length of the survey, and what incentive is being offered. Considerations for incentivizing survey participation play an important role in recruitment effectiveness.
Offering incentives, whether pre- or post-survey completion, enhances response rates and participant engagement. Pre-incentives are provided upfront to encourage initial survey participation for PAPI surveys. These are typically cash, usually $1 to $2, depending on the complexity of the survey. For a campaign effectiveness survey, which may be less complex, $1 may be sufficient for a pre-incentive. Teams mailing out introductory letters with pre-incentives can often double the response rate by making the incentives visible through the mailing envelope window. Post-incentives, distributed after survey completion, ensure respondents fulfill their commitment and provide accurate data. These include cash rewards; gift cards for online shopping or grocery stores; or entry into prize draws, where merchandise is given away. Cash is best—while giveaways can attract interest, they may yield lower response rates compared to monetary incentives. Likewise, gift cards often come with a $1 to $2 processing fee that must be budgeted for. The amounts for post-incentives may vary slightly based on the mode of the survey, between $5 and $15 per survey. As described under pre-incentives, campaign effectiveness surveys may be less complex, and therefore, a $5 incentive for a two-page PAPI survey may be sufficient. This should be increased if the survey is more complex, if it is conducted in person via intercept surveys or over the phone via CATI surveys, respondents need to spend additional time responding to each question. This additional time should be reflected in a higher incentive.
Survey Administration
The following sections provide information on the administration of each mode of survey data collection and are thus not labeled as steps, given that evaluators can choose to implement multiple modes for the same survey. In addition, the information provided for some more resource-intensive modes, such as PAPI or CAWI surveys disseminated through an initial mailed letter or postcard, focuses on supplies and ODCs, with some minor discussion of labor hours for specific team members. For other, more time- or labor-intensive modes, for instance, CATI or intercept surveys, the detail provided describes the number of hours needed for specific roles, in particular, interviewers, and how those numbers are calculated, with less discussion on ODCs.
PAPI Surveys
Although this mode refers to PAPIs, these surveys are typically self-administered rather than interview-administered. This means that respondents complete the surveys on paper themselves by filling out a questionnaire and mailing it back to the organization that originally sent the survey. The PAPI mode is often used for longer surveys that may take more time to complete. Sampling for PAPI surveys may rely on either an ABS, which restricts mailing of surveys to random addresses within a particular geographic region, or location-based service (LBS), which relies on an existing database of addresses. Given that PAPI surveys are mailed out to potential respondents who have not already been recruited, the response rate can be low. However, it may be possible to recruit for these surveys using an introduction letter, with a pre-incentive, a few weeks before the actual survey is mailed. A pre-incentive is a small incentive offered with an introductory recruitment letter. This is effective in improving response rates. In addition, the response rate for PAPI surveys can be doubled by offering the pre-incentive in a way that makes it visible through a clear window on the mailing envelope. The pre-incentive ranges from $1 to $2, depending on the complexity of the survey. For traffic safety messaging campaign effectiveness surveys, an appropriate pre-incentive would be $1.
After mailing introductory letters, reminder letters can also be mailed to respondents who have not completed and mailed back a survey by a certain point. Once the survey is sent, respondents who complete the survey can then be mailed a thank-you letter and an incentive for completion, around $5.
PAPI surveys can be time-intensive and require a multi-person mailing team, including a production manager, an assistant production manager/operations analyst, several production clerks, someone to supervise those clerks, and someone whose role focuses on monitoring and other QA activities. Descriptions of all these roles are included in Tab 2, Survey Costing, in Appendix A, in Cells AJ27–AK31, with typical salaries based on Department of Labor categories in Cells AL27–AL31. This mode also tends to be more time-intensive for returns and post-fielding activities rather than fielding itself. The production manager is typically the only role allotted hours for fielding, including sending out an initial outreach communication and reminders. For post-fielding activities, the amount of effort for the production manager and other roles depends on whether letters or postcards are used to introduce the survey and send reminders, whether a printed survey is being mailed and returned to the senders (PAPI-only), or whether the introductory postcards/letters are being used to direct respondents to a web-based survey (referred to as postcard push-to-web or mail-push-to-web). All these options involve receipt control activities, but PAPI-only surveys may also involve hours for editing, computer-assisted data entry (CADE), and Fortran programming. Receipt control refers to tasks where production clerks log any mail that is returned, including both unanswered or unopened mail (which allows the team to remove those addresses from the sample database) as well as responses to initial outreach letters/postcards and completed surveys. The other activities are used for data entry from the PAPI surveys into electronic databases for analysis.
Users can use the dropdowns in Cells G4–O4 (see Exhibit 3.20) in Tab 2C, Mail Support Hours, in Appendix A to select the modes for survey dissemination, initial outreach, and reminders, which then calculate the appropriate hours for each mode in the table (Cells F10–O18 on the same tab), which in turn alter the hours for the mailing team on the main Survey Costing Tool tab (Tab 2), in Cells T29–V29, T47–T48, T82–Y83, T118–X124, and W125.
PAPI surveys can also be resource-intensive. Supplies for PAPI surveys include paper for introductory and reminder letters and surveys to be printed on as well as different sizes of envelopes. In addition, there are printing costs for the letters and surveys as well as printing addresses on envelopes. Cells AJ60–AJ64 describe average anticipated printing costs as well as the costs of envelopes for surveys and either introductory, reminder, or thank-you letters. Estimated survey

Long Description.
The column headers are survey dissemination mode, initial outreach, and reminder. Row 4 with yes or no responses for the surveys listed in the row above is highlighted.
printing costs assume a two-page survey with 10 questions at $0.10 per survey, with a 9″ × 12″ outer mailing envelope that costs $0.15. Introduction, reminder, or thank-you letters assume a single page with an estimated $0.05 printing cost with a No. 10 outer mailing envelope at $0.08. In addition, the surveys and letters must be inserted into the appropriate envelopes, and postage must be applied, which can also be time-intensive. However, some vendors can conduct this activity and provide other related services for a fee. For surveys, the current estimated cost per survey, assuming a two-page survey is inserted into a 9″ × 12″ envelope, is $2.25, and the costs per letter for single-page introductory, reminder, and thank-you letters, inserted into a No. 10 outer mailing envelope, are $0.50. These vendors also offer an address lookup service where batches of addresses from ABS are compared with a database of public records maintained by LexisNexis, the worldʼs largest electronic database for legal and public-records-related information, to ensure that the zip codes, county codes, and other address information are accurate. This can cost between $0.07 to $0.10 per record but allows organizations to mail surveys, letters, reminders, and pre-incentives to avoid the cost of mailing to inaccurate or incomplete addresses.
For budgeting, PAPI surveys must also take into account mailing costs for outreach and return mail. Outgoing mailing costs can increase depending on the number of pages in the survey, which affects the weight of the outbound mailings. Outgoing survey mailings often include return envelopes that are pre-stamped to ensure that the respondents are not incurring mailing costs themselves, especially as respondents will be unlikely to complete a survey if they have to pay to mail it themselves. Outgoing costs can be reduced somewhat by mailing in bulk (i.e., mailing a large number of surveys at the same time and using a permit imprint, which allows companies to print postage information directly onto envelopes or postcards rather than using individual stamps). However, companies have to pay an initial application fee of $320 to the USPS for the permit as well as an annual fee, also $320, to be able to use an imprint and receive special bulk pricing. They may also be able to purchase specialized machines that weigh and apply the permit stamp with the appropriate mailing costs, referred to as mailing meters. The current average costs for survey mailing have been estimated in Cell AJ74 as $1.46 based on pre-sorted mail (referred to as USPS presort), either stamped or metered, and assumes 9″ × 12″ envelopes (see Exhibit 3.21). Likewise, the cost for reminders and thank-you letters, which are assumed to weigh less, has been estimated at $0.62, which is also based on the average cost for USPS presort, first-class metered, and first-class stamped using #10 envelopes.
Likewise, return mail costs can be reduced by using preprinted business return envelopes (BREs) that also require a permit from the USPS to preprint business reply information on envelopes in place of a stamp. The envelopes are currently $0.14, but the fee for the permit and per-envelope mailing costs can vary depending on the total volume of returns anticipated. The current annual low-volume BRE fee for mailings anticipating fewer than 977 returns is $265,

Long Description.
The column headers given under AH through AI are ODCs, notes, and costs. The headers given below are PAPI: mailing services such as stuffing envelopes an postages, outgoing postages, and return mail. The data given in rows 77 and 78 are highlighted.
and the estimated mailing cost per envelope for a two-page survey is currently $1.71, assuming a 9″ × 12″ envelope. The annual high-volume fee is currently $1,065, including annual and separate quarterly fees with a per-envelope mailing cost, also assuming a 9″ × 12″ envelope is $1.01. The BRE low- and high-volume permit fee figures are included in Cells AJ66 and AJ67, and the per-envelope fees are included in Cells AJ77 and AJ78 (see Exhibit 3.21). These figures can be updated based on usersʼ more timely research. To calculate the correct amount, users should enter “0” in the low-volume fields (Cells AJ66 and AJ77). If using the high-volume service, they should enter “0” in Cells AJ67 and AJ78 if they are budgeting for the low-volume service (see Exhibit 3.21).
CAWI with Mailing
Postcards or letters may also be used to introduce and share an address or URL for a CAWI survey and to send reminders to respondents who have not started surveys. This mode is referred
to as CAWI-plus-mailing or mail-push-to-web. Like PAPI surveys, this mode incurs similar envelope and paper costs (or postcard costs), printing, and mailing costs for outgoing mail but avoids return mail fees associated with PAPI-only surveys.
Labor hours and ODCs for preparation of CAWI surveys, including programming and testing, are included under the Survey Development and Develop Instrument sections. ODCs for programming and fielding are described in the CAWI-only section. Labor hours for printing letters or postcards for the CAWI-plus-mailing for the project team appear in Cells D65–E67 in Tab 2, Survey Costing Tool, in Appendix A, and for managing incentives in Cells D79 and E79 (see Exhibit 3.22). ODCs for paper and envelopes, mailing services, and postage for introduction and reminder letters or postcards for this mode are included in Cells AB65–AC77 and calculated automatically based on inputs in terms of the number of completions sought (Cell AJ38) and the anticipated response rates (Cell AL38) which yield the sample size (Cell AK38) as well as ODCs input into Cells AJ83–95. Current estimates for paper, envelopes, postcards, mailing services, and postage are included in these cells. Users may update the values for each type of ODC in those cells based on their own research.
CAWI-Only Surveys
CAWI surveys are essentially web-based surveys that respondents access through a URL shared via a letter or postcard, email, on a website, or via text or social media, on a personal electronic device like a tablet, laptop, or smartphone, that they complete themselves. Preparation for the survey requires labor hours for the project team to develop the survey (described under Step 1, Study Design), which is then programmed and tested. Less complex surveys can be programmed by a member of the project team using existing software services or vendors like SurveyMonkey or Qualtrics that can host the survey on their own web-based platforms, for a monthly subscription fee. It is relatively easy to learn how to program surveys using these services, and they offer features that cover a variety of typical question types as well as the means to have different team members test surveys before they are launched. The subscription costs vary depending on how many surveys a team is creating over time and/or how many respondents are expected to complete the surveys.

Long Description.
The column headers are task, notes, and a third column. The third column is divided into sections where only the first section is visible. The first section is titled project team which contains sub-columns of subject matter expert, project manager, and product support. The four headers given below the column headers are survey development, survey administration, CAWI plus mailing and printing. The data represented from rows 65 to 79 are highlighted.
More complex surveys with extensive branching logic and skip patterns, adaptive designs, and specific sampling may require programming an IT support team that will create new code and arrange hosting of the survey. While the IT support team would be responsible for programming a CAWI survey developed by the project team and can test that survey based on the directions they are given, the responsibility for comprehensive testing and signing off on the CAWI survey ultimately falls on the project team. However, surveys to evaluate traffic safety messaging campaigns typically do not require this level of complexity. Once tested and in the field, CAWI surveys more or less run themselves. They can be programmed to automatically send out regular email reminders to those respondents who have not opted out of the survey or have not completed it. They can also issue thank-you emails and incentives automatically, with some oversight from the project team. As a result, there are no labor hours included for administration of CAWI-only surveys in Tab 2, Survey Costing Tool, in Appendix A, but there are ODCs reflected in Cell AB86 that account for survey platform subscription costs. If using a CAWI-plus-mailing mode, these costs should be added to the labor hours and ODCs for administering the mail portion as previously described.
Incentives for CAWI surveys can be lower than intercept and CATI surveys because of the amount of time spent on them. A post-completion incentive of $5 should be sufficient for a 10-question CAWI survey. For CAWI surveys, providing an incentive in the form of a virtual gift card immediately after completion can be enticing for potential participants but may come with an additional processing fee for the organization implementing the survey. In addition, it may be possible to negotiate a lower incentive when recruiting respondents via existing online panels. These respondents may be accustomed to receiving points that can be used toward a variety of incentives via the online panel in place of cash or gift cards, which can save on the budget.
Intercept Surveys
Intercept surveys are conducted in person, by interviewers who approach (i.e., intercept) members of the public and ask if they are interested in completing a survey. They then administer the survey to those who agree to participate, recording their answers on paper or a portable electronic device like a laptop or tablet, and disbursing an appropriate incentive. Managing intercept surveys does involve some set hours for the members of the project team, primarily the project manager and project support person, to direct staffing, the launch and close of the survey, training of interviewers, data-collection efforts, and quality control and validation (Cells D95–E99 and C99). However, intercept surveys also rely on an intercept team that includes a manager and interviewers. Hours for these personnel are reliant on several assumptions that are captured and calculated in Tab 2D, Intercept Support Hrs+ODCs, in Appendix A. These assumptions are also influenced by the projected numbers of completions entered in the main Survey Costing Tool tab (Tab 2) in Cell AJ41 (see Exhibit 3.16). Users should begin by entering their projected number of completions in Tab 2 before moving to Tab 2D.
Both hours and ODCs are calculated in Tab 2D based on the number of completions targeted in Tab 2 and specific assumptions in Tab 2D about interviewer interactions with members of the public, how interviewers spend their time, the number of sites and interviewers (including typical hours on-site, weeks in the field, and days per week that interviewers work, and/or will be on-site) as well as mileage rates and other transportation-related expenses. For example, in terms of assumptions about interactions with respondents in Tab 2D, Intercept Support Hrs+ODCs, in Appendix A, users can use the values in Cells B5, B6, B8, and B9 to estimate the number of anticipated engagement opportunities per hour that each interview will have (Cell B5) based on how busy a location is and the number of people a single interviewer is expected to encounter (see Exhibit 3.23).
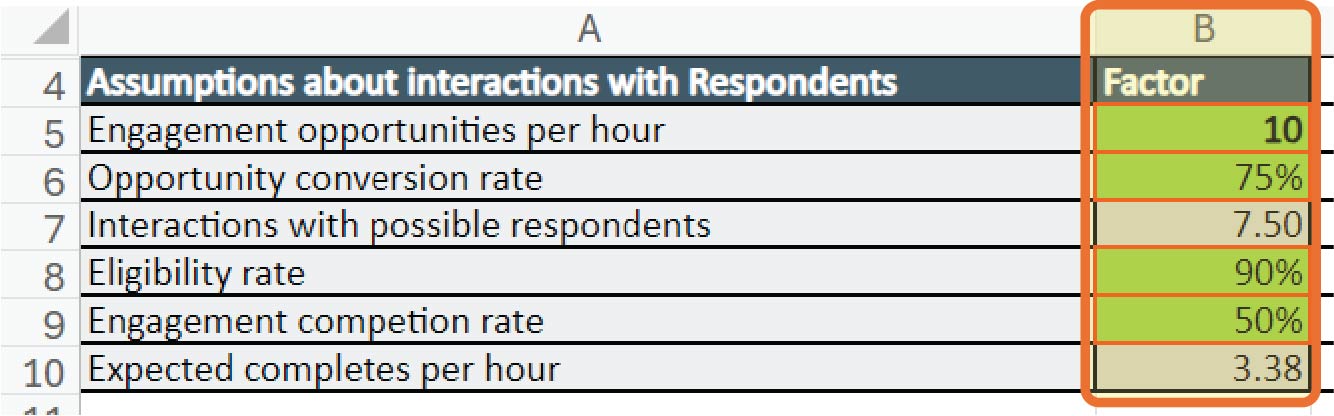
Long Description.
The column header under columns A and B are assumptions about interactions with respondents and factors. The data are given from Rows 5 to 10. The column B is highlighted.
Next, users can adjust the figure in Cell B6 for the opportunity conversion rate, which refers to the percentage of engagement opportunities that result in a conversation versus those missed because people ignore the interviewer or the interviewer is engaged with another potential interviewee. The next factor that users can input/adjust is the eligibility rate (Cell B8), which refers to the percentage of those people approached who agree to complete a survey, and who are likely to meet any eligibility criteria (language, age, residency) for that survey.
Finally, in terms of these assumptions about interactions with respondents, the final factor is the engagement completion rate (Cell B9), which is the percentage of engagements that result in a completed survey. This varies with the salience of the topic, length, incentive amount, and interviewer quality. Entries into each of these cells are used to calculate the number of potential interactions with respondents (Cell B7, which is calculated by multiplying the anticipated number of potential interactions and the opportunity conversion rate (i.e., the values in Cell B5 times the value in Cell B6) and the expected completions per hour (Cell B10, calculated by multiplying the number of potential interactions with respondents in Cell B7 with the eligibility and engagement completion rates in Cells B8 and B9, respectively). These calculated values in Cells B7 and B10 inform the next set of assumptions about how interviewers typically spend each hour on-site (Exhibit 3.24). The number of potential interactions with participants (B7) is multiplied by time (in minutes) needed to complete an initial interaction (Cell B13), which includes the time to greet a potential respondent, gain their cooperation, and answer any questions they may have, to yield the time spent on initial interactions per hour (Cell B14). The expected completions per hour (Cell B10) is multiplied by the number of minutes to administer a survey (Cell B15) to yield the total amount of time every hour spent completing surveys (Cell B16) (Exhibit 3.24), which represents the time that the interviewer can only interact with one person. Adding the time spent on initial interactions per hour and the time spent on survey administration per hour (Cells B14 and B16) (Exhibit 3.24) yields the total time that interviewers are busy in each hour Cell B17). Subtracting this from the 60 minutes in each hour determines the number of minutes left for other tasks (e.g., tidying supplies, talking with site staff, and checking with the manager). Dividing the calculated value in Cell B17 by the number of minutes in an hour then provides a
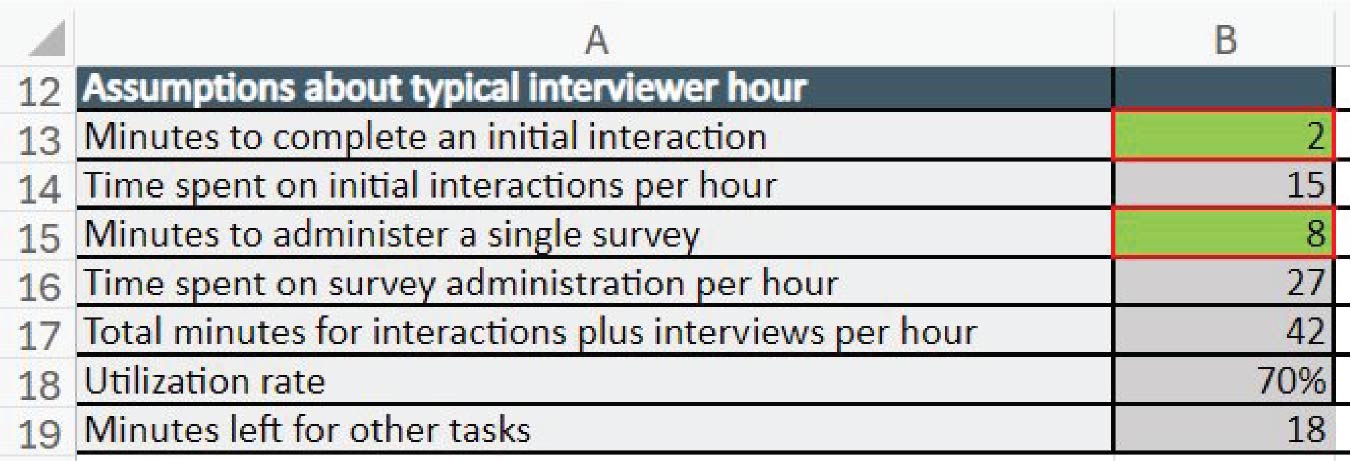
Long Description.
The column header in column A is assumptions about typical interviewer hours. The data are given from rows 13 to 19. Column B is highlighted.
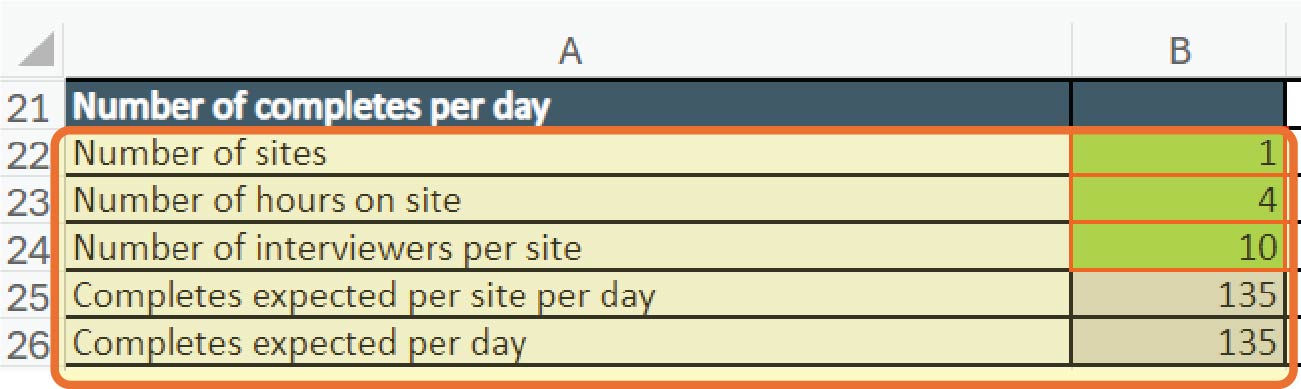
Long Description.
The column header in column A is number of completed per day. The data given from rows 22 to 26 are highlighted.
calculated utilization rate, which is the percentage of a typical hour accounted for by total interviews and interactions. Ideally, the utilization rate should not be too high (100% or 60 minutes of each hour) or too low (50% or 30 minutes of each hour). Instead, aiming for utilization of 60% (∼35 minutes of each hour) to 90% (∼55 minutes) should be enough to ensure that interviewers are using their time wisely and not burning out.
The next set of assumptions focuses on the number of surveys completed per day (Exhibit 3.25). This is affected by the number of sites where interviews can be conducted simultaneously (Cell B22), the number of hours interviewers will be on-site at each location (Cell B23), and the number of interviewers per site (Cell B24) (Exhibit 3.25). The average number of hours staff will be on-site (Cell B23) may be limited by how busy the site is over the course of the day (i.e., it may not always be busy), by whether interviewers are working part- or full-time, and by the need to account for preparation time, meal breaks, and interviewersʼ commuting time. The number of interviewers scheduled to be on-site on a typical day may vary—if the site is a busy location, it may be wise to assign more interviewers. However, if it is not busy and several interviewers have been assigned, some may not be effective in obtaining completions.
Cell B10 (expected completions per hour) is automatically multiplied by Cell B23 (number of hours on-site) and Cell B24 (number of interviewers per site) to yield the expected number of completions per site per day (Cell B25), which, multiplied by the number of sites (Cell B22), will provide the number of completions expected per day across all sites (Cell B26). The number of expected completions per site per day (Cell B25) is then used to calculate the number of active days (Cell B30) (Exhibit 3.26) needed to meet the goal for completions set in Cell AJ41 in Tab 2 (Exhibit 3.16). This is then divided by the number of days that interviewers are likely to be active at each site each week (Cell B34), which may depend on the number of potential interviewees per day of the week at each location. There may be more during the week and fewer on the weekend or vice versa to yield the number of weeks needed to reach that goal (Cell B35) (Exhibit 3.27).
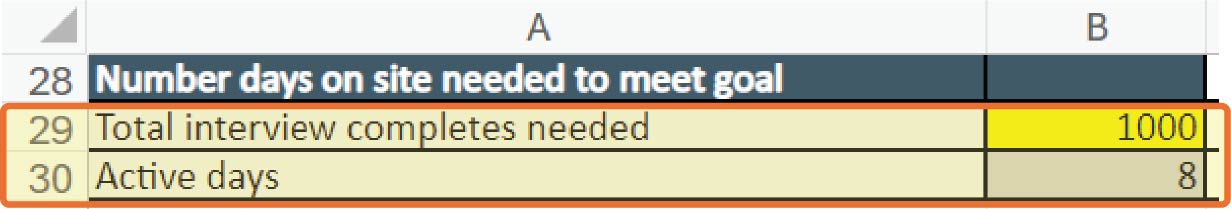
Long Description.
The column header in column A is the number of days on-site needed to meet goal. The data given in rows 29 and 30 are highlighted.
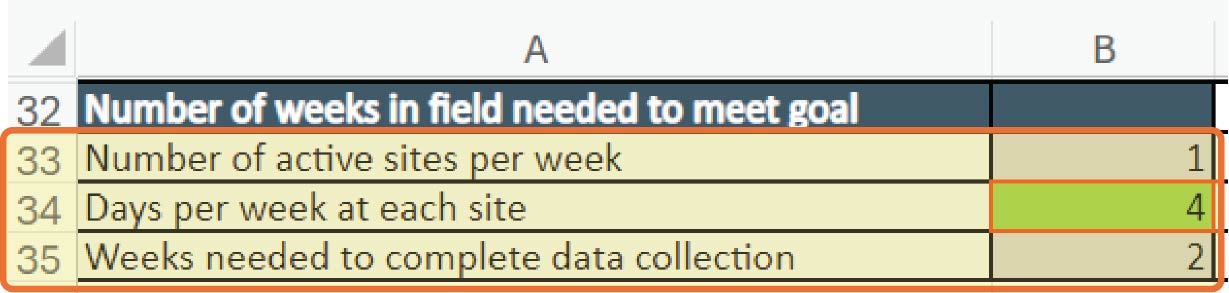
Long Description.
The column header in column A is the number of weeks in the field needed to meet the goal. The data given from rows 33 to 35 are highlighted.
However, the number of active days on-site to meet the survey completion goal (Cell B30) is also used to calculate the number of labor hours for each interviewer (Cell B41). This is also influenced by the projected commute time to and from each site for each interview (Cell B38), which assumes that it may take longer to get to the site than it takes to commute from the site. Build in time for delays as well as administration and preparation time, which includes time for interviewers to complete any necessary documentation, talk to their manager, or complete time sheets (Cell B39) (Exhibit 3.28). Adding the time for commuting and administration/preparation to the time on-site for each day (Cell B23) will yield the total number of hours (Cell B40) per interviewer for them to reach the goal set in Cell AJ41 in Tab 2 (see Exhibit 3.16).
Cells B22 (number of sites) and B24 (number of interviewers per site) are also used to calculate the total number of interviewers needed (Cell B50) and hence, the total number of managers needed (Cell B51), assuming that one manager is needed for each 15 interviewers. The total number of managers identified in Tab 2D is then used, in Tab 2, to calculate the total number of hours for those managers to be involved in staffing intercept surveys (Cell Y95), launching and closing the survey (Cell Y96). Staffing hours for intercept managers are assumed to include 10 hours of labor per manager for recruiting staff, including reviewing resumes, selecting and interviewing candidates, and hiring as well as 2 hours per interviewer for completing forms and onboarding. Launching and closing the survey assumes a minimum of 20 hours per intercept team manager. For larger efforts, over 2,000 labor hours for interviewers, for instance, 10 weeks of interviewing by 20 interviewers, users should assume 2 weeks per intercept team manager for launch and 1 week to close.
Interviewers and managers also need to be trained to administer the intercept survey. This training typically focuses on an initial review of the content of a survey, practice administering it, and testing by a supervisor to ensure fidelity as well as survey-specific administration tasks, input fields, systems, and recruitment. This excludes general training on data-collection principles and organizational policies. For training to administer, the total number of interviewers in Cell B50 in Tab 2D is multiplied by the number of training hours per interviewer (Cell B40) and by 30 minutes per manager, based on a 15-question instrument, to yield the labor hours for training in Tab 2 in Cells Y97 and Z97. However, training lengths may vary depending on the complexity of the instrument.
The total number of interviewers (Cell B50) is multiplied by the total number of hours per interviewer (Cell B40) to provide the total number of hours for all interviewers for data collection in Cell Z98 in Tab 2, Survey Costing Tool. The total number of hours for interviewers in Tab 2 is also used to calculate the total number of hours for intercept managers in Cell Y98 on that tab, which assumes that they would take 20% of interviewer hours to manage those interviewers. Finally, labor hours for managers to conduct quality control (QC) and validation assume that they are checking 10% of the total number of surveys sought (Cell AJ41 in Tab 2) and that it takes 10 minutes of effort per case selected for validation/QC. These hours are reflected in Cell Y99 in Tab 2.

Long Description.
The column header in column A is the total interviewer hours for data collection. The data given from rows 38 to 41 are highlighted.
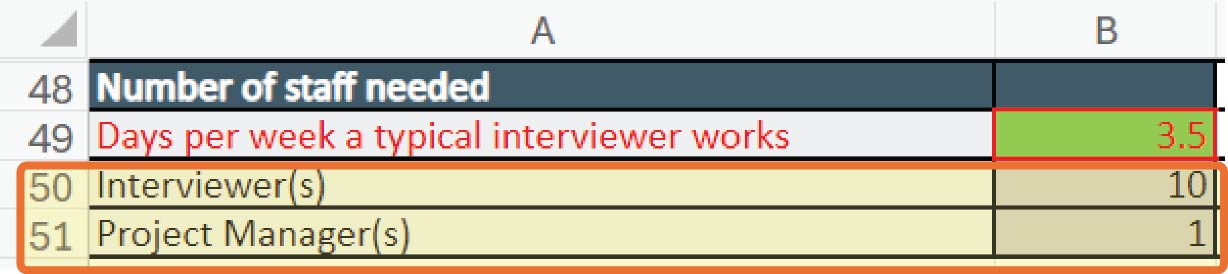
Long Description.
The column header in column A is the number of staff needed. The data are given from rows 49 to 51. Row 49 is highlighted in red and rows 50 and 51 are selected.
Most of the budget for intercept surveys is allocated to labor. However, there are some ODCs associated with intercept surveys [e.g., hiring expenses, including advertisements (∼$25) and background checks ($50) per interviewer calculated in Cell AJ102 in Tab 2, based on the number of interviewers in Cell B50 in Tab 2D)], printing (if survey responses are being recorded on paper, calculated at the same cost as printing a PAPI survey in Cell AJ61 in Tab 2 and carried over to Cell AJ103 on the same tab) and mileage, tolls, and parking per day on-site for each interviewer. The latter is calculated based on the current General Services Administration (GSA) mileage rate, which may be entered into Cell B44 in Tab 2D and assumes that each interviewer is traveling at 45 miles per hour during their commute (Cell B38 in Tab 2D) and includes an additional 10% for parking, tolls, and other incidental travel expenses. Cell B46 in Tab 2D calculates the total expenses across all active days for each interviewer. This is multiplied by the number of interviewers and managers (in Cells B50 and B51 in Tab 2D) (Exhibit 3.29) to calculate a total mileage cost for all personnel in Cell AJ104 in Tab 2D, with an additional 10% per person (or $50 per person, whichever is higher) to cover any other additional interviewer expenses for mailings and supplies.
Intercept interviewers may record respondentsʼ answers on paper or a portable electronic device like a laptop or tablet. If laptops or tablets are being used for data entry, in addition to the need to create a web-based survey interface to facilitate electronic data entry, organizations may also wish to rent or purchase these devices. It may be more cost-effective to purchase them outright and reuse them for ongoing surveys or other business purposes, rather than rent them. Sample prices for mid-range Android tablets such as the Samsung Galaxy S7 and laptop computers or Chromebooks that can be used for data collection are included in Tab 2, Survey Costing Tool, in Cells AI107 and AI108, respectively (see Exhibit 3.30). Prices for these devices range from $130 to $600. For budgeting purposes, the final price that SHSOs opt to pay for these devices can be entered in Cells AI107 and 108. These costs are then multiplied by the number of intercept interviewers needed (Cell B50 in Tab 2D, Intercept Support Hrs+ODC) and added to the ODCs for intercept surveys in Cells AB102 and AB103 in Tab 2. If neither laptops nor tablets are being

Long Description.
Columns A H through A J are shown. The headers in rows 101 and 109 are intercept and incentives. Row 107 and 108 are highlighted.
purchased or if only one type of device is being purchased, users should enter “0” into the appropriate Cells (AI107 and AI108 in Tab 2).
In terms of incentives, the amount offered for intercept surveys may need to be higher than other modes to entice potential respondents to take the time to pause in the middle of their day when they are running errands or conducting business to complete the screener or survey in person. In addition, because of the mode, respondents may need to spend additional time answering questions. Thus, a recommended incentive is $10 to $15.
CATI Surveys
Similar to intercept surveys, but in contrast to CAWI surveys, CATI surveys are more time-intensive than resource-intensive, as interviewers are needed to conduct the survey with members of the sample by calling them on the telephone. While there are ODCs for CATI surveys associated with per-minute telephone call costs, labor accounts for the lionʼs share of costs for CATI surveys. Some of this time is used for training interviewers, which typically takes about 12 hours per interviewer. This includes time to review the script for the survey and prepare for questions about the survey from potential participants. Labor hours for training for the project team are provided in Cells C90–E90 in Tab 2, Survey Costing Tool. Labor hours for training interviewers are calculated in Cell AA90 in Tab 2 but are based on the number of interviewers identified in Cell B31 in Tab 2E, Telephone Support Hrs Calcs. However, most of the effort goes into making calls, recruiting respondents, and conducting interviews with those who agree to complete the survey. Like intercept surveys, labor hours for the project team (presented in Cells C91–E91 in Tab 2) (Exhibit 3.31) are static, but labor hours for interviewers for CATI surveys rely on several factors about which assumptions need to be made to determine the total sample and the level of effort. Like intercept surveys, the first key factor in determining the sample size is the number of completed surveys sought. This can be input in Tab 2, Survey Costing Tool, in Cell AJ40, which is then reflected in Tab 2E, Telephone Support Hrs Calcs, in Cell C5.
The next factor that needs to be estimated is the percentage of numbers that interviewers will call that are expected to be cellphones (Tab 2E, Cell C6). Given that telephone surveys for SHSO campaigns are likely to focus on drivers (e.g., adults 18 to 64), among this population, less than 1% are landline-only, based on the latest estimates from the National Health Interview Survey (NHIS). Therefore, this figure is often set at 100%. Older samples are likely to be more dependent on landlines.
The next key factor is the percentage of eligible adults who are expected to complete the survey (B9) after screening, consent, and provision of a time estimate (many decline before the first question). Multiplying this percentage by the total number of completions sought (C9) yields the total number of adults who need to meet the eligibility criteria (C13). Eligibility rate, which is the
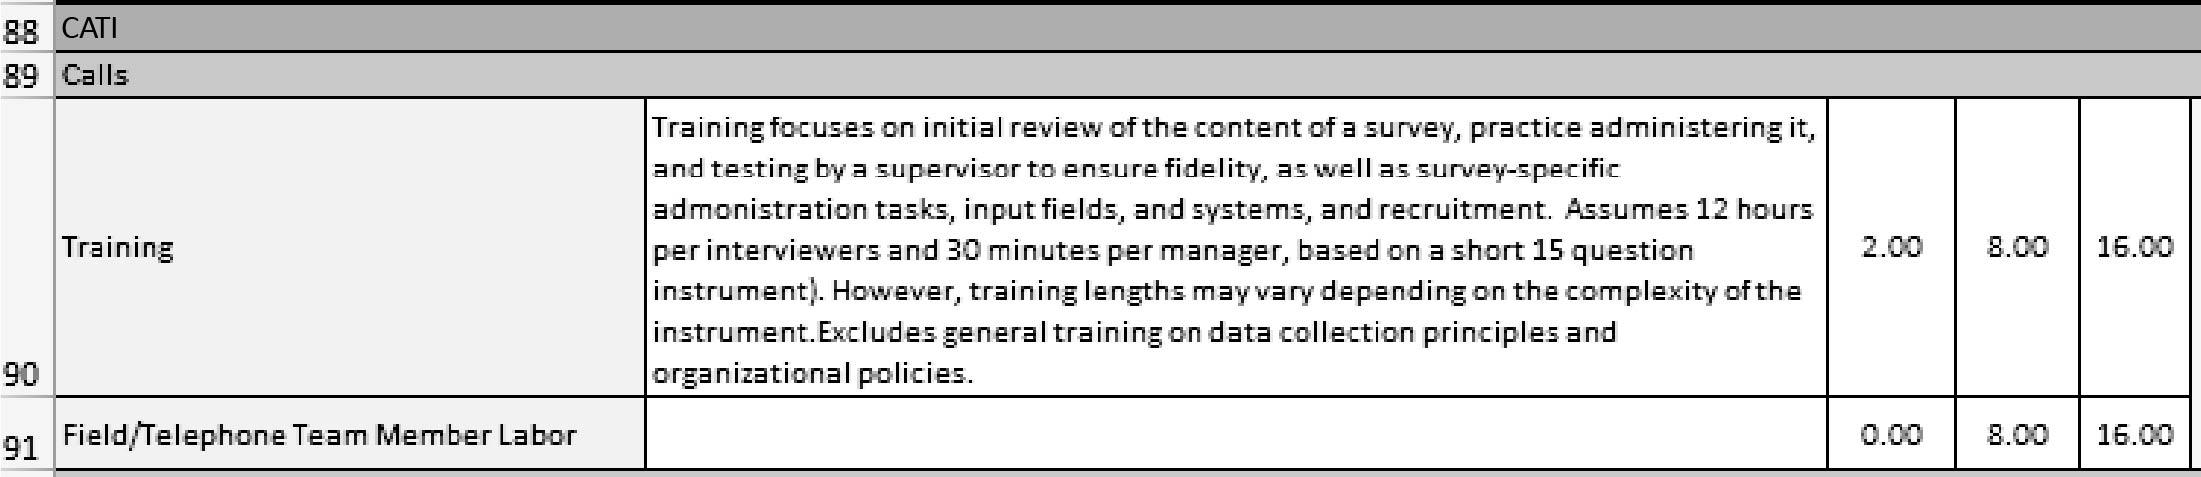
Long Description.
Columns A Through E are shown. The headers in rows 88 and 89 are CATI and calls. The data on rows 90 and 91 are highlighted.
percentage of adults who match all study criteria, can also be calculated. This is created by multiplying three figures against each other. These figures include the following:
- Adult cellphone rate (Cell B10) (Exhibit 3.32), which represents the percentage of the U.S. adult population with cellphones, excluding minor-only cellphones that have to be screened out. The rate varies by state, but the national average is 98%. For RDD samples, as described in the Sampling section, ∼90% is a conservative proportion, but phone numbers on a DMV list (also described in the Sampling section and the Recruitment section) are more likely to represent adults, given that DMV numbers focus on those with driverʼs licenses.
- Proportion of adults within the target geographical area (Cell B11) (Exhibit 3.32), which provides the percentage of those adults who complete the screener that will be in the target state, accounting for state-level geographic inaccuracies associated with cellphone sampling, for instance, when people keep the same number but move to a different state. For RDD, this may be as low as ∼85%, but phone numbers on a DMV list are more likely to represent adults with driverʼs licenses from a given state.
- Study eligibility rate (B12) (Exhibit 3.32), which is the percentage of those adults who complete the screener that will be in the target age range (e.g., between 18 and 64 years of age), based on age distributions for people with cellphones from the NHIS, with a discount to account for differential nonresponse (older adults respond at higher rates and so will be overrepresented among screener completions). For RDD, this may be as low as 65%, but given that phone numbers on a DMV list are more likely to represent adults within a given state because DMV numbers focus on those with driverʼs licenses issued in that state, this may be as high as 80%.
Multiplying these figures together yields the eligibility rate (B13) (Exhibit 3.32). When the total number of adults who meet the eligibility criteria (C13) is divided by the eligibility rate, this yields the number of households that must be successfully screened for the presence of an eligible respondent (Cell C14) to sufficient numbers of eligible adults who ultimately complete the survey (C9) and thus achieve the total number of completions sought (C5) (Exhibit 3.32). The number of households that must be successfully screened for the presence of an eligible respondent (Cell C14) is then divided by the screening completion rate (Cell B14) to yield the total number
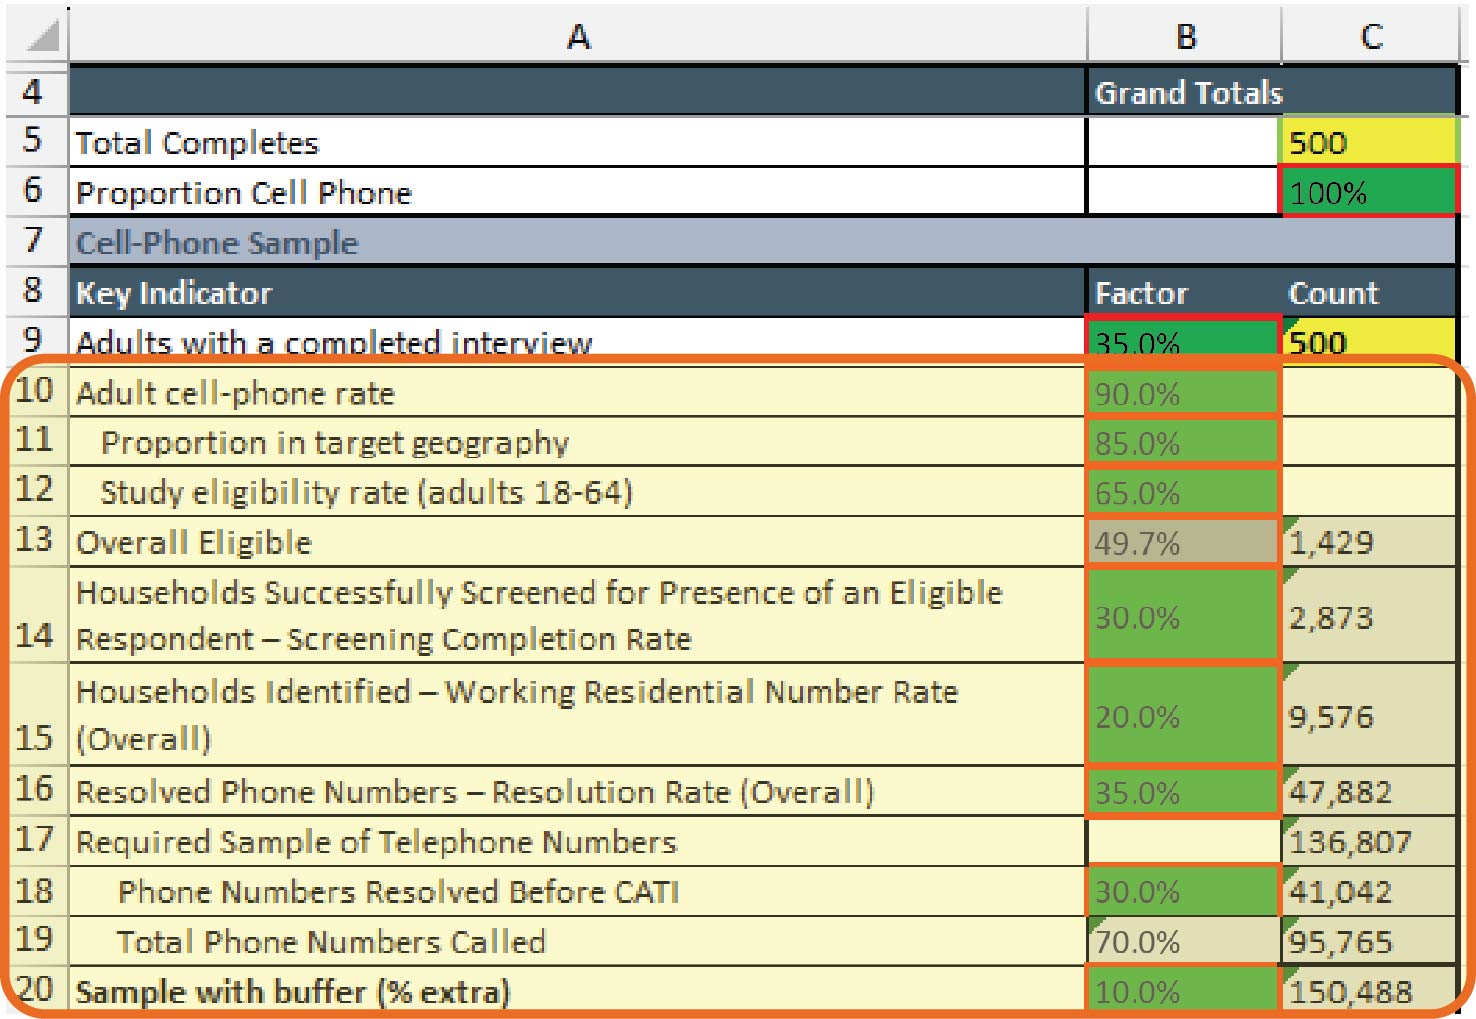
Long Description.
The first table shows the grand totals of the total completed and the proportion cell phones. In the second table, the column headers under columns A, B, and C are key indicators, factor, and count. The data given from rows 9 to 15 are highlighted.
of households that must be identified overall (C15) (Exhibit 3.32). The screener completion rate is the proportion of households that are expected to complete the screener to determine whether they are in the target state and the target age range. However, the total number of telephone numbers that need to be called to reach households where someone answers (C16) is higher than the number or proportion of numbers where that person is willing to complete the screener (C15). This is because some of these numbers may be non-working and/or business telephone numbers, or may not be active personal cellphone numbers. The total number of telephone numbers that needed to be called to reach someone likely to answer (C16) is calculated by dividing the total number of households where someone answers and is likely to complete the screener (Cell C15) by the working residential number (WRN) and active personal cellphone number (APCN) rates (Cell B15), in other words, the proportion of telephone numbers that are WRNs or APCNs.
For RDD, this proportion will be lower (∼30%) than for numbers from a DMV list which may more accurately identify adults within a given state, given that those numbers most often represent adults with a driverʼs license (∼40%). Using a DMV list also allows interviewers to ask to speak to the specific person identified in the list, rather than anyone who answers, also ensuring a higher likelihood of reaching an eligible potential respondent. However, a larger sample of telephone numbers (C17) will be needed to achieve the total number of completions targeted to account for the following:
- Non-working numbers, business numbers, and non-active cellphone numbers; and
- Instances where:
- Someone does not answer;
- Someone answers but is not willing to complete the screener; or
- Someone answers and is willing to complete the screener, but is not eligible for the survey.
The size of this sample (Cell C17) is calculated by dividing the total number of telephone numbers that needed to be called to reach someone likely to answer (C16) by the anticipated resolution rate (B16), which refers to the proportion of numbers that are identified as WRNs and/or APCNs versus non-working and/or business numbers, which are referred to as resolving phone numbers. For RDD, this proportion may be up to 35%, but for numbers from a DMV list, this may be lower, given that the phone numbers are more likely to be accurate.
It may be possible to purchase lists of telephone numbers from vendors or acquire them from the state DMV. For example, the Marketing Service Group Inc. (MSG) has the Advanced Cellular Frame Sample that randomly generates a list of cellphone numbers for survey samples that may be limited to specific areas (states, counties, zip codes) based on the address associated with the phone number (if available) and otherwise based on the rate center of the cellphone number, which identifies the area that a cellphone is calling from to establish billing rates. MSG also offers a service, like many such vendors, that pre-screens telephone numbers to screen out some non-working numbers; hence, increasing the likelihood of calling numbers where someone does answer. Typically, their Advanced Cellular Frame Sample is $0.04 per record, with an additional $0.055 per record for screening out non-working numbers via their cell Windows Internet Name Service (WINS). Using a service like this results in greater geographic accuracy than simply basing the geographic assignment on the area code and will save money by reducing the number of calls made to non-eligible respondents. This is particularly important for cellphones, which, by law, must be manually dialed, unlike RDD samples, where software can be used to randomly generate and auto-dial landline numbers. For example, using cell WINS will help identify some proportion of the randomly selected sample as non-working, which therefore does not need to be called (Cell B18). For RDD, this should be about 30%, but for calls using a list from the DMV, this could be 0%, as those telephone numbers should all be working. Multiplying this proportion by the required sample of telephone numbers (C17) will yield the number of
phone numbers resolved before interviewers start making calls (Cell C18) and subtracting this number from that total number for the required sample, will yield the total, estimated number of numbers that ultimately need to be called (C19). Finally, in terms of the sample size, it may be helpful to add a buffer (Cell B20) and make more calls in case the number who answer or are eligible has been overestimated. Multiplying the total number of estimated numbers that need to be called by this buffer yields the total recommended sample (Cell C20). It may also be helpful to pay local/state phone providers to create survey- or organization-specific numbers from which to call with a custom caller ID that identifies the organization that interviewers are calling from or on behalf of. It also helps if the number has an in-state area code. The in-state area code and caller ID will prevent the number from being flagged as SPAM/Scam. This will increase the likelihood of someone answering and thus save time making calls that are not answered.
The sample size also determines the level of effort. In addition to the sample size, the other key variables in determining the level of effort are the estimated call hours needed to get one adult to complete the screener (Cell B24), referred to as the pre-screener call hours per screener complete, and the estimated call hours needed to complete one survey, based on the number and complexity of questions in the survey (Cell B25), referred to as the post-screener call hours per interview. For pre-screener call hours, this could be as much as 1 hour for calls made to an RDD sample, but for calls to numbers for a DMV list, this could be 30 minutes, given that the numbers on that list are more likely to be working and accurate. These figures, along with the percentage of adults ultimately expected to complete the survey (Cell B9) and the overall percentage of adults who are deemed eligible (Cell B13), are used to calculate the overall number of hours interviewers are anticipated to spend to get one complete survey (Cell B26). Multiplying this figure by the number of completed surveys sought (Cell C5) yields the total number of call hours for the survey (Cell B27), which is then multiplied by a paid-to-call ratio (Cell B28), which provides a ratio that accounts for the time interviewers spend on calls as well as between calls and the time they spend clocked in but not logged in (e.g., bathroom breaks). This yields the total paid hours for interviewers for the survey (Cell B30), which is reflected in Cell AA91 in Tab 2, Survey Costing Tool, and used to calculate labor costs for this activity, based on hourly rates for interviewers in Cell AP34, also in Tab 2.
Tab 2E, Telephone Support Hours Calcs, also allows users to indicate the number of interviewers that they anticipate being assigned to conduct a given CATI survey (Cell B31). Along with the number of days that interviewers are typically working in a week (Cell B32), and assuming an 8-hour workday, this is used to calculate the number of days that it will take the interviewers to collect the targeted number of completed surveys (Cell B33). In addition, Cells B21–B23 also provide calculated response and yield rates for reporting (see Exhibit 3.33):
- Cell B21 provides the Council of American Survey Research Organizations (CASRO) response rate for reporting, should this be needed, based on the interview completion rate (Cell B9), multiplied by the screener completion rate (Cell B14) and the overall resolution rate (Cell B16).
- Cell B22 provides the yield rate calculated by dividing the number of completions sought by the estimated sample size of phone numbers that need to be dialed, excluding those identified as non-working, to achieve those completions.
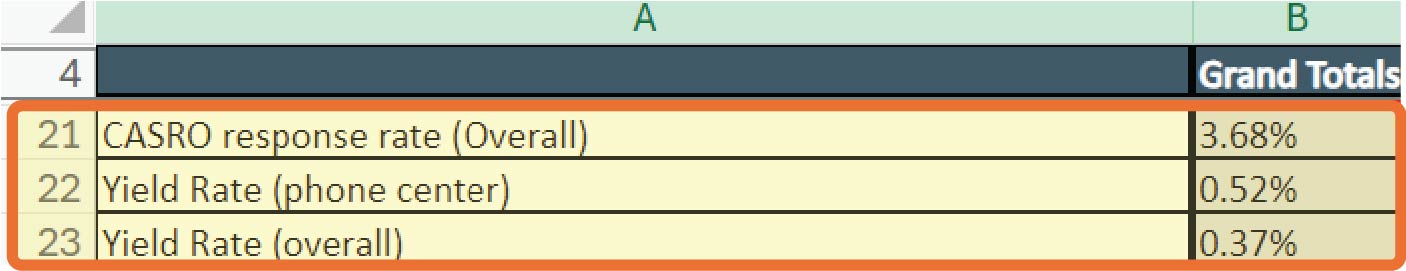
Long Description.
The column header under column B shows grand totals. The data from rows 21 to 23 are highlighted.
- Cell B23 provides the overall yield rate, also calculated by dividing the number of completions sought by the estimated sample size of all phone numbers, including those identified as non-working, to achieve those completions.
Most costs for CATI surveys are allocated toward interviewer labor. However, there are also telephone per-minute call costs (Cell AB89 in Tab 2, Survey Costing Tool) based on the average per-minute cost entered in Cell AJ100 (also in Tab 2) multiplied by the number of minutes in the total number of call hours (Cell B27 in Tab 2E). CATI respondents may spend some time on the phone having interviewers ask them each question and responding to each question. As a result, incentives for CATI surveys should reflect this additional time, and thus, an incentive of $10 to $15 may be appropriate.
Sample Monitoring and Adaptive Design
Some surveys use an adaptive design, where recruitment and outreach methods or modes change depending on the numbers and types of respondents who complete the survey during the fielding period. Adaptive designs are used to ensure representativeness or oversampling of particular groups. This does require monitoring survey responses on a real-time basis, for instance, tracking response rates by strata, to trigger adaptive design elements like sending additional mailings to different parts of the sample to raise response rates. This requires the sampling/methodology/analysis team to design and run a sample monitoring program, including making projections about when a different adaptive design element will need to be deployed. This is typically done by using a statistical software package like Statistical Analysis System (SAS) to create a program to monitor production and returns, and, depending on the scale or complexity of the survey, predict response rates. There are corporate resources you can use to make this task more efficient, including dashboards, but it depends on the specific use case. Hours for the sampling/methodology/analysis team to conduct these activities appear in Tab 2, Survey Costing Tool, in Cells F107–K109 and are pulled from Rows 20–21 in Tab 2A, Sampling Support Hours, depending on the number of modes selected at the top of Tab 2, and if the survey is using an adaptive design.
Preparation for Data Analysis
To prepare the data collected in PAPI or CAWI surveys that involve mailing for analysis, the mailing team needs to engage in several post-fielding activities. The level of effort for different members of the mailing team differs depending on whether a PAPI-only or CAWI-plus-mailing approach was used and what form the initial introductory and reminder communications took (letters or postcards). All modes require labor hours to link received surveys to the cases or addresses to which they were sent. These hours are calculated based on the modes selected in Cells C4–G4 at the top of Tab 2, Survey Costing Tool, by drawing in the hours reflected on Rows 13–15 in Tab 2C, Mail Support Hours, for each mode into Cells T118–X123 in Tab 2. PAPI surveys also require hours and ODCs for applying various CADE approaches that rely on OCR to automatically scan completed paper surveys and enter the data from those surveys into electronic databases for later analysis and QC. Using OCR typically requires designing the paper instrument during the survey development process to collect data in a way that facilitates scanning and programming the OCR software, for instance, Fortran, to recognize specific fields and code them appropriately in the database. There may be a per-page fee for OCR scanning (Cell AJ79 in Tab 2, Survey Costing Tool), which assumes a two-page survey with 10 questions and a scanner that scans 110 pages per minute. QC or OCR verification also requires labor hours. Typical assumptions for the level of effort for OCR verification assume that 50% of all surveys scanned by OCR should be checked, and each survey takes 2 minutes to review and verify (Cell W24 provides a total estimate for time, based on the number of completed surveys
sought), with some requiring editing (Cell X121, also based on the number of completions) to ensure accuracy.
Data Cleaning
Testing surveys before they are fielded should reduce the extent to which data will need to be cleaned in the data preparation phase. This should ensure that responses line up with the questions asked. However, some data cleaning issues may arise from how respondents chose to answer questions in the survey. Three typical issues that arise in survey responses include speeding, straight-lining, and high refusal rates. Speeding is typically primarily associated with CAWI surveys but can occur with CATI or intercept surveys, and refers to respondents rushing through surveys to complete them in less time and still receive an incentive. As a result, their responses may not accurately describe their true perceptions. Speeders can be defined as those respondents who completed the survey in less than one-third of the median duration of all other survey completions. This can be tracked via start and finish times for CAWI surveys. Likewise, when respondents select the same responses for all subitems in grid item questions (those displayed in a grid where there is the same array of responses, such as “Strongly Agree,” “Agree,” “Neither Agree nor Disagree,” “Disagree,” or “Strongly Disagree” for several subitems under the same question), this is referred to as straight-lining, (i.e., a straight vertical or horizontal line can be drawn through all of the responses they select). This may indicate that they are not paying attention to the subitems and thus are selecting the same responses to save time. Like speeding, their answers to these questions may not accurately reflect their true perceptions. Finally, in terms of data cleaning, some respondents may also skip or refuse to answer questions, either to save time or because they are not knowledgeable or have no exposure to, or perception about the topic of the survey. When respondents have skipped or refused more than 50% of the eligible questions, this is referred to as a high refusal rate. It is best practice to remove all responses from respondents who have exhibited one or more of these tendencies in their answers to remove bias from the survey data. Hours for the project manager and the project support roles for data cleaning and/or other QC reviews are included in Cells D127–E126 in Tab 2, Survey Costing Tool.
Weighting and Delivery
Once data has been cleaned, it may need to be weighted before analysis. As noted in the Sampling section, when collecting responses to a survey, assuming a probability sample, organizations conducting surveys measuring the effectiveness of traffic safety messaging campaigns should try to ensure that the characteristics of those who respond to the survey are reflective of the audience that the traffic safety messaging campaign is seeking to reach. This can be done by targeted recruitment of members of that audience or, when using an adaptive design, via increased reminders and adjusted incentives for specific groups within that audience, to ensure the right numbers/proportions of respondents in each group. However, despite efforts at the beginning of or during the survey fielding period to ensure a representative sample, it can still be difficult to gather responses from all groups in the right proportions. This may be due to errors in the sampling population or non-responsiveness of specific groups of respondents. For example, members of certain racial, ethnic, or language groups may be reluctant to respond to surveys. Similarly, different age groups may be more or less likely to respond to surveys depending on the mode of the survey. This may mean that surveys about traffic safety messaging campaigns that are aimed at the general public, but which seek to address risky behaviors that, for instance, younger male drivers are more likely to engage in, may receive more responses from older adults and fewer responses from younger male drivers. Presenting the results of such a survey without weighting the data may lead to inaccurate conclusions and biases about the effectiveness of the campaign, and the data may not reflect the true views of the audience on which the campaign focuses.
Therefore, the purpose of survey weighting is to make sure that the data collected and the conclusions derived from that data accurately reflect the true perspectives of the campaign audience. This is done by applying different weights to the results from different groups of respondents, in other words, multiplying results for members of those groups by different factors, so that the proportions of each group relative to the total sample are equal to the proportions of those groups within the overall population for an area like a city, county, or state where the campaign is being implemented (i.e., representative). The values for those weights differ, depending on how many members of certain groups have responded to the survey. Therefore, if certain groups are not well represented in the final set of respondents, higher weights are assigned to compensate, and lower weights are assigned to groups that may be overrepresented.
To determine the weights that need to be applied, it is important to know what the proportions for each group are in the total population based on demographic variables like age, gender, race/ethnicity, or education level, and the proportions of respondents in each group, based on the same variables. When weights are applied, the proportion of each group within the final set of respondents should align with the proportions for demographic distributions in the total population or audience.
As with creating a sample, this is another step where the sampling/methodology/analysis team plays a significant role. Hours for the senior, mid-level, and junior statisticians to support weighting for all modes of surveys are included in Cells I131–K131 (Exhibit 3.34). However, Cells I132–K132 also include optional hours for these members of the team to calibrate intercept study surveys to probability-based estimates if studies that combine non-probability and probability-based approaches are being used (see Exhibit 3.34). If so, a senior statistician, with support from the other statisticians, would use calibration to adjust the non-probability component to the probabilistic one.
These activities also include hours for the project team (Cells C131–E132) to liaise with and manage these members of the sampling/methodology/analysis team. In addition, Cells C133–K133 include hours not only for the project team but also for all members of the sampling/methodology/analysis team, including the senior, mid-level, and junior research methodologists, and the statisticians to contribute to the methodology portion of the final report. Most members of this group, save for the project teamʼs subject matter expert, may also be involved in data delivery (Cells D134–K134), which refers to matching survey responses to the right questions and presenting the data in tables.

Long Description.
The column headers are task, notes, and a third column. The third column is divided into two sections Project Team and Sampling or Methodology. The project team contains three sub-headers titled subject matter expert, project manager, and product support. The sampling or methodology team contains four sub-headers titled research methodology, research methodology, research methodology, and senior satisfaction. Two row headers given below are survey development, and weighing and delivery. The data are represented from rows 131 to 134. The columns under project team and sampling or methodology are highlighted.
Analyzing Data and Reporting Findings
In addition to the work that the project team may conduct in collaboration with the sampling/methodology/analysis team to prepare the data for analysis, there may also be some activities that the project team needs to complete before analysis can begin. This will include creating an analysis plan. Frequently, a high-level analysis plan is created during the survey development phase, but this plan may need to be revised, refined, or operationalized in the data analysis phase to add further detail. This may involve creating a data dictionary that lists the values for responses for each question and coding that needs to be applied to each of the variables (e.g., Strongly Agree = 4; Agree = 3; Disagree = 2; or Strongly Disagree = 1).
Next, the responses in the final dataset may need to be coded according to the data dictionary to analyze the data. This may involve replacing response phrases with values or combining responses to decrease the number of different types of responses. For example, Strongly Agree and Agree, and Disagree and Strongly Disagree could be combined into Agree and Disagree, respectively, to strengthen comparisons between responses. This may be a time-consuming process that could require several team members to code the variables and cross-check each otherʼs work to ensure consistency. Hours for members of the project team to create an analysis plan and coding variables are included in Cells C137–E138 in Tab 2, Survey Costing Tool.
Thereafter, the data can be analyzed. There is a wide variety of statistical analysis techniques that can be applied to data, and to survey data specifically. To catalog and comprehensively explain all the techniques that could be applied would require a textbook in and of itself (and likely several textbooks) and learning these techniques could take several years of specialized study and may not be useful for users of the interactive traffic safety messaging campaign evaluation costing tool and thus also not useful for this guide. SHSOs implementing traffic safety messaging campaigns may want to hire individuals or organizations with this specific expertise in statistics if this capacity does not exist within their organizations. However, it is important for SHSOs to be aware of relevant statistical analysis techniques to request that such individuals apply to their survey data, and to have some understanding of how to interpret the results of those analyses.
Therefore, for the tool and this guide, the research team focused on the most commonly applied types of statistical analyses for the type of data collected in traffic safety messaging campaign surveys.
It is important to know what type of data has been collected.
- Numerical data includes the following:
- Interval data, which has an equal distance or interval between each data point, and the values can be ranked from lowest to highest, for instance, times of day that a respondent is using a bicycle for commuting (e.g., 8:00 a.m., 9:00 a.m., 10:00 a.m.).
- Ratio data, which also has equal intervals and can be ranked, but has a true zero value (e.g., a respondentʼs age in number of years).
- Categorical data includes the following:
- Nominal data, which falls into different categories or classes with no hierarchy to the data, such as vehicle type or seating position.
- Ordinal data, which is categorized like nominal data, but unlike nominal data, has some hierarchy or order and, unlike interval data, has no equal distance between categories, for instance, how often a driver or passenger wears their seatbelt (e.g., always, sometimes, rarely, and never).
Knowing the type of data collected helps determine how it should be described using descriptive statistics. Describing the data can include identifying and summarizing the characteristics
of the respondents in terms of demographics, or the number of responses of a given type (for instance, “yes” or “no,” levels of agreement) for each question. These are typically described as both a number that represents the frequency with which that response was provided as well as a percentage of how many times that response was provided relative to the number of all responses to the same question in the survey data. This is referred to as frequency distribution.
Another commonly applied set of descriptive statistics is measures of central tendency, which include the following:
- Mean is typically understood as the average response.
- Median represents the middle value within the range of values in responses from the lowest to the highest or the smallest to the largest.
- Mode is the most frequent response value.
Other descriptive statistics either inform these measures of central tendency or rely on them. These include measures of variability, like the following:
- Range represents the difference between the highest and lowest or largest and smallest values (or scores) in response to each question, and is used to identify the median.
- Standard deviation is the average difference (or deviation) for each score from the mean.
- Variance is the average of squared standard deviations and describes how far apart scores are from each other and from the median.
For reporting to most members of the public and organizational stakeholders who are not researchers or evaluators, providing descriptive statistics is usually sufficient for their needs. This type of analysis can provide them with a sense of who completed the survey and what most of those who completed the survey think or know about what the traffic safety behavior campaign focuses on, what they think of the campaign materials themselves, and how they might change their behavior accordingly. Descriptive statistics can provide critical insights that allow future implementations of the campaign to be adjusted accordingly. However, SHSOs may extrapolate the results from the survey to the broader audience for the campaign and make inferences based on the data. Inferential statistical analyses can look at the relationship between variables like demographics, exposure, knowledge, attitudes, self-reported behaviors, or behavioral intention. While descriptive statistics summarize the data, inferential statistics help make sense of the data and can be used to make predictions based on the data. For example, SHSOs may want to compare what respondents knew or thought about the traffic safety behavior before being exposed to the campaign versus what they know or think after exposure, or to compare the extent to which they report engaging in the traffic safety behavior now as opposed to before. In addition, they may also want to see how different demographic groups have responded to the campaign, especially if there are specific demographic groups, for instance, respondents grouped by age, gender, racial/ethnicity, locality (rural versus urban), or language, who are more at risk of injury or fatality due to traffic safety issues. SHSOs may also want to use inferential statistical analyses to make estimates about the broader audience for the campaign, based on survey data. For instance, if a certain percentage of male drivers in the survey sample viewed the campaign materials in a positive light, inferential analyses can be used to estimate the extent to which the campaign materials will also appeal to a similar percentage of male drivers in the population in the location where the campaign is being implemented.
It should be noted that, given that the sample for a survey is never the same size as the actual audience for the campaign, survey results will always be influenced by some level of sampling error. Sampling error refers to the difference between a sample statistic, which is a measurement of some aspect of the sample (such as the mean responses for a given question), and a parameter, which is a measure that describes the whole audience or population. Inferential statistics can be used to account for sampling errors by calculating and reporting a confidence level and
a confidence interval. Confidence levels describe how confident the researcher or evaluator is that differences or variability in a particular sample statistic will reflect differences in a similar parameter for the audience. They are typically represented as a percentage, with higher percentages reflecting higher levels of confidence and lower percentages reflecting higher levels of uncertainty. Confidence intervals reflect the range of values in which the value for a given audience parameter is expected to fall. Wider confidence intervals represent wider variability and thus less certainty. SHSOs should look for a confidence level of around 95% when reviewing estimates to have greater certainty that sample characteristics will match or align with audience characteristics. Inferential statistics can also test hypotheses about the data, for example, that exposure to the campaign will result in less risky traffic safety behaviors.
Hypothesis testing typically relies on tests of comparison, correlation, or regression. Comparison tests compare means, medians, or rankings of scores for two or more groups. They are either parametric or non-parametric, meaning that they either make assumptions (parametric) about the distribution of values (e.g., demographics) in the audience that the sample is drawn from or do not make assumptions (non-parametric). If the distribution of values in the audience follows a normal distribution, if the sample size is large enough to be sufficiently representative of that audience, and if the variances in the sample and audience are similar, then parametric tests should be used. If not, then non-parametric tests are best. Likewise, parametric tests can be used on means. Common parametric comparison tests include t tests, which test differences in means for two samples/groups, for example, between drivers within the sample grouped by age (e.g., 18 to 44 years of age versus 45+ years of age), and analysis of variance (ANOVA) tests, which test differences in means for three or more samples. A common non-parametric test that can be used for traffic safety messaging evaluation survey data is the Wilcoxon signed-rank test, which compares distributions of values for two samples, such as pre-/post-exposure responses about perceptions of campaign materials.
Correlation tests are used to identify the extent to which two variables correlate or are associated with each other, in other words, how changes in one, for instance, exposure to campaign materials, are related to changes in the other (e.g., speeding). Common correlation tests include the chi-square test of independence, which can be used with nominal data, Pearsonʼs r, which can be used with interval and ratio variables, and Spearmanʼs r, which can be used with ordinal, interval, and ratio variables, and when the data is not normally distributed. Finally, regression tests are used to determine whether changes in one variable predict or cause changes in another. Different types of regression tests, including simple and multiple linear regression tests and logistic, nominal, and ordinal regression tests, are used depending on the type and number of variables being analyzed.
Hours for members of the project team for survey data analysis activities are included in Cells C139–E140 in Tab 2, Survey Costing Tool, and can be adjusted depending on the types of analyses conducted. Hours are only included for the project team for these activities, assuming that team members have some statistical expertise already. However, hours can also be added for the sampling/methodology/analysis team to conduct more complex analyses like correlations and regressions in Cells F40–K40.
The final set of activities in this step focuses on reporting. Like focus groups, in the reporting phase of survey data analysis, the goal is to translate the analyzed data into meaningful insights that stakeholders can use to inform decisions. Survey findings reports are typically comprehensive documents that require some time (several weeks to up to 2 months) for initial drafting, review, revision, and finalization. The report can include an executive summary that encapsulates the entire report, summarizing objectives, methodology, and the most significant findings. This is typically written after the main text of the report is drafted but is included in the document before the main text of the report so that the most significant findings can be read first. The main
text then begins with an introduction to the survey and study. This introduction describes the context for the study/survey, outlines the studyʼs objectives, and provides background information to contextualize the survey findings. The next section focuses on methods and describes how the survey was developed, whether survey items have been newly developed, or whether they are based on existing validated items and/or scales, how the survey sample was identified and drawn, including recruitment strategies and communications with potential participants, and how the surveys were administered, especially how different modes were administered. The methods section should also describe how the data was cleaned and the statistical techniques or approaches used to weight and analyze the data. The findings section comes next. This section should describe results in terms of respondent demographics, followed by descriptive statistics that summarize overall responses to the survey questions. If respondents have been subdivided into smaller groups based on demographics or other characteristics, and their responses compared to each other, or if other additional inferential analyses have been conducted, those results should be presented next. Thereafter, the discussion section of the report allows the project team to interpret the findings within the context of the research objectives, drawing conclusions and implications from the findings and proposing recommendations for changes to the traffic safety messaging campaign.
The executive summary that precedes the main text of a report allows readers to quickly identify key findings from the survey. Another means of drawing their attention to these key points is to host a briefing session that distills key findings into a concise format for stakeholders. Preparing a briefing session for a survey follows the same steps and approaches that should be followed when preparing a briefing session for a focus group study. This includes tailoring content to the audienceʼs needs and sharing clear key messages derived from findings, implications, and recommendations using visual aids, such as charts and graphs, to improve understanding of the findings and promote discussion. Providing an opportunity for questions and answers as part of the briefing session can encourage stakeholder interaction and allow the project team to clarify specific aspects of the study. Thereafter, stakeholders can review the rest of the report at their own pace. Preparing and presenting a briefing, whether it is on focus group findings or survey results, should not take a great amount of time, typically a few days to a week, depending on how complex the survey and findings may be; however, the briefing is helpful to ensure ongoing stakeholder buy-in.
Hours for members of the project team, including the subject matter expert, the project manager, and the project support roles for reporting and briefing activities, are included in Cells C141–E143 in Tab 2, Survey Costing Tool.


