Evaluating Traffic Safety Campaigns: A Guide (2025)
Chapter: 1 Background and Introduction

CHAPTER 1
Background and Introduction
This chapter provides background and introduction to BTSCRP Project BTS-18, “Objectives, Components, and Measures of Effective Traffic Safety Public Awareness and Education Efforts,” including task descriptions.
Background
For Task 6: Develop a Practical Framework, Including Data, Methods, and/or Tools, for Evaluating Traffic Safety Campaigns, the research team created an interactive costing spreadsheet accompanied by a detailed guide and quick reference guide that State Highway Safety Offices (SHSOs) and other stakeholders can use for the selection and development of methods for evaluating traffic safety messaging campaigns. The information in the tool is based on data collected in Task 2: Describe and Assess the Variables, Methods, and Preliminary Data Requirements used by SHSOs to Measure the Effectiveness of a Variety of Traffic Safety Campaigns and in Task 3: Identify the Financial Resources and Expertise Needed to Accomplish the Evaluation. While Task 2 categorized and evaluated the data and types of data collection needed to support effective analyses, Task 3 focused on cataloging the costs for applying the data-collection methods and measures identified and described in Task 2. This provided the detail needed for Task 6 on how to estimate the time, labor, and financial resources required to support varying types of analyses and the expertise required to implement them.
This interactive tool will provide SHSOs with the typical costs for applying each of the evaluation methods described in Task 2. It includes steps and activities for each type of evaluation, roles needed to complete the evaluations, hours for each activity, and resource estimations of other direct costs (ODCs) that may fluctuate based on location, timing, the type of evaluation, the number of respondents/participants, or other inputs. Given this variation, the tool is not intended to provide an exhaustive list of costs but rather ranges for each type of cost and assumes that SHSOs will research more realistic and timely local costs for each activity. The tool includes input fields for SHSOs to add those local costs to the spreadsheet, which will allow it to calculate totals and provide budgets that are more applicable to a given campaign evaluation and local circumstances. The costing tool is available as Appendix A on the National Academies Press website (nap.nationalacademies.org) by searching for BTSCRP Research Report 14: Evaluating Traffic Safety Campaigns: A Guide.
This report is a guide on how to use the tool. It provides guidelines for SHSOs to follow in researching local costs and developing budgets for their evaluations using the tool. It also discusses the factors that SHSOs may want to consider in selecting different methods for evaluating their campaigns. Collectively, these products are intended to help SHSOs select appropriate data-collection methods based not only on cost but also on the measures of interest that they select
for their campaign evaluation. The quick reference guide is available in an associated publication, BTSCRP Web-Only Document 7: Objectives, Components, and Measures of Effective Traffic Safety Public Awareness and Education Efforts.
Introduction
Traffic safety public awareness and education efforts are two countermeasures that traffic safety professionals, including those working at SHSOs, employ to improve roadway user safety. These efforts are intended to share messaging that will raise awareness of dangerous roadway behaviors, increase knowledge of the impact of these behaviors and safer alternatives, change attitudes about both those behaviors and the alternatives, and ultimately, change those behaviors. Exposure to a traffic safety message is assumed to increase awareness of a given traffic problem (i.e., knowledge that the problem exists) in a community. Ideally, knowledge that the problem exists also leads to knowledge of the prevalence and severity of the problem and to safe alternatives to risky or hazardous traffic behavior, which have been shown to be effective motivators of behavior change (Tay 2005; Tay and Watson 2002). However, merely increasing knowledge, for example, will not necessarily change behavior (McCluskey and Lovarini 2005). Instead, behavior change needs to be encouraged through both education and messaging that promotes a change in attitude via changes in perceived risk, susceptibility, and behavioral control, as well as the subjective social norms that play a role in peopleʼs chosen behaviors, including their perceptions of how others view their behaviors. As attitudes shift, individuals may be persuaded or motivated to change their behaviors, reject risky behaviors, and adopt safer practices.
For maximum effectiveness and reach, these traffic safety messages are often shared as part of a carefully planned and coordinated traffic safety campaign, described by Delhomme et al. (2009) as “purposeful attempts to inform, persuade, and motivate a population (or subgroup of a population) to change its attitudes and or behaviors to improve road safety, using organized communications involving specific media channels within a given time period.” This definition highlights the use of mass media to reach a large group of people or expose them to a particular message at a certain time. Examples of these channels include digital media (websites, streaming video, podcasts, satellite radio, cable television, and mobile, including mobile-friendly websites and apps), social media (such as Facebook, Instagram, X [formerly known as Twitter], YouTube, and Twitch), broadcast (terrestrial radio and television), print (magazines and newspapers), or out-of-home media (billboards, posters, and bus advertising). Sharing traffic safety messages via some combination of these channels can provide a relatively low-cost and broad-based way for traffic safety professionals to discourage unsafe behaviors and encourage safe behaviors without requiring the same logistics and resources as deploying enforcement or changing infrastructure.
However, there needs to be a way to determine whether a given traffic safety campaign is achieving its desired outcomes. Use a systematic method for collecting, analyzing, and using data to examine the effectiveness and efficiency of programs and to contribute to continuous program improvement to determine what the campaign has achieved or is achieving, what has not been achieved, and what changes need to be made to reach campaign goals. There are multiple measures of campaign effectiveness that you may want to evaluate: whether anyone has seen it (awareness); how many members of the public are aware of the campaign (reach); what those who are exposed to it think of it and what they think of the behavior it is trying to change (attitude); what they learned from it (knowledge); what they intend to do based on being exposed to it (behavioral intention); and whether they act on that (behavior change).
There are methods for evaluating the effectiveness of such campaigns, including collecting and reviewing media metrics; conducting questionnaires/surveys, interviews, and focus groups; using roadside surveys/observations and naturalistic driving studies; and reviewing citations and crash data. These methods and measures serve the following purposes in terms of evaluation:
- Formative evaluation is typically conducted during campaign development. It provides information on the audienceʼs potential attitudes and behavioral intention to determine whether changes to the campaign materials or channels for dissemination are needed before implementation.
- Process evaluation is conducted during implementation to determine whether the campaign has been implemented as intended.
- Outcome evaluation measures the short-term and intermediate effects of the campaign on the intended audience (i.e., determining whether the campaign has achieved its intended objectives and goals).
- Impact evaluation measures the long-term effects of a mature or long-running campaign and determines the extent to which the outcomes achieved can be attributed to the campaign versus other factors.
The type of evaluation often determines the methods used and measures applied. For instance, with regard to measuring the effectiveness of traffic safety campaigns, formative evaluations may involve focus groups or interviews to gather information on existing awareness of dangerous roadway behaviors, knowledge about and attitudes toward those behaviors, intent to engage in those behaviors, and actual engagement in those behaviors (at least through self-report) that can be used as a baseline to assess these measures after the campaign has been launched to determine its effectiveness.
Process evaluations may provide contextual information to identify what has made the campaign more or less effective. Process evaluations may involve tracking and monitoring where, when, and how traffic safety messages are being shared, including how often they are shared, which can contribute to measuring the reach of the campaign. Outcome and impact evaluations are both summative, describing what changes in awareness, knowledge, attitude, intention, and behavior the campaign has achieved. In terms of formative evaluations, these types of summative evaluations can also use focus groups and interviews to assess effectiveness. However, qualitative methods like these may only capture information from a relatively small group. Surveys, on the other hand, can capture information on awareness, exposure, knowledge, attitudes, behavioral intentions, and self-reported behavior from a larger swath of the population. Outcome and impact evaluation can also use media metrics, such as impressions, website traffic, and social media engagement data, to assess reach, but also awareness and attitudes. They can corroborate self-reports of behavioral changes using roadside surveys, observations, and naturalistic driving studies, including reviewing citations and crash data. Often, multiple methods are used to evaluate the same campaign to obtain different perspectives.
The following chapters describe the steps for SHSOs to apply these methods to evaluate the effectiveness of traffic safety messaging. Each description provides estimated labor hours for various personnel for planning and development, implementation, analysis, and reporting. It also includes the ideal experience, expertise, and skills each team member should have. In addition, the report describes ODCs beyond labor that may be needed to implement each method. This includes capital costs for equipment such as tablets, subscription costs for analysis software, or other temporary needs like web survey hosting, recruitment costs, incentives for respondents, and printing and mailing or telephone call costs. The report describes these costs in units that will allow them to be scaled to increase sample sizes, depending on SHSO budgets.
Campaign Evaluation Framework
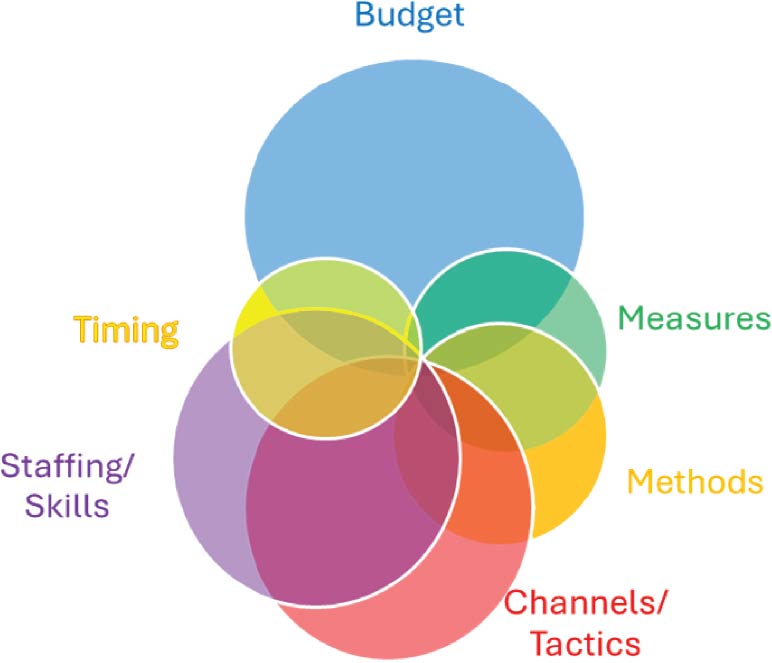
Several key factors influence the design and implementation of campaign evaluations, including channels and tactics used in the campaign, budget, measures selected to assess campaign performance, methods for gathering data on those measures, timing, and staffing/skills to conduct the evaluation. As shown in Exhibit 1.1, the factors interact with each other, and each may be more or less relevant in any given evaluation. Two sample campaigns with information on how particular aspects of each campaign drive the evaluations of those campaigns are presented.
Sample Campaign A
The state department of transportation (DOT) has planned a communications campaign focused on preventing motorcyclists from riding impaired. Research has shown that the group most likely to ride impaired is older males who typically own and drive another vehicle during the week and ride in the evenings or on the weekends. Campaign material encourages this audience to plan ahead if they are going out on their motorcycles and drinking, including identifying a designated driver of a car or truck, or ensuring that they have access to rideshare apps. To reach this primary audience, the campaign includes the following elements:
- A series of five 30-second TV ads to be aired between 4:30 p.m. and 7:30 p.m. on Wednesday through Saturday. These days and this time period have been selected to reach viewers if/when they are planning to go out for the evening, and because the budget is
- Lower on Wednesday/Thursday.
- Lower for this period than prime time on Wednesday to Friday.
- Higher for this period on Saturday as sports games are often aired during this time, but viewership is higher at this time on the weekend.
- A series of five 30-second radio ads to be aired during the weekday (Monday to Friday) morning drive time and afternoon drive time to reach the widest audience who will be commuting at these times.
- Streaming/connected TV ads during crime procedurals are favored by this audience, using the same content as the 30-second TV ads.
- A campaign website, Facebook page, Instagram account, and hashtag, which include the following:
- Information on incidence rates, consequences, and alternatives, including a page with links to discounted rideshare rides.
- Images on social media with QR codes that open the campaign page with links to discounted rideshare rides.

Long Description.
The campaign evaluation framework contains budget, measures, methods, channels or tactics, staffing or skills, and timing.
-
- Short URLs to different rideshare apps to be posted on Facebook and Instagram.
- Five videos, using the same content as the TV ads, shown via Reels.
- Five 10-second bumper video ads that are shorter versions of the TV ads/longer videos that appear before targeted video content. The campaign has focused on Facebook, Reels, and Instagram (all part of Meta) because their primary audience is more likely to use these social media platforms.
- Out-of-home advertising on the following:
- Billboards near entertainment districts in the stateʼs two largest cities with a campaign-specific URL only displayed on the billboards.
- Coasters distributed to venues that serve alcohol in those entertainment districts with QR codes that open the campaign page with links to discounted rideshare rides.
- Partnerships with rideshare apps to provide 1,000 discounted rides during the campaign period.
Application of the Campaign Evaluation Framework to Sample Campaign A
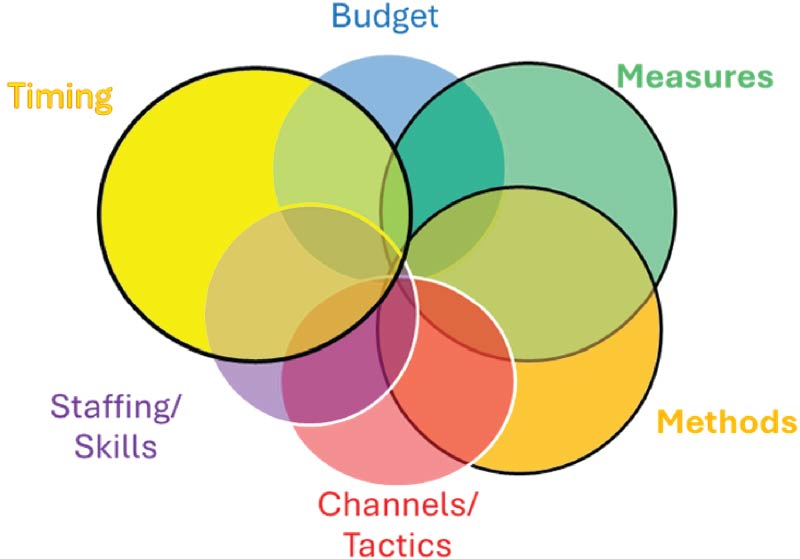
The state DOT has created an evaluation plan for the campaign. As shown in Exhibit 1.2, the main drivers for creating their plan are the channels/tactics included in their campaign, budget for evaluation efforts, and staffing/skills. Given that they have restrictions on the proportion of their budget that they can spend on evaluation within a given year, in terms of timing, they cannot conduct formative and summative evaluations and have opted for process and summative evaluation only. In addition, because their funding is limited, they have focused on a multimode survey and decided to capitalize on reporting of metrics that are provided free of charge, either by media partners whom they are already paying for media buys or are already included in the platforms they are using. These decisions affect the types of evaluation methods they can apply and the measures they can collect. Thus, the state DOT has selected the approaches to measuring the impact of the campaign shown in Table 1.
Sample Campaign B
The state DOT is implementing a traffic safety campaign focused on pedestrians entering the roadway at night, where they might be struck by a car. They have identified this as a problem in both rural and urban settings in the state. The campaign focuses on the following:
- Only cross the road at marked intersections.
- Do not assume drivers can see you, even though you can see them.
- Minimize the amount of time spent in the roadway.
- Avoid walking in areas without sidewalks.
Long Description.
The framework contains the following in descending order: budget, channels or tactics, staffing and skills, methods, measures, and timing.
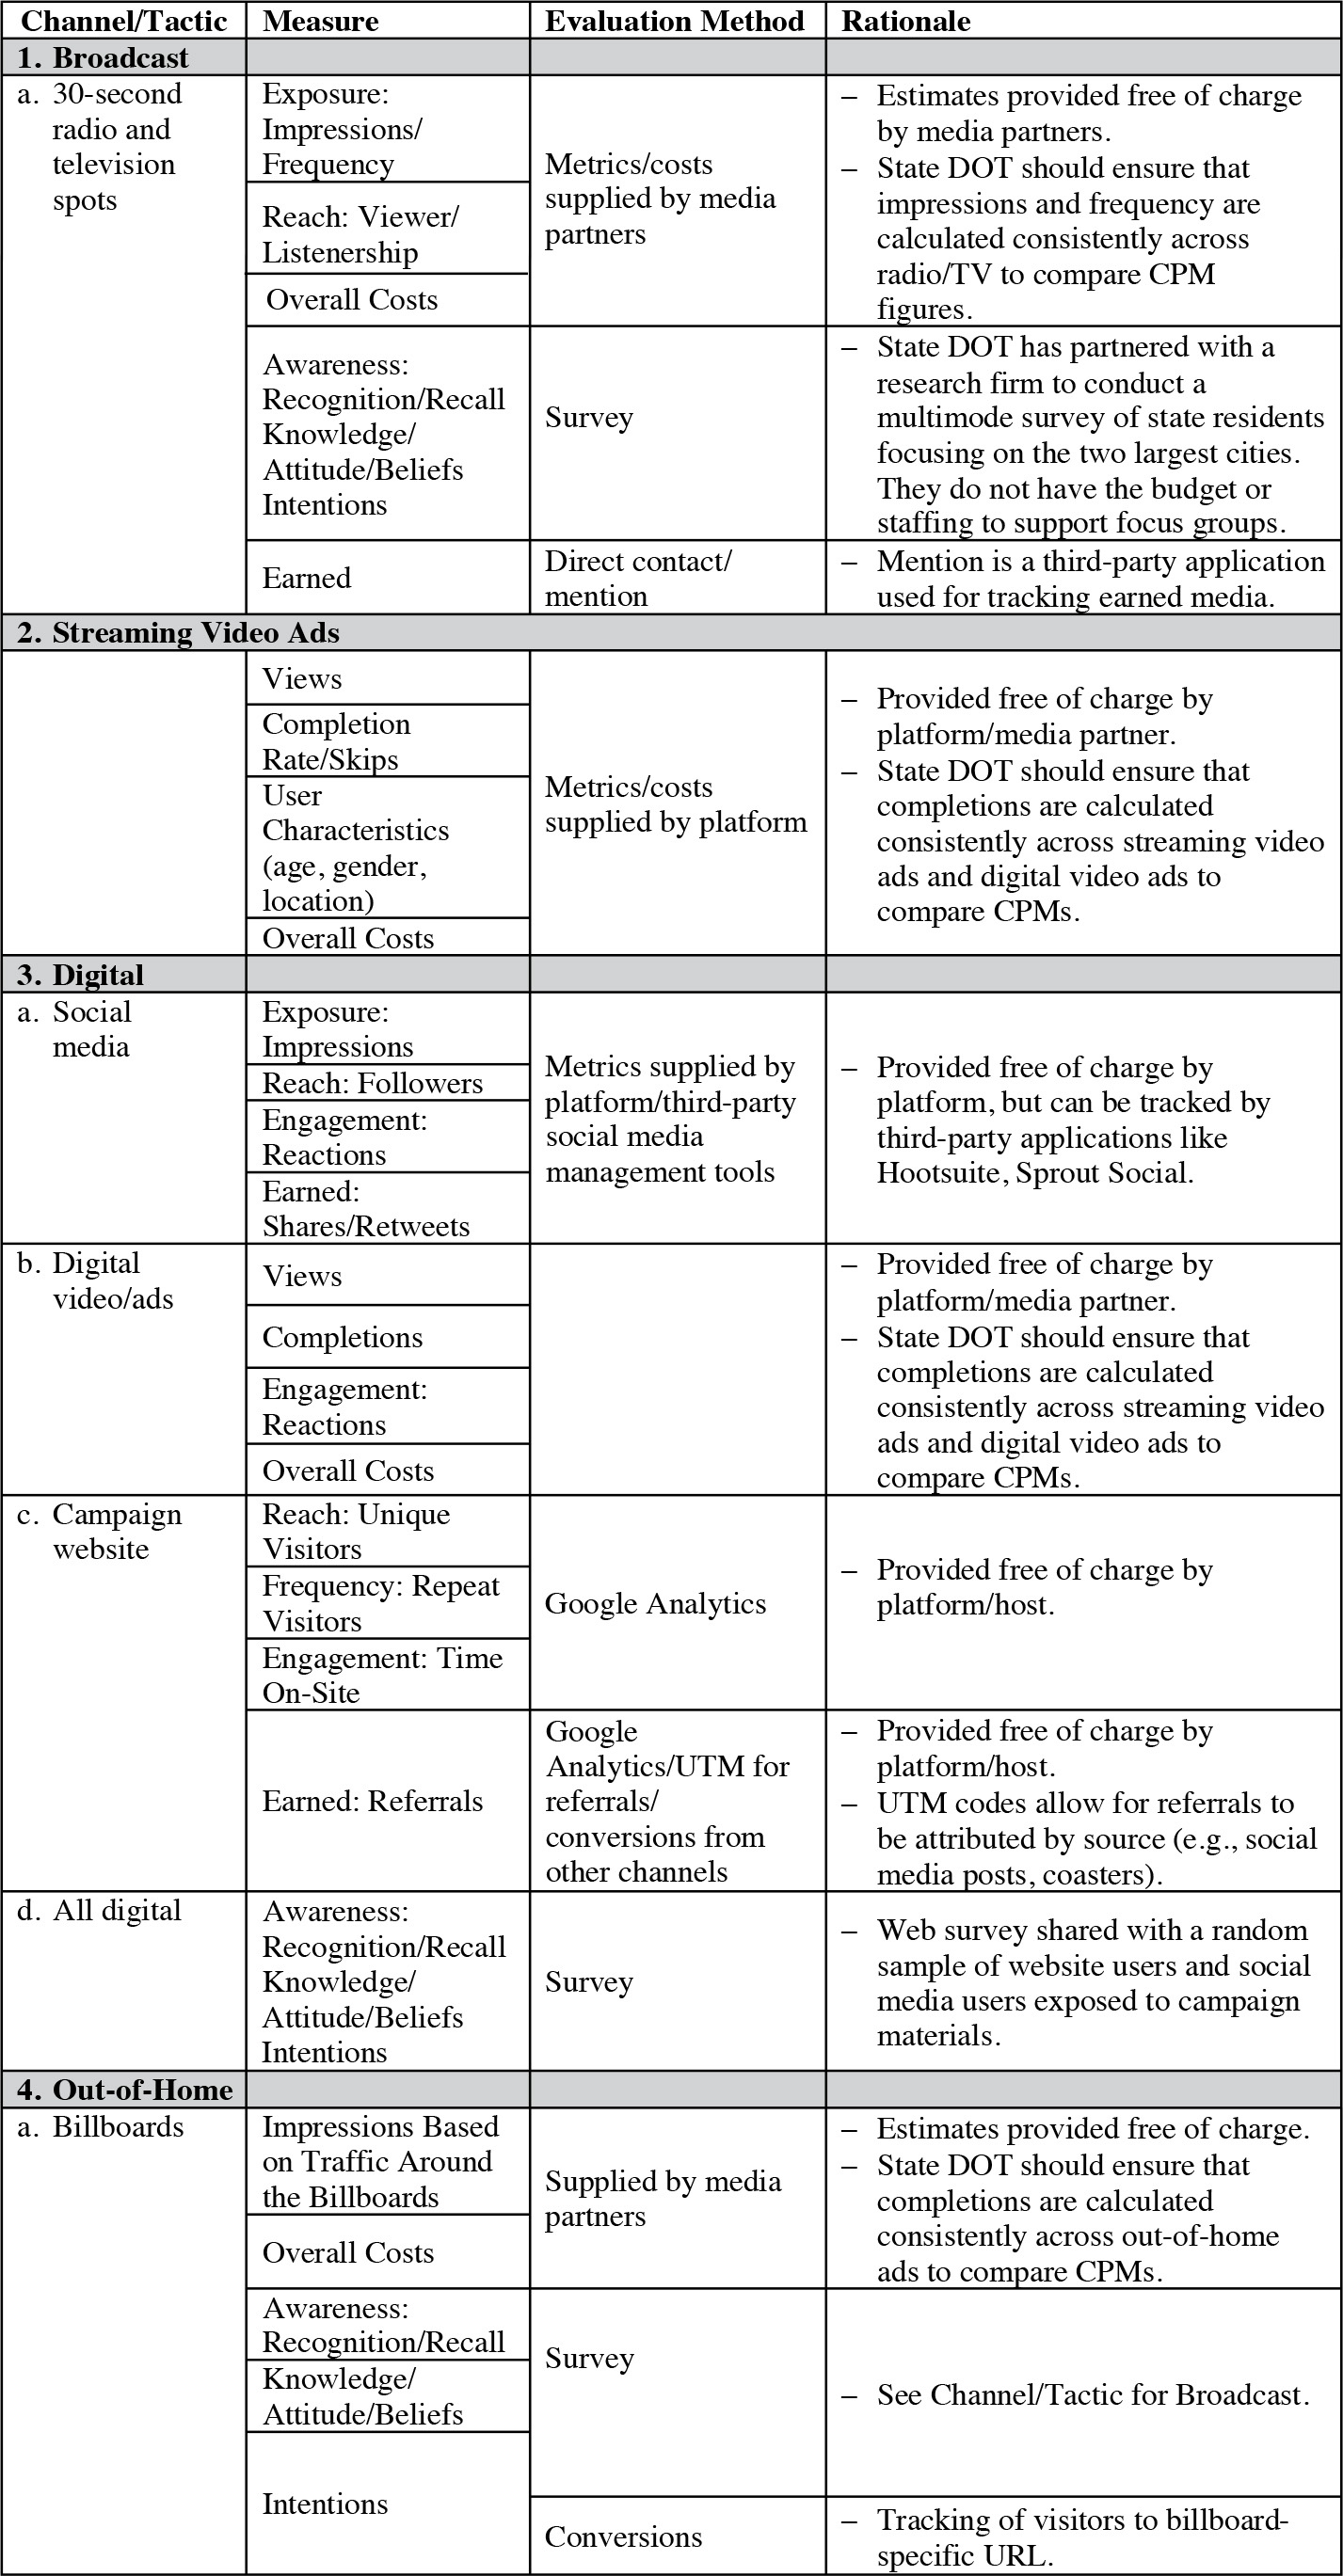
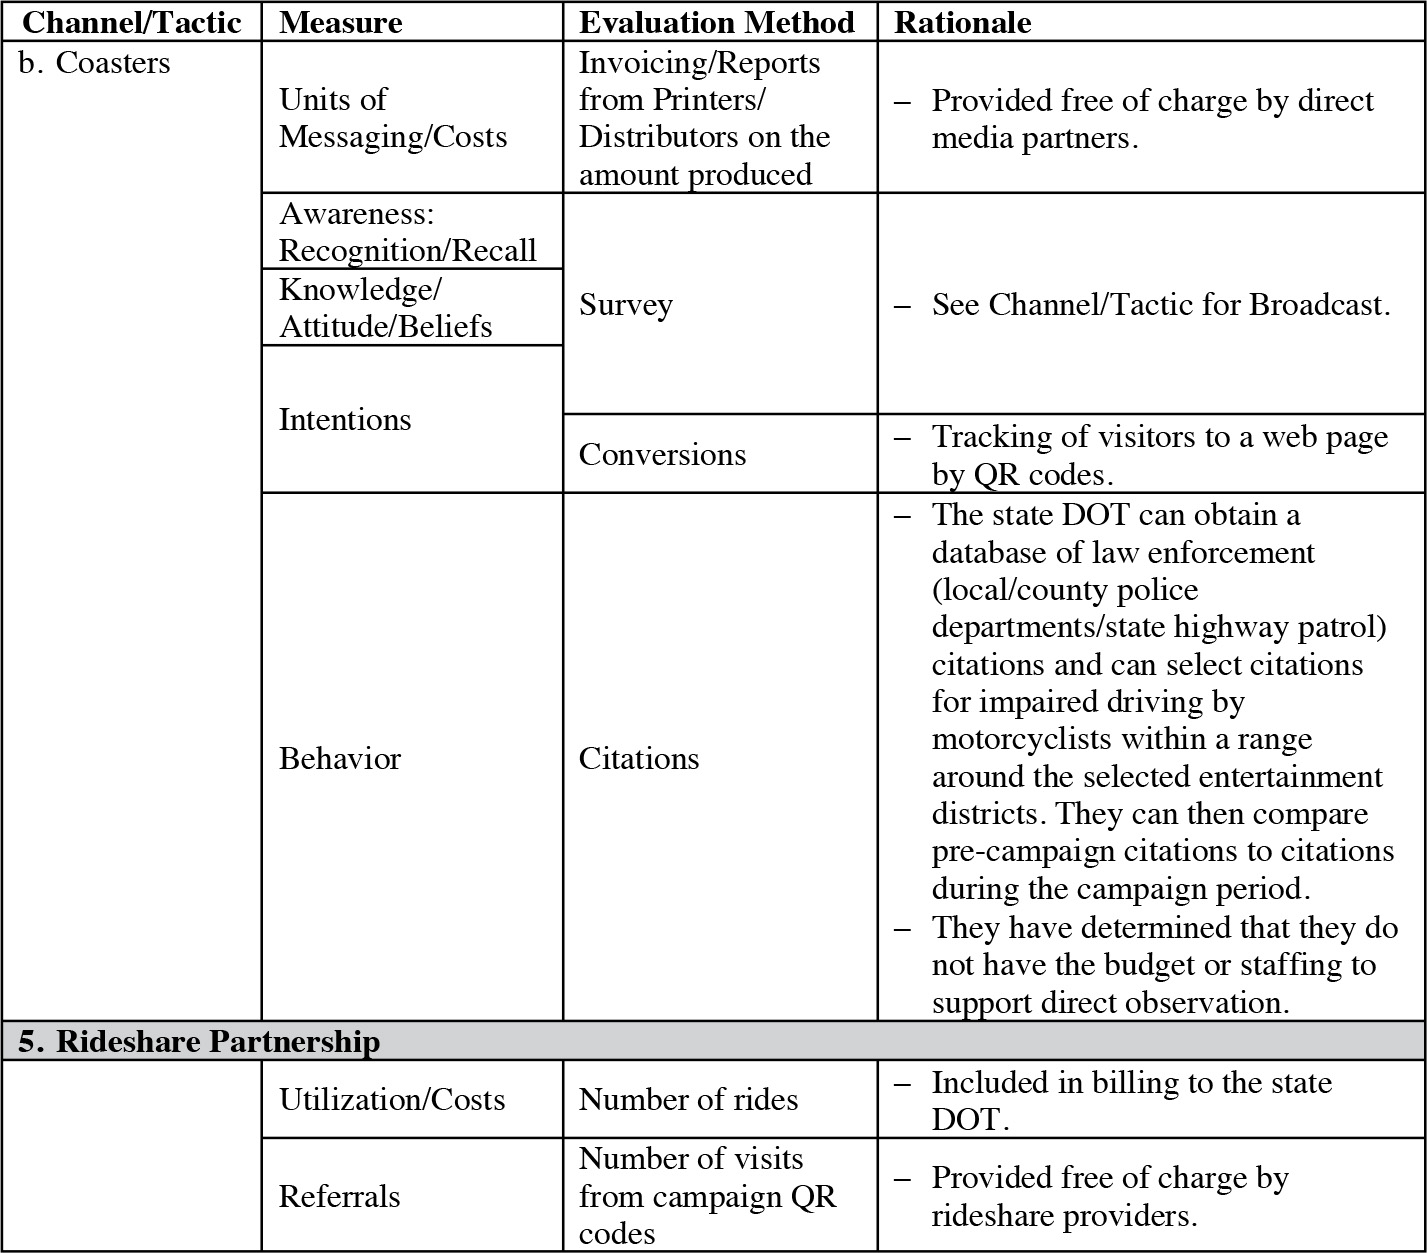
CPM: cost per thousand impressions.
UTM: Urchin Tracking Module.
QR: quick response.
Long Description.
The column headers of the table are Channel or Tactic, Measure, Evaluation Method, and Rationale. Each row has sub-rows. The data given in the table row-wise are as follows: Row 1: 1. Broadcast: a. 30 second Radio and Television spots; Exposure: Impressions or Frequency; Reach: Viewer or Listenership; Overall costs; Metrics or costs supplied by media partners; -Estimates provided free of charge by media partners; -State DOT should ensure that impressions and frequency are calculated consistently across radio or TV to compare Cost-Per-Mille (cost per thousand impressions) figures; Awareness: Recognition or Recall Knowledge or Attitude or Beliefs Intentions; Survey; -State DOT has partnered with a research firm to conduct a multimode survey of state residents focusing on the two largest cities. They do not have the budget or staffing to support focus groups; Earned; Direct contact, or Mention; -Mention is a third-party application used for tracking earned media. Row 2: 1. Streaming video ads: Views; Completion rate or skips; User Characteristics (Age, gender, location, etc.); Overall Costs; Metrics or costs supplied by platform; -Provided free of charge by platform or media partner; -State DOT should ensure that completions are calculated consistently across streaming video ads and digital video ads (see below) to compare CPMs. Row 3: 3. Digital: a. Social Media: Exposure: Impressions; Reach: Followers; Engagement: Reactions; Earned: Shares or Retweets; Metrics supplied by platform or third party social media management tools; -Provided free of charge by platform, but can be tracked by third party applications like Hootsuite, Sprout Social, etc.; b. Digital video or ads: Views; Completions; Engagement: Reactions; Overall Costs; -Provided free of charge by platform or media partner; -State DOT should ensure that completions are calculated consistently across streaming video ads and digital video ads (see below) to compare CTMs; c. Campaign Website: Reach: Unique Visitors; Frequency: Repeat Visitors; Engagement: Time on Site; Google Analytics; -Provided free of charge by platform or host; Earned: Referrals; Google Analytics or UTM for referrals or conversions from other channels; -Provided free of charge by platform or host; -U T M codes allow for referrals to be attributed by source, e.g. social media posts, coasters, etc.; d. All Digital: Awareness: Recognition or Recall Knowledge or Attitude or Beliefs Intentions; Survey; -Web survey shared with a random sample of website users, social media users exposed to campaign materials. Row 4: 4. OOH: a. Billboards; Impressions based on traffic around the billboards; Supplied by media partners; -Estimates provided free of charge; -State DOT should ensure that completions are calculated consistently across OOH ads (see below) to compare CTMs; Awareness: Recognition or Recall Knowledge or Attitude or Beliefs; Survey; -See above, under 'Broadcast'; Intentions; Conversions; -Tracking of visitors to billboard- specific URL; b. Coasters: Units of Messaging or Costs; Invoicing or Reports from Printers or Distributors on the amount produced; -Provided free of charge by direct media partners; Awareness: Recognition or Recall Knowledge or Attitude or Beliefs; Survey; -See above, under ‘Broadcast’; Intentions; Conversions; -Tracking of visitors to webpage by QR codes; Behavior; Citations; -The State DOT can obtain a database of law enforcement (local or county police departments or State highway patrol) citations and can select citations for impaired driving by motorcyclists within a range around the selected entertainment districts. They can then compare pre-campaign citations to citations during the campaign period; -They have determined that they do not have the budget or staffing to support direct observation. Row 5: Ride Share Partnership: Utilization or Costs; Number of rides; -Included in billing to State DOT; Referrals; Number of visits from campaign QR codes; -Provided free of charge by ride share providers.
To reach their target audiences in both locations, the DOT campaignʼs primary activities include the following:
- Eight 30-second TV ads (two versions per message) aired during weekday fringe (5:00 p.m. to 7:00 p.m.) and prime time (7:00 p.m. to 9 p.m.) slots on network affiliates in the state.
- Four 30-second radio ads aired during daytime (10:00 a.m. to 4:30 p.m.) on weekdays.
- Out-of-home signage and posters in hot spots and on bus shelters.
- Social media ads on their social accounts.
In addition, they include the following:
- Print advertising in local newspapers and free community magazines in urban areas.
- Internet ads on the local television and radio stations, and in the local newspaper/magazines, as part of their ad buys with those outlets.
- Press releases on the severity of the problem and their campaign.
The campaign is also airing the TV ads in rural markets during daytime TV and the radio ads during primetime.
Application of the Campaign Evaluation Framework to Sample Campaign B
The state DOTʼs evaluation plan for the campaign focuses on gaining a comprehensive understanding of the impact of the campaign by collecting pre-post data on audience attitudes and behaviors. Given that there was a high-profile fatality in the last year where a pedestrian was struck and killed after stepping into the roadway, there is some social and political pressure
Long Description.
The framework contains the following in descending order: timing, measures, methods, budget, channels or tactics, and staffing and skills.
for the DOT to implement a campaign and show results in terms of awareness, reach, attitude, and behavior change. As a result of public interest in preventing roadway pedestrian fatalities following the high-profile fatality, one of the state universities, with campuses around the state, has offered to help with the evaluation.
In addition, while the state DOT must rely on earmarked funds for this year to execute the campaign, they have a carryover budget from the prior year and the discretion to spend those funds as they see fit this year. Those funds will go away at the end of the current year. The state DOT also has funds earmarked to continue implementing the campaign again in the next year, but the budget for next year is smaller. Therefore, they will need to determine which channels are out performing others in each setting (rural and urban) this year, to reallocate how what they spend on each channel/tactic to maintain and/or increase the reach and impact of the campaign next year.
Thus, as shown in Exhibit 1.3, the main drivers for the state DOT campaign evaluation are the channels/tactics they want to evaluate, the measures they wish to collect, and the timing. Therefore, the state DOT campaign evaluation plans will look at the elements shown in Table 2.
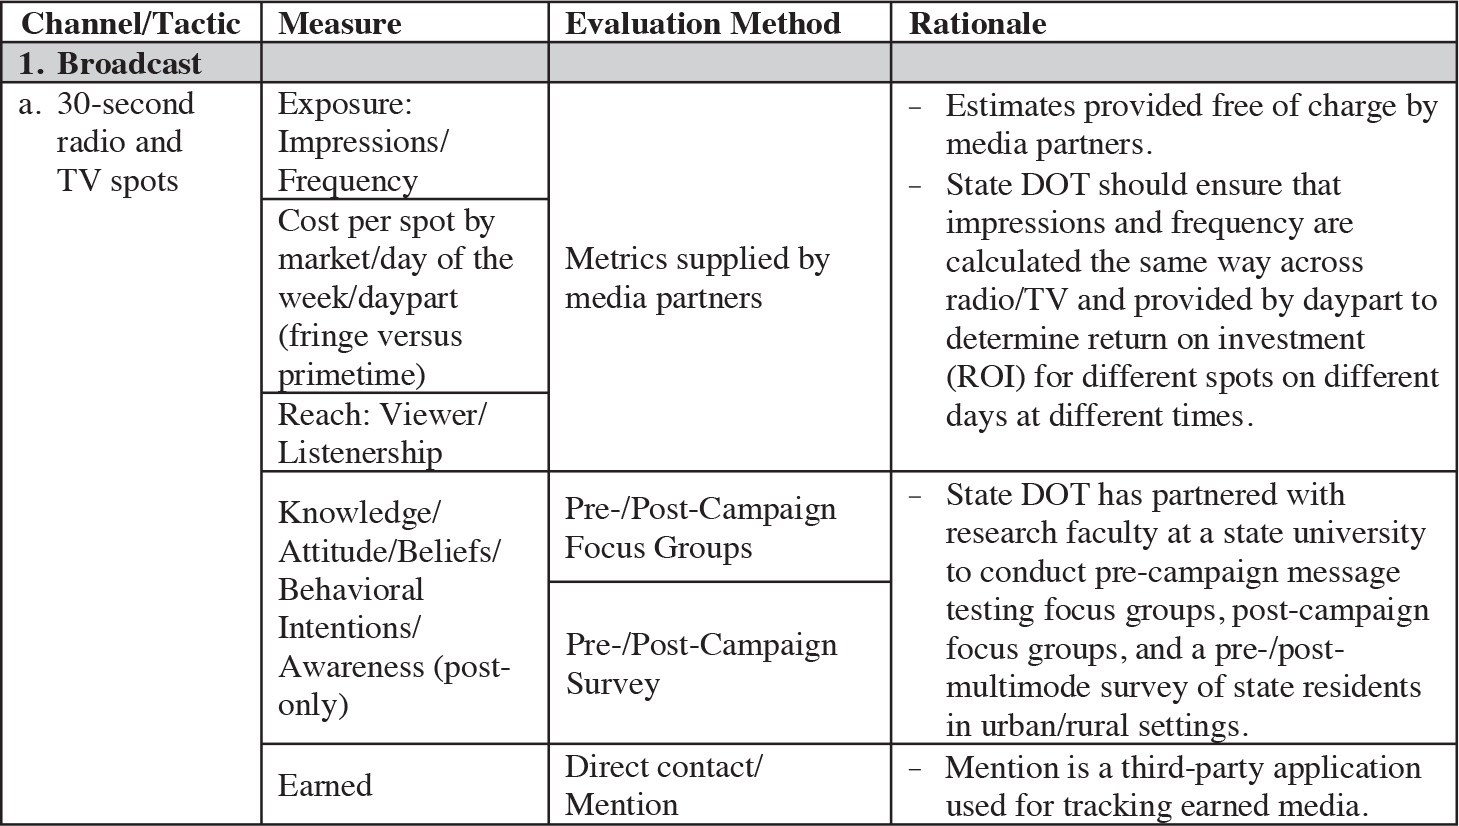
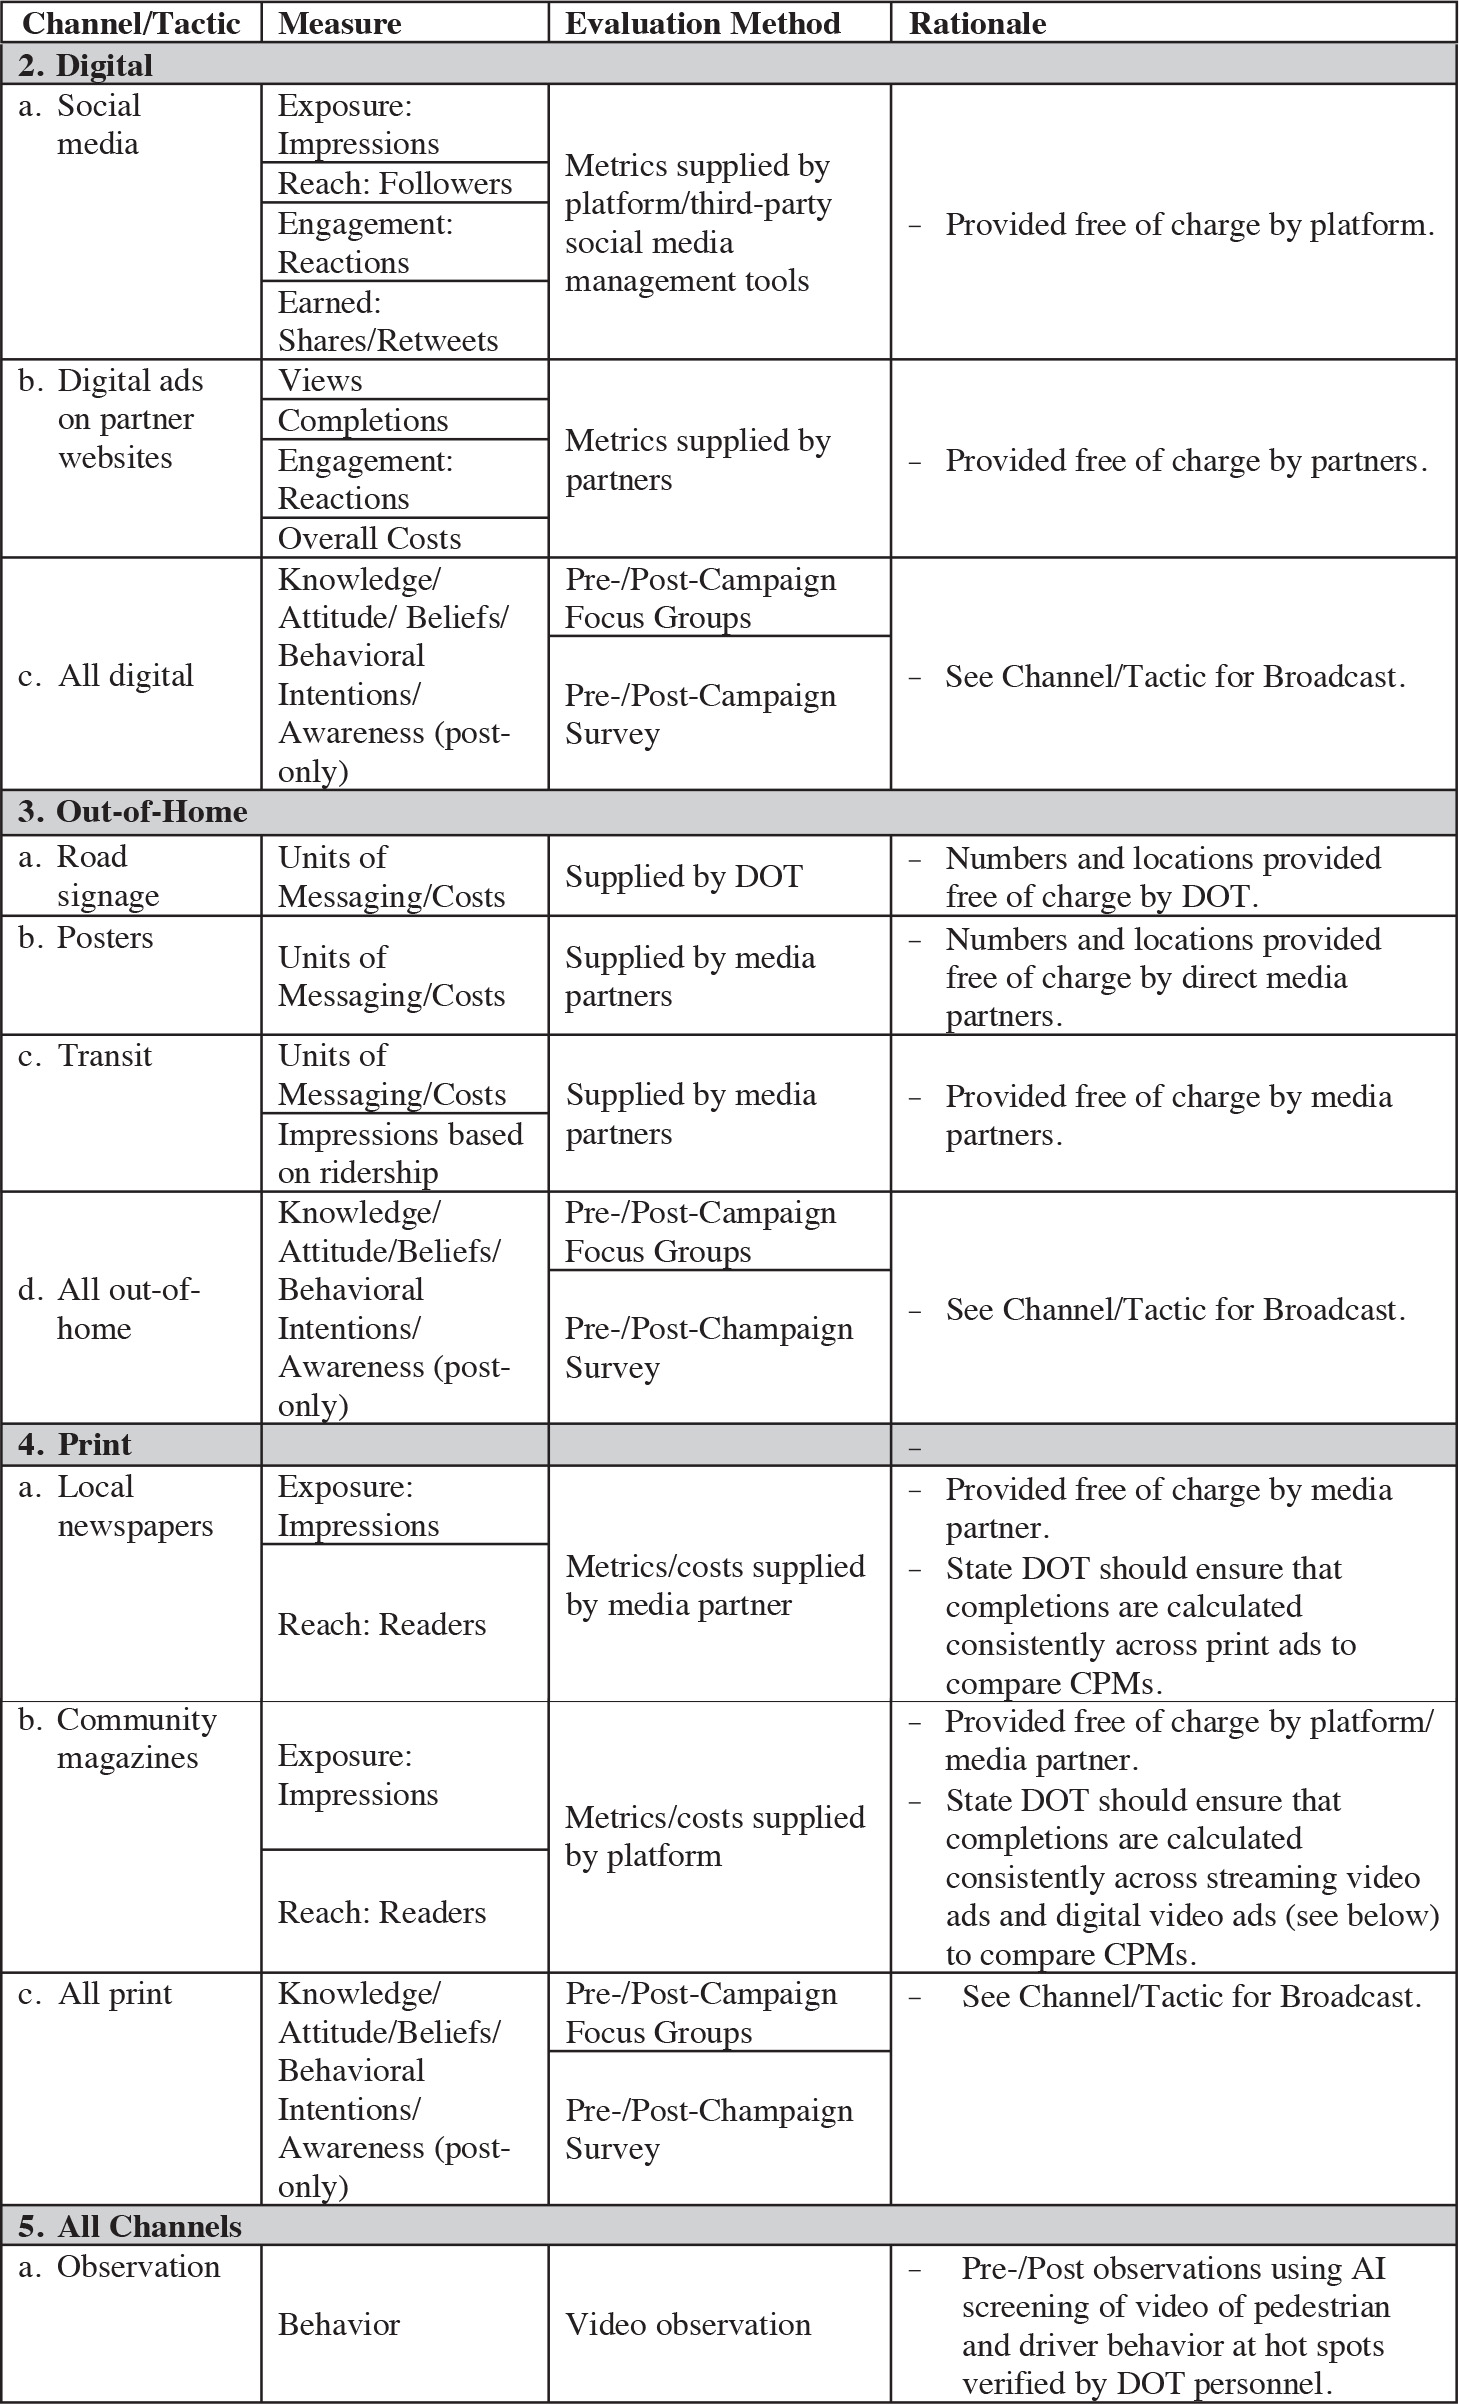
Long Description.
The column headers of the table are Channel or Tactic, Measure, Evaluation Method, and Rationale. Each row has sub-rows. The data given in the table row-wise are as follows: Row 1: 1. Broadcast: a. 30 second Radio and Television spots; Exposure: Impressions or Frequency; Cost per spot by market or day of the week or daypart (fringe versus primetime); Reach: Viewer or Listenership; Metrics supplied by media partners; -Estimates provided free of charge by media partners; -State DOT should ensure that impressions and frequency are calculated the same way across radio or TV and provided by daypart to determine return-on-investment (ROI) for different spots on different days at different times; Knowledge or Attitude or Beliefs or Behavioral Intentions or Awareness (post-only); Pre- or Post-Campaign Focus Groups; Pre- or Post-Campaign Survey; -State DOT has partnered with research faculty at a state university to conduct pre-campaign message testing focus groups, post-campaign focus groups and a pre- or post multimode survey of state residents in urban or rural settings; Earned; Direct contact or Mention; -Mention is a third-party application used for tracking earned media. Row 2: Digital: a. Social Media: Exposure: Impressions; Reach: Followers; Engagement: Reactions; Earned: Shares or Retweets; Metrics supplied by platform or third-party social media management tools; -Provided free of charge by platform; b. Digital Ads on Partner Websites; Views Completions; Engagement: Reactions; Overall Costs; Metrics supplied by partners; -Provided free of charge by partners; c. All Digital; Knowledge or Attitude or Beliefs or Behavioral Intentions or Awareness (post-only); Pre-or Post-Campaign Focus Groups; Pre-or Post-Campaign Survey; -See above, under ‘Broadcast’. Row 3: 3. Out-of-Home: a. Road Signage; Units of Messaging or Costs; Supplied by DOT; -Numbers and locations provided free of charge by DOT; b. Posters; Units of Messaging or Costs; Supplied by media partners; -Numbers and locations provided free of charge by direct media partners; c. Transit; Units of Messaging or Costs; Impressions based on ridership; Supplied by media partners; -Provided free of charge by media partners; d. All OOH; Knowledge or Attitude or Beliefs or Behavioral Intentions or Awareness (post-only); Pre- or Post-Campaign Focus Groups; Pre- or Post-Campaign Survey; -See above, under ‘Broadcast.’ Row 4: Print: a. Local Newspapers; Exposure: Impressions; Reach: Readers; Metrics or costs supplied by media partner; -Provided free of charge by media partner; -State DOT should ensure that completions are calculated consistently across print ads to compare CPMs; b. Community Magazines; Exposure: Impressions; Reach: Readers; Metrics or costs supplied by platform; -Provided free of charge by platform or media partner; -State DOT should ensure that completions are calculated consistently across streaming video ads and digital video ads (see below) to compare CPMs; c. All print; Knowledge or Attitude or Beliefs or Behavioral Intentions or Awareness (post-only); Pre- or Post-Campaign Focus Groups; Pre- or Post-Campaign Survey; -See above, under 'Broadcast.' Row 5: All channels: d. Observations; Behavior; Video Observation; -Pre- or Post observations using AI screening of video of pedestrian and driver behavior at hot spots verified by DOT personnel.
Getting Started
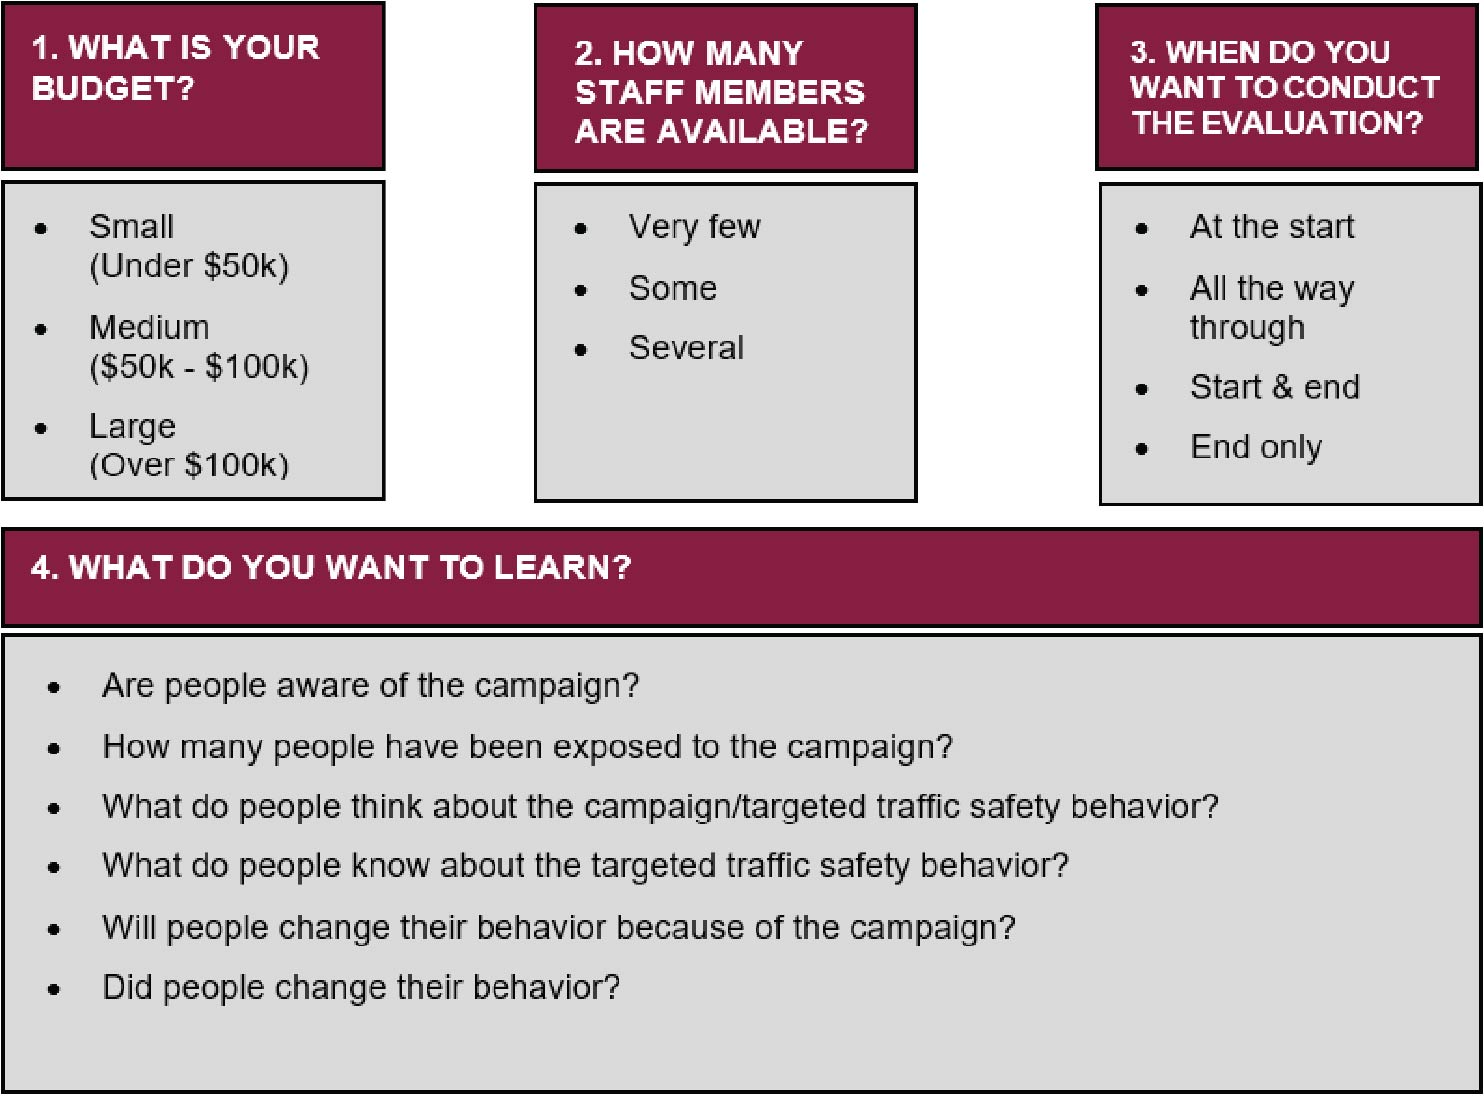
To get started, four questions need to be considered. The answers to these questions will provide the framework for all the steps that follow and will guide the selection of evaluation methods to ensure the necessary data is obtained using the most appropriate method for data collection. These questions, also illustrated in Exhibit 1.4, are as follows:
- What is your budget? This is critical to know in advance, as some evaluation methods may be prohibitively costly. For example, a large-scale naturalistic driving study (NDS) may sound appealing to evaluate a traffic safety campaign, but an NDS would typically rank as the most costly study methodology available.
- How many people do you have available to help with the evaluation? Many small-scale studies can be carried out with a relatively small research team; however, larger-scale efforts will require more staff. Knowing the size of your research team in advance can help prevent staffing issues that may result in the study falling behind schedule or not being completed.
- When do you want to conduct your evaluation? Some evaluation methods are most suited to a pre- and post-campaign assessment to determine changes in behavior, attitudes, or opinions. However, this study design requires twice as much effort as it involves two separate assessments at different points in time.
- What do you want to learn? Arguably, this is the most critical question when it comes to evaluation method selection because this will dictate what type of data is needed and how that data will be collected. For instance, assessing media metrics will provide no insight into actual behavior change, while conducting an epidemiological study will not answer questions about changes in attitudes or opinions. Evaluation methods are intrinsically linked to the types of data collected and what that data can tell you about the effectiveness of traffic safety campaigns.
Long Description.
The questions are what is your budget, how many staff members are available, when do you want to conduct the evaluation, and what do you want to learn?
Table 3 provides the various evaluation methods that are most suitable based on these four questions. A rationale for each option is also provided to help readers gain a better understanding of what makes an evaluation method more or less suitable for each of these factors. These initial steps will assist the reader in selecting the most appropriate method, after which the reader can jump to the corresponding chapter of the guide for a detailed description of the steps involved in setting up the proposed traffic safety campaign evaluation. Also accompanying this guide is a costing tool for each evaluation method to allow the reader to determine the budget required to conduct the evaluation and identify ways in which the study design may need to be adjusted to remain within a designated budget. Additionally, a quick reference guide, available in the associated publication BTSCRP Web-Only Document 7, corresponds to each evaluation method, which may be useful as a visual aid when starting out using this guide. Together, these elements provide a comprehensive toolkit to aid SHSOs and other stakeholders in selecting methods to evaluate the effectiveness of traffic safety campaigns and identify potential areas for improvement.
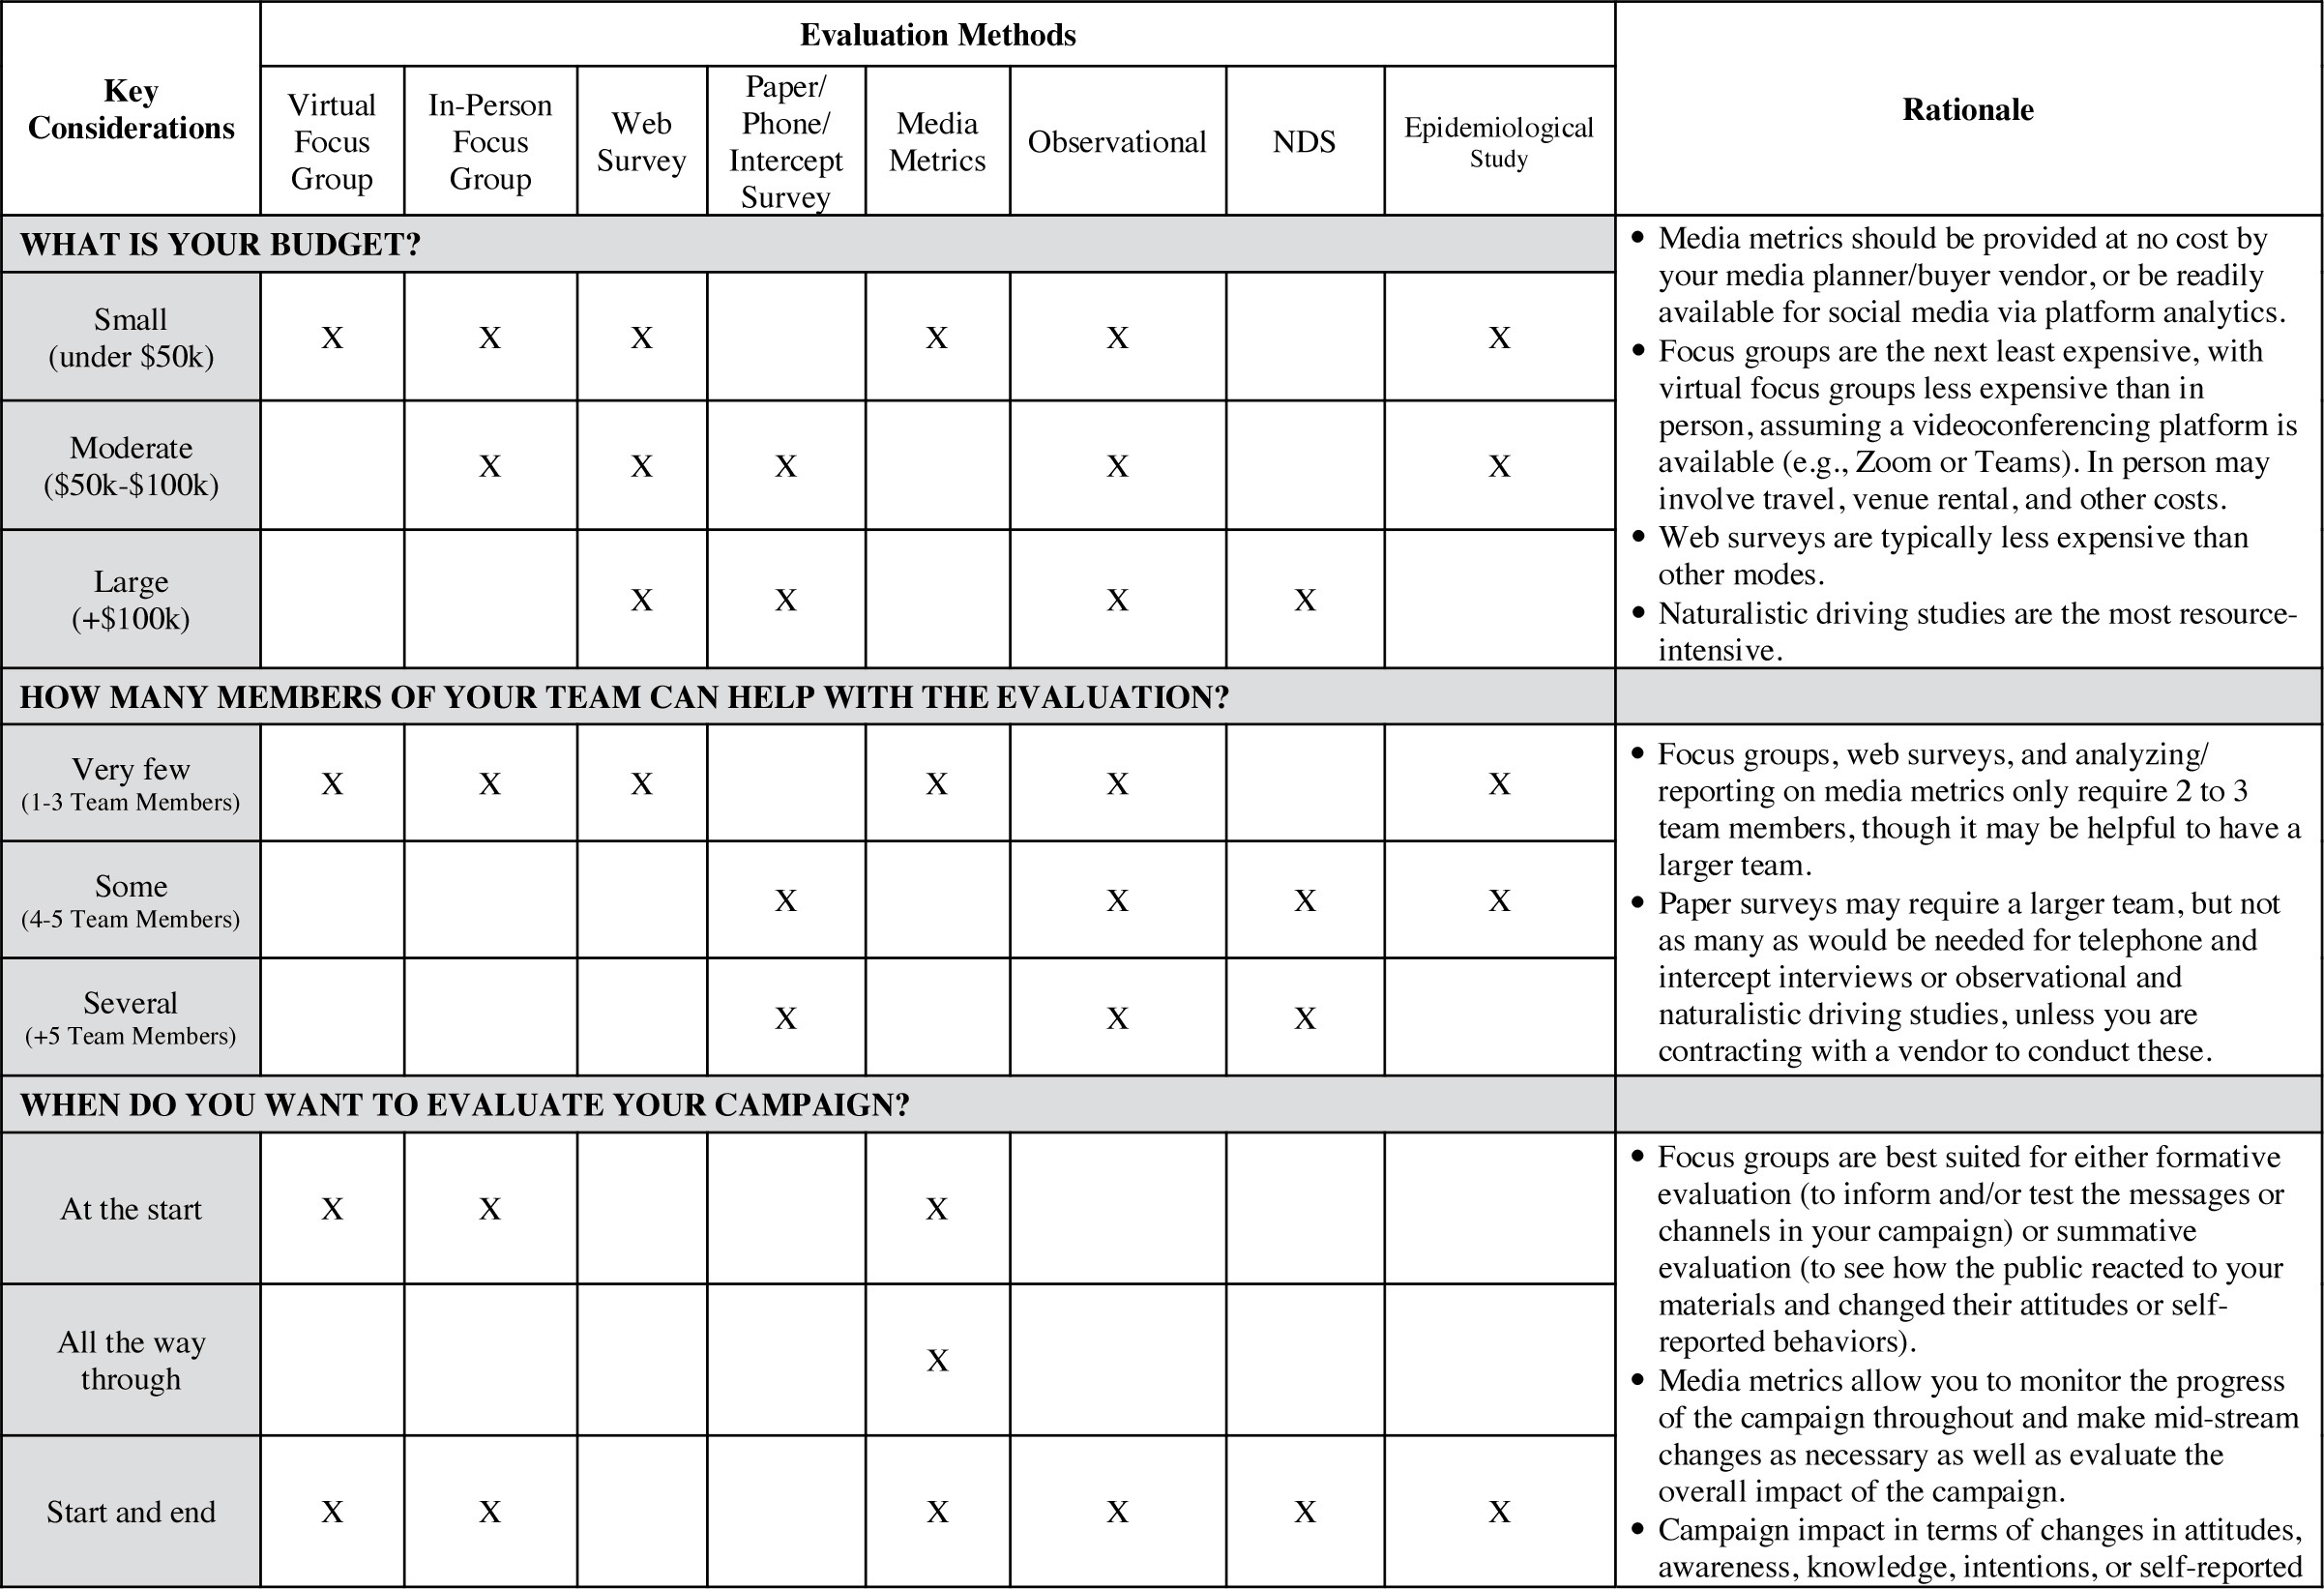
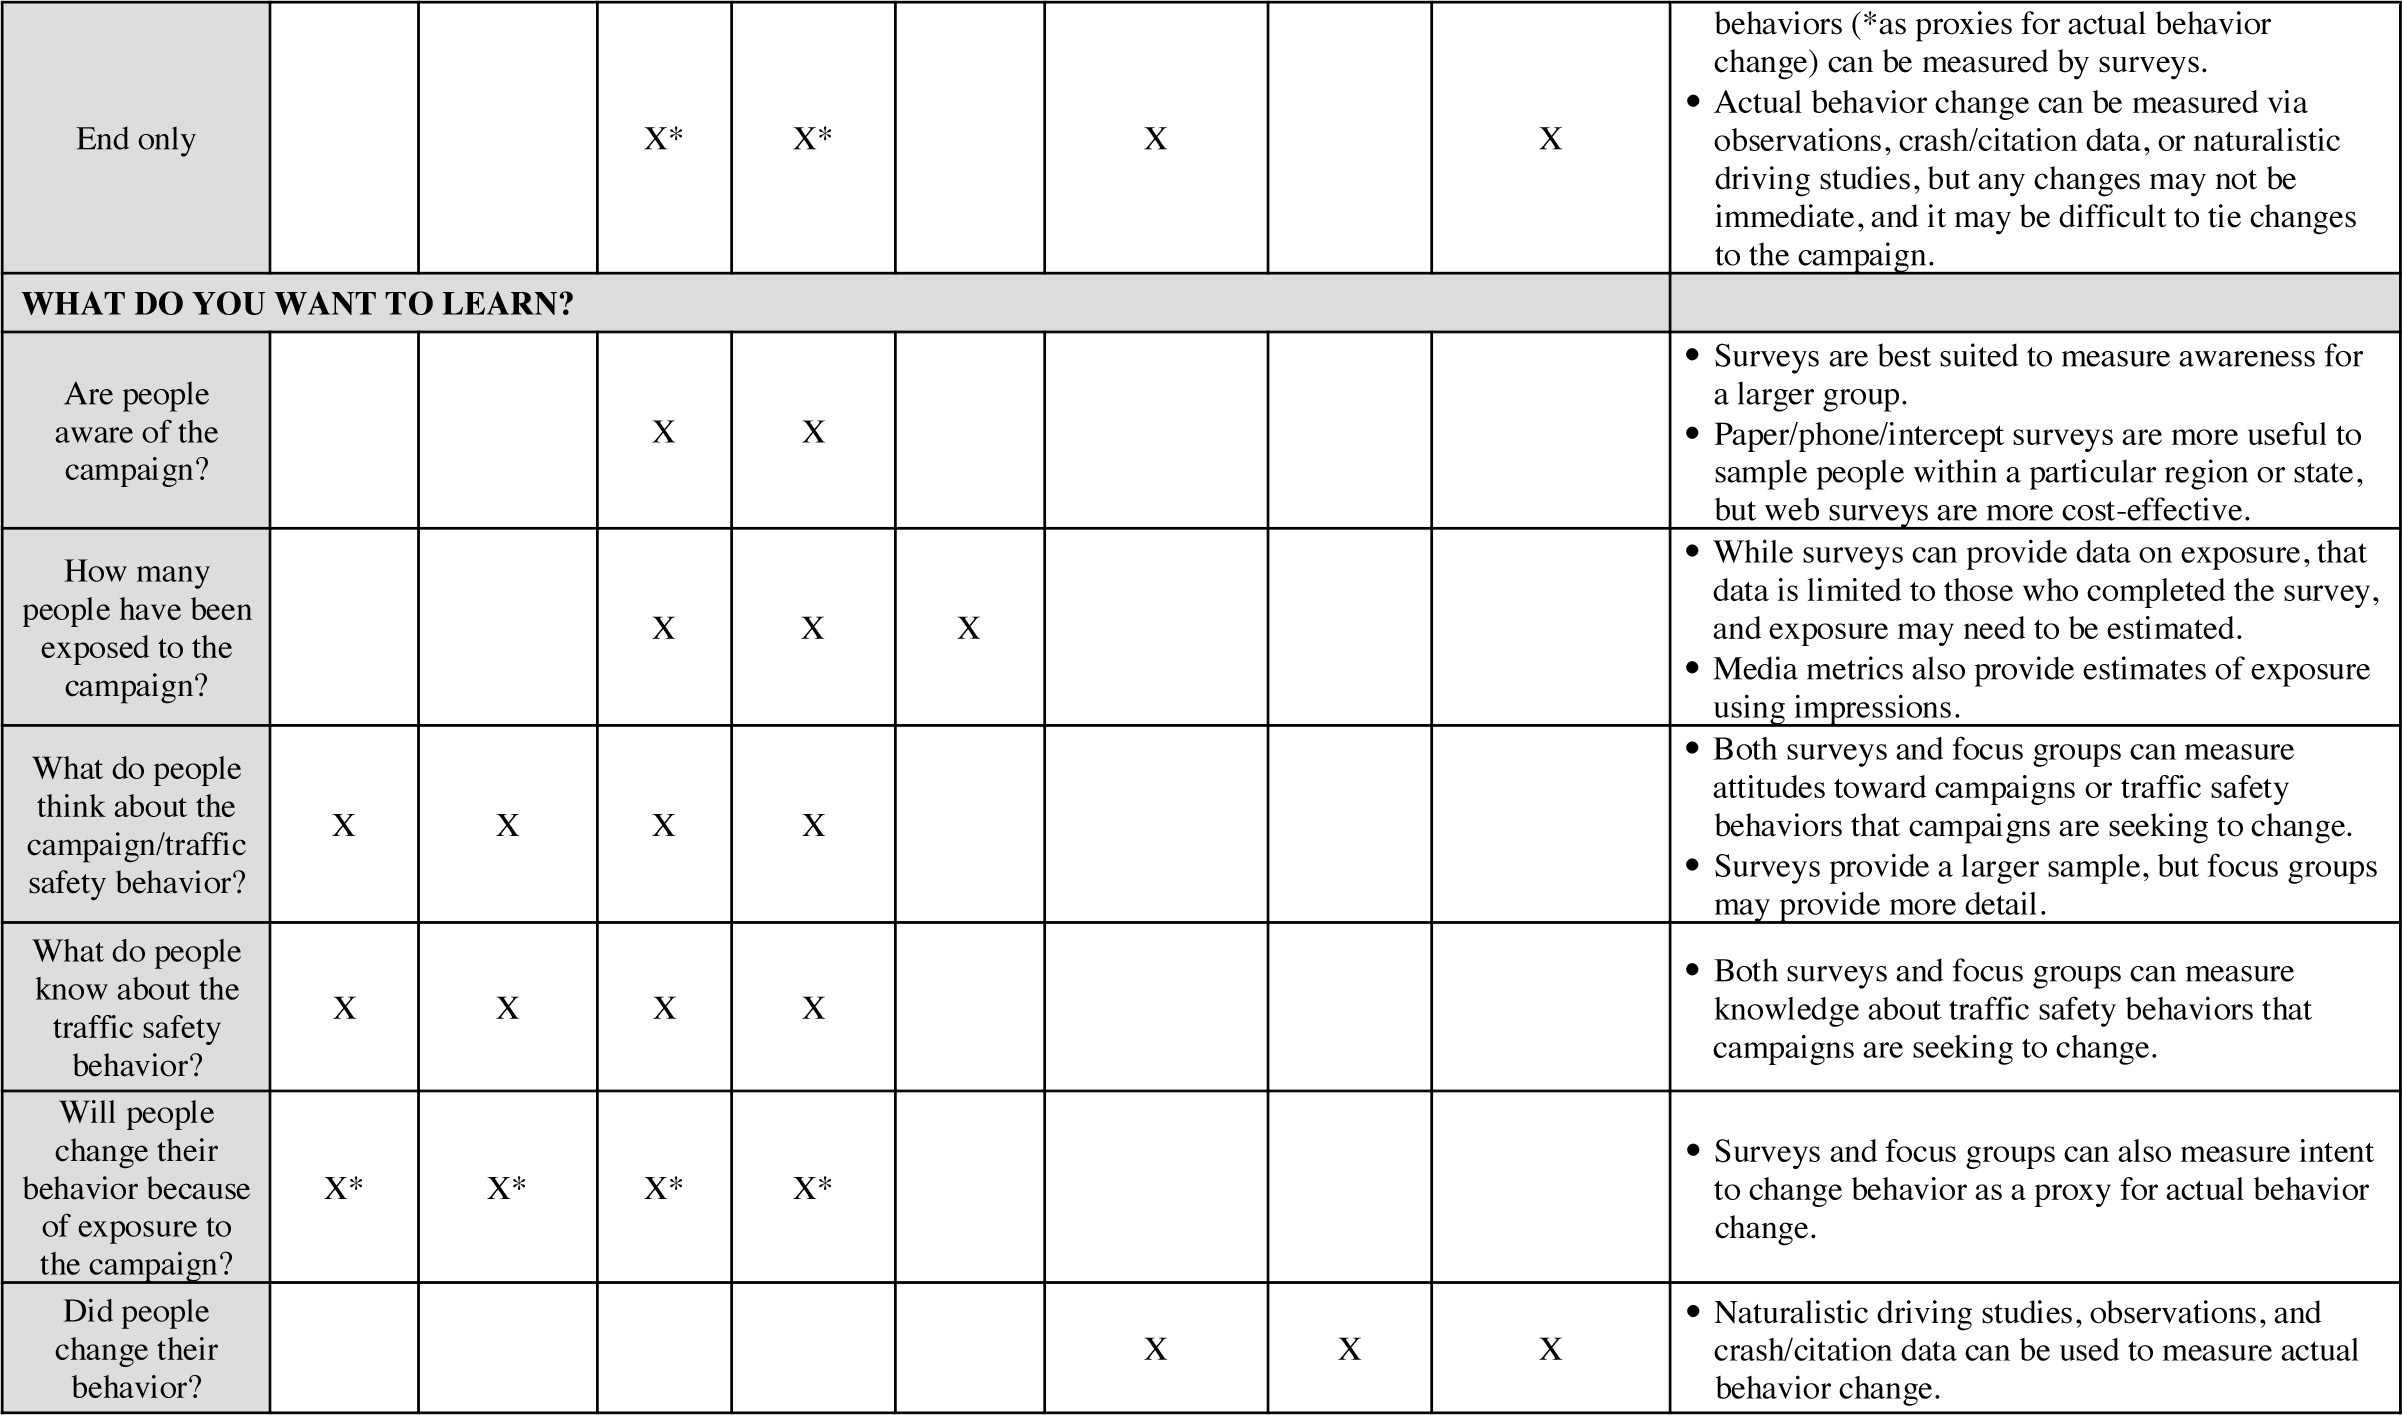
NDS: Naturalistic driving study.
Long Description.
The column headers of the table are Key Considerations, Evaluation Methods, and Rationale. The second column has sub-columns, namely Virtual Focus Group, In-Person Focus Group, Web Survey, Paper or Phone or Intercept Survey, Media Metrics, Observational, NDS, and Epidemiological Study. Each row has sub-rows. The data given in the table row-wise are as follows: Row 1: WHAT IS YOUR BUDGET?: Small (under 50 thousand dollars); X; X; X; Blank; X; X; Blank; X; Moderate (50 thousand dollars - 100 thousand dollars); Blank; X; X; X; Blank; X; Blank; X; Large (plus 100 thousand dollars); Blank; Blank; X; X; Blank; X; X; Blank; Media metrics should be provided at no cost by your media planner or buyer vendor or be readily available for social via platform analytics; Focus groups are next least expensive, with virtual focus groups less expensive than in-person, assuming a videoconferencing platform is available (e.g., Zoom or Teams). In-person may involve travel, venue rental, and other costs; Web surveys are typically less expensive than other modes; Naturalistic driving studies are the most resource-intensive. Row 2: HOW MANY MEMBERS OF YOUR TEAM CAN HELP WITH THE EVALUATION?: Very few (1 to 3 Team Members); X; X; X; Blank; X; X; Blank; X; Some(4 to 5 Team Members); Blank; Blank; Blank; X; Blank; X; X; X; Several (plus 5 Team Members); Blank; Blank; Blank; X; Blank; X; X; Blank; Focus groups, web surveys, and analyzing or reporting on media metrics only require 2 to 3 team members, though it may be helpful to have a larger team; Paper surveys may require a larger team, but not as many as would be needed for telephone and intercept interviews or observational and naturalistic driving studies, unless you are contracting with a vendor to conduct these. Row 3: WHEN DO YOU WANT TO EVALUATE YOUR CAMPAIGN?: At the start; X; X; Blank; Blank; X; Blank; Blank; Blank; All the way through; Blank; Blank; Blank; Blank; X; Blank; Blank; Blank; start and end; X; X; Blank; Blank; X; X; X; X; End only; Blank; Blank; X superscript asterisk; X superscript asterisk; Blank; X; Blank; X; Focus groups are best suited for either formative evaluation (to inform and or test the messages or channels in your campaign) or summative evaluation (to see how the public reacted to your materials and changed their attitudes or self-reported behaviors); Media metrics allow you to monitor the progress of the campaign throughout and make mid-stream changes as necessary, as well as evaluate the overall impact of the campaign; Campaign impact in terms of changes in attitudes, awareness, knowledge, intentions or self-reported behaviors (asterisk as proxies for actual behavior change) can be measured by surveys; Actual behavior change can be measured via observations, crash or citation data, or naturalistic driving studies, but any changes may not be immediate, and it may be difficult to tie changes to the campaign. Row 4: WHAT DO YOU WANT TO LEARN? Are people aware of the campaign? Blank; Blank; X; X; Blank; Blank; Blank; Blank; Surveys are best suited to measure awareness for a larger group; Paper, phone, or intercept surveys are more useful to sample people within a particular region or state, but web surveys are more cost-effective; How many people have been exposed to the campaign? Blank; Blank; X; X; X; Blank; Blank; Blank; While surveys can provide data on exposure, that data is limited to those who completed the survey, and exposure may need to be estimated; Media metrics also provide estimates of exposure using impressions; What do people think about the campaign or traffic safety behavior?; X; X; X; X; Blank; Blank; Blank; Blank; Both surveys and focus groups can measure attitudes towards campaigns or traffic safety behaviors that campaigns are seeking to change; Surveys provide a larger sample, but focus groups may provide more detail; What do people know about the traffic safety behavior?; X; X; X; X; Blank; Blank; Blank; Blank; Likewise, both surveys and focus groups can measure knowledge about traffic safety behaviors that campaigns are seeking to change; Will people change their behavior because of exposure to the campaign?; X superscript asterisk; X superscript asterisk; X superscript asterisk; X superscript asterisk; Blank; Blank; Blank; Blank; Surveys and focus groups can also measure intent to change behavior as a proxy for actual behavior change; Did people change their behavior? Blank; Blank; Blank; Blank; Blank; X; X; X; Naturalistic driving studies, observations, and crash or citation data can be used to measure actual behavior change.


