Roadside Encroachment Database and Analysis (2025)
Chapter: 5. Detailed Encroachment Characteristics
5. Detailed Encroachment Characteristics
The primary purpose of this chapter is to analyze the compiled NCHRP 17-88 dataset to better understand the specific characteristics of roadside encroachments (e.g., departure angle and departure speed) and how these vary by vehicle type. This includes comparing the real-world encroachment conditions present in the NCHRP 17-88 dataset to current crash testing impact conditions and investigating differences in encroachment characteristics for motorcycles, passenger cars, utility vehicles, vans, light trucks, single-unit trucks, and tractor-trailer trucks.
5.1 Characterization of Encroachments in the U.S. by Vehicle Type
5.1.1 Introduction
Testing Standards and Vehicle Types
The MASH prescribes procedures for evaluating the safety performance of roadside hardware using full-scale crash tests (AASHTO 2016). MASH replaced the NCHRP 350 Report (Ross et al. 1993) in 2009 with updated test impact conditions and vehicle masses. For longitudinal barriers, there are multiple test levels (TLs) specified for applications on different road types with different vehicle types present. MASH TL-3 is a 100-km/h impact at 25 degrees by two different passenger vehicles, a small car and large pickup truck. In addition to the passenger vehicle impacts, TL-4, TL-5, and TL-6 include an 80-km/h impact at 15 degrees of a single-unit truck (10,000 kg), a tractor-van trailer (36,000 kg), and a tractor-tank trailer (36,000 kg), respectively (Table 58). The MASH impact conditions are chosen based on the practical worst-case scenario of three factors: vehicle mass, impact velocity, and impact angle. For impact velocity and impact angle, MASH suggests that the practical worst-case scenario was the 85th percentile.
| Test Vehicle | Impact Speed mph (km/h) | Impact Angle degrees | Minimum Impact Severity kip-ft (kJ) |
|---|---|---|---|
| Passenger Car 1,100 kg (TL-3+) |
62.1 (100) | 25 | 51.4 (69.7) |
| Pickup Truck 2,270 kg (TL-3+) |
62.1 (100) | 25 | 106.2 (144) |
| Single-Unit Truck 10,000 kg (TL-4+) |
56 (90) | 15 | 142.3 (193) |
| Tractor-Van Trailer 36,000 kg (TL-5+) |
50 (80) | 15 | 404.2 (548) |
| Tractor-Tank Trailer 36,000 kg (TL-6+) |
50 (80) | 15 | 404.2 (548) |
Although U.S. roadside hardware crash procedures currently do not prescribe the use of a motorcycle test vehicle, a number of international roadside crash test procedures exist, and several crash tests have been conducted with motorcycles for research purposes. In 1988 in France, Quincy
et al. designed one of the first comprehensive motorcycle tests where a rider was ejected into the barrier to examine guardrail designs. Test conditions were chosen to best replicate real-world crashes based on available data (Quincy et al. 1988). Expanding upon this work, Koch and Brendicke (1989) performed a crash test to examine guardrail impacts from motorcyclists. Compared to earlier studies, the impact angle and impact speed were lowered to precisely investigate which portion of the guardrail causes injury when impacted by the rider (Koch and Brendicke 1989). In 2007, Peldschus et al. summarized multiple studies that conducted motorcycle-barrier tests (Peldschus et al. 2007). This includes a follow-on study by Quincy in 1998 at an increased impact speed and two different orientations of the anthropomorphic test device (ATD) (Quincy 1998). An ATD is a tool commonly used in crash testing to measure potential human injury in different testing conditions. Gärtner et al. (2006) completed two upright impact tests with shallower impact angles and a higher speed to test head and thorax injury response to impacts with barriers. These test conditions were chosen to replicate common higher speed impacts that occur on the roadway. These tests have resulted in the implementation of European Standards Committee Technical Specification (CEN TS) 1317-8 as the standard test for motorcycle protection systems on barriers in Europe. Similar to many previous studies, CEN TS 1317-8 prescribes a 30-degree impact angle with the ATD striking the barrier head first. The standard prescribes both a 60-km/h and a 70-km/h impact. One of the most recent studies was conducted by the Texas A&M Transportation Institute (TTI) with similar testing conditions to evaluate motorcyclist injury prevention additions on current barriers (Silvestri Dobrovolny et al. 2019). TTI motorcycle testing conditions were specified by the Texas Department of Transportation and were chosen to represent real-world barrier impacts (Table 59).
Table 59. Global Testing Conditions Used for Motorcycle Barrier Crash Testing
| Research Institute | Position | Impact Speed mph (km/h) | Impact Angle degrees |
|---|---|---|---|
|
Institut National de Recherche sur les Transports et leur Securite (INRETS) (Quincy et al. 1988) |
Separated, ATD on back with head first | 34.2 (55) | 30 |
|
Laboratorie d’essais Inrets Eqquipments de la Route (LIER) (Quincy 1998) |
Separated, ATD on back with head first | 37.3 (60) | 30 |
| Separated, ATD on back parallel to the barrier | 37.3 (60) | 30 | |
| National Swedish Road and Traffic Research Institute (Koch and Brendicke 1989) | Separated, Cadaver on back with feet first | 19.9 (32) | 15 |
| TTI (Silvestri Dobrovolny et al. 2019) | Upright | 35 (56.3) | 18 |
|
DEKRA & German Federal Highway Research Institute (Gärtner et al. 2006) |
Upright @ 45° roll | 37.3 (60) | 25 |
| Upright | 37.3 (60) | 12 | |
|
Ministerio de Fomento (CIDAUT 2005) |
Separated, ATD on back with head first | 37.3 (60) | 30 |
| Research Institute | Position | Impact Speed mph (km/h) | Impact Angle degrees |
|---|---|---|---|
| CEN TS 1317-8 (2012) |
Separated, ATD on back with head first | 37.3 (60) | 30 |
| Separated, ATD on back with head first | 43.5 (70) | 30 |
Crash and Encroachment Studies
The foundation for barrier test impact conditions is data from real-world encroachments (i.e., the vehicle leaves the traveled way) and real-world encroachment crashes. The current test conditions in MASH are based on the crash encroachments collected in the NCHRP 17-22 database. The NCHRP 17-22 dataset extracted encroachment data from the NASS/CDS case years 1997 to 2000 and a few cases from 2004 (Mak et al. 2010). NASS/CDS is an in-depth, nationally representative dataset of crashes involving at least one passenger vehicle that was towed from the scene due to damage and contains detailed information on the environment conditions, the vehicle damage, and occupant injuries (NCSA 2015). Despite the in-depth information, NASS/CDS captures very little information on the roadside. The NCHRP 17-22 dataset used the scaled NASS/CDS scene diagrams to measure the encroachment angles, lateral extent, and road geometry. Based on the vehicle deformation, the impact speed was reconstructed by the NCHRP 17-22 research team. As a follow-on study to NCHRP 17-22, the NCHRP 17-43 dataset continued extracting roadside encroachment data from more recent case years (Riexinger and Gabler 2019). The NCHRP 17-43 database contains 1,581 roadside encroachments extracted from NASS/CDS case years 2011 to 2015.
Most encroachment studies, including NCHRP 17-22 and NCHRP 17-43, have focused on passenger vehicles, while relatively few data collection studies have been conducted for motorcycles in the U.S. In contrast, there have been many data collection efforts focused on motorcycles in Europe and New Zealand [Association of European Motorcycle Manufacturers (ACEM) 2004; Stefan et al. 2003]. The first motorcycle in-depth crash data collection effort in the U.S. was collected from 1976 to 1979 in Los Angeles (Hurt et al. 1981). This dataset included an on-scene crash investigation, an interview with the motorcyclist, and injury data. While this dataset is not specific to roadside encroachments, Ouellet (1982) used the Hurt dataset to identify hazards for motorcyclists. Ouellet discussed that road and roadside designs focused on passenger vehicles may increase the risk of crashes for motorcyclists. A more recent data collection effort was conducted by Gabler et al. (2022) in the NCHRP 22-26 project from 2010 to 2016. This project identified and collected in-depth data on 21 single-vehicle motorcycle-barrier crashes where a rider was admitted into a Level 1 trauma center. In 2016, FHWA released the new MCCS database. This database comprises 351 injury crashes, of which 82 cases are single-vehicle motorcycle crashes that occurred in California.
Table 60. Summary of Roadside Encroachment and Crash Datasets for Motorcycles
| Study | Years | Study Type / Location | # Encroachments / Crashes | Characteristics examined / Notes |
|---|---|---|---|---|
|
Hurt (Hurt et al. 1981) |
1976 to 1979 | Crashes / California | 900 | In-depth |
|
MAIDS (ACEM 2004) |
1999 to 2000 | Crashes / EU countries | 921 | In-depth |
|
CARE (Stefan et al. 2003) |
1991 to 2001 | Crashes / EU countries | - | Focus on motorcycle crash trends |
|
22-26 (Gabler et al. 2022) |
2010 to 2016 | ROR crashes / North Carolina | 21 | In-depth and admitted to a trauma center |
| MCCS | 2016 | Crashes / California | 351 | In-depth investigation |
5.1.2 Methods
The departure angle, posted speed, impact angle, road type, injury outcomes, and object struck were compared across motorcycles, passenger cars, vans, light trucks, single-unit trucks, and tractor-trailer trucks using the NCHRP 17-88 database.
Data Sources
The NCHRP 17-88 database is a collection of encroachments and roadside crashes for the purpose of improving roadside design developed by Virginia Tech and Bucknell University. One of the most important features of the NCHRP 17-88 database is the inclusion of motorcycles and large trucks in addition to passenger vehicles. The NCHRP 17-88 database is comprised of roadside crashes and encroachments extracted from national, state, and naturalistic datasets. The NCHRP 17-88 data used for this analysis were extracted from the following datasets.
NCHRP 17-43: NCHRP project 17-43 is a collection of roadside crash encroachments extracted from in-depth crash datasets. The NCHRP 17-43 dataset includes roadside crashes from the NASS/CDS and from the Crash Investigation Sampling System (CISS). Both NASS/CDS and CISS are in-depth crash datasets that are nationally representative of tow-away, passenger vehicle crashes in the U.S. NASS/CDS sampling ended in 2015 and was replaced by CISS in 2017. Therefore, NCHRP 17-43 includes cases from NASS/CDS case years 2011 to 2015 and from CISS case year 2017. NCHRP 17-43 includes detailed information on the roadway, roadside, and encroachment in roadside crashes involving a passenger vehicle that was towed away from the crash scene.
LTCCS: The LTCCS contains detailed crash information for approximately 1,000 large truck crashes that occurred from 2001 to 2003. This in-depth crash dataset sampled large truck crashes that resulted in serious injury. This includes scaled scene diagrams that were used to extract trajectory information available in NCHRP 17-88.
MCCS: The MCCS contains detailed crash information for 351 motorcycle impacts, of which 47 are single-vehicle motorcycle crashes. These crashes were sampled from police-reported
motorcycle crashes in California where the motorcyclist was transported to a Level 1 trauma center.
NCHRP 22-26: NCHRP project 22-26 collected in-depth data for crashes involving a motorcyclist who struck a roadside barrier and was transported to a Level 1 trauma center.
Case Selection Criteria
The NCHRP 17-88 database contains 1,581 crashes incorporated from NCHRP 17-43, 124 crashes incorporated from LTCCS, 47 crashes from MCCS, and 21 from NCHRP 22-26. These in-depth crash datasets contain motorcycles, passenger cars, utility vehicles, vans, light trucks (pickups), single-unit trucks, and tractor-trailer trucks. Because the dataset is comprised of cases from multiple data sources, not every data element was available for every case. Some additional data elements such as speed limit and object struck are being coded for the NCHRP 17-43 cases. Therefore, the case count was provided for each analyzed variable in Table 61. Partial departure crashes, where the subject vehicle impacted a roadside object without the vehicle center of gravity departing the roadway, were excluded from the analysis. When analyzing impact events, such as the object struck or the impact angle, only the first impact was considered. The subsequent impacts were affected by the first impact, and that could lead to very unusual impact dynamics. For example, a vehicle that strikes a narrow object may yaw significantly due to the impact before striking a second object. In this analysis, when a vehicle splits into multiple components, only the component that originally contained the driver was considered. For example, if a tractor-trailer truck was separated into the trailer and the cab, only the trajectory of the cab was considered. Additionally, if a motorcyclist was separated from the bike during a crash, the trajectory of the motorcyclist was considered.
| Motorcycles | Passenger Cars | Utility Vehicles | Vans | Light Trucks | Single-Unit Trucks | Tractor-Trailer Trucks | |
|---|---|---|---|---|---|---|---|
| All Cases | 69 | 977 | 305 | 69 | 230 | 38 | 86 |
| Departure Angle | 67 | 977 | 305 | 69 | 230 | 37 | 86 |
| Impact Angle | 67 | 977 | 305 | 69 | 230 | 38 | 85 |
| Object Struck | 65 | 744 | 230 | 53 | 174 | 38 | 86 |
| Speed Limit | 57 | 734 | 226 | 53 | 168 | 38 | 85 |
| Rollover | 63 | 733 | 225 | 54 | 172 | 38 | 86 |
| Number of Lanes | 67 | 977 | 305 | 69 | 230 | 38 | 86 |
| Alignment | 69 | 977 | 305 | 69 | 230 | 38 | 86 |
Encroachment and Impact Condition Characterization
Six vehicle types were considered: passenger cars, vans, light trucks, motorcycles, single-unit trucks, and tractor-trailer trucks. These vehicle categories are based on the terminology NHTSA uses in the source NASS/CDS dataset. Passenger cars include sedans, convertibles, and station
wagons. Vans include mini-vans and van-based light trucks. Utility vehicles include compact utility vehicles (CUVs) and sport utility vehicles (SUVs). Light trucks include pickup trucks and other trucks with a gross vehicle weight rating under 10,000 lb. NCHRP 17-43 data were merged with NASS/CDS to evaluate case weight in the context of passenger vehicles. Using case weights assigned in NASS/CDS allows frequency estimates to be nationally representative (Radja 2016). The analysis of cases from LTCCS was unweighted, and MCCS does not include any case weights. The cases from NCHRP 22-26 were combined with MCCS to increase the number of motorcycle crashes available for analysis. In this analysis, the departure angle, posted speed, impact angle, road type, and object struck were compared between the vehicle types. These comparisons help to understand the differences in roadside impacts involving motorcycles due to their unique characteristics.
5.1.3 Results
Impact and Departure Angles
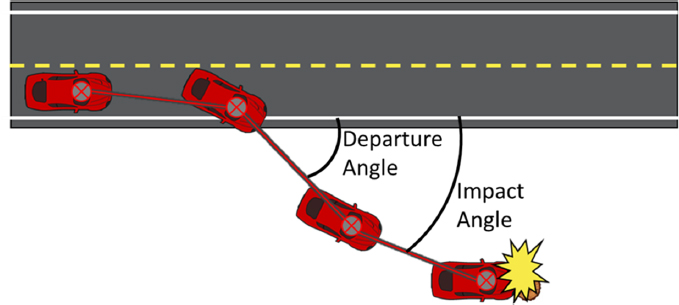
For each type of vehicle, the departure angles on each side of the road were combined and plotted using a cumulative distribution function (CDF). All included departure cases represent full road departures. Departures from both sides of the road occurred between 0 and 180 degrees, with 0 degrees being tangent to the roadway in the direction of travel and 180 degrees being tangent to the roadway in the opposite direction.
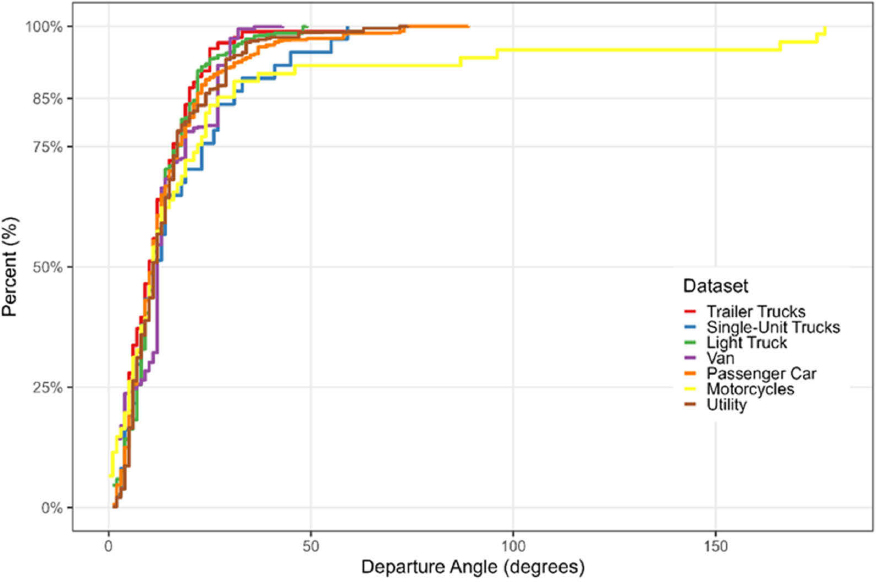
In general, the distributions of departure angles corresponding to each vehicle type were nearly identical up to 13 degrees, or roughly 65% (Figure 16). The single-unit truck 85th percentile departure angle was 33 degrees, which was higher than the other vehicle types (Figure 16). The distribution of motorcycle and tractor-trailer truck departure angles were very similar to each of the passenger vehicle types. The median motorcycle departure angle was 27 degrees. The largest motorcycle departure angles were much larger than those of passenger vehicles due to a control loss prior to the departure.
The distribution of impact angles was very similar across all vehicle types (Table 62). The 85th percentile impact angles for motorcycles, passenger cars, utility vehicles, and light trucks were similar (Figure 17). Vans tended to have higher impact angles than the other vehicle types.

| Departure Angle (degrees) | Impact Angle (degrees) | |||||
|---|---|---|---|---|---|---|
| 15th Percentile | Median | 85th Percentile | 15th Percentile | Median | 85th Percentile | |
| Motorcycles | 4 | 11 | 24 | 2 | 8 | 24 |
| Passenger Cars | 5 | 11 | 22 | 4 | 12 | 26 |
| Utility Vehicles | 5 | 11 | 24 | 5 | 11 | 27 |
| Vans | 3 | 12 | 27 | 7 | 15 | 32 |
| Light Trucks | 5 | 11 | 22 | 4 | 11 | 23 |
| Single-Unit Trucks | 4 | 11 | 33 | 3 | 10 | 29 |
| Tractor-Trailer Trucks | 4 | 10 | 20 | 2 | 9 | 22 |
Event Characteristics
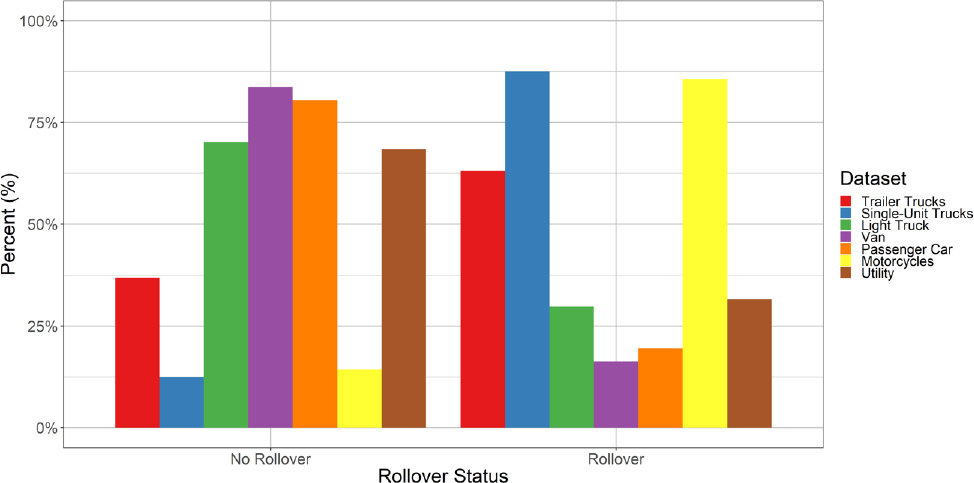
Overall, large trucks and motorcycles roll over at a rate much greater than passenger vehicles. Approximately three quarters of roadside crashes in a passenger car, utility vehicle, van, or light truck were non-rollover. In contrast, over 84% of motorcycle, 88% of single-unit truck, and 63% of tractor-trailer truck roadside crashes were rollover (Figure 18). This difference is likely due to the different body types. Large trucks often have a higher center of gravity, making it easier for them to roll over, while motorcycles are less stable with only two wheels compared to a typical four-wheel passenger vehicle.
Ejection in passenger vehicles is relatively uncommon but occurs during nearly all motorcycle impacts. Within the NCRHP 17-88 database, motorcycles were classified at each event into three major positions. Motorcyclists can be in the upright position on the motorcycle, they can be coupled to the motorcycle but the motorcycle is horizontal, or the motorcyclist can be separated from the motorcycle. An upright motorcyclist is attached to a motorcycle moving in standard upright motion, a down motorcyclist is attached to a motorcycle that is sliding or moving on its
side, and a separated motorcyclist is completely removed from the motorcycle. Over 75% of recorded motorcycle crashes included multiple events. During the first event, almost 80% of cases were upright. By the second event, almost 50% of cases were separated. This indicates that a large percentage of riders lose contact with the motorcycle during the first event and are separated during any subsequent events (Figure 19).

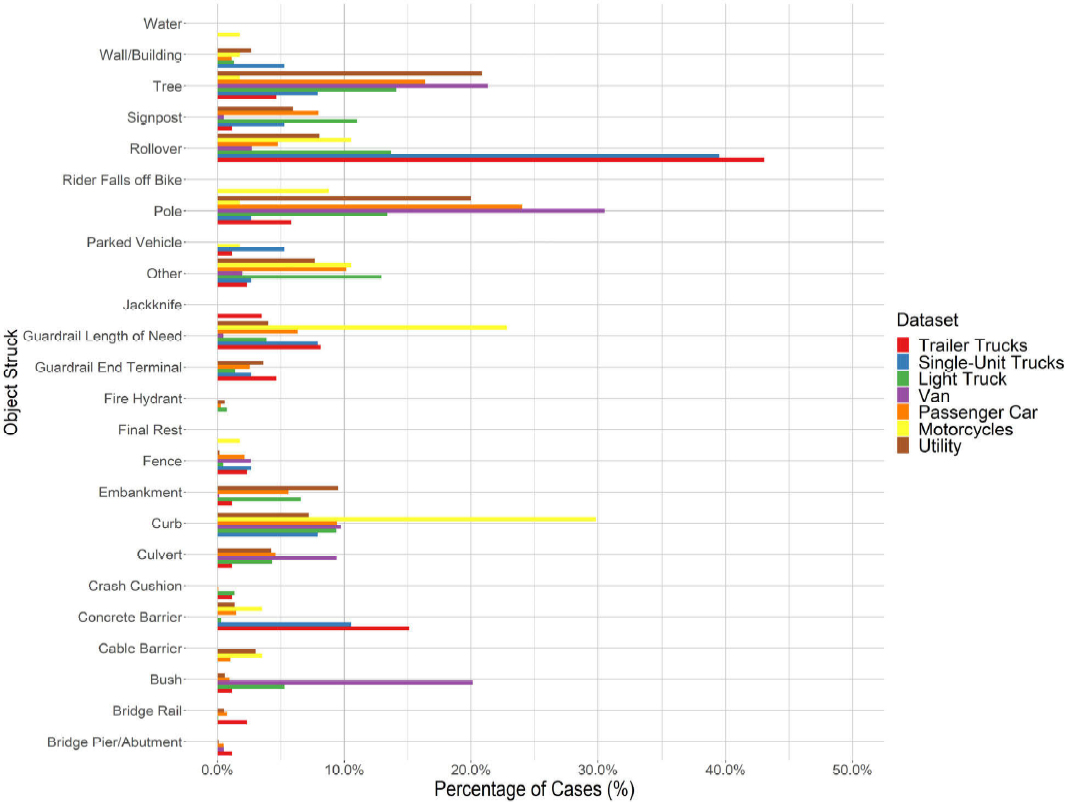
The first roadside crash event for passenger vehicles typically involved fixed objects such as trees and poles. In contrast, the most common first roadside crash event for single-unit and tractor-trailer trucks involved concrete barriers, guardrails, or a rollover. For motorcycles, the most common objects contacted were curbs and the guardrail length of need (Figure 20). Motorcycles likely have a larger percentage of recorded impacts with curbs due to their reduced size and lack of encompassing body. Curb impacts are likely not severe enough to be recorded as an event by the original crash investigator for larger vehicle types such as passenger vehicles and large trucks. Motorcycle impacts with guardrails are overrepresented in this dataset because of the sampling criteria of the NCHRP 22-26 project.
Road Characteristics
One contributor to the differences in roadside objects struck across the vehicle types is the road types commonly traveled by these vehicles. While passenger vehicle and motorcycle crashes were evenly distributed across most posted speed limits, large truck crashes were more frequent on higher speed roads (Figure 21). Motorcycle and tractor-trailer truck crashes are significantly more common on divided roads, while passenger vehicle crashes are more common on undivided roads (Figure 22). Large truck road departure crashes occurred on higher speed, multilane roads more often than passenger vehicle and motorcycle road departure crashes. Over half of large truck road departure crashes occurred on roads with a speed limit of 55 mph (88 km/h) averaging more than two lanes in the direction of travel. In contrast, half of motorcycle and passenger vehicle crashes occur on roads with a speed limit of 40 mph (65 km/h), with passenger vehicles averaging significantly less than two lanes in the direction of travel. Single-lane roads refer to undivided roads with two lanes, one in each direction of travel.


Motorcycle crashes on curved roadways occurred at a frequency higher than other vehicle types. Over 65% of motorcycles crash on curved roadways, while all other vehicle types crash on curved roadways with a frequency less than 50% (Figure 23). Previous motorcycle-barrier crash studies by Jama et al. (2011) and Berg et al. (2005) also found that the majority of motorcycle crashes occurred on curves. Gabler et al. (2007) found that 75% of fatal motorcycle-guardrail collisions
occurred on a curve. Furthermore, motorcycle crashes occurred on roads with a smaller radius of curvature (Figure 24).


Injury Outcomes
Injury outcomes were typically more severe for motorcycles and large trucks compared to passenger vehicles, with a dramatic difference in motorcycles. When a crash occurs, a KABCO injury designation is given by police on scene, while Abbreviated Injury Scale (AIS) injury scores
are assigned by medical professionals after triage. AIS levels are not recorded in LTCCS. On the AIS scale, motorcycle injuries are more common at the most severe designations of Critical and Maximum (Figure 25). Motorcycles have increased injury due to the lack of safety features that prevent injury in passenger vehicles like airbags and seatbelts. When comparing light trucks and passenger vehicles using KABCO designations, they are similar at the two most severe levels of incapacitating injury and fatal. However, light trucks have a much greater percentage of injuries that are not incapacitating, while passenger vehicles have a greater percentage of no or possible injury (Figure 26). Light trucks experience a higher frequency of high-speed limit rollover crashes, which can increase injury severity.


5.1.4 Discussion
Objects Struck
When studying objects struck, the percentages are relatively consistent across the different vehicle types, with a larger percentage of passenger vehicles striking poles and trees, motorcycles striking curbs, and a larger percentage of large trucks striking concrete barriers. The increase in curbs hit by motorcycles is likely due to the small body size and lack of an encompassing frame on motorcycles. Impacts with curbs are likely not severe enough to be recorded in standard impacts
in large trucks or passenger vehicles. The higher number of concrete barriers hit by large trucks compared to other vehicle types could be due in part to large trucks primarily operating on higher speed limit multilane roads. In contrast, passenger vehicles were more likely to hit fixed objects such as poles and trees, likely due to passenger vehicles traveling on lower speed limit, single-lane roads. High speed limit, multilane roads are likely interstates with a designated clear zone and a greatly increased prevalence of concrete barriers. Single-lane, low speed limit roadways have the potential to be much closer to fixed objects, increasing the frequency that vehicles collide with said objects.
Barrier Impact Tests
The motorcycle impact angles were very similar to passenger cars and light trucks, which are the current MASH test vehicles (Table 63). The passenger car and light truck 85th percentile impact angles were very similar to the MASH test criteria. The 85th percentile impact angle for large trucks, both single-unit and tractor-trailer trucks, was higher than the MASH test conditions. This is likely due to LTCCS sampling higher severity crashes.
| Impact Angle (degrees) |
|||||
|---|---|---|---|---|---|
| Passenger Car | Pickup Truck | Single-Unit Truck | Tractor-Trailer Truck | Motorcycle | |
| 15th Percentile | 4 | 4 | 3 | 2 | 2 |
| Median | 12 | 11 | 10 | 9 | 8 |
| 85th Percentile | 26 | 23 | 29 | 22 | 24 |
| MASH Testing Guidelines | 25 | 25 | 15 | 15 | - |
Previous studies have performed motorcycle impacts in upright and separated crash conditions because motorcyclists were often ejected from their motorcycle. This study found that during the first impact, the majority of motorcycles were upright. In only 20% of these first impacts, either the motorcycle was down with the rider still on the motorcycle or the rider had separated from the motorcycle. To date, this down but coupled with the rider configuration has not been performed with physical testing. After the first impact, the majority of riders have been separated from their motorcycle. After three impacts, no motorcycles remained upright. Future motorcycle-barrier crash tests should alter the configuration of the motorcycle and the motorcyclist depending on the intended installation type. If the barrier is likely to be the first impact once installed, then an impact with the motorcycle in the upright position would be the most representative. However, if the barrier is likely to be the second impact, such as an installation behind a curb, then an impact test with the motorcyclist separated from the motorcycle would be most representative.
The MASH testing impact angle for sedans and pickup trucks was very close to the 85th percentile impact angle in the NCHRP 17-88 database. If MASH were to adopt a similar practical worst-case scenario (85th percentile) for motorcycle crashes, the impact angle would be 24 degrees. This is lower than the 30-degree impact angle in CEN 1317 part 8, the currently adopted standard in Europe. Based on the motorcycle impacts in the NCHRP 17-88 database, the majority of riders are upright on the motorcycle just prior to the first impact event. MASH could prioritize tests with an
upright configuration to most closely match the roadside impacts observed in the U.S. This would be different from head-first, prone position of the rider alone during the impact test prescribed in CEN 13-17 part 8. However, this test would be very similar to the upright test conducted at TTI (Silvestri Dobrovolny et al. 2019).
Limitations
The in-depth data from MCCS were combined with NCHRP 22-26 to increase the sample size of motorcycle impacts in the NCHRP 17-88 database. While this is all of the available in-depth motorcycle crash data since 2000, it is important to note the small sample of motorcycle crashes analyzed. The results from these motorcycle barrier crashes may not generalize outside of the collection area (California and North Carolina). However, until additional motorcycle crash data are collected, this study represents the largest analysis of motorcycle impact conditions.
5.1.5 Conclusions
This study analyzed the largest collection of in-depth motorcycle crash data and compared the impact conditions of passenger vehicles, motorcycles, and large trucks. Tractor-trailer trucks consistently had lower departure and impact angles compared to passenger vehicles, while motorcycles tended to have very similar departure and impact angles compared to passenger vehicles. The higher center of mass in large trucks and the decreased stability of motorcycles resulted in a much higher frequency of rollover in the sampled road departure crashes. Additionally, it was found that motorcyclists are typically upright during the first impact event. By the second impact event, the majority of motorcyclists were separated from the motorcycle. Passenger vehicle and large truck testing standards are determined by the 85th percentile of impact angles in the U.S. Following this precedent, future motorcycle-barrier impact studies should consider a 24-degree impact angle. Additionally, the vast majority of motorcycle crashes in the NCHRP 17-88 database were upright during the first impact. Testing should consider testing in the upright configuration at a 24-degree impact angle to most closely reflect current crashes occurring on the roadway.


