Roadside Encroachment Database and Analysis (2025)
Chapter: Appendix B: Details of State Roadway Segment Selection
Appendix B
Details of State Roadway Segment Selection
Luke E. Riexinger
Virginia Tech
Blacksburg, VA
Douglas J Gabauer
Bucknell University
Lewisburg, PA
September 30, 2023
List of Tables
Table 1. Roadway Types Considered in the HSM Predictive Methodology
Table 2. Roadway, Traffic and Roadside Characteristics Use in the Roadway Selection Process
Table 3. State Roadway Miles and Number of Routes by HSM Classification and State
Table 4. Available Routes (State Jurisdiction Only) and Total Mileage by State Agency Partner
Table 5. Available Washington State Rural Undivided Roadway Segments
Table 6. Operational Characteristics of the Top 20 Longest RU2L2W Routes in Washington State
Table 7. Geometric Characteristics of the Top 20 Longest RU2L2W Routes in Washington State
Table 8. Available Tennessee Rural Undivided Roadway Segments
Table 9. Operational Characteristics of the Top 20 Longest RU2L2W Routes in Tennessee
Table 10. Geometric Characteristics of the Top 20 Longest RU2L2W Routes in Tennessee
Table 11. Operational Characteristics of the Top 20 Longest RUMLH Routes in Tennessee
Table 12. Geometric Characteristics of the Top 20 Longest RUMLH Routes in Tennessee
Table 13. Available Iowa Rural Undivided Roadway Segments
Table 14. Operational Characteristics of the Top 20 Longest RU2L2W Routes in Iowa
Table 15. Geometric Characteristics of the Top 20 Longest RU2L2W Routes in Iowa
Table 16. Operational Characteristics of Iowa RUMLH Route
Table 17. Geometric Characteristics of Iowa RUMLH Route
Table 18. Selected RU2L2W Routes and Associated Characteristics
Table 19. Selected RUMLH Routes and Associated Characteristics
Table 20. Available Washington State Urban/Suburban Undivided Roadway Segments
Table 21. Operational Characteristics of the Top 20 Longest 2U/3T Routes in Washington State
Table 22. Geometric Characteristics of the Top 20 Longest 2U/3T Routes in Washington State
Table 23. Operational Characteristics of the Top 20 Longest 4U/5T Routes in Washington State
Table 24. Geometric Characteristics of the Top 20 Longest 4U/5T Routes in Washington State
Table 25. Available Tennessee Urban/Suburban Undivided Roadway Segments
Table 26. Operational Characteristics of the Top 20 Longest 2U/3T Routes in Tennessee
Table 27. Geometric Characteristics of the Top 20 Longest 2U/3T Routes in Tennessee
Table 28. Operational Characteristics of the Top 20 Longest 4U/5T Routes in Tennessee
Table 29. Geometric Characteristics of the Top 20 Longest 4U/5T Routes in Tennessee
Table 30. Available Iowa State Urban/Suburban Undivided Roadway Segments
Table 31. Operational Characteristics of the Top 20 Longest 2U/3T Routes in Iowa
Table 32. Geometric Characteristics of the Top 20 Longest 2U/3T Routes in Iowa
Table 33. Operational Characteristics of the Top 20 Longest 4U/5T Routes in Iowa
Table 34. Geometric Characteristics of the Top 20 Longest 4U/5T Routes in Iowa
Table 35. Selected 2U/3T Routes and Associated Characteristics
Table 36. Selected 4U/5T Routes and Associated Characteristics
Table 37. Available Washington State Rural Divided Roadway Segments
Table 39. Geometric Characteristics of the Rural Divided Multilane (R4D) Routes in Washington State
Table 40. Operational Characteristics of the Rural Divided Freeway (R4F) Routes in Washington State
Table 41. Geometric Characteristics of the Rural Divided Freeway (R4F) Routes in Washington State
Table 42. Operational Characteristics of the Rural Divided Freeway (R6F) Routes in Washington State
Table 43. Geometric Characteristics of the Rural Divided Freeway (R6F) Routes in Washington State
Table 44. Available Tennessee Rural Divided Roadway Segments
Table 46. Geometric Characteristics of the Top 20 Rural Divided Multilane (R4D) Routes in Tennessee
Table 47. Operational Characteristics of the Rural Divided Freeway (R4F) Routes in Tennessee
Table 48. Geometric Characteristics of the Rural Divided Freeway (R4F) Routes in Tennessee
Table 49. Operational Characteristics of the Rural Divided Freeway (R6F) Routes in Tennessee
Table 50. Geometric Characteristics of the Rural Divided Freeway (R6F) Routes in Tennessee
Table 51. Available Iowa Rural Divided Roadway Segments
Table 52. Operational Characteristics of the Top 20 Rural Divided Multilane (R4D) Routes in Iowa
Table 53. Geometric Characteristics of the Top 20 Rural Divided Multilane (R4D) Routes in Iowa
Table 54. Operational Characteristics of the Rural Divided Freeway (R4F) Routes in Iowa
Table 55. Geometric Characteristics of the Rural Divided Freeway (R4F) Routes in Iowa
Table 56. Operational Characteristics of the Rural Divided Freeway (R6F) Routes in Iowa
Table 57. Geometric Characteristics of the Rural Divided Freeway (R6F) Routes in Iowa
Table 58. Selected R4D Routes and Associated Characteristics
Table 59. Selected R4F Routes and Associated Characteristics
Table 60. Selected R6F Routes and Associated Characteristics
Table 61. Available Washington State Urban/Suburban Divided Roadway Segments
Table 70. Available Tennessee Urban/Suburban Divided Roadway Segments
Table 78. Geometric Characteristics of the Urban/Suburban Divided Freeway (U8F) Routes in Tennessee
Table 80. Geometric Characteristics of the Urban/Suburban Divided Freeway (U10F) Routes in Tennessee
Table 81. Available Iowa Urban/Suburban Divided Roadway Segments
Table 88. Operational Characteristics of the Urban/Suburban Divided Freeway (U8F) Routes in Iowa
Table 89. Geometric Characteristics of the Urban/Suburban Divided Freeway (U8F) Routes in Iowa
Table 90. Operational Characteristics of the Urban/Suburban Divided Freeway (U10F) Routes in Iowa
Table 91. Geometric Characteristics of the Urban/Suburban Divided Freeway (U10F) Routes in Iowa
Table 92. Selected U4D Routes and Associated Characteristics
Table 93. Selected U4F Routes and Associated Characteristics
Table 94. Selected U6F Routes and Associated Characteristics
Table 95. Selected U8F Routes and Associated Characteristics
Table 96. Selected U10F Routes and Associated Characteristics
List of Figures
Figure 1. Graphical Depiction of Rural Undivided Roadway Classification Scheme
Figure 2. Top 20 Longest Rural 2-Lane, 2-Way Undivided (RU2L2W) Routes in Washington State
Figure 3. Top 20 Longest Rural 2-Lane, 2-Way Undivided (RU2L2W) Routes in Tennessee
Figure 4. Top 20 Longest Rural Multilane Highway (RUMLH) Routes in Tennessee
Figure 5. Top 20 Longest Rural 2-Lane, 2-Way Undivided (RU2L2W) Routes in Iowa
Figure 6. Top 20 Longest Urban/Suburban Undivided Routes (2U/3T) in Washington State
Figure 7. Top 20 Longest Urban/Suburban Undivided Routes (4U/5T) in Washington State
Figure 8. Top 20 Longest Urban/Suburban Undivided Routes (2U/3T) in Tennessee
Figure 9. Top 20 Longest Urban/Suburban Undivided Routes (4U/5T) in Tennessee
Figure 10. Top 20 Longest Urban/Suburban Undivided Routes (2U/3T) in Iowa
Figure 11. Top 20 Longest Urban/Suburban Undivided Routes (4U/5T) in Iowa
Figure 12. 4-Lane Rural Divided Multilane (R4D) Routes in Washington State
Figure 13. 4-Lane Rural Divided Freeway (R4F) Routes in Washington State
Figure 14. 6-Lane Rural Divided Freeway (R6F) Routes in Washington State
Figure 15. Top 20 4-Lane Rural Divided Multilane (R4D) Routes in Tennessee
Figure 16. 4-Lane Rural Divided Freeway (R4F) Routes in Tennessee
Figure 17. 6-Lane Rural Divided Freeway (R6F) Routes in Tennessee
Figure 18. Top 20 4-Lane Rural Divided Multilane (R4D) Routes in Iowa
Figure 19. 4-Lane Rural Divided Freeway (R4F) Routes in Iowa
Figure 20. 6-Lane Rural Divided Freeway (R6F) Routes in Iowa
Figure 21. Top 20 4-Lane Urban/Suburban Divided Arterial (U4D) Routes in Washington State
Figure 22. Top 20 4-Lane Urban/Suburban Divided Freeway (U4F) Routes in Washington State
Figure 23. 6-Lane Urban/Suburban Divided Freeway (U6F) Routes in Washington State
Figure 24. 8-Lane Urban/Suburban Divided Freeway (U8F) Routes in Washington State
Figure 25. Top 20 4-Lane Urban/Suburban Divided Arterial (U4D) Routes in Tennessee
Figure 26. Top 20 4-Lane Urban/Suburban Divided Freeway (U4F) Routes in Tennessee
Figure 27. Top 20 6-Lane Urban/Suburban Divided Freeway (U6F) Routes in Tennessee
Figure 28. 8-Lane Urban/Suburban Divided Freeway (U8F) Routes in Tennessee
Figure 29. 10-Lane Urban/Suburban Divided Freeway (U10F) Routes in Tennessee
Figure 30. Top 20 4-Lane Urban/Suburban Divided Multilane (U4D) Routes in Iowa
Figure 31. Top 20 4-Lane Urban/Suburban Divided Freeway (U4F) Routes in Iowa
Figure 32. Top 20 6-Lane Urban/Suburban Divided Freeway (U6F) Routes in Iowa
Figure 33. 8-Lane Urban/Suburban Divided Freeway (U8F) Routes in Iowa
Figure 34. 10-Lane Urban/Suburban Divided Freeway (U10F) Routes in Iowa
Introduction
The NCHRP 17-88 encroachment database includes data on individual encroachments, including reported and unreported encroachments/crashes determined from available state agency partner crash and maintenance data. The approach was to analyze a representative sample of roadway sections from each of the three state agency partners.
The purpose of this document is to summarize the selection of representative roadway segments for inclusion in the NCHRP 17-88 encroachment database. The representative segments were selected from each of the three state agency partners, Washington State (WA), Iowa (IA), and Tennessee (TN).
State Roadway Segment Selection Process Summary
The research team selected representative roadway segments for each state agency partner using the following procedure:
- Categorize all inventoried state-jurisdiction roadway segments based on the Highway Safety Manual (HSM; American Association of State Highway and Transportation Officials [AASHTO, 2010]) classification scheme presented in Table 1—e.g. using land use and roadway configuration (primary variables listed in Table 2). Determine the count of different routes and associated mileage of roadways that fall into each possible category (excluding ramps). A single route designation may span multiple classifications, so the mileage associated with each classification will provide additional context for the selection process.
Table 1. Roadway Types Considered in the HSM Predictive Methodology
| Land Use | Roadway Segment Configuration | |
|---|---|---|
| Undivided | Divided | |
| Rural | 2-lane, two-way Multilane highway (4 lane) Ramp segments (1–2 lane) |
Multilane highway (4 lane) 4-lane freeway 6-lane freeway 8-lane freeway |
| Urban (suburban) |
Arterial (2–5 lanes) Ramp segments (1–2 lane) |
Arterial (4 lanes) 4-lane freeway 6-lane freeway 8-lane freeway 10-lane freeway |
- Assess the ranges of secondary variables (see Table 2)—e.g. all other widely available variables not used to determine HSM classification—for the longest mileage routes in each category. Tertiary variables will not be used in the initial selection process, as they are not readily available across all state agency partners, and in some cases, only have limited availability.
- Using the secondary variable data from the previous step, select route numbers for inclusion in the study. Considering the time required to match maintenance and crash records and collect any additional roadway information data needed for any selected route, the research team selected one route representing each of the possible 12 road segment type categories from each state, for a total of 36 routes. All road segments will be used for each selected route. Ramps selected for inclusion will be a census of ramps for the associated controlled access freeways selected in each state.
Table 2. Roadway, Traffic and Roadside Characteristics Use in the Roadway Selection Process
| Characteristic | Variable Type |
|---|---|
| Roadway Type (Access Control) | Primary |
| Number of Lanes (Roadway Type) | |
| Area Type (Applicable Roadway Types) | |
| Median | |
| Median Type | Secondary |
| Median Width | |
| Traffic Volume | |
| Posted Speed | |
| Lane Width | |
| Shoulder Width | |
| Shoulder Type | |
| Rumble Strip Presence | |
| Traffic volume by type | Tertiary |
| Design Speed | |
| Access Density | |
| Roadside Slope | |
| Horizontal Alignment | |
| Vertical Grade / Terrain Type | |
| Curb Presence (Type) | |
| Level-of-Service | |
| Roadside Hardware Presence |
Available Roadway Segments
Using the available roadway inventory data from each state agency partner, roadway segments were classified into four distinct categories based on land use and roadway configuration. The total mileage of each roadway category is shown in Table 3 along with the number of distinct routes in each category. Note that Table 3 includes only roadways within the respective state’s jurisdiction (i.e., state and interstate routes). For all three states, roadway inventory and maintenance data is only available for these roadways. Also note that there are important differences between state agencies. Washington State and Tennessee include both travel directions of a roadway in a single road segment record while Iowa has separate records for different directions of the same (divided) roadway. For example, Interstate 80 East and Interstate 80 West constitute two separate records in the Iowa roadway inventory data. The number of distinct Iowa routes listed in Table 3 as well as the associated mileage were adjusted to account for this difference; for instance, Interstate 80 East and Interstate 80 West count only once. Also
note that the route count in Table 3 includes overlap between the four categories. As an example Washington State Route 2 (SR 2) has segments that span all four categories, so SR 2 appears in the route count for each of the four categories: SR 2 is counted as one of the 138 rural undivided routes, one of the 22 rural divided routes, one of the 116 urban undivided routes, as well as one of the 74 urban divided routes. The mileage numbers shown, however, reflect only the portions of SR 2 that fall into each respective category; of the approximately 320 miles of SR 2, about 234 miles are rural undivided segments, 35 miles are rural divided segments, 36 miles are urban undivided segments, and 16 miles are urban divided segments.
Table 3. State Roadway Miles and Number of Routes by HSM Classification and State
| Land Use | Roadway Segment Configuration | |
|---|---|---|
| Undivided | Divided | |
| Rural | WA (4831 mi, 138 Routes) IA (6168 mi, 111 Routes) TN (8184 mi, 344 Routes) |
WA (623 mi, 22 Routes) IA (1633 mi, 62 Routes) TN (1423 mi, 161 Routes) |
| Urban (suburban) |
WA (767 mi, 116 Routes) IA (608 mi, 85 Routes) TN (2783 mi, 275 Routes) |
WA (726 mi, 74 Routes) IA (598 mi, 71 Routes) TN (1490 mi, 239 Routes) |
Median width and median type variables available for roadway segments in each state were used to distinguish divided from undivided roadway segments. Washington State roadway segments with median width values of zero indicate an undivided roadway while Iowa roadway segments with no reported median width indicate an undivided roadway. In both of these states, painted medians, including center turn lanes or center two-way left turn lanes, are not considered medians. This practice is consistent with the HSM definition, as undivided roadways can include segments with two-way left turn lanes or a center turn lane. For Tennessee, however, undivided roadway segments have either no reported median width or a non-zero median width and a “painted” median type. All other Tennessee roadway segments with non-zero median widths were considered divided roadways. Median types for divided roadways included grass medians, medians with longitudinal traffic barriers, and raised medians.
The total number of distinct routes for each state agency partner is shown in Table 4 along with the corresponding total mileage based on the available roadway inventory data. As a check, the corresponding state-owned roadway mileage reported by the Bureau of Transportation Statistics (BTS) for 2013 is also shown. There is good agreement between these values, within 2%.
Table 4. Available Routes (State Jurisdiction Only) and Total Mileage by State Agency Partner
| State | Unique Route Designations | Total Mileage | 2013 BTS Reported Mileage (% Difference) [2015] |
|---|---|---|---|
| WA | 188 | 6,946.9 | 7,054 (1.5) |
| IA | 139 | 9,008.1 | 8,883 (1.4) |
| TN | 448 | 13,881.3 | 13,899 (0.1) |
Rural Undivided Roadway Characteristics
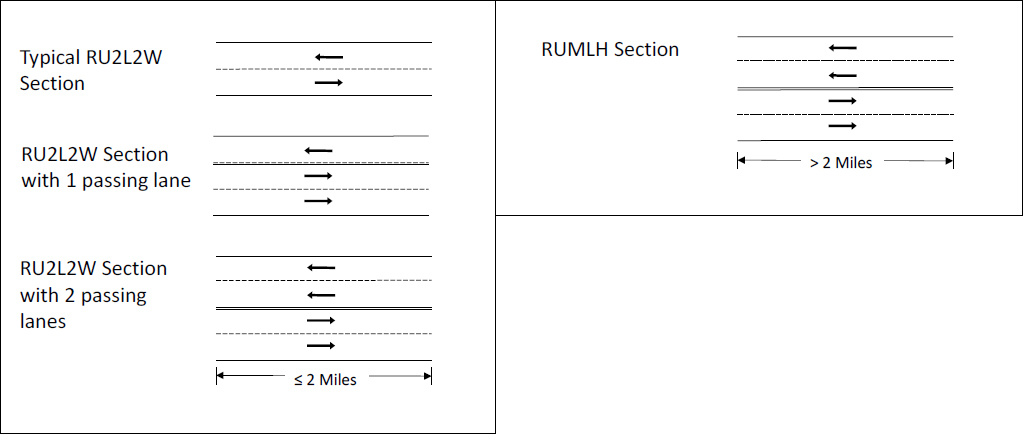
Using the available roadway information from each state, the rural undivided roadways were selected and further classified into the appropriate subcategories (listed in Table 1). The two rural undivided roadway segment subtypes are:
- 2-lane, 2-way roadways (RU2L2W), and
- Multilane highways (RUMLH).
For each rural undivided subcategory, the range of roadway and traffic characteristics—from the secondary variables shown in Table 2—were then examined for the routes with the longest subcategory-classified length in each of the three states. Representative rural undivided routes were then selected considering the associated roadway and traffic characteristics across all three states.
The available rural undivided roadway segments were first classified into the two subtype categories based on the information provided in HSM Chapter 10.3.1 (RU2L2W) and Chapter 11.3.1 (RUMLH; AASHTO, 2010). Note that ramps will be handled separately in the selection process. Although RU2L2W rural roadways generally have 2 lanes, the HSM indicates that these roadways include segments with one passing lane or a center two-way left turn lane (i.e. 3 lanes total) or short 4 lane segments that provide additional passing opportunities (i.e. side-by-side passing lanes). No maximum length is provided by the HSM to determine if a 4-lane rural undivided roadway section should be classified as a RU2L2W instead of a RUMLH. As the Highway Capacity Manual (HCM) specifies the upper bound for optimal passing lane length to be 2 miles (TRB 2016), 4-lane segments that are 2 miles or shorter were classified as RU2L2W and 4-lane segments that are longer than 2 miles were classified as RUMLH. This classification scheme is depicted graphically in Figure 1.
Washington State Rural Undivided Roadways and Associated Characteristics
Table 5 summarizes the classification results of the available rural undivided roadways in Washington State. The vast majority of the available sections are RU2L2W with only two routes
having portions classified as RUMLH. Of the available RUMLH roadways, Route 270 (4 miles) and Route 539 (2.3 miles), neither are of substantial length. Both of these routes also have segments that are classified as RU2L2W, but the RU2L2W portions of those two routes are also not of substantial length (e.g., 3.6 miles for Route 539 and 0.7 miles for Route 270). Given the lack of RUMLH segments in Washington State, the research team proposes selecting an additional RUMLH roadway from Tennessee or Iowa, depending on availability.
Table 5. Available Washington State Rural Undivided Roadway Segments
| Rural Undivided Roadway Type | Total Length [mi] | Unique Routes |
|---|---|---|
| RU2L2W | 4824.8 | 138 |
| RUMLH | 6.3 | 2 |
All of the available 138 distinct rural undivided roadways have at least some portion classified as RU2L2W. Figure 2 summarizes the top 20 RU2L2W roadways in Washington State based on total RU2L2W length available. In the Washington State roadway inventory, a change in any roadway characteristic results in a new roadway segment entry, even if the change does not impact the overall roadway classification (the RU2L2W designation in this case). The result is a large number of short segments for each route. As an example, SR 2 has a total of 938 RU2L2W segments spanning the 234 miles classified as RU2L2W roadway, but many of these segments are adjacent to one another. The available segment data was processed to combine adjacent RU2L2W segments from the same route to determine the number of contiguous segments for each route; each contiguous segment contains multiple adjacent segments. Adjacent segments are defined as consecutive segments where the ending milepost of the first segment exactly matches the beginning milepost of the next segment. The number of contiguous RU2L2W segments for a given route is the left number shown in the Figure 2 data label (e.g. SR 2 has 7 contiguous RU2L2W segments). To continue with the SR 2 example, the first contiguous segment is from MP 8.65 to MP 12.55 and is a combination of 19 adjacent segments in the Washington roadway inventory data (data not present in Figure 2). The maximum contiguous length for each route is tallied and the average contiguous length is computed by dividing the total RU2L2W length by the number of contiguous segments for each route; these are the middle and right numbers in the Figure 2 data label, respectively. To continue with the SR 2 example, the longest of the SR 2 contiguous RU2L2W segments is 141.3 miles and, on average, the 7 contiguous segments are about 33 miles in length.
In general, longer routes with fewer contiguous segments are more desirable for inclusion in the current project. Longer lengths provide more crash exposure as well as the potential for a wider variation of roadway, roadside, and traffic characteristics. All of the routes shown in Figure 2 have a total RU2L2W length in excess of 50 miles. Note that approximately 40% (53 of 138 routes) have 10 miles or less total RU2L2W length available (not shown in Figure 2).
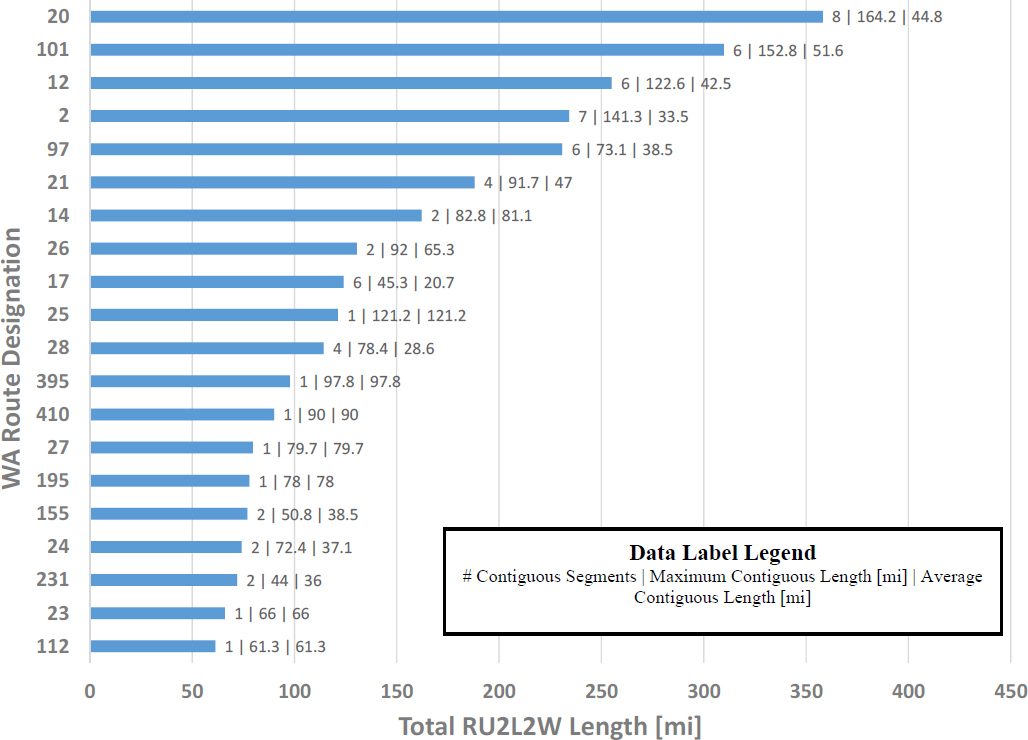
Table 6 and Table 7 present information on the secondary variables (see Table 2) for the 20 routes shown in Figure 2. Table 6 summarizes the operational characteristics while Table 7 summarizes the geometric characteristics. For each route, the range of average annual daily traffic (AADT), the range of large truck percentage, and the range of posted speed limit are shown in Table 6. Note that for state highways with no posted speed limit (i.e. missing posted speed in Table 6) Washington State legislation specifies a maximum speed of 60 mph (Revised Code of Washington [RCW], 46.61.400).
Table 6. Operational Characteristics of the Top 20 Longest RU2L2W Routes in Washington State
| Route Designation | AADT [veh/day] | Posted Speed Limit [mph] | Truck Percentage [%] | |||
|---|---|---|---|---|---|---|
| Minimum | Maximum | Minimum | Maximum | Minimum | Maximum | |
| 20 | 228 | 18,974 | 55 | 55 | 0.0 | 24.2 |
| 101 | 908 | 18,159 | 25 | 55 | 0.0 | 35.2 |
| 12 | 1,458 | 21,363 | 20 | 60 | 0.0 | 37.0 |
| 2 | 661 | 26,543 | 50 | 60 | 0.0 | 29.9 |
| 97 | 1,717 | 17,056 | 55 | 55 | 8.5 | 51.4 |
| 21 | 0 | 2,102 | . | . | 0.0 | 39.8 |
| 14 | 0 | 9,758 | 55 | 55 | 8.1 | 58.5 |
| 26 | 1,165 | 5,548 | . | . | 14.1 | 35.5 |
| Route Designation | AADT [veh/day] | Posted Speed Limit [mph] | Truck Percentage [%] | |||
|---|---|---|---|---|---|---|
| Minimum | Maximum | Minimum | Maximum | Minimum | Maximum | |
| 17 | 611 | 10,283 | . | . | 0.0 | 57.8 |
| 25 | 0 | 2,206 | . | . | 0.0 | 58.3 |
| 28 | 338 | 9,158 | 40 | 40 | 6.1 | 31.9 |
| 395 | 0 | 16,186 | 60 | 60 | 2.8 | 31.0 |
| 410 | 463 | 4,527 | 40 | 40 | 4.4 | 26.7 |
| 27 | 381 | 7,115 | 35 | 35 | 3.8 | 32.4 |
| 195 | 3,546 | 10,421 | 60 | 60 | 0.0 | 33.5 |
| 155 | 1,030 | 5,138 | . | . | 4.6 | 14.4 |
| 24 | 981 | 19,312 | . | . | 0.0 | 44.3 |
| 231 | 246 | 2,190 | . | . | 7.0 | 29.8 |
| 23 | 236 | 1,552 | . | . | 0.0 | 24.5 |
| 112 | 956 | 5,776 | . | . | 9.1 | 26.5 |
For the geometric characteristics, minimum and mean lane width, mean and maximum shoulder width, and approximate proportion of roadway length with rumble strips are shown in Table 7. As Washington State roadway inventory data captures both directions of a roadway in a single entry, right and left shoulder width is available for undivided roadways. For the RU2L2W roadways, the left and right shoulder data is nearly identical. The shoulder width data shown in Table 7 considers both left and right shoulder width variables. The minimum shoulder width for all of the routes in Table 7 was zero so a minimum shoulder width column was not included in the table. The minimum and mean lane widths are reported. Note that the mean lane width includes a small number of larger outlier values, including some widths of nearly 40 feet. Typically, these are due to transition areas, such as sections that taper just before or after a section with a passing lane. Rumble strip presence data is not available in the Highway Safety Information System (HSIS) roadway inventory data but Washington State maintains this data separately. For each of the top 20 routes, the proportion of route length with any rumble strips present was computed using this separate dataset. Note that this data is based on the entire length of the roadway and not necessarily specific to the RU2L2W portions of the route. Nonetheless, the data provides a general indication of whether or not any rumble strips are present along a particular route. The available rumble strip data (not included in Table 7) also indicates the location of the rumble strips: centerline only, shoulders only, or both centerline and shoulder locations. Once specific routes have been selected, the exact details on the rumble strips will be merged into the corresponding HSIS roadway inventory data.
Table 7. Geometric Characteristics of the Top 20 Longest RU2L2W Routes in Washington State
| Route Designation | Lane Width [ft] | Shoulder Width [ft] | Approximate Rumble | ||
|---|---|---|---|---|---|
| Minimum | Mean | Mean | Maximum | Strip Presence [%] | |
| 20 | 11 | 12.0 | 4.2 | 36 | 28 |
| 101 | 10 | 13.0 | 4.2 | 21 | 79 |
| 12 | 11 | 13.0 | 5.4 | 36 | 79 |
| 2 | 11 | 13.4 | 5.3 | 40 | 79 |
| 97 | 10 | 12.8 | 5.9 | 23 | 83 |
| 21 | 10 | 11.8 | 2.8 | 10 | 8 |
| 14 | 11 | 12.8 | 4.6 | 12 | 77 |
| 26 | 10 | 12.1 | 6.4 | 10 | 99 |
| Route Designation | Lane Width [ft] | Shoulder Width [ft] | Approximate Rumble | ||
|---|---|---|---|---|---|
| Minimum | Mean | Mean | Maximum | Strip Presence [%] | |
| 17 | 11 | 12.8 | 5.8 | 10 | 55 |
| 25 | 11 | 11.2 | 2.3 | 10 | 0 |
| 28 | 10 | 13.3 | 7.4 | 26 | 50 |
| 395 | 10 | 13.4 | 5.0 | 20 | 49 |
| 410 | 10 | 11.7 | 4.3 | 38 | 58 |
| 27 | 10 | 12.2 | 3.5 | 10 | 82 |
| 195 | 9 | 13.3 | 6.0 | 24 | 89 |
| 155 | 10 | 13.1 | 3.9 | 8 | 62 |
| 24 | 11 | 12.2 | 6.4 | 10 | 40 |
| 231 | 11 | 11.4 | 2.6 | 21 | 0 |
| 23 | 10 | 12.6 | 3.5 | 10 | 0 |
| 112 | 11 | 12.0 | 3.2 | 10 | 85 |
Based on the data from the top 20 RU2L2W segments in Washington State, the following observations were made:
- The routes with the largest traffic volume variation are SR 2, followed by SR 12 and SR 24. All have a maximum daily traffic volume of approximately 20,000 vehicles per day or more.
- Most routes have little variation in posted speed limit. Notable exceptions are SR 12 and SR 101.
- With a few exceptions, the routes have maximum truck traffic percentages of 25% or higher. The routes with the highest truck percentages, 50% or higher, generally have lower traffic volumes of 10,000 vehicles per day or less. A notable exception is SR 97.
- Mean lane widths are generally higher for routes with higher traffic volumes.
- SR 2 has the largest variation in shoulder width followed by SR 410, SR 12, and SR 20.
- Most routes have more than 50% presence of rumble strips. Routes with 25% or less rumble strip coverage have traffic volumes of approximately 2,000 vehicles per day or less.
These observations along with the available Washington State rural undivided roadway characteristics will be combined with corresponding data from the other two state agency partners. This combined data will be used to select representative RU2L2W and RUMLH routes from all three state agency partners.
Tennessee Rural Undivided Roadways and Associated Characteristics
Similar to Washington State, Tennessee rural undivided roadways were examined in more detail. The available segments were classified as 2-lane, 2-way roadway (RU2L2W) or Multilane highways (RUMLH) using the same process described above for Washington State. The Tennessee roadway data was split among several different data tables, each with potentially disparate roadway segment boundaries, as opposed to Washington State, which has the majority of the basic roadway data integrated into a single data table. While this resulted in a more complicated and time-consuming process initially to combine the roadway data across these tables, the overall classification process was essentially the same between the states once the
Tennessee road data was combined. As with Washington State, only routes within state jurisdictions were included.
Table 8 summarizes the results of the classification of the available rural undivided roadways in Tennessee. Similar to Washington State, the majority of the available sections are RU2L2W but there are a reasonable number of RUMLH routes available.
Table 8. Available Tennessee Rural Undivided Roadway Segments
| Rural Undivided Roadway Type | Total Length [mi] |
Unique Routes |
|---|---|---|
| RU2L2W | 7870.1 | 344 |
| RUMLH | 240.1 | 29 |
Figure 3 summarizes the top 20 RU2L2W roadways in Tennessee based on total RU2L2W length available. The roadway inventory data was processed similarly to Washington State, combining adjacent segments with the same RU2L2W classification to determine the number of contiguous segments for each route. One important difference in the Tennessee data is that the route mileage resets to zero at every instance the route enters a new county and the data in Figure 3 has not been adjusted accordingly. As a result, each route will generally have a larger number of contiguous segments compared to those in Washington State. All of the routes shown in Figure 3 have a total RU2L2W length in excess of 75 miles. Note that approximately 37% (127 of 344 routes) have 10 miles or less total RU2L2W length available (not shown in Figure 3).
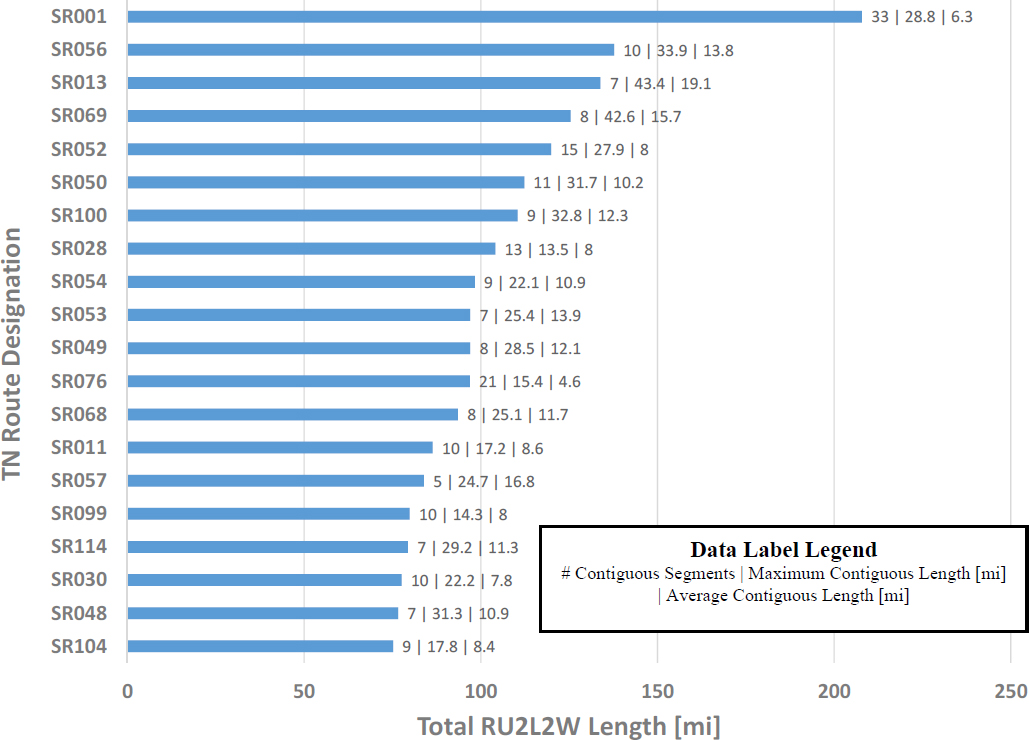
The operational and geometric characteristics of these 20 routes are shown in Table 9 and Table 10, respectively. For each route, the range of AADT, large truck percentage, and posted speed limit are shown in Table 9. For the geometric characteristics, minimum and mean lane width, minimum, minimum, mean and maximum shoulder width, and proportion of roadway length with shoulder rumble strips are shown in Table 10. For undivided roadways, a single outside shoulder width is reported in the Tennessee roadway data; this width was used to determine the shoulder width values reported in Table 10. Unlike Washington State, the minimum shoulder width for the longest 20 RU2L2W roadways exceeded zero and was typically either 1 or 2 feet wide. Note that Tennessee only reports shoulder width to the nearest foot. The minimum and mean lane widths are reported based on a combination of the pavement width data element (travel lanes only) and number of lanes data in the roadway description table and road geometry tables, respectively. The Tennessee maintenance inventory table includes shoulder rumble strip data, which was used to generate the rumble strip presence proportions shown in Table 10. These values reflect the proportion of RU2L2W length for each route that has shoulder rumble strips present. This was computed by dividing total shoulder rumble strip length for each route by the corresponding total shoulder edge length—twice the RU2L2W length reported in Figure 3.
Table 9. Operational Characteristics of the Top 20 Longest RU2L2W Routes in Tennessee
| Route Designation | AADT [veh/day] | Posted Speed Limit [mph] | Truck Percentage [%] | |||
|---|---|---|---|---|---|---|
| Minimum | Maximum | Minimum | Maximum | Minimum | Maximum | |
| SR001 | 1,270 | 15,530 | 25 | 55 | 1 | 28 |
| SR056 | 60 | 12,740 | 25 | 55 | 2 | 13 |
| SR013 | 380 | 21,180 | 30 | 55 | 2 | 38 |
| SR069 | 230 | 10,860 | 30 | 70 | 4 | 37 |
| SR052 | 760 | 13,670 | 25 | 55 | 0 | 13 |
| SR050 | 630 | 9,550 | 30 | 55 | 0 | 24 |
| SR100 | 480 | 15,830 | 30 | 55 | 2 | 21 |
| SR028 | 1,380 | 10,350 | 30 | 55 | 3 | 15 |
| SR054 | 1,150 | 6,120 | 20 | 55 | 2 | 19 |
| SR053 | 450 | 11,480 | 20 | 55 | 0 | 13 |
| SR049 | 680 | 9,880 | 20 | 55 | 1 | 20 |
| SR076 | 920 | 17,200 | 30 | 65 | 1 | 34 |
| SR068 | 900 | 11,110 | 20 | 55 | 2 | 16 |
| SR011 | 1,510 | 20,590 | 30 | 55 | 3 | 11 |
| SR057 | 810 | 8,780 | 30 | 70 | 4 | 39 |
| SR099 | 90 | 14,860 | 30 | 60 | 1 | 49 |
| SR114 | 180 | 3,610 | 20 | 55 | 1 | 27 |
| SR030 | 320 | 9,250 | 30 | 55 | 0 | 18 |
| SR048 | 550 | 9,650 | 20 | 55 | 2 | 18 |
| SR104 | 230 | 5,280 | 30 | 65 | 0 | 42 |
Table 10. Geometric Characteristics of the Top 20 Longest RU2L2W Routes in Tennessee
| Route Designation | Lane Width [ft] | Shoulder Width [ft] | Shoulder Rumble Strip Presence [%] | |||
|---|---|---|---|---|---|---|
| Minimum | Mean | Minimum | Mean | Maximum | ||
| SR001 | 8 | 12.7 | 1 | 6.0 | 18 | 85 |
| SR056 | 8 | 11.4 | 1 | 5.3 | 14 | 63 |
| SR013 | 8 | 11.4 | 1 | 5.5 | 20 | 60 |
| SR069 | 8 | 11.7 | 1 | 7.5 | 24 | 86 |
| SR052 | 8 | 11.5 | 1 | 7.4 | 16 | 88 |
| SR050 | 10 | 11.5 | 1 | 6.9 | 13 | 77 |
| SR100 | 8 | 12.1 | 1 | 4.8 | 12 | 74 |
| SR028 | 8 | 12.1 | 1 | 6.9 | 20 | 91 |
| SR054 | 8 | 11.2 | 1 | 4.4 | 13 | 40 |
| SR053 | 8 | 10.8 | 1 | 6.6 | 16 | 90 |
| SR049 | 8 | 11.2 | 1 | 5.4 | 24 | 45 |
| SR076 | 8 | 11.7 | 1 | 6.2 | 26 | 73 |
| SR068 | 8 | 11.8 | 1 | 6.2 | 18 | 66 |
| SR011 | 8 | 11.2 | 1 | 5.8 | 14 | 93 |
| SR057 | 10 | 11.4 | 2 | 5.2 | 14 | 19 |
| SR099 | 8 | 12.0 | 1 | 7.2 | 44 | 56 |
| SR114 | 8 | 11.0 | 2 | 5.4 | 12 | 20 |
| SR030 | 8 | 11.7 | 1 | 6.1 | 28 | 61 |
| SR048 | 11 | 12.2 | 1 | 5.1 | 12 | 60 |
| Route Designation | Lane Width [ft] | Shoulder Width [ft] | Shoulder Rumble Strip Presence [%] | |||
|---|---|---|---|---|---|---|
| Minimum | Mean | Minimum | Mean | Maximum | ||
| SR104 | 10 | 10.9 | 2 | 5.0 | 16 | 30 |
Figure 4 summarizes the top 20 RUMLH roadways in Tennessee based on total RUMLH length available. The roadway inventory data was processed similarly to the RU2L2W roadways, combining adjacent segments with the same RUMLH classification to determine the number of contiguous segments for each route. There are only nine additional routes available (not shown in Figure 4), all with total length of 3.2 miles or less.

The operational and geometric characteristics of these 20 RUMLH routes are shown in Table 11 and Table 12, respectively. For each route, the range of AADT, large truck percentage, and posted speed limit are shown in Table 11.
Table 11. Operational Characteristics of the Top 20 Longest RUMLH Routes in Tennessee
| Route Designation | AADT | [veh/day] | Posted Spe | d Limit [mph] | Truck Perc | entage [%] |
|---|---|---|---|---|---|---|
| Minimum | Maximum | Minimum | Maximum | Minimum | Maximum | |
| SR033 | 4,860 | 18,040 | 35 | 55 | 5 | 25 |
| SR006 | 6,100 | 16,080 | 35 | 60 | 10 | 17 |
| Route Designation | AADT | [veh/day] | Posted Spe | d Limit [mph] | Truck Perc | entage [%] |
|---|---|---|---|---|---|---|
| Minimum | Maximum | Minimum | Maximum | Minimum | Maximum | |
| SR015 | 5,030 | 20,850 | 30 | 70 | 5 | 52 |
| SR029 | 4,150 | 14,140 | 25 | 55 | 3 | 13 |
| SR032 | 7,320 | 21,700 | 45 | 55 | 13 | 23 |
| SR076 | 4,060 | 10,240 | 30 | 65 | 7 | 24 |
| SR026 | 4,810 | 14,980 | 40 | 55 | 2 | 11 |
| SR022 | 5,620 | 10,810 | 40 | 65 | 6 | 19 |
| SR099 | 3,760 | 10,580 | 30 | 60 | 2 | 5 |
| SR005 | 9,920 | 19,340 | 45 | 65 | 12 | 32 |
| SR052 | 3,960 | 15,470 | 30 | 60 | 3 | 8 |
| SR001 | 5,340 | 7,870 | 40 | 55 | 10 | 11 |
| SR010 | 12,490 | 14,400 | 45 | 55 | 10 | 11 |
| SR073 | 7,990 | 29,150 | 25 | 65 | 0 | 4 |
| SR055 | 8,720 | 13,460 | 45 | 55 | 9 | 18 |
| SR008 | 6,440 | 7,630 | 55 | 55 | 13 | 15 |
| SR030 | 8,140 | 12,700 | 40 | 55 | 0 | 26 |
| SR062 | 1,180 | 7,370 | 40 | 55 | 4 | 11 |
| SR034 | 5,900 | 10,770 | 40 | 55 | 3 | 6 |
| SR111 | 4,860 | 5,110 | 45 | 45 | 11 | 11 |
For the geometric characteristics, minimum and mean lane width, minimum, mean and maximum shoulder width, and proportion of roadway length with shoulder rumble strips are shown in Table 12. For undivided roadways, a single outside shoulder width is reported in the Tennessee roadway data; this width was used to determine the shoulder width values reported in Table 12. Unlike Washington State, the minimum shoulder width for the longest 20 RUMLH roadways exceeded zero and was typically either 1 or 2 feet wide. Note that Tennessee only reports shoulder width to the nearest foot. The minimum and mean lane widths are reported based on a combination of the pavement width data element (travel lanes only) and number of lanes data in the roadway description table and road geometry tables, respectively. The Tennessee maintenance inventory table includes shoulder rumble strip data, which was used to generate the rumble strip presence proportions shown in Table 12. These values reflect the proportion of RUMLH length for each route with shoulder rumble strips present. This was computed by dividing total shoulder rumble strip length for each route by the corresponding total shoulder edge length—twice the RUMLH length reported in Figure 4.
Table 12. Geometric Characteristics of the Top 20 Longest RUMLH Routes in Tennessee
| Route Designation | Lane Width [ft] | Shoulder Width [ft] | Shoulder Rumble Strip Presence [%] | |||
|---|---|---|---|---|---|---|
| Minimum | Mean | Minimum | Mean | Maximum | ||
| SR033 | 10 | 11.5 | 2 | 8.4 | 12 | 14 |
| SR006 | 12 | 12 | 1 | 8.4 | 12 | 54 |
| SR015 | 11 | 11.8 | 2 | 8.5 | 20 | 57 |
| SR029 | 12 | 12 | 2 | 9.2 | 18 | 81 |
| SR032 | 12 | 12 | 2 | 7.1 | 12 | 30 |
| SR076 | 9 | 11.7 | 2 | 9.1 | 13 | 74 |
| SR026 | 11 | 11.9 | 1 | 6.6 | 12 | 34 |
| SR022 | 12 | 12 | 2 | 9.2 | 16 | 50 |
| Route Designation | Lane Width [ft] | Shoulder Width [ft] | Shoulder Rumble Strip Presence [%] | |||
|---|---|---|---|---|---|---|
| Minimum | Mean | Minimum | Mean | Maximum | ||
| SR099 | 12 | 12 | 2 | 8.6 | 11 | 70 |
| SR005 | 12 | 12 | 2 | 11.0 | 12 | 57 |
| SR052 | 10.5 | 11.6 | 1 | 7.5 | 12 | 28 |
| SR001 | 12 | 12 | 2 | 4.9 | 6 | 37 |
| SR010 | 12 | 12 | 4 | 5.2 | 16 | 98 |
| SR073 | 11 | 11.8 | 1 | 3.4 | 9 | 0 |
| SR055 | 12 | 12 | 10 | 10.1 | 11 | 15 |
| SR008 | 12 | 12 | 5 | 5.8 | 6 | 86 |
| SR030 | 11 | 11.9 | 1 | 7.8 | 12 | 0 |
| SR062 | 12 | 12 | 2 | 4.0 | 10 | 80 |
| SR034 | 11 | 11.6 | 2 | 4.1 | 8 | 41 |
| SR111 | 12 | 12 | 10 | 10.6 | 12 | 100 |
Based on the data from the top 20 RU2L2W segments in Tennessee, the following observations were made:
- The routes with the largest traffic volume variation are SR 11 and SR 13. The maximum traffic volumes are approximately equivalent to the routes in Washington State with the highest traffic volumes. Tennessee has fewer lower traffic volume routes, less than 6,000 vehicles per day, compared to Washington State.
- The Tennessee routes have a wider variation in posted speed limit compared to those in Washington State.
- Less than half of the longest RU2L2W routes have maximum truck percentages in excess of 25%.
- SR 99 has the largest variation in shoulder width followed by SR 30 and SR 76.
- Most routes have more than 50% presence of rumble strips. Routes with 25% or less rumble strip coverage have larger traffic volume variation than similar roadways in Washington State.
Based on the data from the top 20 RUMLH segments in Tennessee, the following observations were made:
- Only the top 10 RUMLH routes have total lengths in excess of 10 miles.
- The routes with the largest traffic volume variation are SR 73, SR 32, and SR 15. Compared to the Tennessee top 20 RU2L2W routes, the RUMLH routes generally have higher minimum traffic volumes and, on average, higher maximum traffic volumes.
- The variation in posted speed limit and truck percentage for the RUMLH routes is comparable to the examined RU2L2W routes.
- Minimum lane width and minimum shoulder width are generally larger for the RUMLH routes compared to the examined RU2L2W routes.
- Compared to the Tennessee top 20 RU2L2W routes, the RUMLH routes generally have a wider variation in shoulder rumble strip presence with a number of routes having less than 50% coverage.
These observations, along with the available Tennessee rural undivided roadway characteristics, will be combined with corresponding data from the other two state agency partners. This combined data will be used to select representative RU2L2W and RUMLH routes from all three state agency partners.
Iowa Rural Undivided Roadways and Associated Characteristics
Similar to Washington State and Tennessee, Iowa rural undivided roadways (state jurisdiction) were examined in more detail. Table 13 summarizes the results of the classification of the available rural undivided roadways in Iowa. The vast majority of the available sections are RU2L2W and only a single route was classified as RUMLH.
Table 13. Available Iowa Rural Undivided Roadway Segments
| Rural Undivided Roadway Type | Total Length [mi] | Unique Routes |
|---|---|---|
| RU2L2W | 6147.6 | 111 |
| RUMLH | 20.8 | 1 |
Figure 5 summarizes the top 20 RU2L2W roadways in Iowa based on total RU2L2W length available. The roadway inventory data was processed similar to Washington State and Tennessee, combining adjacent segments with the same RU2L2W classification to determine the number of contiguous segments for each route. The maximum contiguous length for each route was tallied and the average contiguous length was computed by dividing the total RU2L2W length by the number of contiguous segments for each route. For the other two states, segments were only combined if the ending milepost of the preceding segment exactly matched the beginning milepost of the next segment. The milepost designations in Iowa, however, were reported to a precision of up to six decimal places. An initial processing of the data with exact milepost matching resulted in an unusually high number of segments as a result of very small discrepancies in a number of milepost values: 0.00001 miles or less, which equates to approximately 0.6 inches. For the Iowa data, the mileposts were considered a match if the absolute value of the difference was 0.00001 miles or less. The data shown in Figure 5 uses this slightly less stringent convention. All of the routes shown in Figure 5 have a total RU2L2W length in excess of 100 miles. Note that approximately 23% (26 of 111 routes) have 10 miles or less total RU2L2W length available (not shown in Figure 5).
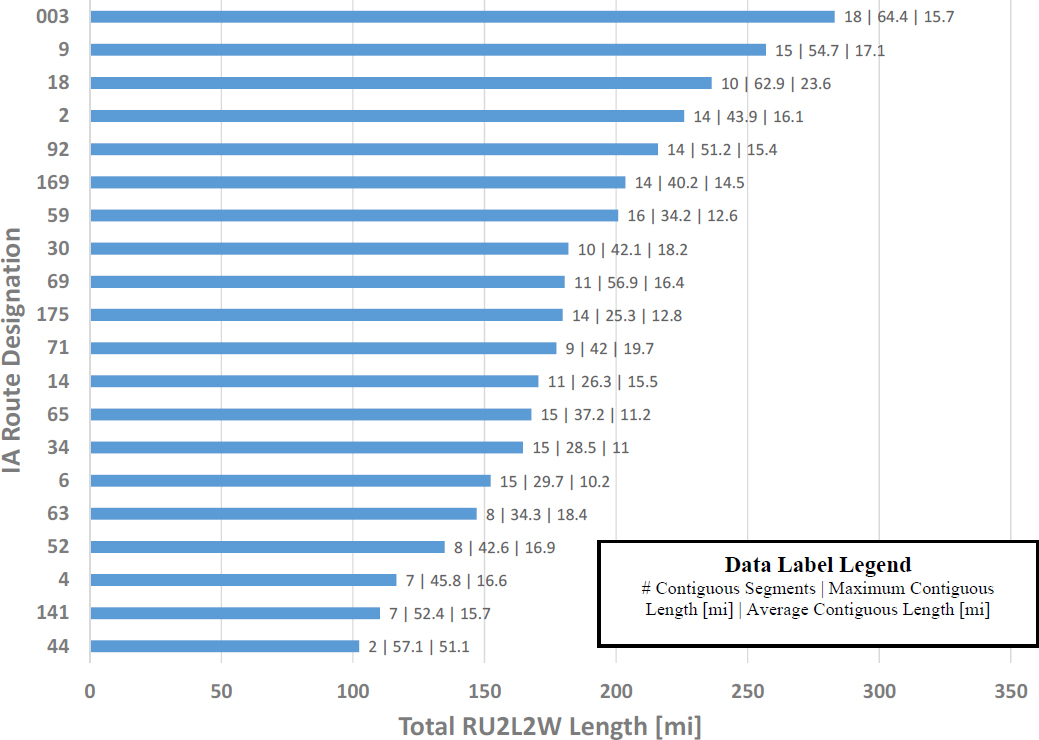
The operational and geometric characteristics of these 20 routes are shown in Table 14 and Table 15, respectively. For each route, the range of AADT, large truck percentage, and posted speed limit are shown in Table 14. For the geometric characteristics, minimum and mean lane width, mean and maximum shoulder width, and proportion of roadway length with shoulder rumble strips are shown in Table 15. Similar to Washington State, both left and right shoulder data available for the RU2L2W roadways and are nearly identical. Table 15 combines both left and right shoulder width variables. Similar to Washington State, the minimum shoulder width for the longest 20 RU2L2W roadways was zero, so a minimum shoulder width column was excluded from the table. The minimum and mean lane widths are reported based on a combination of the pavement width information and number of lanes present in the roadway table. The Iowa roadway data includes both right and left shoulder rumble strip data. The approximate rumble strip presence proportions in Table 15 do reflect the proportion of RU2L2W length for each route that has shoulder rumble strips present. This percentage was computed by dividing the total shoulder rumble strip length for each route by the corresponding total shoulder edge length available—twice the RU2L2W length reported in Figure 5 for the same route.
Table 14. Operational Characteristics of the Top 20 Longest RU2L2W Routes in Iowa
| Route Designation | AADT [veh/day] | Posted Speed Limit [mph] | Truck Percentage [%] | |||
|---|---|---|---|---|---|---|
| Minimum | Maximum | Minimum | Maximum | Minimum | Maximum | |
| 003 | 60 | 7,100 | 20 | 55 | 3.7 | 43.0 |
| 009 | 530 | 7,000 | 20 | 55 | 0.0 | 29.0 |
| 018 | 20 | 9,500 | 20 | 55 | 0.0 | 26.4 |
| 002 | 40 | 4,780 | 25 | 55 | 0.0 | 29.0 |
| 092 | 10 | 6,300 | 20 | 55 | 0.0 | 28.0 |
| 169 | 390 | 8,300 | 20 | 55 | 4.6 | 25.7 |
| 059 | 10 | 9,800 | 15 | 55 | 0.0 | 40.0 |
| 030 | 130 | 13,500 | 25 | 55 | 0.0 | 25.6 |
| 069 | 10 | 7,300 | 20 | 55 | 0.0 | 25.8 |
| 175 | 35 | 6,200 | 20 | 55 | 0.0 | 27.1 |
| 071 | 1,110 | 5,500 | 35 | 55 | 6.9 | 28.3 |
| 014 | 5 | 6,100 | 20 | 55 | 0.0 | 25.3 |
| 065 | 5 | 12,200 | 25 | 55 | 0.0 | 29.2 |
| 034 | 1,640 | 9,900 | 35 | 55 | 0.0 | 26.6 |
| 006 | 30 | 13,200 | 20 | 55 | 0.0 | 18.8 |
| 063 | 15 | 6,900 | 15 | 55 | 0.0 | 31.5 |
| 052 | 15 | 5,800 | 20 | 55 | 0.0 | 26.7 |
| 004 | 5 | 6,300 | 25 | 55 | 0.0 | 26.7 |
| 141 | 15 | 3,860 | 20 | 55 | 0.0 | 46.7 |
| 044 | 800 | 7,400 | 25 | 55 | 4.6 | 18.8 |
Table 15. Geometric Characteristics of the Top 20 Longest RU2L2W Routes in Iowa
| Route Designation | Lane Width [ft] | Shoulder Width [ft] | Shoulder Rumble Strip Presence [%] | ||
|---|---|---|---|---|---|
| Minimum | Mean | Mean | Maximum | ||
| 003 | 8.0 | 13.1 | 7.1 | 11.0 | 17 |
| 009 | 8.7 | 13.2 | 7.0 | 14.0 | 2 |
| 018 | 7.3 | 12.6 | 7.5 | 12.0 | 30 |
| 002 | 8.3 | 12.6 | 8.3 | 17.0 | 5 |
| 092 | 9.3 | 12.5 | 7.7 | 12.0 | 27 |
| 169 | 8.0 | 12.7 | 7.9 | 12.0 | 9 |
| 059 | 8.0 | 12.6 | 7.3 | 10.0 | 16 |
| 030 | 9.0 | 13.2 | 8.4 | 12.0 | 8 |
| 069 | 9.0 | 12.9 | 6.2 | 15.0 | 7 |
| 175 | 10.0 | 12.8 | 5.7 | 12.0 | <1 |
| 071 | 8.0 | 12.4 | 7.1 | 10.0 | 54 |
| 014 | 9.3 | 12.9 | 7.2 | 11.0 | 17 |
| 065 | 8.5 | 12.7 | 7.6 | 10.0 | 12 |
| 034 | 6.0 | 12.7 | 9.2 | 13.0 | 73 |
| 006 | 9.0 | 12.8 | 6.8 | 12.0 | 50 |
| 063 | 9.5 | 12.7 | 8.1 | 25.0 | 5 |
| 052 | 8.0 | 13.2 | 6.1 | 12.0 | <1 |
| 004 | 9.3 | 12.9 | 5.5 | 10.0 | 0 |
| 141 | 9.0 | 12.6 | 7.1 | 11.0 | 0 |
| 044 | 10.0 | 12.8 | 6.6 | 12.0 | 23 |
IA 4 was the only RUMLH roadway identified in Iowa. The portion of IA 4 classified as RUMLH consisted of a single 20.8 mile contiguous segment. The operational and geometric characteristics for IA 4 are summarized in Table 16 and Table 17, respectively. Although the traffic volume is relatively low, there is reasonable variation in posted speed, modest truck traffic, some variation in shoulder width and no shoulder rumble strips present.
Table 16. Operational Characteristics of Iowa RUMLH Route
| Route Designation | AADT [veh/day] | Posted Speed Limit [mph] | Truck Percentage [%] | |||
|---|---|---|---|---|---|---|
| Minimum | Maximum | Minimum | Maximum | Minimum | Maximum | |
| 004 | 480 | 2,740 | 30 | 55 | 7.4 | 14.0 |
Table 17. Geometric Characteristics of Iowa RUMLH Route
| Route Designation | Lane Width [ft] | Shoulder Width [ft] | Shoulder Rumble Strip Presence [%] | ||
|---|---|---|---|---|---|
| Minimum | Mean | Mean | Maximum | ||
| 004 | 12.0 | 12.7 | 7.9 | 10.0 | 0 |
Based on the data from the top 20 RU2L2W segments in Iowa, the following observations were made:
- The routes with the largest traffic volume variation are SR 30 and SR 6. The maximum traffic volumes are less than the available routes in Washington State and Tennessee, with all but three of the longest routes having AADT in excess of 10,000 vehicles per day.
- Similar to Tennessee, Iowa routes have a wider variation in posted speed limit compared to those in Washington State.
- Similar to Washington State, most of the longest RU2L2W routes have maximum truck percentages in excess of 25%.
- The variation in shoulder width on the longest RU2L2W routes is less than observed in Washington State and Tennessee.
- Compared to Washington, Iowa has several higher volume RU2L2W routes with smaller percentages of rumble strips: 25% or less.
These observations, along with the available Iowa rural undivided roadway characteristics, will be combined with corresponding data from the other two state agency partners. This combined data will be used to select representative RU2L2W and RUMLH routes from all three state agency partners.
Rural Undivided Roadway Selection
RU2L2W Roadway Selection
The available RU2L2W roadway characteristics (secondary variables from Table 2) from each state agency partner combined with the general observations were considered to select
representative RU2L2W routes from each state. The selected RU2L2W routes are shown in Table 18.
Table 18. Selected RU2L2W Routes and Associated Characteristics
| State | Route | Length [mi] | Max AADT [vpd] / Truck Percent [%] | Min / Max Posted Speed Limit [mph] | Mean/Max Shoulder Width [ft] |
|---|---|---|---|---|---|
| Washington | SR 2 | 234.2 | 26,543 / 29.9 | 50 / 60 | 5.3 / 40 |
| Tennessee | SR 69 | 125.4 | 10,860 / 37 | 30 / 70 | 7.5 / 24 |
| Iowa | SR 30 | 181.9 | 13,500 / 25.6 | 25 / 55 | 8.4 / 12 |
SR 2 is one of the longest RU2L2W routes in Washington and has the largest variation in traffic volume and shoulder width. The majority of SR 2 has rumble strips present. Tennessee has a number of RU2L2W routes with a wider range of posted speed limits. Tennessee SR 69 provides a large variation in posted speed limit (30 to 70 mph) and has a larger variation in traffic volume than SR 57, which has the same variation in posted speed limit. SR 69 also has, on average, a wider shoulder width than Washington SR 2 but a lower maximum shoulder width. SR 69 also has approximately the same rumble strip presence, 86%, as Washington SR 2. Iowa SR 30 provides a reasonable variation in posted speed limit and traffic volume and has relatively small proportion of rumble strips present at 8%.
RUMLH Roadway Selection
The available RUMLH roadway characteristics from each state agency partner combined with the general observations were considered to select representative RUMLH routes from each state. The selected RU2L2W routes are shown in Table 19. Recall that Washington State did not have any RUMLH segments available longer than 4 miles.
Table 19. Selected RUMLH Routes and Associated Characteristics
| State | Route | Length [mi] | Max AADT [vpd] / Truck Percent [%] | Min / Max Posted Speed Limit [mph] | Mean/Max Shoulder Width [ft] |
|---|---|---|---|---|---|
| Tennessee | SR 33 | 30.0 | 18,040 / 25 | 35 / 55 | 8.4 / 12 |
| SR 15 | 17.0 | 20,850 / 52 | 30 / 70 | 8.5 / 20 | |
| Iowa | SR 4 | 20.8 | 2,740 / 14 | 30 / 55 | 7.9 / 10 |
SR 33 is the longest RUMLH route available, has a relatively wide posted speed limit range, and a relatively sparse rumble strip presence. SR 15 is the third longest RUMLH route in Tennessee, has portions with a higher speed limit, generally has a larger proportion of heavy vehicle traffic, and a higher rumble strip presence. The sole RUMLH route in Iowa was selected to provide some state diversity, especially since Washington State had no RUMLH options longer than 4 miles.
Urban/Suburban Undivided Roadway Characteristics
The urban/suburban undivided roadways, or arterials, are examined in more detail. The four subtypes of urban undivided arterials identified in the HSM (Chapter 12.3.1; AASHTO, 2010) are:
- 2-lane undivided arterials (2U)
- 3-lane undivided arterials with center TWLTL (3T)
- 4-lane undivided arterials (4U)
- 5-lane undivided arterials with center TWLTL (5T)
As not all states have readily accessible two-way left turn lane (TWLTL) presence data, the four subcategories were merged into the following two categories for the purpose of roadway selection:
- 2-lane undivided arterials, with or without TWLTL (2U/3T)
- 4-lane undivided arterials, with or without TWLTL (4U/5T)
For states where information is available on TWLTL presence, this was considered as an additional data element in the selection process. For states where this information is not readily available, TWLTL presence will be determined for each selected route after the roadway selection process. Using the available roadway information from each state, the urban/suburban undivided roadways were selected and further classified into the two subcategories. For each urban/suburban undivided subcategory, the range of roadway and traffic characteristics—from the secondary variables shown in Table 2—were then examined for the routes with the longest subcategory-classified length in each of the three states. Representative urban/suburban undivided routes were then selected considering the associated roadway and traffic characteristics across all three states. Similar to the rural undivided roadways, ramps will be handled separately in the selection process.
Washington Urban/Suburban Undivided Roadways and Associated Characteristics
Table 20 summarizes the results of the available urban/suburban classification of the undivided roadways in Washington State. Note that Washington State does not have TWLTL data readily available. The majority of the available sections are 2U/3T but there are a reasonable number of 4U/5T sections present.
Table 20. Available Washington State Urban/Suburban Undivided Roadway Segments
| Urban/Suburban Undivided Roadway Type | Total Length [mi] | Unique Routes |
|---|---|---|
| 2U/3T | 502.4 | 108 |
| 4U/5T | 210.3 | 77 |
Figure 6 summarizes the top 20 2U/3T roadways in Washington State based on total 2U/3T length available. Similar to the rural undivided roadways, the available segment data was processed to combine adjacent 2U/3T segments from the same route to determine the number of contiguous segments for each route. The number of contiguous 2U/3T segments for a given route
is the left number shown in the Figure 6 data label (e.g. SR 9 has 9 contiguous 2U/3T segments). The maximum contiguous length for each route was tallied and the average contiguous length was computed by dividing the total 2U/3T length by the number of contiguous segments for each route; these are the middle and right numbers in the Figure 2 data label, respectively. To continue with the SR 9 example, the longest of the SR 9 contiguous 2U/3T segments is 12.3 miles and, on average, the 9 contiguous segments are about 3.2 miles in length.

Compared to the rural undivided roadways, the urban/suburban undivided roadway lengths are much shorter, with only one 2U/3T route with length in excess of 25 miles. This is expected given urban/suburban areas are typically concentrated areas of development interspersed within larger rural areas. Longer routes are more desirable for inclusion in the current project to provide more crash exposure as well as the potential for a wider variation of roadway, roadside and traffic characteristics. All of the routes shown in Figure 6 have a total 2U/3T length in excess of 5 miles. Note that approximately 50% (55 of 108 routes) have 3 miles or less total 2U/3T length available (not shown in Figure 6). Table 21 and Table 22 present information on the secondary variables (see Table 2) for the 20 routes shown in Figure 6. Table 21 summarizes the operational characteristics while Table 22 summarizes the geometric characteristics. For each route, the range of AADT, the range of large truck percentage, and the range of posted speed limit are shown in Table 21. Note that for state highways with no posted speed limit (i.e. missing posted speed in Table 21) Washington State legislation specifies a maximum speed of 60 mph (RCW, 46.61.400).
Table 21. Operational Characteristics of the Top 20 Longest 2U/3T Routes in Washington State
| Route Designation | AADT [veh/day] | Posted Speed Limit [mph] | Truck Percentage [%] | |||
|---|---|---|---|---|---|---|
| Minimum | Maximum | Minimum | Maximum | Minimum | Maximum | |
| 9 | 1,848 | 26,024 | . | . | 0.0 | 15.0 |
| 20 | 2,338 | 20,870 | 55 | 55 | 4.0 | 11.0 |
| 202 | 5,487 | 39,042 | . | . | 0.0 | 8.9 |
| 2 | 6,633 | 25,257 | 50 | 60 | 0.0 | 16.1 |
| 28 | 6,432 | 18,690 | 40 | 40 | 0.0 | 21.1 |
| 397 | 744 | 10,344 | . | . | 7.8 | 29.9 |
| 162 | 4,412 | 21,374 | . | . | 0.0 | 13.9 |
| 101 | 0 | 18,684 | 25 | 55 | 3.8 | 24.3 |
| 509 | 2,499 | 22,748 | 50 | 50 | 0.0 | 9.1 |
| 3 | 3,868 | 23,612 | 40 | 60 | 0.0 | 13.4 |
| 507 | 3,789 | 20,477 | 25 | 30 | 0.0 | 10.1 |
| 12 | 2,417 | 15,245 | 20 | 60 | 0.0 | 21.1 |
| 305 | 6,772 | 35,477 | . | . | 0.0 | 6.0 |
| 524 | 3,197 | 21,716 | . | . | 1.5 | 12.8 |
| 169 | 7,482 | 24,206 | . | . | 2.9 | 6.6 |
| 150 | 3,653 | 11,454 | . | . | 4.4 | 11.4 |
| 410 | 4,527 | 20,928 | 40 | 40 | 4.7 | 26.7 |
| 22 | 0 | 11,743 | . | . | 0.0 | 24.1 |
| 548 | 0 | 12,099 | . | . | 0.0 | 7.5 |
| 240 | 4,723 | 9,945 | 60 | 60 | 9.1 | 11.4 |
For the geometric characteristics, minimum and mean lane width, mean and maximum shoulder width, and approximate proportion of roadway length with rumble strips are shown in Table 22. As Washington State roadway inventory data captures both directions of a roadway in a single entry, right and left shoulder width is available for undivided roadways. For the 2U/3T roadways, the left and right shoulder data is nearly identical. The shoulder width data shown in Table 22 considers both left and right shoulder width variables. The minimum shoulder width for all of the routes in Table 22 was zero, so a minimum shoulder width column was not included in the table. The minimum and mean lane widths are reported. Rumble strip presence data is not available in the HSIS roadway inventory data, but Washington State maintains this data separately. For each of the top 20 routes, the proportion of route length with any rumble strips present was computed using this separate dataset. Note that this data is based on the entire length of the roadway and is not necessarily specific to the 2U/3T portions of the route. Nonetheless, the data provides a general indication of whether or not any rumble strips are present along a particular route. The available rumble strip data (not included in Table 22) also indicates the location of the rumble strips: centerline only, shoulders only, or both centerline and shoulder locations. Once specific routes have been selected, the exact details on the rumble strips will be merged into the corresponding HSIS roadway inventory data.
Table 22. Geometric Characteristics of the Top 20 Longest 2U/3T Routes in Washington State
| Route Designation | Lane Width [ft] | Shoulder Width [ft] | Approximate Rumble Strip Presence [%] | ||
|---|---|---|---|---|---|
| Minimum | Mean | Mean | Maximum | ||
| 9 | 10 | 12.3 | 6.4 | 10 | 85 |
| Route Designation | Lane Width [ft] | Shoulder Width [ft] | Approximate Rumble Strip Presence [%] | ||
|---|---|---|---|---|---|
| Minimum | Mean | Mean | Maximum | ||
| 20 | 11 | 13.3 | 4.8 | 10 | 28 |
| 202 | 11 | 13.6 | 4.0 | 16 | 51 |
| 2 | 11 | 12.0 | 6.5 | 10 | 79 |
| 28 | 12 | 15.9 | 5.4 | 12 | 50 |
| 397 | 12 | 14.3 | 5.0 | 12 | 0 |
| 162 | 10 | 13.0 | 3.5 | 10 | 70 |
| 101 | 11 | 17.9 | 3.3 | 14 | 79 |
| 509 | 10 | 14.3 | 3.3 | 8 | 4 |
| 3 | 11 | 14.2 | 3.8 | 9 | 67 |
| 507 | 10 | 15.3 | 2.1 | 8 | 72 |
| 12 | 12 | 13.4 | 5.1 | 16 | 79 |
| 305 | 11 | 12.6 | 5.5 | 8 | 69 |
| 524 | 10 | 14.6 | 2.7 | 12 | 0 |
| 169 | 10 | 13.3 | 5.5 | 16 | 45 |
| 150 | 11 | 14.8 | 4.1 | 12 | 17 |
| 410 | 11 | 15.6 | 6.1 | 10 | 58 |
| 22 | 11 | 15.0 | 4.1 | 10 | 13 |
| 548 | 10 | 13.0 | 4.0 | 15 | 35 |
| 240 | 12 | 12.4 | 7.2 | 10 | 45 |
Figure 7 summarizes the top 20 4U/5T roadways in Washington State based on total 4U/5T length available. The roadway inventory data was processed similarly to the 2U/3T roadways, combining adjacent segments with the same classification to determine the number of contiguous segments for each route. The majority of the available routes (53 of 77) had total lengths of 3 miles or less (not shown in Figure 7).
Table 23 and Table 24 present information on the secondary variables (see Table 2) for the 20 routes shown in Figure 7. Table 23 summarizes the operational characteristics while Table 24 summarizes the geometric characteristics. For each route, the range of AADT, the range of large truck percentage, and the range of posted speed limit are shown in Table 23. Note that for state highways with no posted speed limit (i.e. missing posted speed in Table 23), Washington State legislation specifies a maximum speed of 60 mph (RCW, 46.61.400).

Table 23. Operational Characteristics of the Top 20 Longest 4U/5T Routes in Washington State
| Route Designation | AADT [veh/day] | Posted Speed Limit [mph] | Truck Percentage [%] | |||
|---|---|---|---|---|---|---|
| Minimum | Maximum | Minimum | Maximum | Minimum | Maximum | |
| 7 | 13,008 | 40,391 | 55 | 55 | 3.2 | 13.9 |
| 2 | 18,903 | 40,527 | 30 | 60 | 0.0 | 11.3 |
| 290 | 6,121 | 23,621 | 40 | 50 | 0.0 | 9.8 |
| 161 | 13,503 | 42,735 | . | . | 3.3 | 12.2 |
| 99 | 17,895 | 42,472 | 40 | 60 | 0.0 | 17.4 |
| 522 | 31,521 | 55,004 | 35 | 35 | 0.0 | 3.5 |
| 515 | 19,268 | 44,412 | . | . | 0.0 | 2.2 |
| 527 | 18,326 | 42,518 | . | . | 0.0 | 3.6 |
| 516 | 14,930 | 38,129 | . | . | 0.0 | 6.2 |
| 303 | 13,259 | 39,479 | 55 | 55 | 0.0 | 3.4 |
| 4 | 6,624 | 22,416 | . | . | 2.1 | 13.5 |
| 900 | 13,685 | 43,272 | 50 | 50 | 0.0 | 5.1 |
| 167 | 26,531 | 45,492 | 35 | 35 | 0.0 | 6.4 |
| 101 | 6,999 | 32,865 | 25 | 55 | 5.5 | 14.9 |
| 169 | 18,980 | 41,846 | . | . | 4.1 | 5.8 |
| 27 | 5,945 | 37,018 | 35 | 35 | 2.4 | 10.5 |
| 291 | 12,183 | 29,661 | . | . | 0.0 | 4.0 |
| 529 | 3,942 | 15,699 | 35 | 45 | 0.0 | 4.8 |
| Route Designation | AADT [veh/day] | Posted Speed Limit [mph] | Truck Percentage [%] | |||
|---|---|---|---|---|---|---|
| Minimum | Maximum | Minimum | Maximum | Minimum | Maximum | |
| 524 | 7,570 | 40,162 | . | . | 1.8 | 4.6 |
| 397 | 5,597 | 17,861 | . | . | 6.7 | 16.5 |
For the geometric characteristics, minimum and mean lane width, mean and maximum shoulder width, and approximate proportion of roadway length with rumble strips are shown in Table 24. As Washington State roadway inventory data captures both directions of a roadway in a single entry, right and left shoulder width are available for undivided roadways. For the 4U/5T roadways, the left and right shoulder data is nearly identical. The shoulder width data shown in Table 22 considers both left and right shoulder width variables. The minimum shoulder width for all of the routes in Table 22 was zero, so a minimum shoulder width column was not included in the table. The minimum and mean lane widths are reported. Rumble strip presence data is not available in the HSIS roadway inventory data but Washington State maintains this data separately. For each of the top 20 routes, the proportion of route length with any rumble strips present was computed using this separate dataset. Note that this data is based on the entire length of the roadway and is not necessarily specific to the 4U/5T portions of the route. Nonetheless, the data provides a general indication of whether or not any rumble strips are present along a particular route. The available rumble strip data (not included in Table 24) also indicates the location of the rumble strips: centerline only, shoulders only, or both centerline and shoulder locations. Once specific routes have been selected, the exact details on the rumble strips will be merged into the corresponding HSIS roadway inventory data.
Table 24. Geometric Characteristics of the Top 20 Longest 4U/5T Routes in Washington State
| Route Designation | Lane Width [ft] | Shoulder Width [ft] | Approximate Rumble Strip Presence [%] | ||
|---|---|---|---|---|---|
| Minimum | Mean | Mean | Maximum | ||
| 7 | 11 | 12.5 | 1.9 | 7 | 68 |
| 2 | 11 | 14.4 | 4.5 | 18 | 79 |
| 290 | 10 | 13.0 | 3.0 | 10 | 44 |
| 161 | 11 | 15.6 | 2.2 | 11 | 43 |
| 99 | 11 | 14.8 | 4.2 | 12 | 0 |
| 522 | 10 | 12.5 | 1.4 | 8 | 29 |
| 515 | 11 | 14.0 | 0.0 | 0 | 0 |
| 527 | 11 | 13.9 | 1.0 | 16 | 0 |
| 516 | 11 | 14.8 | 0.6 | 15 | 0 |
| 303 | 10 | 13.1 | 3.9 | 10 | 0 |
| 4 | 12 | 15.1 | 0.4 | 10 | 21 |
| 900 | 10 | 13.2 | 2.5 | 14 | 37 |
| 167 | 11 | 12.8 | 4.6 | 8 | 0 |
| 101 | 12 | 14.8 | 2.0 | 10 | 78 |
| 169 | 11 | 14.4 | 3.9 | 8 | 45 |
| 27 | 11 | 13.4 | 1.4 | 10 | 82 |
| 291 | 10 | 13.4 | 0.0 | 0 | 20 |
| 529 | 8 | 14.3 | 0.5 | 6 | 0 |
| 524 | 11 | 14.3 | 0.3 | 6 | 0 |
| 397 | 12 | 14.2 | 1.9 | 10 | 0 |
Based on the data from the top 20 2U/3T segments in Washington State, the following observations were made:
- The routes with the largest traffic volume variation are SR 202 followed by SR 305 and SR 9. All have a maximum daily traffic volume in excess of 25,000 vehicles per day or more.
- As expected, the 2U/3T routes generally have a higher minimum and maximum traffic volume than the RU2L2W routes in Washington State.
- Most routes have little variation in posted speed limit. A notable exception is SR 12.
- The 2U/3T routes have maximum truck traffic percentages of 25% or lower.
- Minimum and mean lane widths are generally larger than those observed for the Washington RU2L2W routes and appear less influenced by traffic volume.
- SR 202, SR 12, and SR 169 have the largest variation in shoulder width.
- Approximately half of the routes have more than 50% presence of rumble strips.
- SR 2 was already selected to be included in the study, as the RU2L2W route from Washington so the analogous 2U/3T sections could be included as well.
Based on the data from the top 20 4U/5T segments in Washington State, the following observations were made:
- The routes with the largest traffic volume variation are SR 524 followed by SR 900 and SR 161. All have a maximum daily traffic volume in excess of 40,000 vehicles per day or more.
- As expected, the 4U/5T routes generally have a higher minimum and maximum traffic volume than the 2U/3T routes in Washington State.
- Most routes have little variation in posted speed limit. Notable exceptions are SR 2 and SR 101.
- The 4U/5T routes have maximum truck traffic percentages of about 20% or lower.
- Minimum and mean lane widths are generally larger than those observed for the Washington RU2L2W routes and appear less influenced by traffic volume.
- SR 12 and SR 527 have the largest variation in shoulder width.
- The majority of the routes have less than 50% presence of rumble strips.
- SR 2 was already selected to be included in the study as the RU2L2W route from Washington, so the analogous 4U/5T sections could be included as well.
These observations along with the available Washington urban/suburban undivided roadway characteristics will be combined with corresponding data from the other two state agency partners. This combined data will be used to select representative 2U/3T and 4U/5T routes from all three state agency partners.
Tennessee Urban/Suburban Undivided Roadways and Associated Characteristics
The available Tennessee urban/suburban undivided roadway segments were classified as 2U/3T or 4U/5T. The Tennessee roadway data was split among several different data tables, each with potentially disparate roadway segment boundaries, as opposed to Washington State which has the majority of the basic roadway data integrated into a single data table. While this initially resulted in a more complicated and time-consuming process to combine the roadway data across these tables, the overall classification process was essentially the same between the states once the Tennessee road data was combined.
Table 25 summarizes the results of the classification of the available urban/suburban undivided roadways in Tennessee. Similar to Washington State, the majority of the available sections are 2U/3T but there are a reasonable number of 4U/5T routes available. TWLTL data is available in the Tennessee data in the road description table.
Table 25. Available Tennessee Urban/Suburban Undivided Roadway Segments
| Urban/Suburban Undivided Roadway Type | Total Length [mi] | Unique Routes |
|---|---|---|
| 2U/3T | 1852.6 | 260 |
| 4U/5T | 831.2 | 164 |
Figure 8 summarizes the top 20 2U/3T roadways in Tennessee based on total 2U/3T length available. The roadway inventory data was processed similar to Washington State, combining adjacent segments with the same 2U/3T classification to determine the number of contiguous segments for each route. One important difference in the Tennessee data is that the route mileage resets to zero at every instance the route enters a new county and the data in Figure 8 has not been adjusted accordingly. As a result, each route will generally have a larger number of contiguous segments compared to those in Washington State. Note that approximately 35% (91 of 260 routes) of segments have 3 miles or less total 2U/3T length available (not shown in Figure 8).

The operational and geometric characteristics of these 20 routes are shown in Table 26 and Table 27, respectively. For each route, the range of AADT, large truck percentage, and posted speed limit are shown in Table 26.
Table 26. Operational Characteristics of the Top 20 Longest 2U/3T Routes in Tennessee
| Route Designation | AADT [veh/day] | Posted Speed Limit [mph] | Truck Percentage [%] | |||
|---|---|---|---|---|---|---|
| Minimum | Maximum | Minimum | Maximum | Minimum | Maximum | |
| SR002 | 2,240 | 16,440 | 30 | 55 | 0 | 31 |
| SR001 | 2,030 | 33,490 | 25 | 55 | 1 | 28 |
| SR024 | 1,550 | 39,130 | 15 | 55 | 1 | 32 |
| SR076 | 920 | 18,700 | 30 | 55 | 1 | 32 |
| SR096 | 6,660 | 27,270 | 30 | 55 | 0 | 8 |
| SR106 | 2,110 | 22,010 | 30 | 55 | 2 | 25 |
| SR050 | 3,910 | 17,360 | 20 | 55 | 0 | 13 |
| SR099 | 910 | 32,400 | 30 | 55 | 1 | 11 |
| SR010 | 2,150 | 23,120 | 30 | 55 | 4 | 45 |
| SR041 | 5,460 | 11,030 | 30 | 55 | 2 | 6 |
| SR006 | 8,980 | 25,620 | 30 | 55 | 2 | 16 |
| SR196 | 750 | 4,680 | 30 | 50 | 2 | 8 |
| SR063 | 480 | 14,800 | 30 | 55 | 0 | 13 |
| SR066 | 200 | 15,420 | 30 | 55 | 0 | 8 |
| Route Designation | AADT [veh/day] | Posted Speed Limit [mph] | Truck Percentage [%] | |||
|---|---|---|---|---|---|---|
| Minimum | Maximum | Minimum | Maximum | Minimum | Maximum | |
| SR033 | 4,610 | 38,020 | 25 | 55 | 2 | 20 |
| SR130 | 320 | 7,120 | 30 | 55 | 1 | 13 |
| SR174 | 2,580 | 19,380 | 30 | 50 | 0 | 5 |
| SR131 | 5,140 | 36,410 | 30 | 45 | 2 | 24 |
| SR069 | 2,210 | 11,690 | 30 | 55 | 2 | 14 |
| SR140 | 460 | 710 | 30 | 55 | 15 | 23 |
For the geometric characteristics, minimum and mean lane width; minimum, mean and maximum shoulder width; and proportion of roadway length with shoulder rumble strips are shown in Table 27 For undivided roadways, a single outside shoulder width is reported in the Tennessee roadway data; this width was used to determine the shoulder width values reported in Table 27. Unlike Washington State, the minimum shoulder width for the longest 20 2U/3T roadways exceeded zero and was typically either 1 or 2 feet wide. Note that Tennessee only reports shoulder width to the nearest foot. The minimum and mean lane widths are reported based on a combination of the pavement width data element (travel lanes only) and number of lanes data in the roadway description table and road geometry tables, respectively. The Tennessee maintenance inventory table includes shoulder rumble strip data, which was used to generate the rumble strip presence proportions shown in Table 27. These values reflect the proportion of 2U/3T length for each route that has shoulder rumble strips present. This was computed by dividing total shoulder rumble strip length for each route by the corresponding total shoulder edge length (e.g. twice the 2U/3T length reported in Figure 8). The “feature type” variable in the roadway description table indicates the presence of a TWLTL (feature type = 5). This variable was isolated and merged with the available 2U/3T segments to determine the length of 2U/3T segments with a TWLTL present. For each route, the total TWLTL length was divided by the total 2U/3T length for the corresponding route, as shown in Figure 8, to compute the percentage of TWLTL shown in Table 27.
Table 27. Geometric Characteristics of the Top 20 Longest 2U/3T Routes in Tennessee
| Route | Lane Width [ft] | Shoulder Width [ft] | Shoulder Rumble Strip Presence [%] | TWLTL Presence [%] | |||
|---|---|---|---|---|---|---|---|
| Minimum | Mean | Minimum | Mean | Maximum | |||
| SR002 | 8 | 12.4 | 1 | 5.7 | 18 | 50 | 9 |
| SR001 | 8 | 12.8 | 1 | 6.3 | 28 | 58 | 6 |
| SR024 | 9.3 | 12.6 | 1 | 4.1 | 18 | 71 | 12 |
| SR076 | 8 | 12.3 | 1 | 6.4 | 24 | 50 | 8 |
| SR096 | 8 | 12.4 | 1 | 6.4 | 18 | 46 | 9 |
| SR106 | 8 | 12.3 | 1 | 4.9 | 24 | 62 | 7 |
| SR050 | 8 | 12.2 | 2 | 6.9 | 20 | 50 | 6 |
| SR099 | 10 | 12.0 | 1 | 6.2 | 12 | 41 | 10 |
| SR010 | 8 | 12.8 | 1 | 6.2 | 24 | 69 | 8 |
| SR041 | 8 | 11.7 | 1 | 5.0 | 16 | 87 | 16 |
| SR006 | 8 | 12.1 | 1 | 4.5 | 12 | 53 | 21 |
| SR196 | 10 | 10.9 | 2 | 5.8 | 24 | 32 | 0 |
| SR063 | 11 | 12.4 | 1 | 7.7 | 12 | 77 | 8 |
| SR066 | 8 | 12.7 | 2 | 4.9 | 10 | 1 | 7 |
| Route | Lane Width [ft] | Shoulder Width [ft] | Shoulder Rumble Strip Presence [%] | TWLTL Presence [%] | |||
|---|---|---|---|---|---|---|---|
| Minimum | Mean | Minimum | Mean | Maximum | |||
| SR033 | 11 | 12.2 | 1 | 4.5 | 14 | 19 | 16 |
| SR130 | 10 | 11.3 | 1 | 3.7 | 10 | 51 | 2 |
| SR174 | 11 | 12.0 | 1 | 5.5 | 16 | 61 | 12 |
| SR131 | 10 | 11.3 | 1 | 4.3 | 16 | 0 | 2 |
| SR069 | 11 | 12.8 | 2 | 5.3 | 10 | 30 | 0 |
| SR140 | 10 | 10.0 | 2 | 2.5 | 3 | 0 | 0 |
Figure 9 summarizes the top 20 4U/5T roadways in Tennessee based on total 4U/5T length available. The roadway inventory data was processed to combine adjacent segments with the same 4U/5T classification to determine the number of contiguous segments for each route. Note that approximately 56% (92 of 164 routes) have 3 miles or less of total 4U/5T length available (not shown in Figure 9).
The operational and geometric characteristics of these 20 routes are shown in Table 28 and Table 29, respectively. For each route, the range of AADT, large truck percentage, and posted speed limit are shown in Table 28. For the geometric characteristics, minimum and mean lane width; minimum, mean and maximum shoulder width; and proportion of roadway length with shoulder rumble strips are shown in Table 29. For undivided roadways, a single outside shoulder width is reported in the Tennessee roadway data; this width was used to determine the shoulder width
values reported in Table 29. Unlike Washington State, the minimum shoulder width for the longest 20 4U/5T roadways exceeded zero and was typically either 1 or 2 feet wide. Note that Tennessee only reports shoulder width to the nearest foot. The minimum and mean lane widths are reported based on a combination of the pavement width data element (travel lanes only) and number of lanes data in the roadway description table and road geometry tables, respectively. The Tennessee maintenance inventory table includes shoulder rumble strip data, which was used to generate the rumble strip presence proportions shown in Table 29. These values reflect the proportion of 4U/5T length for each route that has shoulder rumble strips present. This was computed by dividing total shoulder rumble strip length for each route by the corresponding total shoulder edge length (e.g. twice the 4U/5T length reported in Figure 9). The “feature type” variable in the roadway description table indicates the presence of a TWLTL (feature type = 5). This variable was isolated and merged with the available 4U/5T segments to determine the length of 4U/5T segments with a TWLTL present. For each route, the total TWLTL length was divided by the total 4U/5T length for the corresponding route, as shown in Figure 9, to compute the percentage of TWLTL shown in Table 29.
Table 28. Operational Characteristics of the Top 20 Longest 4U/5T Routes in Tennessee
| Route Designation | AADT [veh/day] | Posted Speed Limit [mph] | Truck Percentage [%] | |||
|---|---|---|---|---|---|---|
| Minimum | Maximum | Minimum | Maximum | Minimum | Maximum | |
| SR001 | 2,530 | 45,060 | 25 | 55 | 0 | 30 |
| SR011 | 3,800 | 41,530 | 30 | 55 | 2 | 45 |
| SR006 | 12,190 | 53,150 | 30 | 55 | 2 | 45 |
| SR024 | 3,010 | 39,130 | 15 | 55 | 1 | 32 |
| SR003 | 2,040 | 37,210 | 35 | 55 | 4 | 50 |
| SR002 | 4,970 | 34,440 | 30 | 55 | 2 | 31 |
| SR015 | 5,030 | 63,660 | 30 | 55 | 1 | 52 |
| SR010 | 3,050 | 48,870 | 30 | 55 | 4 | 45 |
| SR076 | 3,210 | 22,830 | 30 | 65 | 2 | 17 |
| SR016 | 6,950 | 22,710 | 30 | 55 | 2 | 13 |
| SR009 | 2,490 | 35,760 | 25 | 50 | 0 | 8 |
| SR005 | 3,000 | 35,440 | 30 | 55 | 3 | 26 |
| SR036 | 7,630 | 31,150 | 30 | 45 | 2 | 20 |
| SR034 | 8,330 | 50,610 | 25 | 55 | 1 | 64 |
| SR035 | 6,770 | 39,710 | 30 | 55 | 2 | 23 |
| SR071 | 1,940 | 45,690 | 25 | 50 | 3 | 21 |
| SR033 | 4,610 | 41,450 | 30 | 55 | 2 | 20 |
| SR022 | 1,560 | 12,700 | 40 | 55 | 5 | 57 |
| SR020 | 5,090 | 18,850 | 40 | 65 | 4 | 19 |
| SR008 | 6,360 | 42,500 | 30 | 45 | 2 | 39 |
Table 29. Geometric Characteristics of the Top 20 Longest 4U/5T Routes in Tennessee
| Route | Lane Width [ft] | Shoulder Width [ft] | Shoulder Rumble Strip Presence [%] | TWLTL Presence [%] | |||
|---|---|---|---|---|---|---|---|
| Minimum | Mean | Minimum | Mean | Maximum | |||
| SR001 | 9 | 11.6 | 1 | 6.1 | 24 | 16 | 58 |
| SR011 | 9 | 11.5 | 1 | 5.7 | 14 | 14 | 89 |
| SR006 | 8.8 | 11.7 | 1 | 5.6 | 16 | 22 | 64 |
| Route | Lane Width [ft] | Shoulder Width [ft] | Shoulder Rumble Strip Presence [%] | TWLTL Presence [%] | |||
|---|---|---|---|---|---|---|---|
| Minimum | Mean | Minimum | Mean | Maximum | |||
| SR024 | 8 | 11.3 | 1 | 5.4 | 20 | 3 | 70 |
| SR003 | 8 | 11.9 | 1 | 6.0 | 18 | 1 | 78 |
| SR002 | 9.6 | 11.1 | 1 | 6.5 | 14 | 7 | 68 |
| SR015 | 10 | 12.4 | 2 | 8.0 | 18 | 31 | 97 |
| SR010 | 8.8 | 11.7 | 1 | 6.0 | 14 | 31 | 79 |
| SR076 | 9 | 11.5 | 2 | 6.5 | 14 | 1 | 84 |
| SR016 | 10 | 11.5 | 1 | 4.2 | 12 | 2 | 91 |
| SR009 | 10 | 11.1 | 1 | 7.7 | 18 | 31 | 58 |
| SR005 | 9 | 11.6 | 1 | 5.6 | 16 | 8 | 67 |
| SR036 | 8 | 11.2 | 2 | 5.9 | 16 | 2 | 81 |
| SR034 | 8 | 11.8 | 1 | 7.6 | 16 | 6 | 78 |
| SR035 | 11 | 11.1 | 1 | 6.2 | 22 | 52 | 38 |
| SR071 | 8.8 | 10.7 | 1 | 5.3 | 14 | 29 | 24 |
| SR033 | 8.3 | 11.4 | 1 | 6.3 | 16 | 13 | 74 |
| SR022 | 10 | 11.3 | 2 | 6.3 | 12 | 4 | 93 |
| SR020 | 10 | 11.9 | 1 | 4.8 | 12 | 7 | 95 |
| SR008 | 9 | 11.2 | 1 | 4.9 | 16 | 1 | 42 |
Based on the data from the top 20 2U/3T segments in Tennessee, the following observations were made:
- In general, the 2U/3T segments in Tennessee are longer than those in Washington State.
- The routes with the largest traffic volume variation are SR 1 followed by SR 33 and SR 99. All have a maximum daily traffic volume in excess of 30,000 vehicles per day or more.
- As expected, the 2U/3T routes generally have a higher maximum traffic volume than the RU2L2W routes in Tennessee.
- Most routes have a range of posted speed limit between 30 and 55 mph.
- The longest 2U/3T routes have maximum truck traffic percentages of approximately 30% but most routes have a 25% or lower maximum truck percentage.
- Minimum and mean lane widths are approximately the same as those observed for the Tennessee RU2L2W routes.
- SR 1, SR 106, SR 76, SR 10 and SR 196 have the largest variation in shoulder width.
- More than half of the routes have more than 50% presence of rumble strips.
- The majority of the 2U/3T roadways have a TWLTL present and, in general, the length is less than one fourth of the total 2U/3T length.
- SR 33 and SR 69 were already selected to be included in the study as representative RUMLH and RU2L2W routes, respectively. These routes are in the top 20 longest 2U/3T routes so the analogous 2U/3T sections could be included.
Based on the data from the top 20 4U/5T segments in Tennessee, the following observations were made:
- The routes with the largest traffic volume variation are SR 15 followed by SR 10 and SR 71. All have a maximum daily traffic volume in excess of 45,000 vehicles per day or more.
- As expected, the 4U/5T routes generally have a higher minimum and maximum traffic volume than the 2U/3T routes in Tennessee.
- Similar to the 2U/3T routes, most 4U/5T routes have a range of posted speed limit between 30 and 55 mph.
- The majority of the longest 4U/5T routes have maximum truck traffic percentages of 20% or higher.
- Mean lane widths are generally the same or slightly narrower than those observed for the Tennessee 2U/3T routes.
- SR 1 and SR 35 have the largest variation in shoulder width.
- The majority of the routes have less than 30% presence of rumble strips.
- The majority of the 4U/5T roadways have a TWLTL present and, in general, the length is more than one fourth of the total 4U/5T length.
- SR 33 and SR 15 were already selected to be included in the study as representative RUMLH routes. These routes are in the top 20 longest 4U/5T routes so the analogous 4U/5T sections could be included.
These observations along with the available Tennessee urban/suburban undivided roadway characteristics will be combined with corresponding data from the other two state agency partners. This combined data will be used to select representative 2U/3T and 4U/5T routes from all three state agency partners.
Iowa Urban/Suburban Undivided Roadways and Associated Characteristics
Table 30 summarizes the results of the classification of the available urban/suburban undivided roadways in Iowa. The majority of the available sections are 2U/3T but there are also a significant number of 4U/5T sections present. Note that Iowa roadway data has lane type information present to allow for identification of sections with TWLTL.
Table 30. Available Iowa State Urban/Suburban Undivided Roadway Segments
| Urban/Suburban Undivided Roadway Type | Total Length [mi] | Unique Routes |
|---|---|---|
| 2U/3T | 281.0 | 67 |
| 4U/5T | 162.8 | 58 |
Figure 10 summarizes the top 20 2U/3T roadways in Iowa based on total 2U/3T length available. The available segment data was processed to combine adjacent 2U/3T segments from the same route to determine the number of contiguous segments for each route. The maximum contiguous length for each route was tallied and the average contiguous length computed by dividing the total 2U/3T length by the number of contiguous segments for each route. Due to the high
precision available for the Iowa milepost variable, mileposts were considered a match if the absolute value of the difference was 0.00001 miles or less. The data shown in Figure 10 uses this slightly less stringent convention. Note that approximately 50% (33 of 67 routes) have 3 miles or less total 2U/3T length available (not shown in Figure 10).
The operational and geometric characteristics of these 20 routes are shown in Table 31 and Table 32, respectively. For each route, the range of AADT, large truck percentage, and posted speed limit are shown in Table 31.
For the geometric characteristics, minimum and mean lane width, mean and maximum shoulder width, and proportion of roadway length with shoulder rumble strips or a TWLTL are shown in Table 32. Similar to Washington State, both left and right shoulder data available for the 2U/3T roadways and are nearly identical. Table 32 combines both left and right shoulder width variables. Similar to Washington State, the minimum shoulder width for the longest 20 2U/3T roadways was zero, so a minimum shoulder width column was excluded from the table. The minimum and mean lane widths are reported based on a combination of the pavement width information and number of lanes present in the roadway table. The Iowa roadway data includes both right and left shoulder rumble strip data. The approximate rumble strip presence proportions in Table 32 do reflect the proportion of 2U/3T length for each route that has shoulder rumble strips present. This percentage was computed by dividing the total shoulder rumble strip length for each route by the corresponding total shoulder edge length available, e.g. twice the 2U/3T
length reported in Figure 10 for the same route. For the three-lane sections identified, the lane type variable available data was used to determine the sections with a TWLTL present—e.g. the lane type of the second lane equal to “5-center turn lane.” The TWLTL percentage was computed by dividing the length of roadway with a TWLTL present by the total 2U/3T length for the same route, as reported in Figure 10.
Table 31. Operational Characteristics of the Top 20 Longest 2U/3T Routes in Iowa
| Route Designation | AADT [veh/day] | Posted Speed Limit [mph] | Truck Percentage [%] | |||
|---|---|---|---|---|---|---|
| Minimum | Maximum | Minimum | Maximum | Minimum | Maximum | |
| 006 | 60 | 23,100 | 20 | 55 | 0.0 | 25.0 |
| 067 | 2,380 | 13,900 | 25 | 55 | 2.9 | 14.0 |
| 001 | 2,200 | 16,100 | 20 | 55 | 2.3 | 11.3 |
| 018 | 2,410 | 10,400 | 30 | 55 | 5.9 | 26.3 |
| 063 | 3,190 | 10,500 | 20 | 55 | 3.8 | 12.1 |
| 071 | 2,850 | 16,000 | 30 | 55 | 3.0 | 16.5 |
| 003 | 2,890 | 7,200 | 25 | 55 | 3.7 | 15.1 |
| 069 | 6,900 | 34,200 | 35 | 55 | 1.8 | 10.7 |
| 052 | 210 | 11,800 | 25 | 55 | 4.1 | 32.4 |
| 030 | 101 | 16,200 | 25 | 55 | 6.8 | 20.0 |
| 092 | 3,020 | 12,100 | 25 | 55 | 3.8 | 14.4 |
| 086 | 2,400 | 4,520 | 55 | 55 | 9.7 | 19.0 |
| 415 | 1,140 | 10,300 | 45 | 55 | 3.1 | 5.2 |
| 022 | 1,770 | 11,200 | 30 | 55 | 3.5 | 13.0 |
| 150 | 2,280 | 11,000 | 25 | 55 | 3.5 | 18.5 |
| 065 | 2,290 | 12,200 | 20 | 55 | 3.2 | 20.9 |
| 151 | 8,300 | 13,700 | 45 | 55 | 5.2 | 6.6 |
| 007 | 3,210 | 8,500 | 25 | 55 | 5.7 | 16.0 |
| 218 | 5 | 6,100 | 35 | 55 | 0.0 | 15.2 |
| 014 | 1,390 | 14,500 | 25 | 55 | 0.0 | 12.5 |
Table 32. Geometric Characteristics of the Top 20 Longest 2U/3T Routes in Iowa
| Route Designation | Lane Width [ft] | Shoulder Width [ft] | Shoulder Rumble Presence [%] | TWLTL Presence [%] | ||
|---|---|---|---|---|---|---|
| Minimum | Mean | Mean | Maximum | |||
| 006 | 10 | 14.8 | 4.9 | 12 | 19 | 14 |
| 067 | 10 | 15.0 | 4.8 | 10 | 28 | 0 |
| 001 | 11 | 14.6 | 4.3 | 10 | 2 | 0 |
| 018 | 10 | 13.7 | 8.0 | 10 | 57 | 0 |
| 063 | 10.7 | 14.1 | 5.1 | 10 | 0 | 0 |
| 071 | 8 | 12.9 | 6.4 | 10 | 22 | 15 |
| 003 | 10 | 14.2 | 7.0 | 13 | 0 | 18 |
| 069 | 10 | 15.2 | 5.5 | 10 | 6 | 3 |
| 052 | 9.3 | 12.8 | 7.0 | 10 | 0 | 0 |
| 030 | 9 | 13.9 | 4.2 | 10 | 0 | 0 |
| 092 | 8 | 12.4 | 6.3 | 10 | 4 | 19 |
| 086 | 10 | 11.9 | 8.0 | 10 | 6 | 0 |
| 415 | 10 | 13.2 | 8.9 | 12 | 80 | 0 |
| 022 | 12 | 13.7 | 5.5 | 10 | 0 | 0 |
| Route Designation | Lane Width [ft] | Shoulder Width [ft] | Shoulder Rumble Presence [%] | TWLTL Presence [%] | ||
|---|---|---|---|---|---|---|
| Minimum | Mean | Mean | Maximum | |||
| 150 | 10 | 14.1 | 4.2 | 10 | 0 | <1 |
| 065 | 10.7 | 15.4 | 1.9 | 12 | 0 | 13 |
| 151 | 10 | 15.0 | 8.0 | 10 | 0 | 0 |
| 007 | 10 | 13.5 | 6.5 | 10 | 35 | 23 |
| 218 | 11 | 12.6 | 7.0 | 10 | 1 | 0 |
| 014 | 8 | 13.9 | 5.7 | 10 | 0 | 0 |
Figure 11 summarizes the top 20 4U/5T roadways in Iowa based on total 4U/5T length available. The roadway inventory data was processed similar to the 2U/3T roadways combining adjacent segments with the same classification to determine the number of contiguous segments for each route. The majority of the available routes (40 of 58) had total lengths of 3 miles or less (not shown in Figure 11).
Table 33 and Table 34 present information on the secondary variables (see Table 2) for the 20 routes shown in Figure 11. Table 33 summarizes the operational characteristics while Table 34 summarizes the geometric characteristics. For each route, the range of AADT, the range of large truck percentage, and the range of posted speed limit are shown in Table 33.
Table 33. Operational Characteristics of the Top 20 Longest 4U/5T Routes in Iowa
| Route Designation | AADT [veh/day] | Posted Speed Limit [mph] | Truck Percentage [%] | |||
|---|---|---|---|---|---|---|
| Minimum | Maximum | Minimum | Maximum | Minimum | Maximum | |
| 67 | 3,790 | 23,300 | 20 | 55 | 2.2 | 10.2 |
| 6 | 3,130 | 33,200 | 30 | 55 | 1.5 | 10.6 |
| 18 | 3,540 | 16,000 | 20 | 55 | 3.0 | 20.1 |
| 461 | 2,210 | 22,400 | 35 | 55 | 2.1 | 10.8 |
| 71 | 2,850 | 16,000 | 25 | 55 | 2.9 | 16.5 |
| 69 | 8,500 | 25,100 | 30 | 55 | 1.8 | 7.0 |
| 92 | 3,000 | 13,800 | 25 | 55 | 3.8 | 16.7 |
| 65 | 3,110 | 20,000 | 25 | 55 | 3.3 | 9.0 |
| 922 | 13,400 | 22,200 | 25 | 35 | 1.7 | 3.2 |
| 14 | 3,890 | 16,200 | 25 | 55 | 1.7 | 9.5 |
| 30 | 6,000 | 18,300 | 25 | 55 | 5.6 | 11.7 |
| 63 | 3,800 | 10,500 | 20 | 55 | 4.6 | 16.2 |
| 9 | 4,780 | 14,700 | 25 | 55 | 4.9 | 12.2 |
| 169 | 4,020 | 9,000 | 30 | 55 | 4.6 | 12.7 |
| 3 | 3,000 | 13,000 | 25 | 55 | 2.9 | 9.5 |
| 122 | 3,120 | 17,600 | 30 | 55 | 2.1 | 4.0 |
| 22 | 4,070 | 14,100 | 30 | 50 | 2.8 | 21.2 |
| 218 | 3,230 | 14,000 | 25 | 45 | 4.3 | 11.1 |
| 75 | 6,300 | 12,600 | 30 | 55 | 7.5 | 14.0 |
| 136 | 3,150 | 10,800 | 20 | 45 | 2.3 | 22.5 |
For the geometric characteristics, minimum and mean lane width; mean and maximum shoulder width; and proportion of roadway length with shoulder rumble strips or a WLTL are shown in Table 34. Similar to Washington State, both left and right shoulder data available for the 4U/5T roadways are nearly identical. Table 34 combines both left and right shoulder width variables. Similar to Washington State, the minimum shoulder width for the longest 20 4U/5T roadways was zero, so a minimum shoulder width column was excluded from the table. The minimum and mean lane widths are reported based on a combination of the pavement width information and number of lanes present in the roadway table. The Iowa roadway data includes both right and left shoulder rumble strip data. The approximate rumble strip presence proportions in Table 34 do reflect the proportion of 4U/5T length for each route that has shoulder rumble strips present. This percentage was computed by dividing the total shoulder rumble strip length for each route by the corresponding total shoulder edge length available—e.g. twice the 4U/5T length reported in Figure 11 for the same route. For the three-lane sections identified, the lane type variable available data was used to determine the sections with a TWLTL present—e.g. the lane type of the second lane equal to “5-center turn lane.” The TWLTL percentage was computed by dividing the length of roadway with a TWLTL present by the total 4U/5T length for the same route, as reported in Figure 11.
Table 34. Geometric Characteristics of the Top 20 Longest 4U/5T Routes in Iowa
| Route Designation | Lane Width [ft] | Shoulder Width [ft] | Shoulder Rumble Presence [%] | TWLTL Presence [%] | ||
|---|---|---|---|---|---|---|
| Minimum | Mean | Mean | Maximum | |||
| 67 | 10.5 | 13.9 | 2.6 | 10 | 0 | 0 |
| 6 | 10 | 12.7 | 0.4 | 10 | 0 | 6 |
| 18 | 9.5 | 12.5 | 4.3 | 10 | 12 | 0 |
| 461 | 9.6 | 12.4 | 2.3 | 10 | 0 | 4 |
| 71 | 9.5 | 12.6 | 3.5 | 10 | <1 | 3 |
| 69 | 9.5 | 13.0 | 1.9 | 10 | 0 | 3 |
| 92 | 9 | 11.3 | 2.7 | 10 | <1 | 0 |
| 65 | 11 | 13.0 | 1.1 | 10 | 3 | 22 |
| 922 | 12 | 14.6 | 0.0 | 0 | 0 | 0 |
| 14 | 10.8 | 12.5 | 0.4 | 10 | 0 | 4 |
| 30 | 9.6 | 11.9 | 4.5 | 10 | 0 | 40 |
| 63 | 10 | 12.2 | 1.7 | 10 | 0 | 30 |
| 9 | 10.8 | 12.8 | 7.4 | 10 | 0 | 0 |
| 169 | 9.3 | 11.7 | 3.9 | 10 | 0 | 0 |
| 3 | 10.5 | 13.0 | 0.5 | 10 | 0 | 0 |
| 122 | 12 | 12.0 | 3.3 | 10 | 34 | 7 |
| 22 | 9.5 | 12.4 | 4.2 | 10 | 0 | 0 |
| 218 | 12 | 13.4 | 0.5 | 10 | 0 | 55 |
| 75 | 10.5 | 13.4 | 2.2 | 10 | 0 | 0 |
| 136 | 10.8 | 13.4 | 1.5 | 10 | 0 | 0 |
Based on the data from the top 20 2U/3T segments in Iowa, the following observations were made:
- The routes with the largest traffic volume variation are SR 69 followed by SR 6. Both have a maximum daily traffic volume in excess of 20,000 vehicles per day or more.
- As expected, the 2U/3T routes generally have a higher minimum and maximum traffic volume than the RU2L2W routes in Iowa.
- Most routes have a relatively wide variation in posted speed limit.
- The majority of the 2U/3T routes have maximum truck traffic percentages of 25% or lower.
- Minimum and mean lane widths are generally larger than those observed for the Iowa RU2L2W routes.
- SR 3, SR 6, and SR 65 have the largest variation in shoulder width.
- Most of the routes have less than 25% presence of rumble strips.
- Less than half of the 2U/3T roadways have a TWLTL present and, in general, the length is less than one fourth of the total 2U/3T length.
- SR 30 was already selected to be included in the study as the RU2L2W route from Washington, so the analogous 2U/3T sections could be included as well.
Based on the data from the top 20 4U/5T segments in Iowa, the following observations were made:
- The routes with the largest traffic volume variation are SR 6 followed by SR 461 and SR 67. All have a maximum daily traffic volume in excess of 20,000 vehicles per day or more.
- As expected, the 4U/5T routes generally have a higher minimum and maximum traffic volume than the 2U/3T routes in Iowa.
- Most routes have a relatively wide variation in posted speed limit.
- The 4U/5T routes have maximum truck traffic percentages of about 20% or lower.
- Minimum and mean lane widths are generally larger than those observed for the Iowa RU2L2W routes.
- The mean shoulder width varies from 0 to approximately 7 feet but the maximum shoulder width is essentially the same for all of the 4U/5T routes.
- All of the routes have less than 35% presence of rumble strips.
- Half of the 4U/5T roadways have a TWLTL present and, in general, the length is less than half of the total 4U/5T length.
- SR 30 was already selected to be included in the study as the RU2L2W route from Iowa, so the analogous 4U/5T sections could be included as well.
These observations along with the available Iowa urban/suburban undivided roadway characteristics will be combined with corresponding data from the other two state agency partners. This combined data will be used to select representative 2U/3T and 4U/5T routes from all three state agency partners.
Urban/Suburban Undivided Roadway Selection
2-lane undivided arterials (2U/3T)
The available 2U/3T roadway characteristics (secondary variables from Table 2) from each state agency partner combined with the general observations were considered to select representative 2U/3T routes from each state. The selected 2U/3T routes are shown in Table 35. Note that the routes denoted with an asterisk (*) indicate that particular route had portions classified as 2U/3T but was selected to represent a different roadway type category.
Table 35. Selected 2U/3T Routes and Associated Characteristics
| State | Route | Length [mi] | Max AADT [vpd] / Truck Percent [%] | Min / Max Posted Speed Limit [mph] | Mean/Max Shoulder Width [ft] |
|---|---|---|---|---|---|
| Washington | SR 202 | 20.3 | 39,042 / 8.9 | 60 / 60 | 4.0 / 16 |
| SR 2* | 19.2 | 25,257 / 16.1 | 50 / 60 | 6.5 / 10 | |
| Tennessee | SR 001 | 55.7 | 33,490 / 28 | 25 / 55 | 6.3 / 28 |
| SR 33* | 19.3 | 38,020 / 20 | 25 / 55 | 4.5 / 14 | |
| SR 69* | 17.7 | 11,690 / 14 | 30 / 55 | 5.3 / 10 | |
| Iowa | SR 6 | 16.6 | 23,100 / 25 | 20 / 55 | 4.9 / 12 |
| State | Route | Length [mi] | Max AADT [vpd] / Truck Percent [%] | Min / Max Posted Speed Limit [mph] | Mean/Max Shoulder Width [ft] |
|---|---|---|---|---|---|
| SR 30* | 8.4 | 16,200 / 20 | 25 / 55 | 4.2 / 10 |
*Note: Denotes route selected based on a different roadway type category
SR 202 is one of the longest 2U/3T routes in Washington and has the largest variation in traffic volume and shoulder width. Approximately half of SR 202 has rumble strips present. Washington SR 2 was previously selected as a representative RU2L2W roadway; the associated 2U/3T characteristics of SR 2 are also listed in Table 35. Tennessee has a number of 2U/3T routes with a wider range of posted speed limits. Tennessee SR 1 provides a large variation in posted speed limit (25 to 55 mph), has a reasonable TWLTL length present (> 3 miles) and has a larger variation in traffic volume than SR 2, which is the longest 2U/3T route in Tennessee. Tennessee SR 1 also has, on average, a wider shoulder width than Washington SR 202 and a higher maximum truck percentage. Tennessee SR 1 also has approximately the same rumble strip presence (58%) as Washington SR 202. Both Tennessee SR 33 (RUMLH representative roadway) and SR 69 (RU2L2W representative roadway) have portions of its length that are classified as 2U/3T; the characteristics of the 2U/3T portions of those routes are also summarized in Table 35. Iowa SR 6 is the longest 2U/3T route in Iowa, provides a reasonable variation in posted speed limit and traffic volume, has a reasonable TWLTL length present (> 2 miles), and has relatively small proportion of rumble strips present at 19%. Iowa SR 30 was previously selected as a representative RU2L2W roadway; the associated 2U/3T characteristics of SR 30 are also listed in Table 35.
4-lane undivided arterials (4U/5T)
The available 4U/5T roadway characteristics (secondary variables from Table 2) from each state agency partner combined with the general observations were considered to select representative 4U/5T routes from each state. The selected 4U/5T routes are shown in Table 36. Note that the routes denoted with an asterisk (*) indicate that that particular route has portions classified as 4U/5T but was selected to represent a different roadway type category.
Table 36. Selected 4U/5T Routes and Associated Characteristics
| State | Route | Length [mi] | Max AADT [vpd] / Truck Percent [%] | Min / Max Posted Speed Limit [mph] | Mean/Max Shoulder Width [ft] |
|---|---|---|---|---|---|
| Washington | SR 99 | 9.7 | 42,472 / 17.4 | 40 / 60 | 4.2 / 12 |
| SR 522 | 7.9 | 55,004 / 3.5 | 35 / 35 | 1.4 / 8 | |
| SR 2* | 11.2 | 40,527 / 11.3 | 30 / 60 | 4.5 / 18 | |
| Tennessee | SR 1* | 79.1 | 45,060 / 30 | 25 / 55 | 6.1 / 24 |
| SR 15* | 21.3 | 63,660 / 52 | 30 / 55 | 8.0 / 18 | |
| SR 33* | 12.8 | 41,450 / 20 | 30 / 55 | 6.3 / 16 | |
| Iowa | SR 18 | 10.4 | 16,000 / 20.1 | 20 / 55 | 4.3 / 10 |
| SR 6* | 13.6 | 33,200 / 10.2 | 30 / 55 | 0.4 / 10 | |
| SR 30* | 5.2 | 18,300 / 11.7 | 25 / 55 | 4.5 / 19 |
*Note: Denotes route selected based on a different roadway type category
Due to the relatively short lengths of 4U/5T roadways in Washington (only four routes had lengths in excess of 10 miles), two routes were selected: SR 99 and SR 522. SR 99 has similar traffic volume and posted speed limit variation to SR 2 (which was already selected through the rural undivided selection process) but has no rumble strips present. SR 522 has a higher maximum traffic volume as well as a lower posted speed limit, a smaller proportion of trucks, and narrower shoulders. Washington State SR 2 was previously selected as a representative RU2L2W roadway; the associated 4U/5T characteristics of SR 2 are also listed in Table 36. SR 2 was the second longest 4U/5T route in Washington State.
Three (SR 1, SR 15 and SR 33) previously selected Tennessee routes were also in the top 20 4U/5T routes. Collectively, these routes provide a relatively wide range of 4U/5T characteristics. SR 1 was the longest 4U/5T route and SR 15 has the largest traffic variation of the 4U/5T routes. All three routes have reasonable variation in posted speed limit and reasonable TWLTL lengths (> 70 miles in total between the three routes). Given this, no additional Tennessee 4U/5T routes were selected.
Two previously selected Iowa routes, SR 6 (2U/3T representative roadway) and SR 30 (RU2L2W representative roadway), were also in the top 20 Iowa 4U/5T routes. Similar to Washington State, the 4U/5T roadway lengths were relatively short with only three Iowa 4U/5T routes in excess of 10 miles. Given this, SR 18 was selected as one additional representative 4U/5T route. SR 18 has the third longest 4U/5T length, provides a wide range of posted speed limit, and has some rumble strips present (SR 6 and SR 30 have no rumble strips). In general, the Iowa 4U/5T routes have few TWLTLs but the combination of SR 6 and SR 30 provide nearly 3 miles of TWLTL presence.
Rural Divided Roadway Characteristics
The rural divided roadways were examined in more detail. The four subtypes of rural divided roadway segments identified in the HSM (AASHTO, 2010) are listed below. Note that the HSM does not currently include freeway segments; i.e., subtypes 2, 3, and 4. Safety performance functions for these roadway types were developed under NCHRP Project 17-45 (Bonneson et al., 2012).
- Rural 4-lane divided multilane highway (R4D)
- Rural 4-lane divided freeway (R4F)
- Rural 6-lane divided freeway (R6F)
- Rural 8-lane divided freeway (R8F)
In addition to the rural classification and number of through lanes, all of the freeway segment subtypes have fully-restricted access control—R4F, R6F, and R8F—while the R4D subtype does not. The roadway data from each state was used to determine the level of access control for each section to determine the rural divided roadway subtype. While the access control data for each state varied slightly, each state had a category identifying segments with full access control and only these segments were considered for the R4F, R6F, and R8F subtypes. The R4D routes could have any other access level control other than full access control.
For each rural divided subcategory, the range of roadway and traffic characteristics from the secondary variables shown in Table 2 were then examined for the routes with the longest subcategory-classified length in each of the three states. Representative rural divided routes were then selected considering the associated roadway and traffic characteristics across all three states.
Washington Rural Divided Roadways and Associated Characteristics
Table 37 summarizes the results of the classification of the available rural divided roadways in Washington State. The vast majority of the available sections are R4D and R4F with only two unique routes having portions classified as R6F and one route with a small section classified as R8F. Given the lack of R8F segment length available in Washington State, the research team proposes selecting an additional R8F route from Tennessee or Iowa, depending on availability.
Table 37. Available Washington State Rural Divided Roadway Segments
| Rural Divided Roadway Type | Total Length [mi] | Unique Routes |
|---|---|---|
| R4D | 107.5 | 11 |
| R4F | 409.9 | 11 |
| R6F | 72.0 | 2 |
| R8F | 0.32 | 1 |
As all rural divided subtypes in Washington have less than 20 unique routes available, all of the available routes were examined for the R4D, R4F, and R6F subtypes. Figure 12 summarizes the available R4D roadways in Washington State ranked by total R4D length available. The available segment data was processed to combine adjacent R4D segments from the same route to determine the number of contiguous segments for each route. The number of contiguous R4D segments for a given route is the left number shown in the Figure 12 data label. The maximum contiguous length for each route was tallied and the average contiguous length was computed by dividing the total R4D length by the number of contiguous segments for each route; these are the middle and right numbers in the Figure 12 data label, respectively.

Table 38 and Table 39 present information on the secondary variables (see Table 2) for 9 of the 11 R4D routes shown in Figure 12. Since routes 501 and 9 had only a single segment less than a tenth of a mile long classified as R4D, these two routes were excluded from further consideration. Table 38 summarizes the operational characteristics while Table 39 summarizes the geometric characteristics. For each route, the range of AADT, the range of large truck percentage, and the range of posted speed limit are shown in Table 38. Note that for state highways with no posted speed limit Washington State legislation specifies a maximum speed of 60 mph (RCW, 46.61.400).
| Route Designation | AADT [veh/day] | Posted Speed Limit [mph] | Truck Percentage [%] | |||
|---|---|---|---|---|---|---|
| Minimum | Maximum | Minimum | Maximum | Minimum | Maximum | |
| 2 | 4,280 | 23,017 | 30 | 60 | 3.2 | 15.7 |
| 8 | 14,646 | 17,892 | 60 | 60 | 0.0 | 9.1 |
| 101 | 8,283 | 28,029 | 25 | 60 | 5.5 | 10.1 |
| 395 | 15,867 | 18,211 | 55 | 55 | 10.5 | 32.4 |
| 195 | 5,530 | 9,430 | 60 | 60 | 8.3 | 22.5 |
| 12 | 7,073 | 21,363 | 20 | 60 | 0.0 | 20.5 |
| 20 | 24,421 | 32,782 | 55 | 55 | 5.5 | 7.8 |
| 97 | 11,594 | 13,149 | 55 | 55 | 7.5 | 32.5 |
| 125 | 14,828 | 15,201 | . | . | 10.0 | 10.0 |
Geometric characteristics shown in Table 39 include lane width, outside shoulder width, median width, as well as percentage of positive median barrier and rumble strips present. The minimum and mean lane widths are reported. The shoulder width data in Table 39 considers the outside shoulder width for both directions of the divided roadway. In general, however, the outside shoulder widths were nearly identical in most cases. All routes had a minimum shoulder width of zero (not shown in Table 39) except for routes 12 and 395, which had a 4 foot and 10 foot minimum shoulder width, respectively. The minimum and maximum median widths are reported for each route and, in Washington State, this width includes the inside/left shoulder widths. Positive barrier presence was determined from the median barrier type variable. Median barrier types included cable, guardrail, and NJ type barriers; only the depressed, unprotected, and curb categories were considered to have no positive barrier present. For each route, the total length of sections with positive barrier were divided by the corresponding total R4D length for that route, as shown in Figure 12. Rumble strip presence data is not available in the HSIS roadway inventory data but Washington State maintains this data separately. For each of the routes, the proportion of route length with any rumble strips present was computed using this separate dataset. Note that this data is based on the entire length of the roadway and is not necessarily specific to the R4D portions of the route. Nonetheless, the data provides a general indication of whether or not any rumble strips are present along a particular route. The available rumble strip data (not included in Table 39) also indicates the location of the rumble strips: centerline only, shoulders only, or both centerline and shoulder locations. Once specific routes have been selected, the exact details on the rumble strips will be merged into the corresponding HSIS roadway inventory data.
Table 39. Geometric Characteristics of the Rural Divided Multilane (R4D) Routes in Washington State
| Route Designation | Min / Mean Lane Width [ft] | Mean / Max Outside Shoulder Width [ft] | Min / Max Median Width [ft] | Median Barrier Presence [%] | Approximate Rumble Strip Presence [%] |
|---|---|---|---|---|---|
| 2 | 12 / 12.3 | 9.2 / 25 | 4 / 400 | 23.7 | 79 |
| 8 | 12 / 12.1 | 9.8 / 10 | 32 / 120 | 80.6 | 0 |
| 101 | 12 / 12.4 | 8.9 / 11 | 4 / 44 | 62.6 | 78 |
| 395 | 12 / 12.0 | 10.0 / 10 | 75 / 75 | 0.0 | 50 |
| 195 | 12 / 12.1 | 10.0 / 11 | 78 / 80 | 20.4 | 92 |
| 12 | 12 / 12.0 | 9.7 / 10 | 12 / 60 | 0.0 | 78 |
| 20 | 11 / 12.4 | 9.0 / 10 | 40 / 60 | 44.1 | 28 |
| 97 | 12 / 12.1 | 9.6 / 10 | 16 / 20 | 78.6 | 82 |
| 125 | 12 / 12.8 | 9.0 / 40 | 16 / 16 | 64.2 | 0 |
Figure 13 summarizes the available R4F roadways in Washington State ranked by total R4F length available. The available segment data was processed to combine adjacent R4F segments from the same route to determine the number of contiguous segments for each route. The number of contiguous R4F segments for a given route is the left number shown in the Figure 13 data label. The maximum contiguous length for each route was tallied and the average contiguous length computed by dividing the total R4F length by the number of contiguous segments for each route; these are the middle and right numbers in the Figure 13 data label, respectively.
Table 40 and Table 41 present information on the secondary variables (see Table 2) for 8 of the 11 R4F routes shown in Figure 13. Since routes 195, 501, and 101 have only a single segment less than half of a mile long classified as R4F, these three routes were excluded from further consideration. Table 40 summarizes the operational characteristics while Table 41 summarizes the geometric characteristics. For each route, the range of AADT, the range of large truck percentage, and the range of posted speed limit are shown in Table 40.
Table 40. Operational Characteristics of the Rural Divided Freeway (R4F) Routes in Washington State
| Route Designation | AADT [veh/day] | Posted Speed Limit [mph] | Truck Percentage [%] | |||
|---|---|---|---|---|---|---|
| Minimum | Maximum | Minimum | Maximum | Minimum | Maximum | |
| 90 | 10,285 | 33,202 | 65 | 70 | 0.0 | 23.7 |
| 82 | 8,807 | 26,806 | 65 | 70 | 0.0 | 20.0 |
| 395 | 6,773 | 17,261 | 55 | 70 | 5.7 | 61.6 |
| 5 | 23,088 | 65,821 | 60 | 70 | 7.3 | 16.8 |
| 12 | 9,745 | 20,725 | 20 | 60 | 0.0 | 20.5 |
| 18 | 23,164 | 33,801 | 55 | 60 | 0.0 | 15.3 |
| 16 | 44,643 | 49,473 | 60 | 60 | 0.0 | 5.2 |
| 2 | 15,913 | 78,176 | 50 | 55 | 0.0 | 8.8 |
Geometric characteristics shown in Table 41 include lane width, outside shoulder width, median width, as well as percentage of positive median barrier and rumble strips present. The mean lane width is reported; the minimum lane width for all the routes shown was 12 feet, so this was
excluded from the table. The shoulder width data in Table 41 considers the outside shoulder width for both directions of the divided roadway. In general, however, the outside shoulder widths were nearly identical in most cases. All routes shown had a minimum outside shoulder width of zero (not shown in Table 41). The minimum and maximum median widths are reported for each route and, in Washington State, this width includes the inside/left shoulder widths. Positive barrier presence was determined from the median barrier type variable. Median barrier types included cable, guardrail, and NJ type barriers; only the depressed, unprotected, and curb categories were considered to have no positive barrier present.
For each route, the total length of sections with positive barrier were divided by the corresponding total R4F length for that route, as shown in Figure 13. Rumble strip presence data is not available in the HSIS roadway inventory data but Washington State maintains this data separately. For each of the routes, the proportion of route length with any rumble strips present was computed using this separate dataset. Note that this data is based on the entire length of the roadway and not necessarily specific to the R4F portions of the route. Nonetheless, the data provides a general indication of whether or not any rumble strips are present along a particular route. The available rumble strip data (not included in Table 41) also indicates the location of the rumble strips: centerline only, shoulders only, or both centerline and shoulder locations. Once specific routes have been selected, the exact details on the rumble strips will be merged into the corresponding HSIS roadway inventory data. Note that the initial rumble strip data from Washington State did not include Interstate roadways; we will work with our contacts at Washington State to obtain the rumble strip information for these routes.
Table 41. Geometric Characteristics of the Rural Divided Freeway (R4F) Routes in Washington State
| Route Designation | Mean Lane Width [ft] | Mean / Max Outside Shoulder Width [ft] | Min / Max Median Width [ft] | Median Barrier Presence [%] | Approximate Rumble Strip Presence [%] |
|---|---|---|---|---|---|
| 90 | 12.4 | 9.3 / 10 | 4 / 450 | 34.4 | * |
| 82 | 12.6 | 9.2 / 11 | 40 / 760 | 18.0 | * |
| 395 | 12.2 | 9.7 / 10 | 55 / 620 | 3.1 | 50 |
| 5 | 12.2 | 9.6 / 10 | 15 / 800 | 72.8 | * |
| 12 | 12.6 | 8.9 / 10 | 14 / 60 | 51.0 | 78 |
| 18 | 13.1 | 8.6 / 11 | 20 / 48 | 79.8 | 13 |
| 16 | 12.7 | 9.0 / 10 | 36 / 80 | 29.9 | 0 |
| 2 | 15.3 | 3.8 / 10 | 15 / 50 | 9.7 | 79 |
*Note: Interstate routes not currently included in the rumble strip data provided.
Figure 14 summarizes the available R6F roadways in Washington State ranked by total R6F length available. The available segment data was processed to combine adjacent R6F segments from the same route to determine the number of contiguous segments for each route. The number of contiguous R6F segments for a given route is the left number shown in the Figure 14 data label. The maximum contiguous length for each route was tallied and the average contiguous length was computed by dividing the total R6F length by the number of contiguous segments for each route; these are the middle and right numbers in the Figure 14 data label, respectively.

Table 42 and Table 43 present information on the secondary variables (see Table 2) for two R6F routes shown in Figure 14. Table 42 summarizes the operational characteristics while Table 43 summarizes the geometric characteristics. For each route, the range of AADT, the range of large truck percentage, and the range of posted speed limit are shown in Table 42.
Table 42. Operational Characteristics of the Rural Divided Freeway (R6F) Routes in Washington State
| Route Designation | AADT [veh/day] | Posted Speed Limit [mph] | Truck Percentage [%] | |||
|---|---|---|---|---|---|---|
| Minimum | Maximum | Minimum | Maximum | Minimum | Maximum | |
| 5 | 40,498 | 128,331 | 60 | 70 | 6.9 | 38.7 |
| 90 | 31,074 | 69,067 | 65 | 70 | 0.0 | 0.0 |
Geometric characteristics shown in Table 43 include lane width, outside shoulder width, median width, as well as percentage of positive median barrier present. The mean lane width is reported; the minimum lane width for all the routes shown was 12 feet, so this was excluded from the table. The shoulder width data in Table 43 considers the outside shoulder width for both directions of the divided roadway. In general, however, the outside shoulder widths were nearly identical. Both routes shown had a minimum outside shoulder width of zero (not shown in Table 43). The minimum and maximum median widths are reported for each route and, in Washington State, this width includes the inside/left shoulder widths. Positive barrier presence was
determined from the median barrier type variable. Median barrier types included cable, guardrail and NJ type barriers; only the depressed, unprotected, and curb categories were considered to have no positive barrier present. For each route, the total length of sections with positive barrier were divided by the corresponding total R6F length for that route, as shown in Figure 14. The rumble strip presence data initially obtained from Washington State did not include Interstate roadways such as I-5 and I-90, so the rumble strip presence is not indicated in Table 43. We will work with our contacts at Washington State to obtain the rumble strip information for these routes.
Table 43. Geometric Characteristics of the Rural Divided Freeway (R6F) Routes in Washington State
| Route Designation | Mean Lane Width [ft] | Mean / Max Outside Shoulder Width [ft] | Min / Max Median Width [ft] | Median Barrier Presence [%] |
|---|---|---|---|---|
| 5 | 12.4 | 9.3 / 22 | 15 / 540 | 67.9 |
| 90 | 12.7 | 7.9 / 17 | 20 / 440 | 65.6 |
Based on the data from the available R4D segments in Washington, the following observations were made:
- Compared to the RU2L2W and urban undivided roadways in Washington, there are many fewer unique routes classified as R4D.
- The routes with the largest traffic volume variation are SR 101 followed by SR 2 and SR 12. All three have a maximum daily traffic volume in excess of 20,000 vehicles per day or more.
- Most routes have a relatively small variation in posted speed limit.
- The majority of the R4D routes have maximum truck traffic percentage between 10% and 30%.
- Minimum lane width is generally 12 feet and there is less variation in R4D lane width compared to the Washington RU2L2W and urban/suburban undivided roadways.
- SR 125 and SR 2 have the largest variation in outside shoulder width.
- Approximately half of the routes have relatively consistent median widths—SR 195, SR 395 and SR 125—while the other half of the routes have a varied median width. SR 2 and SR 8 have the largest median width variability.
- All but two available R4D routes in Washington have positive median barriers along 20% or more of the roadway length.
- Most of the routes have 50% or more presence of rumble strips.
- SR 2, the longest available Washington R4D route available, was already selected to be included in the study as the RU2L2W route, so the analogous R4D sections of SR 2 could be included as well.
Based on the data from the available R4F segments in Washington, the following observations were made:
- Compared to the RU2L2W and urban undivided roadways in Washington, there are many fewer unique routes classified as R4F. I-90 has by far the longest length of R4F available.
- As expected, the minimum and maximum traffic volumes for the R4F routes (on average) are higher than those for the R4D routes.
- The routes with the largest traffic volume variation are SR 2 followed by SR 5. Both have a maximum daily traffic volume in excess of 60,000 vehicles per day.
- With the exception of SR 12, the available R4F routes have a small variation in posted speed limit.
- The majority of the R4F routes have maximum truck traffic percentage below 25%.
- Similar to the Washington R4D routes, there is less variation in R4F lane width compared to the Washington RU2L2W and urban/suburban undivided roadways.
- SR 2 has the largest variation in outside shoulder width but all of the available routes have a maximum outside shoulder width of 10 or 11 feet.
- Compared to the Washington R4D routes, there is more variability in the R4F median widths and the four longest R4F routes have maximum median widths as wide as several hundred feet.
- All of the available R4F routes in Washington have positive median barrier present and generally between 3% and 80% of the total R4F classified roadway length.
- SR 2 was already selected to be included in the study as the RU2L2W route so the analogous R4F sections of SR 2, albeit short, could be included as well.
Based on the data from the two available R6F segments in Washington, the following observations were made:
- As expected, the minimum and maximum traffic volumes for the R6F routes (on average) are higher than those for the R4D and R4F routes.
- Both R6F routes have a reasonably wide variation in traffic, with I-5 having a maximum traffic volume over 100,000 vehicles per day.
- I-5 has a reasonable variation in truck traffic percentage. I-90 does not have any reported truck traffic on the R6F segments.
- Similar to the Washington R4D and R4F routes, there is less variation in R6F lane width compared to the Washington RU2L2W and urban/suburban undivided roadways.
- Both routes have similar outside shoulder widths and median widths.
- Both of the R6F routes in Washington have positive median barrier present on approximately two-thirds of the R6F length.
These observations along with the available Washington rural divided roadway characteristics will be combined with corresponding data from the other two state agency partners. This combined data will be used to select representative R4D, R4F, R6F, and R8F routes from all three state agency partners.
Tennessee Rural Divided Roadways and Associated Characteristics
Table 44 summarizes the results of the classification of the available rural divided roadways in Tennessee. Similar to Washington State, the vast majority of the available sections are R4D and R4F. Given the lack of R8F length available in Washington and Tennessee, the research team proposes selecting two additional 8F routes from Iowa, depending on availability
Table 44. Available Tennessee Rural Divided Roadway Segments
| Rural Divided Roadway Type | Total Length [mi] | Unique Routes |
|---|---|---|
| R4D | 733.8 | 58 |
| R4F | 590.0 | 15 |
| R6F | 22.6 | 8 |
| R8F | 0.2 | 1 |
As the R4F and R6F subtypes in Tennessee have less than 20 unique routes available, all of the available routes will be examined for these subtypes. The 20 longest R4D routes are examined in more detail. Figure 15 summarizes the top 20 R4D roadways in Tennessee ranked by total R4D length available. The available segment data was processed to combine adjacent R4D segments from the same route to determine the number of contiguous segments for each route. Note that approximately 71% (41 of 58 routes) have 10 miles or less total R4D length available (not shown in Figure 15).

Table 45 and Table 46 present information on the secondary variables (see Table 2) for the top 20 R4D routes shown in Figure 15. Table 45 summarizes the operational characteristics, while Table 46 summarizes the geometric characteristics. For each route, the range of AADT, the range of large truck percentage, and the range of posted speed limit are shown in Table 45.
| Route Designation | AADT [veh/day] | Posted Speed Limit [mph] | Truck Percentage [%] | |||
|---|---|---|---|---|---|---|
| Minimum | Maximum | Minimum | Maximum | Minimum | Maximum | |
| SR015 | 2,290 | 23,260 | 30 | 70 | 0 | 52 |
| SR001 | 410 | 18,740 | 30 | 65 | 0 | 24 |
| SR020 | 5,670 | 15,900 | 40 | 65 | 6 | 26 |
| SR005 | 2,730 | 17,510 | 45 | 65 | 7 | 32 |
| SR076 | 3,270 | 11,260 | 30 | 65 | 7 | 34 |
| SR034 | 7,740 | 23,460 | 45 | 65 | 3 | 16 |
| SR111 | 3,140 | 23,370 | 35 | 65 | 4 | 22 |
| SR003 | 5,510 | 25,960 | 45 | 70 | 7 | 59 |
| SR043 | 2,480 | 16,680 | 40 | 65 | 2 | 13 |
| SR022 | 3,120 | 10,810 | 35 | 65 | 1 | 19 |
| SR029 | 4,150 | 16,750 | 45 | 55 | 3 | 18 |
| SR030 | 5,580 | 10,980 | 40 | 60 | 0 | 11 |
| SR033 | 4,860 | 15,080 | 40 | 55 | 9 | 25 |
| SR035 | 2,930 | 16,300 | 35 | 55 | 3 | 9 |
| SR032 | 8,360 | 17,250 | 50 | 55 | 14 | 19 |
| SR006 | 6,540 | 14,280 | 30 | 65 | 10 | 18 |
| SR073 | 7,990 | 13,700 | 35 | 65 | 2 | 11 |
| SR050 | 4,980 | 5,630 | 55 | 65 | 16 | 19 |
| SR010 | 17,400 | 35,480 | 55 | 65 | 8 | 18 |
| SR104 | 1,650 | 2,210 | 55 | 65 | 4 | 13 |
Geometric characteristics shown in Table 46 include lane width, outside shoulder width, median width, as well as percentage of positive median barrier and rumble strips present. The shoulder width data in Table 46 considers the outside shoulder width for both directions of the divided roadway. As the minimum shoulder width exceeded zero, minimum shoulder width was included in Table 46. Note that Tennessee only reports shoulder width to the nearest foot. The minimum and mean lane widths are reported based on a combination of the pavement width data element (travel lanes only) and number of lanes data in the roadway description table and road geometry tables, respectively. The minimum and maximum median widths are reported for each route and, in Tennessee, this width does not include the inside/left shoulder widths. Positive barrier presence was determined from the feature composition variable associated with the median features present in the roadway description table. Median barrier types included concrete barrier, other barrier, and cable barrier. For each route, the total length of sections with positive barrier were divided by the corresponding total R4D length for that route, as shown in Figure 15. The Tennessee maintenance inventory table includes shoulder rumble strip data, which was used to generate the rumble strip presence proportions shown in Table 46. These values reflect the proportion of R4D length for each route that has rumble strips present on any of the four travel
way edges. This was computed by dividing total rumble strip length for each route by the corresponding total edge length, which was four times the R4D length reported in Figure 15.
Table 46. Geometric Characteristics of the Top 20 Rural Divided Multilane (R4D) Routes in Tennessee
| Route Designation | Min / Mean Lane Width [ft] | Min / Mean / Max Outside Shoulder Width [ft] | Min / Max Median Width [ft] | Median Barrier Presence [%] | Approximate Rumble Strip Presence [%] |
|---|---|---|---|---|---|
| SR015 | 11 / 12.1 | 1 / 10.4 / 12 | 4 / 55 | 3.1 | 82 |
| SR001 | 9 / 12.1 | 2 / 9.7 / 14 | 2 / 52 | 1.5 | 81 |
| SR020 | 9 / 11.9 | 4 / 10.9 / 24 | 18 / 55 | 4.4 | 78 |
| SR005 | 12 / 12.0 | 2 / 10.6 / 12 | 16 / 60 | 0.0 | 83 |
| SR076 | 9 / 11.9 | 4 / 10.0 / 12 | 2 / 54 | 7.1 | 29 |
| SR034 | 12 / 12.0 | 2 / 9.4 / 12 | 4 / 100 | 0.4 | 48 |
| SR111 | 9 / 11.7 | 1 / 10.3 / 12 | 2 / 150 | 5.2 | 100 |
| SR003 | 12 / 12.0 | 2 / 7.8 / 12 | 6 / 360 | 0.0 | 80 |
| SR043 | 12 / 12.0 | 4 / 10.1 / 11 | 16 / 42 | 0.0 | 93 |
| SR022 | 11 / 11.9 | 2 / 10.2 / 12 | 8 / 42 | 0.6 | 94 |
| SR029 | 12 / 12.0 | 10 / 10.1 / 11 | 16 / 39 | 1.3 | 97 |
| SR030 | 12 / 12.0 | 2 / 10.1 / 12 | 12 / 42 | 0.0 | 68 |
| SR033 | 12 / 12.0 | 3 / 10.1 / 12 | 2 / 44 | 3.2 | 51 |
| SR035 | 12 / 12.0 | 10 / 10.1 / 14 | 30 / 42 | 0.6 | 11 |
| SR032 | 12 / 12.0 | 10 / 10.6 / 12 | 2 / 56 | 64.5 | 75 |
| SR006 | 11 / 11.9 | 1 / 9.5 / 10 | 4 / 40 | 6.5 | 89 |
| SR073 | 12 / 12.0 | 2 / 10.4 / 26 | 2 / 42 | 7.2 | 31 |
| SR050 | 12 / 12.0 | 10 / 10.0 / 10 | 38 / 40 | 0.0 | 100 |
| SR010 | 12 / 12.0 | 10 / 10.6 / 11 | 24 / 40 | 0.0 | 77 |
| SR104 | 11 / 11.8 | 10 / 10.5 / 11 | 10 / 40 | 0.0 | 92 |
Figure 16 summarizes the 15 available R4F roadways in Tennessee ranked by total R4F length available. The available segment data was processed to combine adjacent R4F segments from the same route to determine the number of contiguous segments for each route. Table 47 and Table 48 present information on the secondary variables (see Table 2) for the available R4F routes shown in Figure 16. Since SR 32 only had a single R4F segment approximately 1 mile in length, this route was excluded from further consideration.
For each route, the range of AADT, the range of large truck percentage, and the range of posted speed limit are shown in Table 47. Geometric characteristics shown in Table 48 include lane width, outside shoulder width, median width, as well as percentage of positive median barrier and rumble strips present. The shoulder width data in Table 39 considers the outside shoulder width for both directions of the divided roadway. As the minimum shoulder width exceeded zero, minimum shoulder width was included in Table 48. Note that Tennessee only reports shoulder width to the nearest foot. The minimum and mean lane widths are reported based on a combination of the pavement width data element (travel lanes only) and number of lanes data in the roadway description table and road geometry tables, respectively. The minimum and maximum median widths are reported for each route and, in Tennessee, this width does not include the inside/left shoulder widths. Positive barrier presence was determined from the feature
composition variable associated with the median features present in the roadway description table. Median barrier types included concrete barrier, other barrier, and cable barrier. For each route, the total length of sections with positive barrier were divided by the corresponding total R4F length for that route. The Tennessee maintenance inventory table includes shoulder rumble strip data which was used to generate the rumble strip presence proportions shown in Table 48. These values reflect the proportion of R4F length for each route that has rumble strips present on any of the four travel way edges. This was computed by dividing total rumble strip length for each route by the corresponding total edge length—four times the R4F length shown in Figure 16.
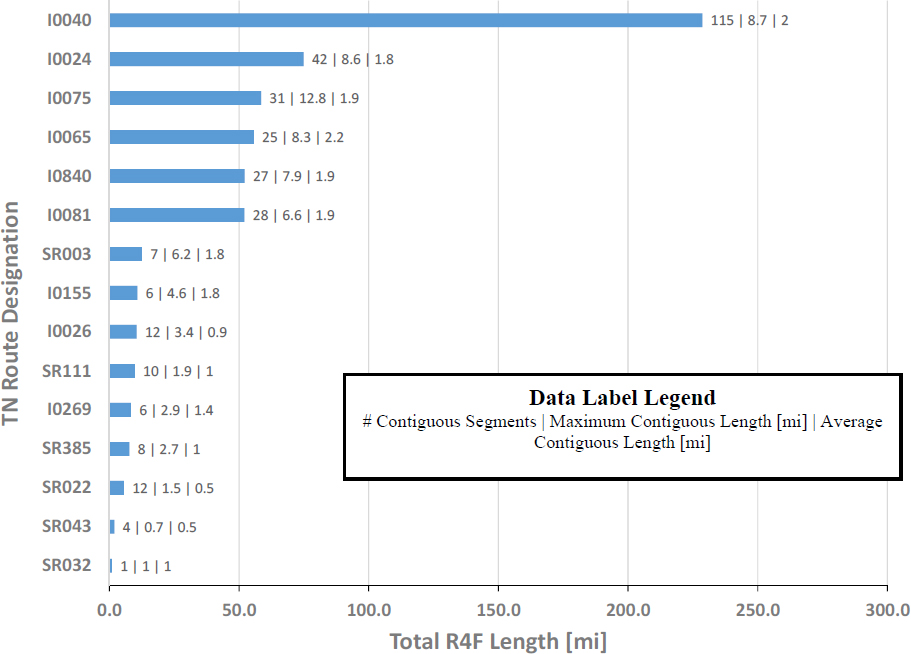
Table 47. Operational Characteristics of the Rural Divided Freeway (R4F) Routes in Tennessee
| Route Designation | AADT [veh/day] | Posted Speed Limit [mph] | Truck Percentage [%] | |||
|---|---|---|---|---|---|---|
| Minimum | Maximum | Minimum | Maximum | Minimum | Maximum | |
| I0040 | 27,880 | 71,310 | 55 | 70 | 24 | 48 |
| I0024 | 33,990 | 69,790 | 55 | 70 | 14 | 47 |
| I0075 | 26,890 | 62,000 | 55 | 70 | 19 | 36 |
| I0065 | 21,450 | 50,810 | 60 | 70 | 24 | 42 |
| I0840 | 11,090 | 53,560 | 70 | 70 | 10 | 31 |
| I0081 | 28,810 | 42,300 | 65 | 70 | 30 | 42 |
| SR003 | 5,510 | 11,070 | 45 | 70 | 27 | 59 |
| I0155 | 10,660 | 11,240 | 70 | 70 | 36 | 38 |
| I0026 | 9,400 | 62,420 | 50 | 65 | 6 | 25 |
| Route Designation | AADT [veh/day] | Posted Speed Limit [mph] | Truck Percentage [%] | |||
|---|---|---|---|---|---|---|
| Minimum | Maximum | Minimum | Maximum | Minimum | Maximum | |
| SR111 | 9,740 | 11,060 | 55 | 65 | 11 | 12 |
| I0269 | 9,390 | 18,260 | 65 | 65 | 9 | 52 |
| SR385 | 11,000 | 14,140 | 65 | 65 | 8 | 13 |
| SR022 | 4,340 | 9,590 | 55 | 70 | 5 | 29 |
| SR043 | 5,230 | 5,410 | 45 | 65 | 10 | 10 |
Table 48. Geometric Characteristics of the Rural Divided Freeway (R4F) Routes in Tennessee
| Route Designation | Min / Mean Lane Width [ft] | Min / Mean / Max Outside Shoulder Width [ft] | Min / Max Median Width [ft] | Median Barrier Presence [%] | Approximate Rumble Strip Presence [%] |
|---|---|---|---|---|---|
| I0040 | 9 / 12.0 | 4 / 10.7 / 20 | 2 / 500 | 35.5 | 57 |
| I0024 | 12 / 12.0 | 4 / 10.5 / 12 | 2 / 380 | 20.6 | 75 |
| I0075 | 12 / 12.0 | 6 / 11.0 / 24 | 2 / 300 | 33.5 | 59 |
| I0065 | 12 / 12.0 | 10 / 10.3 / 11 | 30 / 240 | 10.8 | 64 |
| I0840 | 12 / 12.0 | 10 / 10.8 / 12 | 46 / 350 | 4.5 | 48 |
| I0081 | 11 / 12.0 | 8 / 10.8 / 12 | 52 / 350 | 1.3 | 67 |
| SR003 | 12 / 12.0 | 10 / 10.7 / 12 | 18 / 56 | 13.2 | 81 |
| I0155 | 12 / 12.0 | 10 / 10.4 / 12 | 2 / 90 | 67.5 | 61 |
| I0026 | 12 / 12.0 | 8 / 10.2 / 16 | 2 / 38 | 100 | 69 |
| SR111 | 12 / 12.1 | 6 / 10.4 / 11 | 2 / 56 | 66.5 | 78 |
| I0269 | 12 / 12.0 | 8 / 10.0 / 11 | 40 / 42 | 0.0 | 53 |
| SR385 | 12 / 12.0 | 6 / 10.9 / 11 | 38 / 64 | 100 | 51 |
| SR022 | 12 / 12.0 | 6 / 10.0 / 11 | 36 / 40 | 0.0 | 71 |
| SR043 | 12 / 12.0 | 6 / 9.8 / 12 | 38 / 38 | 0.0 | 0 |
Figure 17 summarizes the 8 available R6F roadways in Tennessee ranked by total R6F length available. The available segment data was processed to combine adjacent R6F segments from the same route to determine the number of contiguous segments for each route.

Table 49 and Table 50 present information on the secondary variables (see Table 2) for the available R6F routes shown in Figure 17. Since I-81, I-155, SR 111 and SR 22 have only one or two R6F segments and less than 0.5 miles of R6F length, these routes were excluded from further consideration. For each route, the range of AADT, the range of large truck percentage, and the range of posted speed limit are shown in Table 49.
Table 49. Operational Characteristics of the Rural Divided Freeway (R6F) Routes in Tennessee
| Route Designation | AADT [veh/day] | Posted Speed Limit [mph] | Truck Percentage [%] | |||
|---|---|---|---|---|---|---|
| Minimum | Maximum | Minimum | Maximum | Minimum | Maximum | |
| I0040 | 32,560 | 76,810 | 65 | 70 | 24 | 47 |
| I0024 | 37,890 | 69,790 | 55 | 70 | 14 | 42 |
| I0840 | 11,090 | 38,200 | 70 | 70 | 13 | 31 |
| I0065 | 22,700 | 29,710 | 60 | 70 | 24 | 40 |
Geometric characteristics shown in Table 50 include lane width, outside shoulder width, median width, as well as percentage of positive median barrier and rumble strips present. The minimum and mean lane widths are reported. The shoulder width data in Table 50 considers the outside shoulder width for both directions of the divided roadway. As the minimum shoulder width exceeded zero, minimum shoulder width was included in Table 50. Note that Tennessee only reports shoulder width to the nearest foot. The minimum and maximum median widths are reported for each route and, in Tennessee, this width does not include the inside/left shoulder widths. Positive barrier presence was determined from the feature composition variable
associated with the median features present in the roadway description table. Median barrier types included concrete barrier, other barrier, and cable barrier. For each route, the total length o sections with positive barrier was divided by the corresponding total R6F length for that route. The Tennessee maintenance inventory table includes shoulder rumble strip data, which was used to generate the rumble strip presence proportions shown in Table 50. These values reflect the proportion of R6F length for each route that has rumble strips present on any of the four travel way edges. This was computed by dividing total rumble strip length for each route by the corresponding total edge length—four times the R6F length shown in Figure 17.
Table 50. Geometric Characteristics of the Rural Divided Freeway (R6F) Routes in Tennessee
| Route Designation | Min / Mean Lane Width [ft] | Min / Mean / Max Outside Shoulder Width [ft] | Min / Max Median Width [ft] | Median Barrier Presence [%] | Approximate Rumble Strip Presence [%] |
|---|---|---|---|---|---|
| I0040 | 12 / 12.0 | 4 / 10.4 / 16 | 2 / 176 | 44.0 | 97 |
| I0024 | 12 / 12.0 | 4 / 11.0 / 12 | 28 / 90 | 2.5 | 100 |
| I0840 | 12 / 12.0 | 10 / 10.0 / 10 | 60 / 62 | 0.0 | 100 |
| I0065 | 12 / 12.0 | 4 / 7.3 / 11 | 48 / 50 | 26.5 | 100 |
Based on the data from the available R4D segments in Tennessee, the following observations were made:
- Compared to the RU2L2W and urban undivided roadways in Tennessee, there are fewer unique routes classified as R4D.
- The routes with the largest traffic volume variation are SR 15 followed by SR 3 and SR 111. All three have a maximum daily traffic volume in excess of 20,000 vehicles per day or more. In general, the minimum and maximum traffic volumes are similar to the Washington R4D roadways.
- Compared to Washington State, the Tennessee R4D routes have a wider variation in posted speed limits.
- Similar to the Washington State R4D routes, the majority of the Tennessee R4D routes have maximum truck traffic percentage between 10% and 30%.
- Similar to the Washington R4D routes, the minimum lane width is generally 12 feet and there is generally less variation in lane width compared to other route types.
- SR 73 and SR 20 have the largest variation in outside shoulder width.
- Most of the Tennessee R4D routes have a varied median width. Routes with the largest median width variation are SR 3 and SR 111.
- Positive median barriers are relatively scarce along the Tennessee R4D routes, with almost all routes having 10% or less positive median barrier presence.
- Most of the routes have 50% or more presence of rumble strips.
- SR 15, the longest available Tennessee R4D route available, was already selected to be included in the study as the RUMLH route so the analogous R4D sections of SR 15 could be included as well. SR 33 (RUMLH) and SR 1 (2U/3T) were previously selected and have relatively large R4D classified portions that could be included.
Based on the data from the available R4F segments in Tennessee, the following observations were made:
- Compared to the RU2L2W and urban undivided roadways in Tennessee, there are many fewer unique routes classified as R4F. I-40 has by far the longest length of R4F available.
- As expected and similar to Washington State, the minimum and maximum traffic volumes for the R4F routes (on average) are higher than those for the R4D routes.
- The routes with the largest traffic volume variation are I-26 followed by I-40. Both have a maximum daily traffic volume in excess of 60,000 vehicles per day.
- The available R4F routes have a relatively small variation in posted speed limit and generally a maximum posted speed limit of 70 mph.
- The majority of the R4F routes have maximum truck traffic percentage above 25%.
- Similar to the Tennessee R4D routes, there is less variation in R4F lane width compared to the Tennessee RU2L2W, RUMLH and urban/suburban undivided roadways.
- I-75 has the largest variation in outside shoulder width but a majority of the available routes have a maximum outside shoulder width of 11 or 12 feet.
- There is more variability in the R4F median widths compared to the Tennessee R4D routes and the six longest R4F routes have maximum median widths as wide as several hundred feet.
- Compared to the Tennessee R4D routes, there is a larger presence of median barrier on R4F routes.
Based on the data from the available R6F segments in Tennessee, the following observations were made:
- As expected, the minimum and maximum traffic volumes for the R6F routes (on average) are higher than those for the R4D and R4F routes. Compared to Washington State, however, there appears to be a smaller difference in traffic volume between the R6F and R4F routes.
- The R6F sections of I-40 and I-24 routes have a reasonably wide variation in traffic with maximum traffic volume of approximately 70,000 vehicles per day.
- As expected, there is little variation in posted speed limit.
- Truck traffic percentage generally varies between 15% and 40% percent for the available R6F routes.
- Similar to the Tennessee R4D and R4F routes, there is less variation in R6F lane width compared to the rural and urban/suburban undivided roadways.
- With the exception of I-840, the routes have similar outside shoulder width variation.
- I-840 and I-65 have relatively consistent median widths while I-40 and I-24 have greater median width variation.
- Rumble strips are present on virtually all possible travel way edges for the available R6F- /*+ routes.
- Positive median barrier presence varies from none to nearly half of the Tennessee R6F length.
These observations along with the available Tennessee rural divided roadway characteristics will be combined with corresponding data from the other two state agency partners. This combined data will be used to select representative R4D, R4F, R6F, and R8F routes from all three state agency partners.
Iowa Rural Divided Roadways and Associated Characteristics
Table 51 summarizes the results of the classification of the available rural divided roadways in Iowa. In contrast to Washington and Tennessee, the mileage shown includes both directions of a given roadway; for example, a 1-mile length of east/west divided roadway would appear as 2 miles in Table 51, as there is 1-mile in each direction. As such, the total mileage shown is approximately double that reported in Table 3 for the Iowa rural divided category. Similar to the other states, the vast majority of the available sections are R4D and R4F and there are a very limited number of R8F sections. Given that there is less than one mile of Iowa R8F available, the research team will not select an R8F route from Iowa.
Table 51. Available Iowa Rural Divided Roadway Segments
| Rural Divided Roadway Type | Total Length [mi] | Unique Routes |
|---|---|---|
| R4D | 1441.7 | 52 |
| R4F | 1332.7 | 17 |
| R6F | 93.0 | 16 |
| R8F | 1.63 | 5 |
As the R4F, and R6F subtypes in Iowa have less than 20 unique routes available, all of the available routes were examined for these subtypes. The 20 longest R4D routes were examined in more detail. Figure 18 summarizes the top 20 R4D roadways in Iowa ranked by total R4D length available. The available segment data was processed to combine adjacent R4D segments from the same route to determine the number of contiguous segments for each route. Note that approximately 63% (33 of 52 routes) have 10 miles or less total R4D length available (not shown in Figure 18).

Table 52 and Table 53 present information on the secondary variables (see Table 2) for the top 20 R4D routes shown in Figure 18. Table 52 summarizes the operational characteristics while Table 53 summarizes the geometric characteristics. For each route, the range of AADT, the range of large truck percentage, and the range of posted speed limit are shown in Table 52.
Table 52. Operational Characteristics of the Top 20 Rural Divided Multilane (R4D) Routes in Iowa
| Route Designation | AADT [veh/day] | Posted Speed Limit [mph] | Truck Percentage [%] | |||
|---|---|---|---|---|---|---|
| Minimum | Maximum | Minimum | Maximum | Minimum | Maximum | |
| 20 | 1,970 | 20,900 | 55 | 65 | 3.2 | 34.9 |
| 218 | 5,500 | 23,900 | 25 | 65 | 11.0 | 33.1 |
| 61 | 4,890 | 16,600 | 45 | 65 | 8.0 | 23.4 |
| 30 | 3,290 | 17,300 | 45 | 65 | 7.1 | 22.5 |
| 34 | 1,400 | 11,900 | 35 | 65 | 7.9 | 26.4 |
| 60 | 3,000 | 6,600 | 35 | 55 | 18.7 | 33.1 |
| 151 | 4,950 | 15,700 | 55 | 65 | 10.9 | 27.0 |
| 63 | 2,450 | 12,500 | 40 | 65 | 5.9 | 33.6 |
| 163 | 5,800 | 15,000 | 55 | 65 | 12.0 | 23.6 |
| 5 | 5,500 | 11,600 | 35 | 65 | 6.5 | 12.0 |
| 330 | 4,740 | 8,900 | 55 | 65 | 8.5 | 15.6 |
| 18 | 2,890 | 11,700 | 35 | 65 | 11.0 | 32.9 |
| Route Designation | AADT [veh/day] | Posted Speed Limit [mph] | Truck Percentage [%] | |||
|---|---|---|---|---|---|---|
| Minimum | Maximum | Minimum | Maximum | Minimum | Maximum | |
| 65 | 1,070 | 21,400 | 30 | 65 | 3.4 | 29.2 |
| 141 | 7,300 | 18,200 | 55 | 65 | 5.3 | 7.8 |
| 75 | 6,000 | 16,600 | 45 | 65 | 14.5 | 26.5 |
| 27 | 4,780 | 6,100 | 30 | 55 | 30.3 | 35.9 |
| 71 | 2,400 | 10,200 | 55 | 65 | 6.7 | 18.1 |
| 6 | 880 | 19,400 | 35 | 55 | 3.1 | 20.7 |
| 13 | 5,800 | 8,200 | 55 | 65 | 8.0 | 11.2 |
| 2 | 930 | 9,600 | 50 | 55 | 11.6 | 29.9 |
Geometric characteristics shown in Table 53 include lane width, outside shoulder width, median width, as well as percentage of positive median barrier and rumble strips present. The shoulder width data in Table 53 considers the outside shoulder width for both directions of the divided roadway. As the minimum shoulder width exceeded zero, minimum shoulder width was included in Table 53. The minimum and mean lane widths are reported based on a combination of the pavement width information and number of lanes present in the roadway table. The minimum and maximum median widths are reported for each route and, similar to Washington State, the median width variable in Iowa includes the left/inside shoulder widths. Positive barrier presence was determined using the median type variable, which indicates hard or grass surface and whether or not a barrier is present. For each route, the total length of sections with positive barrier were divided by the corresponding total R4D length for that route, as shown in Figure 18. The Iowa roadway data includes both right and left shoulder rumble strip data. The approximate rumble strip presence proportions in Table 53 do reflect the proportion of R4D length for each route that has shoulder rumble strips present. This percentage was computed by dividing the total shoulder rumble strip length for each route by the corresponding total shoulder edge length available—twice the R4D length reported in Figure 18 for the same route.
Table 53. Geometric Characteristics of the Top 20 Rural Divided Multilane (R4D) Routes in Iowa
| Route Designation | Min / Mean Lane Width [ft] | Min / Mean / Max Outside Shoulder Width [ft] | Min / Max Median Width [ft] | Median Barrier Presence [%] | Approximate Rumble Strip Presence [%] |
|---|---|---|---|---|---|
| 20 | 9 / 12.7 | 6 / 9.1 / 10 | 4 / 82 | 0.1 | 38.7 |
| 218 | 8 / 12.2 | 3 / 9.8 / 41 | 34 / 134 | 0.0 | 24.3 |
| 61 | 12 / 12.1 | 0 / 9.9 / 12 | 4 / 150 | 0.0 | 70.5 |
| 30 | 9 / 12.0 | 0 / 9.9 / 12 | 2 / 130 | 0.8 | 8.3 |
| 34 | 9 / 12.2 | 3 / 9.8 / 10 | 1 / 100 | 6.1 | 45.3 |
| 60 | 12 / 12.5 | 10 / 10.0 / 10 | 56 / 100 | 0.0 | 70.6 |
| 151 | 12 / 12.0 | 0 / 9.6 / 10 | 34 / 116 | 0.0 | 52.3 |
| 63 | 10 / 12.3 | 0 / 9.1 / 12 | 4 / 128 | 0.0 | 3.1 |
| 163 | 12 / 12.1 | 6 / 9.9 / 10 | 37 / 94 | 0.0 | 0.0 |
| 5 | 12 / 12.2 | 3 / 9.0 / 10 | 5 / 162 | 0.0 | 25.3 |
| 330 | 12 / 12.1 | 6 / 9.8 / 10 | 52 / 194 | 0.0 | 66.3 |
| 18 | 9.5 / 11.7 | 6 / 9.8 / 10 | 4 / 100 | 0.0 | 14.1 |
| 65 | 9 / 11.9 | 4 / 9.5 / 10 | 5 / 118 | 0.0 | 66.9 |
| 141 | 12 / 12.2 | 10 / 10.4 / 20 | 30 / 91 | 0.0 | 0.0 |
| 75 | 12 / 12.1 | 10 / 10.0 / 10 | 10 / 68 | 0.0 | 11.6 |
| Route Designation | Min / Mean Lane Width [ft] | Min / Mean / Max Outside Shoulder Width [ft] | Min / Max Median Width [ft] | Median Barrier Presence [%] | Approximate Rumble Strip Presence [%] |
|---|---|---|---|---|---|
| 27 | 12 / 12.4 | 10 / 10.0 / 10 | 68 / 68 | 2.0 | 39.8 |
| 71 | 12 / 12.4 | 6 / 9.8 / 10 | 25 / 70 | 0.0 | 0.0 |
| 6 | 9 / 12.0 | 0 / 9.6 / 10 | 2 / 68 | 0.0 | 0.0 |
| 13 | 10 / 12.0 | 3 / 9.9 / 10 | 12 / 120 | 0.0 | 0.0 |
| 2 | 8 / 11.4 | 0 / 8.7 / 11 | 2 / 40 | 0.0 | 35.2 |
Figure 19 summarizes the 17 available R4F roadways in Iowa ranked by total R4F length available. The available segment data was processed to combine adjacent R4F segments from the same route to determine the number of contiguous segments for each route. Table 54 and Table 55 present information on the secondary variables (see Table 2) for 15 of the 17 available R4F routes shown in Figure 16. Since SR 77 and SR 92 had a tenth of a mile of R4F length or less, these routes were excluded from further consideration.
For each route, the range of AADT, the range of large truck percentage, and the range of posted speed limit is shown in Table 54. Geometric characteristics shown in Table 55 include lane width, outside shoulder width, median width, as well as percentage of positive median barrier and rumble strips present. The shoulder width data in Table 55 considers the outside shoulder width for both directions of the divided roadway. As the minimum shoulder width exceeded zero, minimum shoulder width was included in Table 55. The minimum and mean lane widths are reported based on a combination of the pavement width information and number of lanes present in the roadway table. The minimum and maximum median widths are reported for each route and, similar to Washington State, the median width variable in Iowa includes the left/inside shoulder widths. Positive barrier presence was determined using the median type variable, which indicates hard or grass surface and whether or not a barrier is present. For each route, the total length of sections with positive barrier were divided by the corresponding total R4F length for that route, as shown in Figure 19. The Iowa roadway data includes both right and left shoulder rumble strip data. The approximate rumble strip presence proportions in Table 55 reflect the proportion of R4F length for each route that has shoulder rumble strips present. This percentage was computed by dividing the total shoulder rumble strip length for each route by the corresponding total shoulder edge length available—twice the R4F length reported in Figure 19 for the same route.

Table 54. Operational Characteristics of the Rural Divided Freeway (R4F) Routes in Iowa
| Route Designation | AADT [veh/day] | Posted Speed Limit [mph] | Truck Percentage [%] | |||
|---|---|---|---|---|---|---|
| Minimum | Maximum | Minimum | Maximum | Minimum | Maximum | |
| 80 | 19,300 | 42,400 | 65 | 70 | 21.5 | 39.1 |
| 35 | 1,080 | 49,100 | 65 | 70 | 15.5 | 37.5 |
| 29 | 5,300 | 28,900 | 65 | 70 | 17.2 | 34.1 |
| 20 | 6,300 | 14,300 | 65 | 65 | 14.2 | 27.7 |
| 380 | 8,200 | 53,600 | 65 | 70 | 15.6 | 24.2 |
| 18 | 3,670 | 12,200 | 55 | 65 | 17.6 | 40.2 |
| 680 | 6,200 | 17,500 | 65 | 70 | 12.4 | 28.4 |
| 218 | 6,900 | 23,900 | 65 | 65 | 11.1 | 42.3 |
| 61 | 8,000 | 27,000 | 65 | 65 | 9.7 | 20.2 |
| 30 | 1,060 | 17,400 | 55 | 65 | 8.8 | 26.3 |
| 163 | 7,800 | 10,800 | 65 | 65 | 13.7 | 16.5 |
| 34 | 3,080 | 10,500 | 55 | 65 | 22.9 | 26.9 |
| 5 | 3,930 | 6,800 | 65 | 65 | 13.3 | 17.6 |
| 151 | 7,400 | 9,400 | 55 | 55 | 13.7 | 18.2 |
| 63 | 3,040 | 3,810 | 65 | 65 | 24.6 | 34.7 |
Table 55. Geometric Characteristics of the Rural Divided Freeway (R4F) Routes in Iowa
| Route Designation | Min / Mean Lane Width [ft] | Min / Mean / Max Outside Shoulder Width [ft] | Min / Max Median Width [ft] | Median Barrier Presence [%] | Approximate Rumble Strip Presence [%] |
|---|---|---|---|---|---|
| 80 | 12 / 12.1 | 6 / 9.9 / 11 | 44 / 225 | 56.2 | 96.9 |
| 35 | 12 / 12.1 | 6 / 9.8 / 12 | 30 / 552 | 3.5 | 88.7 |
| 29 | 12 / 12.1 | 10 / 10.0 / 12 | 30 / 392 | 0.0 | 100 |
| 20 | 12 / 12.4 | 6 / 9.6 / 10 | 16 / 68 | 0.7 | 43.6 |
| 380 | 12 / 12.0 | 10 / 10.0 / 10 | 60 / 64 | 15.3 | 98.9 |
| 18 | 12 / 12.0 | 6 / 9.6 / 10 | 56 / 68 | 0.0 | 50.6 |
| 680 | 12 / 12.0 | 10 / 10.0 / 10 | 38 / 73 | 0.0 | 100 |
| 218 | 12 / 12.4 | 6 / 9.8 / 10 | 52 / 68 | 0.0 | 15.7 |
| 61 | 12 / 12.0 | 10 / 10.0 / 10 | 32 / 150 | 0.0 | 18.8 |
| 30 | 10 / 12.2 | 10 / 10.0 / 10 | 6 / 64 | 0.0 | 0 |
| 163 | 12 / 12.0 | 10 / 10.0 / 10 | 50 / 68 | 0.0 | 0 |
| 34 | 8 / 11.2 | 6 / 9.7 / 10 | 68 / 78 | 0.0 | 50.0 |
| 5 | 12 / 12.0 | 8 / 8.0 / 8 | 64 / 64 | 0.0 | 100 |
| 151 | 12 / 12.0 | 10 / 10.0 / 10 | 68 / 68 | 0.0 | 100 |
| 63 | 12 / 12.0 | 10 / 10.0 / 10 | 68 / 68 | 0.0 | 49.9 |
Figure 20 summarizes the 16 available R6F roadways in Iowa ranked by total R6F length available. The available segment data was processed to combine adjacent R6F segments from the same route to determine the number of contiguous segments for each route. Table 56 and Table 57 present information on the secondary variables (see Table 2) for 12 of the 16 available R6F routes shown in Figure 20. Since SR 92, SR 5, SR 34, and SR 63 have relatively few R6F segments and 0.5 miles or less of R6F length, these routes were excluded from further consideration. For each route, the range of AADT, the range of large truck percentage, and the range of posted speed limit are shown in Table 56.
Geometric characteristics shown in Table 57 include lane width, outside shoulder width, median width, as well as percentage of positive median barrier and rumble strips present. The shoulder width data in Table 57 considers the outside shoulder width for both directions of the divided roadway. As the minimum shoulder width exceeded zero, minimum shoulder width was included in Table 57. The minimum and mean lane widths are reported based on a combination of the pavement width information and number of lanes present in the roadway table. The minimum and maximum median widths are reported for each route and, similar to Washington State, the median width variable in Iowa includes the left/inside shoulder widths. Positive barrier presence was determined using the median type variable, which indicates hard or grass surface and whether or not a barrier is present. For each route, the total length of sections with positive barrier were divided by the corresponding total R6F length for that route, as shown in Figure 20. The Iowa roadway data includes both right and left shoulder rumble strip data. The approximate rumble strip presence proportions in Table 57 reflect the proportion of R6F length for each route that has shoulder rumble strips present. This percentage was computed by dividing the total shoulder rumble strip length for each route by the corresponding total shoulder edge length available—twice the R6F length reported in Figure 20 for the same route.

Table 56. Operational Characteristics of the Rural Divided Freeway (R6F) Routes in Iowa
| Route Designation | AADT [veh/day] | Posted Speed Limit [mph] | Truck Percentage [%] | |||
|---|---|---|---|---|---|---|
| Minimum | Maximum | Minimum | Maximum | Minimum | Maximum | |
| 80 | 19,300 | 42,400 | 65 | 70 | 22.4 | 39.1 |
| 35 | 12,600 | 49,100 | 65 | 70 | 14.7 | 37.5 |
| 29 | 3,590 | 28,900 | 65 | 70 | 12.5 | 34.1 |
| 20 | 6,500 | 21,300 | 65 | 65 | 13.4 | 27.7 |
| 18 | 3,270 | 12,200 | 55 | 65 | 17.6 | 41.3 |
| 380 | 14,700 | 29,500 | 65 | 70 | 17.2 | 24.2 |
| 680 | 1,650 | 24,800 | 65 | 70 | 12.4 | 35.0 |
| 30 | 5,300 | 17,400 | 55 | 65 | 9.2 | 19.4 |
| 61 | 9,000 | 27,000 | 65 | 65 | 9.7 | 20.2 |
| 218 | 7,200 | 22,100 | 65 | 65 | 11.5 | 26.9 |
| 163 | 7,800 | 10,800 | 65 | 65 | 13.7 | 16.4 |
| 151 | 7,400 | 9,400 | 55 | 55 | 13.1 | 18.2 |
Table 57. Geometric Characteristics of the Rural Divided Freeway (R6F) Routes in Iowa
| Route Designation | Min / Mean Lane Width [ft] | Min / Mean / Max Outside Shoulder Width [ft] | Min / Max Median Width [ft] | Median Barrier Presence [%] | Approximate Rumble Strip Presence [%] |
|---|---|---|---|---|---|
| 80 | 10 / 11.6 | 6 / 9.6 / 12 | 40 / 225 | 62.5 | 89.1 |
| 35 | 8 / 11.0 | 6 / 9.7 / 12 | 34 / 551 | 2.3 | 90.3 |
| 29 | 10 / 11.1 | 10 / 10.0 / 10 | 38 / 380 | 0.0 | 100.0 |
| 20 | 10 / 13.4 | 6 / 9.0 / 10 | 50 / 68 | 0.0 | 36.8 |
| 18 | 10 / 14.0 | 6 / 8.8 / 10 | 56 / 68 | 0.0 | 48.9 |
| 380 | 11.3 / 12.0 | 10 / 10.0 / 10 | 64 / 64 | 0.0 | 100.0 |
| 680 | 11.3 / 11.7 | 10 / 10.0 / 10 | 38 / 73 | 0.0 | 100.0 |
| 30 | 10 / 13.6 | 6 / 8.0 / 10 | 48 / 64 | 0.0 | 0.0 |
| 61 | 8 / 12.4 | 10 / 10.0 / 10 | 52 / 64 | 0.0 | 21.3 |
| 218 | 11.3 / 14.2 | 8 / 8.8 / 10 | 64 / 68 | 0.0 | 23.6 |
| 163 | 11 / 12.7 | 8 / 9.1 / 10 | 50 / 68 | 0.0 | 0.0 |
| 151 | 10 / 14.5 | 10 / 10.0 / 10 | 68 / 68 | 0.0 | 99.7 |
Based on the data from the available R4D segments in Iowa, the following observations were made:
- Compared to the RU2L2W roadways in Iowa, there are fewer unique routes classified as R4D.
- The routes with the largest traffic volume variation are SR 65 followed by SR 20 and SR 6. All three have a maximum daily traffic volume of approximately 20,000 vehicles per day. In general, the minimum and maximum traffic volumes are similar to the Washington and Tennessee R4D roadways.
- The Iowa R4D routes have a similar variation in posted speed limit to the R4D routes in Tennessee.
- Similar to the Washington State and Tennessee R4D routes, most of the Iowa R4D routes have maximum truck traffic percentage between 10% and 30%.
- Compared to the Washington and Tennessee R4D routes, the minimum lane width has more variation present.
- SR 218 and SR 141 have the largest variation in outside shoulder width.
- Most of the Iowa R4D routes have a varied median width. Routes with the largest median width variation are SR 5, SR 61, and SR 330.
- Positive median barriers are scarce along the Iowa R4D routes with all routes having 10% or less positive median barrier presence.
- Most of the routes have 50% or less presence of rumble strips.
- SR 30, the fourth longest available Iowa R4D route available, was already selected to be included in the study as the RU2L2W route, so the analogous R4D sections of SR 30 could be included as well. SR 18 (4U/5T) and SR 6 (2U/3T) were previously selected and have relatively large R4D classified portions that could be included.
Based on the data from the available R4F segments in Iowa, the following observations were made:
- Similar to the other two states, there are many fewer unique routes classified as R4F compared to other road types. The total R4F length is similar between Iowa and Tennessee.
- The minimum and maximum traffic volumes for the R4F routes (on average) are higher than those for the Iowa R4D routes. In general, the rural divided traffic volumes for Iowa are the lowest of the three states.
- The routes with the largest traffic volume variation are I-35 followed by I-380. Both have a maximum daily traffic volume of approximately 50,000 vehicles per day.
- The available R4F routes have very little variation in posted speed limit and a maximum posted speed limit of 65 or 70 mph.
- The majority of the R4F routes have maximum truck traffic percentage above 25%.
- Similar to the Washington and Tennessee R4F routes, there is little variation in Iowa R4F lane width.
- More than half of the routes available have a consistent 10 foot wide outside shoulder. For routes with variation in outside shoulder, the variation is generally between 6 and 10 feet.
- Although a few Iowa R4F routes have large median width variation, the average median width variation is approximately the same between the Iowa R4D and R4F routes.
- Compared to the Iowa R4D routes, there is a larger presence of median barrier on R4F routes but, with the exception of I-80, there is relatively little median barrier present.
- The majority of the Iowa R4F routes have more than 50% presence of rumble strips.
Based on the data from the available R6F segments in Iowa, the following observations were made:
- The minimum and maximum traffic volumes for the Iowa R6F routes (on average) are higher than those for the R4D and R4F routes. Similar to Tennessee, there is a relatively small difference between the R6F and R4F traffic volumes.
- The R6F sections of I-35 and I-29 routes have the largest variation in traffic with maximum traffic volume between 30,000 and 50,000 vehicles per day.
- Similar to the R6F routes in the other states, there is very little variation in posted speed limit.
- Truck traffic percentage generally varies between 10% and 30% for the available R6F routes.
- Compared to the Iowa R4D and R4F routes, the Iowa R6F routes have more lane width variation.
- All of the Iowa R6F routes have a mean outside shoulder width between 8 and 10 feet and five of the routes have a consistent 10 foot outside shoulder width.
- The Iowa R6F routes on average have similar median width variation to the Iowa R4F routes.
- Approximately half of the Iowa R6F routes have 90% or more rumble strip coverage.
- Positive median barrier presence on the R6F routes is minimal to none with the exception of I-80.
These observations along with the available Iowa rural divided roadway characteristics will be combined with corresponding data from the other two state agency partners. This combined data will be used to select representative R4D, R4F, R6F, and R8F routes from all three state agency partners.
Rural Divided Roadway Selection
Rural 4-lane divided multilane highway (R4D)
The available R4D roadway characteristics (e.g. secondary variables from Table 2) from each state agency partner combined with the general observations were considered to select representative R4D routes from each state. The selected R4D routes are shown in Table 58. Note that the routes denoted with an asterisk (*) indicate that particular route has portions classified as R4D but has been selected to represent a different roadway type category.
Table 58. Selected R4D Routes and Associated Characteristics
| State | Route | Length [mi] | Max AADT [vpd] / Truck Percent [%] | Min / Max Speed Limit [mph] | Mean/Max Shoulder Width [ft] | Min / Max Median Width [ft] | Barrier / Rumble Presence [%] |
|---|---|---|---|---|---|---|---|
| WA | SR 8 | 19.5 | 17,892 / 9.1 | 60 / 60 | 9.8 / 10 | 32 / 120 | 80.6 / 0 |
| SR 101 | 15.7 | 28,029 / 10.1 | 25 / 60 | 8.9 / 11 | 4 / 44 | 62.6 / 78 | |
| SR 2* | 32.1 | 23,017 / 15.7 | 30 / 60 | 8.4 / 20 | 4 / 400 | 23.7 / 79 | |
| TN | SR 34 | 32.2 | 23,460 / 16 | 45 / 65 | 9.4 / 12 | 4 / 100 | 0.4 / 48 |
| SR 15* | 150.3 | 23,260 / 52 | 30 / 70 | 10.4 / 12 | 4 / 55 | 3.1 / 82 | |
| SR 1* | 75.9 | 18,740 / 24 | 30 / 65 | 9.7 / 14 | 2 / 52 | 1.5 / 81 | |
| SR 33* | 18.4 | 15,080 / 25 | 40 / 55 | 10.1 / 12 | 2 / 44 | 3.2 / 51 | |
| IA | SR 218 | 154.4 | 23,900 / 33.1 | 25 / 65 | 9.8 / 41 | 34 / 134 | 0 / 24.3 |
| SR 30* | 142.4 | 17,300 / 22.5 | 45 / 65 | 9.9 / 12 | 2 / 130 | 0.8 / 8.3 | |
| SR 18* | 31.7 | 11,700 / 32.9 | 35 / 65 | 9.8 / 10 | 4 / 100 | 0 / 14.1 | |
| SR 6* | 13.3 | 19,400 / 20.7 | 35 / 55 | 9.6 / 10 | 2 / 68 | 0 / 0 |
*Note: Denotes route selected based on a different roadway type category
SR 2, the longest R4D route in Washington and already selected as the representative RU2L2W route, has a relatively large traffic volume, posted speed limit, and median width variation. Given the relatively short length of R4D in Washington State, two additional routes were selected to represent R4D roadways: SR 101 and SR 8. SR 101 is the third longest Washington R4D route and has the largest traffic variation, more median barrier than SR 2, and a wide variation in posted speed limit. SR 8 is the second longest Washington R4D route, has a significant length of median barrier, and no rumble strips present. In Tennessee, the two longest R4D routes, SR 15 (RUMLH) and SR 1 (2U/3T), were previously selected to represent other roadway types. Both R4D portions of these routes have a relatively wide variation in traffic volume and posted speed limit. Median width, median barrier presence, and rumble strip presence, however, were similar
between the two routes. Tennessee SR 33, already selected as a RUMLH route, has similar median width and outside shoulder width to SR 1 and SR 15 but offers a smaller proportion of rumble strips than the other two routes. Tennessee SR 34 was selected as an additional R4D route given its reasonable length, wide variation in traffic volume as well as reduced heavy vehicle percentage and larger median width variation compared to the other three Tennessee R4D routes. In Iowa, SR 30 (RU2L2W), SR 18 (4U/5T), and SR 6 (2U/3T) were previously selected to represent other roadway types and are ranked fourth, twelfth, and eighteenth, respectively based on R4D length. All have maximum traffic volumes less than 20,000 vehicles per day, a reasonable range of posted speed limit, similar shoulder widths, and relatively little rumble strips. SR 218 was selected as the representative R4D route given its relatively long length, higher maximum traffic volume, wider median, and more rumble strip presence compared to SR 30, SR 18, and SR 6.
Rural 4-lane divided freeway (R4F)
The available R4F roadway characteristics (secondary variables from Table 2) from each state agency partner combined with the general observations were considered to select representative R4F routes from each state. The selected R4F routes are shown in Table 59. Note that the routes denoted with an asterisk (*) indicate the route has portions classified as R4F but has been selected to represent a different roadway type category.
Table 59. Selected R4F Routes and Associated Characteristics
| State | Route | Length [mi] | Max AADT [vpd] / Truck Percent [%] | Min / Max Speed Limit [mph] | Mean/Max Shoulder Width [ft] | Min / Max Median Width [ft] | Barrier / Rumble Presence [%] |
|---|---|---|---|---|---|---|---|
| WA | I - 90 | 203.6 | 33,202 / 23.7 | 65 / 70 | 9.3 / 10 | 4 / 450 | 34.4 / UNK |
| SR 2* | 1.6 | 78,176 / 8.8 | 50 / 55 | 3.8 / 10 | 15 / 50 | 9.7 / 79 | |
| TN | I - 40 | 228.7 | 71,310 / 48 | 55 / 70 | 10.7 / 20 | 2 / 500 | 35.5 / 57 |
| IA | I - 80 | 397.7 | 42,400 / 39.1 | 65 / 70 | 9.9 / 11 | 44 / 225 | 56.2 / 96.9 |
| SR 18* | 42.4 | 12,200 / 40.2 | 55 / 65 | 9.6 / 10 | 56 / 68 | 0 / 50.6 | |
| SR 218* | 24.2 | 23,900 / 42.3 | 65 / 65 | 9.8 / 10 | 52 / 68 | 0 / 15.7 | |
| SR 30* | 9.9 | 17,400 / 26.3 | 55 / 65 | 10 / 10 | 6 / 64 | 0 / 0 |
*Note: Denotes route selected based on a different roadway type category
Washington I-90 has by far the longest R4F length, has the third highest traffic volume variation, a high posted speed limit, and a wide variation in median width. Washington SR 2 was previously selected as a RU2L2W route that has a small portion classified as R4F. The R4F portion of SR 2 has the highest traffic volume variation, less median width variation, and lower posted speed limit compared to I-90. Similarly, I-40 in Tennessee has more than double the R4F length of any other Tennessee route available, provides a higher traffic volume than Washington I-90, and wider outside shoulders. In Iowa, SR 18 (4U/5T), SR 218 (R4D), and SR 30 (RU2L2W) were previously selected to represent other roadway types. These three routes have relatively modest traffic volume and maximum median widths less than 75 feet. Compared to these three routes, Iowa I-80 provides a larger variation in traffic, a wider median, and a significant proportion with median barrier present.
Rural 6-lane divided freeway (R6F)
The available R6F roadway characteristics (secondary variables from Table 2) from each state agency partner combined with the general observations were considered to select representative R6F routes from each state. The selected R6F routes are shown in Table 60. Note that the routes denoted with an asterisk (*) indicate the route has portions classified as R6F but has been selected to represent a different roadway type category.
Table 60. Selected R6F Routes and Associated Characteristics
| State | Route | Length [mi] | Max AADT [vpd] / Truck Percent [%] | Min / Max Speed Limit [mph] | Mean/Max Shoulder Width [ft] | Min / Max Median Width [ft] | Barrier / Rumble Presence [%] |
|---|---|---|---|---|---|---|---|
| WA | I - 5 | 57.6 | 128,331 / 38 | 60 / 70 | 9.3 / 22 | 15 / 540 | 67.9 / UNK |
| I – 90* | 14.4 | 69,067 / 0 | 65 / 70 | 7.9 / 17 | 20 / 440 | 65.6 / UNK | |
| TN | I - 24 | 4.4 | 69,790 / 42 | 55 / 70 | 11 / 12 | 28 / 90 | 2.5 / 100 |
| I – 40* | 16.0 | 76,810 / 47 | 65 / 70 | 10.4 / 16 | 2 / 176 | 44 / 97 | |
| IA | I - 35 | 25.5 | 49,100 / 37.5 | 65 / 70 | 9.7 / 12 | 34 / 551 | 0.6 / 46.1 |
| I – 80* | 27.4 | 42,400 / 39.1 | 65 / 70 | 9.6 / 12 | 40 / 225 | 17.1 / 48.8 |
*Note: Denotes route selected based on a different roadway type category
Washington I-5 is the only other R6F route available, as I-90 was selected as the representative R4F route. Washington I-5 has a maximum traffic volume in excess of 100,000 vehicles per day, barrier present on a significant portion, and a wide variation in median and outside shoulder width. Washington I-90 has less traffic volume, no truck traffic reported on the R6F portions, and similar variation in median and shoulder width as WA I-5. Tennessee I-40 is the longest R6F route and was previously selected as an R4F route. The traffic volume of TN I-40 is comparable to WA I-90 and the median width has less variation present. The only other Tennessee R6F route with more than 1 mile of length is I-24, so this was selected to further represent the R6F category. Compared to the other R6F routes, I-24 has some portions with a lower speed limit and generally less median barrier present. In Iowa, I-80 has the longest length of R6F classified roadway and this route was previously selected as a R4F route. The next longest R6F route, I-35, was selected as an additional R6F representative route. Both these routes have lower traffic volumes than the R6F routes from the other two states but similar posted speed limits and outside shoulder widths. Compared to the Tennessee R6F routes, the Iowa routes have a much lower rumble strip presence.
Rural 8-lane divided freeway (R8F)
Between the three partner states, there is only 2.15 miles of roadway classified as R8F, split between seven unique routes. The available data is not sufficient to support analysis of this roadway type subcategory.
Urban/Suburban Divided Roadway Characteristics
The urban/suburban divided roadways were examined in more detail. The five subtypes of urban/suburban divided roadway segments identified in the HSM (AASHTO, 2010) are listed
below. Note that the HSM does not currently include freeway segments (i.e., subtypes 2 through 5). Safety performance functions for these roadway types were developed under NCHRP Projec 17-45 (Bonneson et al., 2012).
- 4-lane divided arterials (U4D)
- 4-lane divided freeway (U4F)
- 6-lane divided freeway (U6F)
- 8-lane divided freeway (U8F)
- 10-lane divided freeway (U10F)
In addition to the urban classification and number of through lanes, all of the freeway segment subtypes (U4F, U6F, U8F, and U10F) have fully-restricted access control, while the U4D subtype does not. The roadway data from each state was used to determine the level of access control for each section to determine the urban/suburban divided roadway subtype. While the access control data for each state varied slightly, each state had a category identifying segments with full access control and only these segments were considered for the U4F, U6F, U8F, and U10F subtypes. The U4D routes could have any other access level control other than full access control.
For each urban/suburban divided subcategory, the range of roadway and traffic characteristics, e.g. from the secondary variables shown in Table 2, are then examined for the routes with the longest subcategory-classified length in each of the three states. Representative urban/suburban divided routes were then selected considering the associated roadway and traffic characteristics across all three states.
Washington Urban/Suburban Divided Roadways and Associated Characteristics
Table 61 summarizes the results of the classification of the available urban/suburban divided roadways in Washington State. The vast majority of the available length is U4F with sizable portions classified as U4D and U6F. Given the absence of U10F segment length available in Washington State, the research team proposes selecting an additional U10F route from Tennessee or Iowa, depending on availability.
Table 61. Available Washington State Urban/Suburban Divided Roadway Segments
| Urban Divided Roadway Type | Total Length [mi] | Unique Routes |
|---|---|---|
| U4D | 147.8 | 53 |
| U4F | 292.6 | 50 |
| U6F | 137.9 | 16 |
| U8F | 45.8 | 4 |
| U10F | 0 | N/A |
As the U6F and U8F subtypes in Washington have less than 20 unique routes available, all of the available routes were examined for these subtypes. For the U4D and U4F subtypes, the 20 longest routes were examined in more detail. Figure 21 summarizes the 20 longest available U4D roadways in Washington State ranked by total U4D length available. The available segment
data was processed to combine adjacent U4D segments from the same route to determine the number of contiguous segments for each route. The number of contiguous U4D segments for a given route is the left number shown in the Figure 21 data label. The maximum contiguous length for each route was tallied and the average contiguous length was computed by dividing the total U4D length by the number of contiguous segments for each route; these are the middle and right numbers in the Figure 21 data label, respectively. Note that approximately 80% (43 of 53 routes) have 5 miles or less total U4D length available (not shown in Figure 21).

Table 62 and Table 63 present information on the secondary variables (see Table 2) for the U4D routes shown in Figure 21. Table 62 summarizes the operational characteristics while Table 63 summarizes the geometric characteristics. For each route, the range of AADT, the range of large truck percentage, and the range of posted speed limit are shown in Table 62. Note that for state highways with no posted speed limit, Washington State legislation specifies a maximum speed of 60 mph [RCW, 46.61.400].
| Route Designation | AADT [veh/day] | Posted Speed Limit [mph] | Truck Percentage [%] | |||
|---|---|---|---|---|---|---|
| Minimum | Maximum | Minimum | Maximum | Minimum | Maximum | |
| 12 | 4,957 | 23,657 | 20 | 60 | 0 | 21 |
| 99 | 17,895 | 82,564 | 40 | 60 | 3 | 9 |
| 97 | 8,441 | 23,347 | 55 | 55 | 7 | 25 |
| 14 | 20,463 | 83,815 | 55 | 55 | 0 | 10 |
| 2 | 17,927 | 29,907 | 30 | 60 | 3 | 9 |
| 101 | 17,963 | 49,200 | 25 | 60 | 5 | 12 |
| 395 | 14,458 | 45,563 | 45 | 70 | 0 | 22 |
| 20 | 18,974 | 32,782 | 55 | 55 | 6 | 6 |
| 500 | 14,320 | 58,632 | 55 | 55 | 0 | 5 |
| 9 | 24,623 | 34,933 | . | . | 0 | 0 |
| 17 | 10,292 | 20,128 | . | . | 7 | 13 |
| 539 | 15,840 | 35,470 | 50 | 50 | 0 | 4 |
| 503 | 25,067 | 38,882 | . | . | 0 | 6 |
| 516 | 22,717 | 38,643 | . | . | 3 | 7 |
| 410 | 19,953 | 51,322 | 40 | 55 | 0 | 5 |
| 125 | 12,895 | 19,899 | . | . | 0 | 0 |
| 525 | 18,179 | 45,091 | 60 | 60 | 0 | 4 |
| 432 | 15,757 | 36,856 | 55 | 55 | 4 | 15 |
| 522 | 32,132 | 45,680 | 35 | 35 | 0 | 3 |
| 513 | 15,933 | 54,244 | . | . | 0 | 3 |
Geometric characteristics shown in Table 63 include lane width, outside shoulder width, median width, as well as percentage of positive median barrier and rumble strips present. The minimum and mean lane widths are reported. The shoulder width data in Table 63 considers the outside shoulder width for both directions of the divided roadway. In general, however, the outside shoulder widths were nearly identical in most cases. All routes had a minimum shoulder width of zero (not shown in Table 63) except for route 125, which had a 3 foot minimum shoulder width. The minimum and maximum median widths are reported for each route and, in Washington State, this width includes the inside/left shoulder widths. Positive barrier presence was determined from the median barrier type variable. Median barrier types included cable, guardrail, and NJ type barriers; only the depressed, unprotected, and curb categories were considered to have no positive barrier present. For each route, the total length of sections with positive barrier were divided by the corresponding total U4D length for that route, as shown in Figure 21. Rumble strip presence data is not available in the HSIS roadway inventory data but Washington State maintains this data separately. For each of the routes, the proportion of route length with any rumble strips present was computed using this separate dataset. Note that this data is based on the entire length of the roadway and not necessarily specific to the U4D portions of the route. Nonetheless, the data provides a general indication of whether or not any rumble strips are present along a particular route. The available rumble strip data (not included in Table 63) also indicates the location of the rumble strips: centerline only, shoulders only, or both centerline and shoulder locations. Once specific routes have been selected, the exact details on the rumble strips will be merged into the corresponding HSIS roadway inventory data.
| Route Designation | Min / Mean Lane Width [ft] | Mean / Max Outside Shoulder Width [ft] | Min / Max Median Width [ft] | Median Barrier Presence [%] | Approximate Rumble Strip Presence [%] |
|---|---|---|---|---|---|
| 12 | 11 / 12.4 | 7.8 / 20 | 5 / 110 | 57.7 | 78 |
| 99 | 11 / 12.6 | 0.0 / 4 | 4 / 24 | 14.9 | 0 |
| 97 | 12 / 12.1 | 9.8 / 10 | 16 / 40 | 72.5 | 82 |
| 14 | 12 / 12.2 | 9.6 / 10 | 2 / 16 | 99.1 | 77 |
| 2 | 12 / 13.3 | 7.3 / 10 | 2 / 60 | 52.7 | 79 |
| 101 | 12 / 12.7 | 7.7 / 12 | 4 / 44 | 43.9 | 78 |
| 395 | 12 / 13.0 | 5.0 / 10 | 6 / 75 | 35.3 | 50 |
| 20 | 12 / 12.9 | 8.3 / 10 | 6 / 60 | 24.2 | 28 |
| 500 | 11 / 12.8 | 7.3 / 10 | 6 / 40 | 71.5 | 0 |
| 9 | 12 / 12.0 | 7.7 / 10 | 1 / 18 | 35.0 | 85 |
| 17 | 12 / 12.1 | 8.8 / 10 | 12 / 22 | 73.0 | 55 |
| 539 | 12 / 12.5 | 7.2 / 10 | 1 / 12 | 72.8 | 26 |
| 503 | 12 / 13.6 | 2.4 / 22 | 1 / 13 | 8.3 | 56 |
| 516 | 11 / 12.3 | 5.1 / 15 | 4 / 16 | 62.8 | 0 |
| 410 | 11 / 12.3 | 4.6 / 10 | 8 / 14 | 76.8 | 58 |
| 125 | 12 / 12.2 | 9.2 / 10 | 16 / 16 | 63.6 | 0 |
| 525 | 12 / 12.1 | 0.2 / 6 | 12 / 12 | 0.0 | 58 |
| 432 | 12 / 13.3 | 7.4 / 10 | 15 / 16 | 81.7 | 70 |
| 522 | 12 / 13.0 | 0.6 / 8 | 2 / 12 | 7.6 | 29 |
| 513 | 11 / 12.6 | 1.3 / 4 | 10 / 25 | 0.0 | 0 |
Figure 22 summarizes the 20 longest available U4F roadways in Washington State ranked by total U4F length available. The available segment data was processed to combine adjacent U4F segments from the same route to determine the number of contiguous segments for each route. Note that approximately 60% (32 of 50 routes) have 5 miles or less total U4F length available (not shown in Figure 22).
Table 64 and Table 65 present information on the secondary variables (see Table 2) for the U4F routes shown in Figure 22. Table 64 summarizes the operational characteristics while Table 65 summarizes the geometric characteristics. For each route, the range of AADT, the range of large truck percentage, and the range of posted speed limit are shown in Table 64.
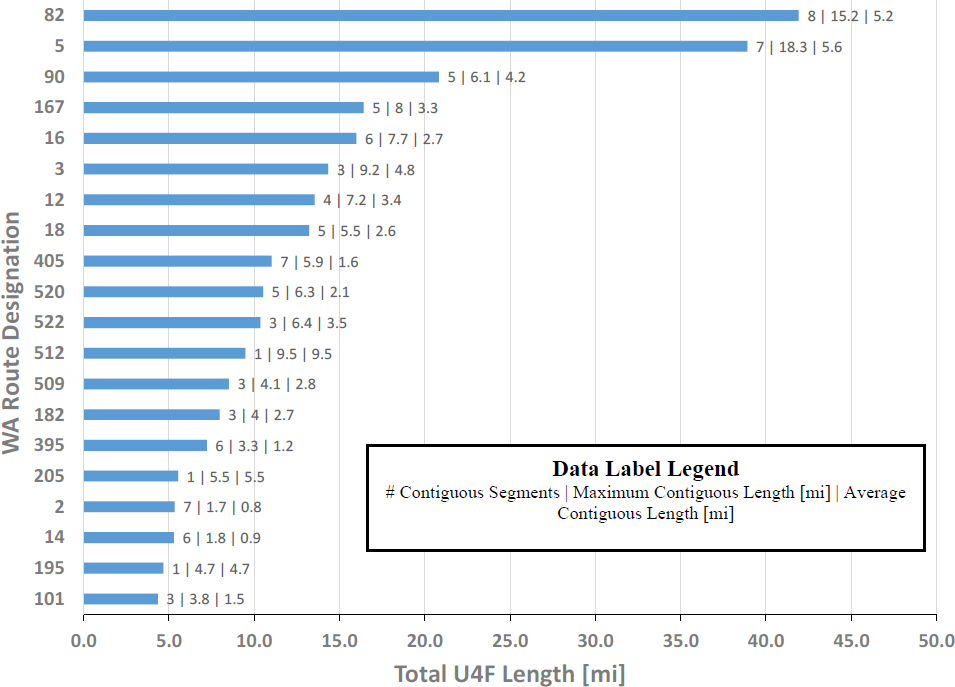
| Route Designation | AADT [veh/day] | Posted Speed Limit [mph] | Truck Percentage [%] | |||
|---|---|---|---|---|---|---|
| Minimum | Maximum | Minimum | Maximum | Minimum | Maximum | |
| 82 | 8,621 | 49,709 | 60 | 70 | 0 | 20 |
| 5 | 6,802 | 124,494 | 25 | 70 | 0 | 34 |
| 90 | 0 | 75,257 | 30 | 70 | 0 | 20 |
| 167 | 28,637 | 126,235 | 30 | 60 | 0 | 20 |
| 16 | 34,598 | 99,471 | 60 | 60 | 0 | 5 |
| 3 | 28,832 | 77,936 | 40 | 60 | 5 | 6 |
| 12 | 12,229 | 38,565 | 20 | 60 | 0 | 21 |
| 18 | 25,982 | 98,829 | 60 | 60 | 0 | 11 |
| 405 | 0 | 177,354 | 60 | 60 | 0 | 5 |
| 520 | 0 | 108,530 | 60 | 60 | 0 | 4 |
| 522 | 17,718 | 93,453 | 35 | 60 | 0 | 7 |
| 512 | 60,009 | 94,746 | 60 | 60 | 0 | 7 |
| 509 | 23,902 | 66,804 | 50 | 50 | 0 | 13 |
| 182 | 18,548 | 61,998 | 60 | 70 | 0 | 14 |
| 395 | 7,367 | 63,082 | 45 | 70 | 0 | 31 |
| 205 | 38,768 | 81,817 | 60 | 60 | 0 | 0 |
| 2 | 18,895 | 78,176 | 50 | 60 | 0 | 11 |
| Route Designation | AADT [veh/day] | Posted Speed Limit [mph] | Truck Percentage [%] | |||
|---|---|---|---|---|---|---|
| Minimum | Maximum | Minimum | Maximum | Minimum | Maximum | |
| 14 | 17,269 | 83,815 | 55 | 55 | 0 | 5 |
| 195 | 13,519 | 21,328 | 55 | 60 | 7 | 14 |
| 101 | 25,670 | 99,003 | 55 | 60 | 5 | 8 |
Geometric characteristics shown in Table 65 include lane width, outside shoulder width, median width, as well as percentage of positive median barrier and rumble strips present. The minimum and mean lane widths are reported. The shoulder width data in Table 65 considers the outside shoulder width for both directions of the divided roadway. In general, however, the outside shoulder widths were nearly identical in most cases. All routes had a minimum shoulder width of zero (not shown in Table 65) except for route 195, which had a 10 foot minimum shoulder width. The minimum and maximum median widths are reported for each route and, in Washington State, this width includes the inside/left shoulder widths.
Positive barrier presence was determined from the median barrier type variable. Median barrier types included cable, guardrail, and NJ type barriers; only the depressed, unprotected, and curb categories were considered to have no positive barrier present. For each route, the total length of sections with positive barrier were divided by the corresponding total U4F length for that route, as shown in Figure 22. Rumble strip presence data is not available in the HSIS roadway inventory data but Washington State maintains this data separately. For each of the routes, the proportion of route length with any rumble strips present was computed using this separate dataset. Note that this data is based on the entire length of the roadway and not necessarily specific to the U4F portions of the route. Nonetheless, the data provides a general indication of whether or not any rumble strips are present along a particular route. The available rumble strip data (not included in Table 65) also indicates the location of the rumble strips: centerline only, shoulders only, or both centerline and shoulder locations. Once specific routes have been selected, the exact details on the rumble strips will be merged into the corresponding HSIS roadway inventory data.
| Route Designation | Min / Mean Lane Width [ft] | Mean / Max Outside Shoulder Width [ft] | Min / Max Median Width [ft] | Median Barrier Presence [%] | Approximate Rumble Strip Presence [%] |
|---|---|---|---|---|---|
| 82 | 12 / 12.7 | 9.1 / 11 | 2 / 200 | 28.2 | * |
| 5 | 12 / 12.6 | 8.8 / 10 | 5 / 100 | 84.8 | * |
| 90 | 12 / 12.8 | 8.8 / 10 | 12 / 76 | 65.2 | * |
| 167 | 12 / 13.3 | 8.5 / 12 | 16 / 88 | 85.6 | 0 |
| 16 | 12 / 13.2 | 8.4 / 10 | 2 / 500 | 65.0 | 0 |
| 3 | 12 / 12.5 | 9.2 / 10 | 4 / 68 | 92.4 | 67 |
| 12 | 12 / 12.5 | 9.1 / 10 | 38 / 60 | 70.1 | 79 |
| 18 | 11 / 13.4 | 8.0 / 10 | 6 / 48 | 77.3 | 13 |
| 405 | 12 / 13.5 | 7.6 / 21 | 1 / 300 | 92.9 | * |
| 520 | 12 / 12.4 | 6.9 / 24 | 4 / 157 | 96.8 | 0 |
| 522 | 12 / 12.6 | 8.7 / 10 | 4 / 50 | 76.7 | 29 |
| 512 | 12 / 13.0 | 8.8 / 12 | 16 / 65 | 94.8 | 0 |
| Route Designation | Min / Mean Lane Width [ft] | Mean / Max Outside Shoulder Width [ft] | Min / Max Median Width [ft] | Median Barrier Presence [%] | Approximate Rumble Strip Presence [%] |
|---|---|---|---|---|---|
| 509 | 12 / 12.6 | 8.0 / 10 | 10 / 180 | 84.5 | 4 |
| 182 | 12 / 12.9 | 9.2 / 10 | 40 / 76 | 37.6 | * |
| 395 | 12 / 12.5 | 8.6 / 10 | 4 / 250 | 79.5 | 50 |
| 205 | 12 / 12.4 | 9.4 / 10 | 80 / 300 | 32.7 | * |
| 2 | 12 / 13.6 | 7.2 / 16 | 6 / 750 | 44.2 | 79 |
| 14 | 12 / 12.6 | 10.3 / 22 | 14 / 16 | 100.0 | 77 |
| 195 | 12 / 12.0 | 10.0 / 10 | 40 / 72 | 72.6 | 89 |
| 101 | 12 / 12.6 | 9.2 / 22 | 10 / 225 | 68.0 | 79 |
*Note: Interstate routes not currently included in the rumble strip data provided.
Figure 23 summarizes the 16 available U6F roadways in Washington State ranked by total U6F length available. The available segment data was processed to combine adjacent U6F segments from the same route to determine the number of contiguous segments for each route. Table 66 and Table 67 present information on the secondary variables (see Table 2) for 11 of the 16 U6F routes shown in Figure 23. As routes 518, 520, 500, 705, and 539 have one or two segments and less than 1 mile of U6F length, these routes were not further considered for selection. Table 66 summarizes the operational characteristics while Table 67 summarizes the geometric characteristics. For each route, the range of AADT, the range of large truck percentage, and the range of posted speed limit are shown in Table 66.
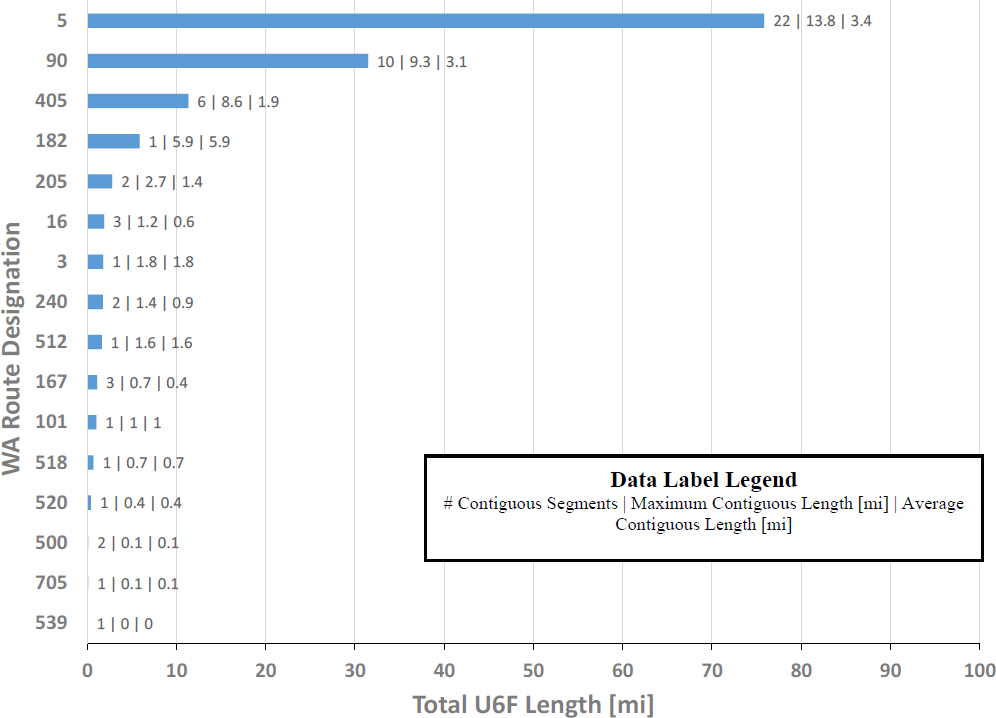
Geometric characteristics shown in Table 67 include lane width, outside shoulder width, median width, as well as percentage of positive median barrier and rumble strips present. The minimum and mean lane widths are reported. The shoulder width data in Table 67 considers the outside shoulder width for both directions of the divided roadway. In general, however, the outside shoulder widths were nearly identical in most cases. All routes had a minimum shoulder width of zero (not shown in Table 67) except for routes 3, 167 and 101, which had a 10 foot minimum shoulder width. The minimum and maximum median widths are reported for each route and, in Washington State, this width includes the inside/left shoulder widths. Positive barrier presence was determined from the median barrier type variable. Median barrier types include cable, guardrail, and NJ type barriers; only the depressed, unprotected, and curb categories were considered to have no positive barrier present. For each route, the total length of sections with positive barrier were divided by the corresponding total U6F length for that route, as shown in Figure 23. Rumble strip presence data is not available in the HSIS roadway inventory data but Washington State maintains this data separately. For each of the routes, the proportion of route length with any rumble strips present was computed using this separate dataset. Note that this data is based on the entire length of the roadway and is not necessarily specific to the U6F portions of the route. Nonetheless, the data provides a general indication of whether or not any rumble strips are present along a particular route. The available rumble strip data (not included in Table 67) also indicates the location of the rumble strips: centerline only, shoulders only, or both centerline and shoulder locations. Once specific routes have been selected, the exact details on the rumble strips will be merged into the corresponding HSIS roadway inventory data. Note that the initial rumble strip data from Washington State did not include Interstate roadways; we will work with our contacts at Washington State to obtain the rumble strip information for any Interstate U6F routes selected.
| Route Designation | AADT [veh/day] | Posted Speed Limit [mph] | Truck Percentage [%] | |||
|---|---|---|---|---|---|---|
| Minimum | Maximum | Minimum | Maximum | Minimum | Maximum | |
| 5 | 42,029 | 242,028 | 50 | 70 | 0 | 33.5 |
| 90 | 31,074 | 162,004 | 60 | 70 | 0 | 25.0 |
| 405 | 102,430 | 192,843 | 60 | 60 | 0 | 4.6 |
| 182 | 28,210 | 61,998 | 70 | 70 | 0 | 6.1 |
| 205 | 63,271 | 133,789 | 60 | 60 | 0 | 5.7 |
| 16 | 81,136 | 128,533 | 60 | 60 | 0 | 5.2 |
| 3 | 28,832 | 56,144 | 60 | 60 | 6 | 5.7 |
| 240 | 35,726 | 73,919 | 60 | 60 | 3 | 10.9 |
| 512 | 75,122 | 108,272 | 60 | 60 | 0 | 6.7 |
| 167 | 51,785 | 124,002 | 60 | 60 | 10 | 10.0 |
| 101 | 71,696 | 99,003 | 60 | 60 | 4 | 7.7 |
| Route Designation | Min / Mean Lane Width [ft] | Mean / Max Outside Shoulder Width [ft] | Min / Max Median Width [ft] | Median Barrier Presence [%] | Approximate Rumble Strip Presence [%] |
|---|---|---|---|---|---|
| 5 | 11 / 12.6 | 9.0 / 24 | 4 / 300 | 85.4 | * |
| 90 | 12 / 12.9 | 9.0 / 18 | 4 / 350 | 70.3 | * |
| 405 | 11 / 12.6 | 8.6 / 26 | 6 / 275 | 89.7 | * |
| 182 | 12 / 12.6 | 9.1 / 14 | 76 / 76 | 5.6 | * |
| 205 | 12 / 12.2 | 10.1 / 14 | 66 / 128 | 17.4 | * |
| 16 | 12 / 13.5 | 6.9 / 10 | 2 / 60 | 32.6 | 0 |
| 3 | 12 / 12.0 | 10.0 / 10 | 40 / 48 | 91.6 | 67 |
| 240 | 12 / 12.3 | 9.2 / 10 | 16 / 40 | 100.0 | 45 |
| 512 | 12 / 12.0 | 9.5 / 10 | 4 / 16 | 100.0 | 0 |
| 167 | 12 / 12.0 | 10.0 / 10 | 16 / 88 | 63.3 | 0 |
| 101 | 12 / 12.0 | 11.1 / 22 | 40 / 50 | 100.0 | 79 |
*Note: Interstate routes not currently included in the rumble strip data provided.
Figure 24 summarizes the four available U8F roadways in Washington State ranked by total U8F length available. The available segment data was processed to combine adjacent U8F segments from the same route to determine the number of contiguous segments for each route. Table 68 and Table 69 present information on the secondary variables (see Table 2) for three of the four U8F routes shown in Figure 24. As I-205 has one segment and 0.5 miles of U8F length, this route was not further considered for selection. Table 68 summarizes the operational characteristics while Table 69 summarizes the geometric characteristics. For each route, the range of AADT, the range of large truck percentage, and the range of posted speed limit are shown in Table 68.

| Route Designation | AADT [veh/day] | Posted Speed Limit [mph] | Truck Percentage [%] | |||
|---|---|---|---|---|---|---|
| Minimum | Maximum | Minimum | Maximum | Minimum | Maximum | |
| 5 | 49,077 | 239,490 | 60 | 70 | 0 | 20.6 |
| 405 | 119,255 | 195,319 | 60 | 60 | 0 | 4.6 |
| 90 | 23,126 | 120,604 | 40 | 60 | 0 | 3.5 |
Geometric characteristics shown in Table 69 include lane width, outside shoulder width, median width, as well as percentage of positive median barrier and rumble strips present. The minimum and mean lane widths are reported. The shoulder width data in Table 69 considers the outside shoulder width for both directions of the divided roadway. In general, however, the outside shoulder widths are nearly identical in most cases. All routes had a minimum shoulder width of zero (not shown in Table 69) except for route 405, which has a 5 foot minimum shoulder width. The minimum and maximum median widths are reported for each route and, in Washington State, this width includes the inside/left shoulder widths. Positive barrier presence was determined from the median barrier type variable. Median barrier types included cable, guardrail, and NJ type barriers; only the depressed, unprotected, and curb categories were considered to have no positive barrier present. For each route, the total length of sections with positive barrier were divided by the corresponding total U8F length for that route, as shown in Figure 24. The rumble strip presence data initially obtained from Washington State did not include Interstate roadways such as I-5, I-405, and I-90, so rumble strip presence is not indicated in Table 69. We will work with our contacts at Washington State to obtain the rumble strip information for any selected U8F routes.
| Route Designation | Min / Mean Lane Width [ft] | Mean / Max Outside Shoulder Width [ft] | Min / Max Median Width [ft] | Median Barrier Presence [%] |
|---|---|---|---|---|
| 5 | 11 / 12.4 | 8.6 / 14 | 2 / 300 | 86.8 |
| 405 | 12 / 12.0 | 10.1 / 12 | 16 / 450 | 47.9 |
| 90 | 12 / 13.2 | 7.4 / 10 | 40 / 50 | 71.8 |
Based on the data from the available U4D segments in Washington, the following observations were made:
- The routes with the largest traffic volume variation are SR 99 followed by SR 14. Both have a maximum daily traffic volume in excess of 80,000 vehicles per day.
- Most routes have a relatively small variation in posted speed limit.
- The majority of the U4D routes have maximum truck traffic percentage below 20%.
- Minimum lane width is 11 or 12 feet and, similar to Washington R4D routes, there is less variation in U4D lane width compared to the Washington RU2L2W and urban/suburban undivided roadways.
- SR 503 and SR 12 have the largest variation in outside shoulder width.
- The majority of the U4D routes have maximum median widths of 40 feet or less and generally have a range of median widths. SR 12 and SR 395 have the largest median width variability.
- All but five of the longest available U4D routes in Washington have positive median barriers along 20% or more of the roadway length.
- Approximately half of the routes have 50% or more presence of rumble strips.
- SR 2, the fifth longest available Washington U4D route available, was already selected to be included in the study as the RU2L2W route, so the analogous U4D sections of SR 2 could be included. SR 99 and SR 522, originally selected as a 4U/5T routes, have portions classified as U4D as well.
Based on the data from the available U4F segments in Washington, the following observations were made:
- I-82 and I-5 have by far the longest length of U4F available.
- As expected, the minimum and maximum traffic volumes for the U4F routes (on average) are higher than those for the U4D routes.
- The routes with the largest traffic volume variation are I-405 followed by I-5 and SR 520. All have a maximum daily traffic volume in excess of 100,000 vehicles per day.
- Most of the U4F routes have a relatively small variation in posted speed limit.
- All but two of the 20 longest U4F routes have maximum truck traffic percentage below 25%.
- Similar to the Washington U4D routes, there is less variation in U4F lane width compared to the Washington RU2L2W and urban/suburban undivided roadways.
- SR 520 has the largest variation in outside shoulder width but the majority of the available routes have a maximum outside shoulder width between 10 and 12 feet.
- Compared to the Washington U4D routes, there is more variability in the U4F median widths. Half of the longest U4F routes have maximum median widths of 100 feet or more.
- All of the available U4F routes in Washington have positive median barrier present on more than one fourth of the total U4F classified roadway length.
- The second and third longest U4F routes available, I-5 and I-90, were already selected as representative R6F and R4F routes, respectively. The analogous U4F sections of these routes could be included. SR 2 was already selected to be included in the study as the RU2L2W route so the analogous U4F sections of SR 2, albeit relatively short, could be included as well.
Based on the data from the 16 available U6F segments in Washington, the following observations were made:
- As expected, the minimum and maximum traffic volumes for the U6F routes (on average) are higher than those for the U4D and U4F routes as well as the Washington rural divided routes.
- The majority of the longest U6F routes have maximum traffic volumes over 100,000 vehicles per day and the longest route, I-5, has a maximum traffic volume over 200,000 vehicles per day.
- There is little variation in posted speed limit for the U6F routes.
- With the exception of I-5 and I-90, the available routes have a maximum truck traffic of approximately 10% or less.
- Similar to the other Washington divided routes, there is little variation in lane width for the available U6F routes.
- Similar to the Washington U4F routes, the U6F routes have mean outside shoulder widths between 7 and 11 feet.
- With the exception of SR 3, I-182, SR 512, and SR 101, the U6F routes have a relatively wide variation in median width.
- Most of the U6F routes in Washington have positive median barrier present on two-thirds or more of the U6F length.
- The two longest U6F routes available, I-5 and I-90, were already selected as representative R6F and R4F routes, respectively. The analogous U6F sections of these routes could be included.
Based on the data from the four available U8F segments in Washington, the following observations were made:
- I-5 has by far the longest length classified as U8F.
- All U8F routes have a reasonably wide variation in traffic, with I-5 having a maximum traffic volume over 200,000 vehicles per day.
- I-5 has a reasonable variation in truck traffic percentage. I-405 and I-90 have very little truck traffic: 5% or less.
- Lane width variation is similar to the other Washington divided roadways.
- The available U8F routes have similar outside shoulder widths.
- I-5 and I-405 have similar median width variation while I-90 has little median width variation.
- The U8F routes in Washington have positive median barrier present on approximately half or more of the U8F length.
- I-5 and I-90 were already selected as representative R6F and R4F routes, respectively. The analogous U8F sections of these routes could be included.
These observations along with the available Washington urban divided roadway characteristics will be combined with corresponding data from the other two state agency partners. This combined data will be used to select representative U4D, U4F, U6F, U8F, and U10F routes from all three state agency partners.
Tennessee Urban/Suburban Divided Roadways and Associated Characteristics
Table 70 summarizes the results of the classification of the available urban/suburban divided roadways in Tennessee. The vast majority of the available length is U4D and U4F with sizable portions classified as U6F and U8F, and a limited length classified as U10F.
Table 70. Available Tennessee Urban/Suburban Divided Roadway Segments
| Urban Divided Roadway Type | Total Length [mi] | Unique Routes |
|---|---|---|
| U4D | 634.1 | 119 |
| U4F | 410.8 | 41 |
| U6F | 104.2 | 31 |
| U8F | 85.9 | 16 |
| U10F | 28.9 | 9 |
As the U8F and U10F subtypes in Tennessee have less than 20 unique routes available, all of the available routes will be examined for these subtypes. For the remaining subtypes, the 20 longest routes were examined in more detail. Figure 25 summarizes the 20 longest available U4D roadways in Tennessee ranked by total U4D length available. The available segment data was processed to combine adjacent U4D segments from the same route to determine the number of contiguous segments for each route. The number of contiguous U4D segments for a given route is the left number shown in the Figure 25 data label. The maximum contiguous length for each route was tallied and the average contiguous length was computed by dividing the total U4D length by the number of contiguous segments for each route; these are the middle and right numbers in the Figure 25 data label, respectively. Note that approximately 75% (89 of 119 routes) have 5 miles or less total U4D length available (not shown in Figure 25).

Table 71 and Table 72 present information on the secondary variables (see Table 2) for the U4D routes shown in Figure 25. Table 71 summarizes the operational characteristics while Table 72 summarizes the geometric characteristics. For each route, the range of AADT, the range of large truck percentage, and the range of posted speed limit are shown in Table 71.
| Route Designation | AADT [veh/day] | Posted Speed Limit [mph] | Truck Percentage [%] | |||
|---|---|---|---|---|---|---|
| Minimum | Maximum | Minimum | Maximum | Minimum | Maximum | |
| SR001 | 410 | 44,340 | 30 | 65 | 0 | 31 |
| SR034 | 1,670 | 34,650 | 25 | 55 | 2 | 64 |
| SR003 | 8,800 | 31,830 | 35 | 65 | 6 | 33 |
| SR015 | 2,730 | 63,660 | 45 | 70 | 1 | 18 |
| SR006 | 13,860 | 53,150 | 30 | 65 | 3 | 18 |
| SR073 | 7,990 | 29,010 | 40 | 65 | 2 | 30 |
| SR009 | 5,150 | 35,760 | 30 | 55 | 0 | 8 |
| SR111 | 10,900 | 25,310 | 45 | 65 | 6 | 10 |
| SR061 | 4,730 | 27,030 | 45 | 55 | 1 | 5 |
| SR109 | 12,520 | 36,280 | 35 | 55 | 9 | 18 |
| SR002 | 4,970 | 34,440 | 30 | 55 | 2 | 25 |
| Route Designation | AADT [veh/day] | Posted Speed Limit [mph] | Truck Percentage [%] | |||
|---|---|---|---|---|---|---|
| Minimum | Maximum | Minimum | Maximum | Minimum | Maximum | |
| SR005 | 10,900 | 35,440 | 30 | 55 | 7 | 20 |
| SR160 | 4,290 | 22,750 | 50 | 55 | 7 | 16 |
| SR055 | 12,880 | 19,480 | 40 | 55 | 6 | 12 |
| SR037 | 8,840 | 22,510 | 35 | 55 | 4 | 8 |
| SR115 | 7,410 | 59,030 | 45 | 55 | 4 | 10 |
| SR029 | 4,200 | 22,110 | 40 | 60 | 3 | 18 |
| SR032 | 7,900 | 25,380 | 40 | 55 | 0 | 16 |
| SR169 | 14,210 | 27,910 | 35 | 50 | 2 | 17 |
| SR058 | 10,290 | 41,060 | 30 | 55 | 3 | 16 |
Geometric characteristics shown in Table 72 include lane width, outside shoulder width, median width, as well as percentage of positive median barrier and rumble strips present. The shoulder width data in Table 72 considers the outside shoulder width for both directions of the divided roadway. As the minimum shoulder width exceeded zero, minimum shoulder width was included in Table 72. Note that Tennessee only reports shoulder width to the nearest foot. The minimum and mean lane widths are reported based on a combination of the pavement width data element (travel lanes only) and number of lanes data in the roadway description table and road geometry tables, respectively. The minimum and maximum median widths are reported for each route and, in Tennessee, this width does not include the inside/left shoulder widths. Positive barrier presence was determined from the feature composition variable associated with the median features present in the roadway description table. Median barrier types included concrete barrier, other barrier, and cable barrier. For each route, the total length of sections with positive barrier were divided by the corresponding total U4D length for that route, e.g. shown in Figure 25. The Tennessee maintenance inventory table includes shoulder rumble strip data, which was used to generate the rumble strip presence proportions shown in Table 72. These values reflect the proportion of U4D length for each route that has rumble strips present on any of the four travel way edges. This was computed by dividing total rumble strip length for each route by the corresponding total edge length—four times the U4D length reported in Figure 25.
| Route Designation | Min / Mean Lane Width [ft] | Min / Mean / Max Outside Shoulder Width [ft] | Min / Max Median Width [ft] | Median Barrier Presence [%] | Approximate Rumble Strip Presence [%] |
|---|---|---|---|---|---|
| SR001 | 9 / 11.9 | 2 / 7.5 / 24 | 2 / 160 | 4.6 | 23 |
| SR034 | 9 / 11.9 | 1 / 9.0 / 24 | 2 / 150 | 2.8 | 25 |
| SR003 | 11 / 12.0 | 2 / 7.6 / 22 | 2 / 385 | 3.8 | 58 |
| SR015 | 10 / 12.1 | 2 / 9.8 / 16 | 2 / 42 | 12.3 | 70 |
| SR006 | 11 / 12.2 | 2 / 9.0 / 24 | 2 / 40 | 9.6 | 29 |
| SR073 | 11 / 11.9 | 1 / 8.8 / 12 | 4 / 40 | 7.8 | 28 |
| SR009 | 9 / 11.7 | 1 / 10.8 / 30 | 2 / 32 | 7.7 | 31 |
| SR111 | 12 / 12.3 | 4 / 10.3 / 12 | 2 / 58 | 6.6 | 42 |
| SR061 | 12 / 12.0 | 2 / 9.8 / 12 | 2 / 200 | 12.5 | 9 |
| SR109 | 8 / 11.9 | 3 / 10.9 / 34 | 4 / 40 | 5.8 | 41 |
| SR002 | 11 / 12.1 | 1 / 8.6 / 24 | 2 / 100 | 7.1 | 14 |
| Route Designation | Min / Mean Lane Width [ft] | Min / Mean / Max Outside Shoulder Width [ft] | Min / Max Median Width [ft] | Median Barrier Presence [%] | Approximate Rumble Strip Presence [%] |
|---|---|---|---|---|---|
| SR005 | 11 / 12.1 | 2 / 9.2 / 13 | 4 / 60 | 0.4 | 29 |
| SR160 | 12 / 12.0 | 10 / 10.3 / 12 | 11 / 40 | 0.0 | 57 |
| SR055 | 11 / 12.4 | 2 / 8.7 / 12 | 20 / 54 | 0.0 | 45 |
| SR037 | 11 / 11.9 | 2 / 10.0 / 18 | 2 / 40 | 12.7 | 57 |
| SR115 | 8 / 11.9 | 2 / 9.5 / 24 | 2 / 400 | 24.9 | 13 |
| SR029 | 12 / 12.0 | 2 / 9.1 / 14 | 2 / 200 | 29.1 | 20 |
| SR032 | 9 / 11.8 | 1 / 9.6 / 24 | 2 / 140 | 2.0 | 31 |
| SR169 | 11 / 12.0 | 2 / 2.2 / 10 | 4 / 350 | 2.7 | 0 |
| SR058 | 9 / 11.9 | 1 / 9.5 / 20 | 2 / 40 | 13.5 | 51 |
Figure 26 summarizes the 20 longest available U4F roadways in Tennessee ranked by total U4F length available. The available segment data was processed to combine adjacent U4F segments from the same route to determine the number of contiguous segments for each route. Note that approximately 60% (25 of 41 routes) have 5 miles or less total U4F length available (not shown in Figure 26).
Table 73 and Table 74 present information on the secondary variables (see Table 2) for the U4F routes shown in Figure 26. Table 73 summarizes the operational characteristics while Table 74 summarizes the geometric characteristics. For each route, the range of AADT, the range of large truck percentage, and the range of posted speed limit are shown in Table 73.

| Route Designation | AADT [veh/day] | Posted Speed Limit [mph] | Truck Percentage [%] | |||
|---|---|---|---|---|---|---|
| Minimum | Maximum | Minimum | Maximum | Minimum | Maximum | |
| I0040 | 29,200 | 178,740 | 55 | 70 | 7 | 46 |
| I0075 | 26,890 | 110,200 | 55 | 70 | 15 | 36 |
| I0024 | 38,390 | 154,260 | 55 | 70 | 13 | 43 |
| I0026 | 9,400 | 70,620 | 55 | 65 | 6 | 25 |
| I0065 | 27,570 | 183,350 | 55 | 70 | 7 | 31 |
| I0081 | 29,410 | 40,280 | 65 | 70 | 27 | 41 |
| SR385 | 10,320 | 140,140 | 55 | 65 | 4 | 51 |
| SR029 | 16,310 | 39,350 | 60 | 65 | 6 | 9 |
| I0840 | 11,090 | 64,570 | 70 | 70 | 7 | 31 |
| SR003 | 8,710 | 13,220 | 45 | 70 | 18 | 34 |
| SR111 | 9,740 | 19,880 | 55 | 70 | 7 | 12 |
| SR386 | 37,970 | 81,290 | 45 | 70 | 3 | 4 |
| SR155 | 37,230 | 62,350 | 45 | 55 | 6 | 17 |
| I0140 | 41,890 | 65,200 | 55 | 65 | 4 | 7 |
| I0269 | 5,000 | 20,000 | 65 | 70 | 8 | 10 |
| SR022 | 4,340 | 10,810 | 45 | 70 | 5 | 26 |
| I0155 | 11,180 | 14,400 | 70 | 70 | 29 | 37 |
| SR006 | 47,520 | 85,360 | 35 | 55 | 4 | 4 |
| SR020 | 11,730 | 12,550 | 65 | 65 | 25 | 26 |
| SR067 | 3,850 | 3,850 | 45 | 55 | 3 | 3 |
Geometric characteristics shown in Table 74 include lane width, outside shoulder width, median width, as well as percentage of positive median barrier and rumble strips present. The shoulder width data in Table 74 considers the outside shoulder width for both directions of the divided roadway. As the minimum shoulder width exceeded zero, minimum shoulder width was included in Table 74. Note that Tennessee only reports shoulder width to the nearest foot. The minimum and mean lane widths are reported based on a combination of the pavement width data element (travel lanes only) and number of lanes data in the roadway description table and road geometry tables, respectively. The minimum and maximum median widths are reported for each route and, in Tennessee, this width does not include the inside/left shoulder widths. Positive barrier presence was determined from the feature composition variable associated with the median features present in the roadway description table. Median barrier types included concrete barrier, other barrier, and cable barrier. For each route, the total length of sections with positive barrier were divided by the corresponding total U4F length for that route, as shown in Figure 26. The Tennessee maintenance inventory table includes shoulder rumble strip data, which was used to generate the rumble strip presence proportions shown in Table 74. These values reflect the proportion of U4F length for each route that has rumble strips present on any of the four travel way edges. This was computed by dividing total rumble strip length for each route by the corresponding total edge length—four times the U4F length reported in Figure 26.
| Route Designation | Min / Mean Lane Width [ft] | Min / Mean / Max Outside Shoulder Width [ft] | Min / Max Median Width [ft] | Median Barrier Presence [%] | Approximate Rumble Strip Presence [%] |
|---|---|---|---|---|---|
| I0040 | 9 / 12.1 | 4 / 10.9 / 18 | 2 / 300 | 57.0 | 59 |
| I0075 | 8 / 12.1 | 4 / 10.9 / 20 | 2 / 400 | 34.2 | 53 |
| I0024 | 12 / 12.0 | 6 / 10.7 / 20 | 2 / 700 | 14.8 | 72 |
| I0026 | 12 / 12.1 | 4 / 10.5 / 24 | 2 / 40 | 92.4 | 47 |
| I0065 | 12 / 12.4 | 7 / 10.6 / 12 | 50 / 250 | 19.5 | 96 |
| I0081 | 12 / 12.0 | 8 / 11.0 / 18 | 30 / 92 | 42.6 | 72 |
| SR385 | 11 / 12.1 | 1 / 10.6 / 24 | 2 / 150 | 81.0 | 46 |
| SR029 | 12 / 12.3 | 6 / 10.5 / 12 | 2 / 150 | 6.6 | 55 |
| I0840 | 12 / 12.3 | 6 / 11.1 / 22 | 60 / 100 | 8.6 | 58 |
| SR003 | 12 / 12.0 | 8 / 10.4 / 11 | 46 / 54 | 41.9 | 84 |
| SR111 | 12 / 12.0 | 6 / 9.9 / 12 | 2 / 58 | 28.2 | 35 |
| SR386 | 12 / 12.0 | 8 / 10.9 / 12 | 2 / 200 | 96.0 | 35 |
| SR155 | 12 / 12.0 | 4 / 10.3 / 24 | 2 / 26 | 91.6 | 39 |
| I0140 | 12 / 12.0 | 6 / 10.9 / 16 | 2 / 40 | 98.7 | 40 |
| I0269 | 12 / 12.0 | 6 / 10.5 / 18 | 34 / 44 | 26.6 | 44 |
| SR022 | 12 / 12.0 | 6 / 10.1 / 12 | 10 / 150 | 0.0 | 54 |
| I0155 | 12 / 12.0 | 10 / 10.0 / 10 | 54 / 54 | 0.0 | 100 |
| SR006 | 12 / 12.2 | 10 / 11.3 / 24 | 32 / 100 | 38.9 | 100 |
| SR020 | 12 / 12.0 | 10 / 10.0 / 10 | 55 / 55 | 0.0 | 0 |
| SR067 | 12 / 12.0 | 10 / 10.6 / 11 | 30 / 38 | 3.5 | 2 |
Figure 27 summarizes the 20 longest available U6F roadways in Tennessee ranked by total U6F length available. The available segment data was processed to combine adjacent U6F segments from the same route to determine the number of contiguous segments for each route. Note that approximately 80% (25 of 31 routes) have 5 miles or less total U6F length available (not shown in Figure 27).
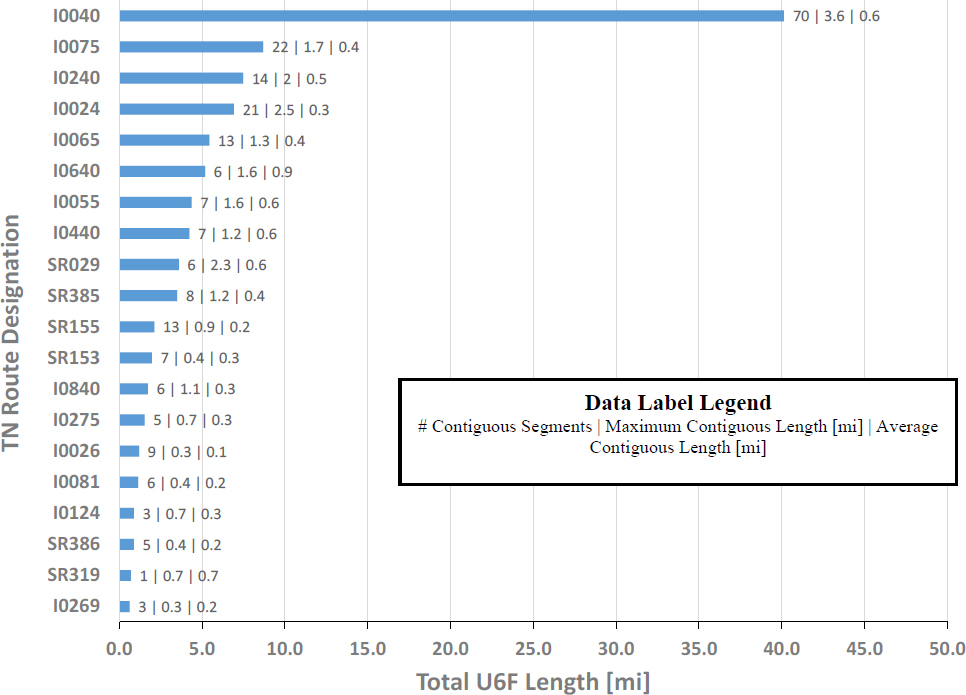
Table 75 and Table 76 present information on the secondary variables (see Table 2) for the U6F routes shown in Figure 27. Table 75 summarizes the operational characteristics while Table 76 summarizes the geometric characteristics. For each route, the range of AADT, the range of large truck percentage, and the range of posted speed limit are shown in Table 75.
| Route Designation | AADT [veh/day] | Posted Speed Limit [mph] | Truck Percentage [%] | |||
|---|---|---|---|---|---|---|
| Minimum | Maximum | Minimum | Maximum | Minimum | Maximum | |
| I0040 | 31,260 | 212,690 | 45 | 70 | 8 | 39 |
| I0075 | 26,890 | 130,200 | 55 | 70 | 14 | 35 |
| I0240 | 74,390 | 149,760 | 55 | 55 | 7 | 13 |
| I0024 | 38,390 | 173,760 | 55 | 70 | 13 | 35 |
| I0065 | 46,820 | 182,110 | 55 | 70 | 7 | 30 |
| I0640 | 58,500 | 82,470 | 55 | 55 | 11 | 16 |
| I0055 | 50,900 | 83,220 | 45 | 55 | 16 | 52 |
| I0440 | 83,050 | 109,280 | 55 | 70 | 7 | 8 |
| SR029 | 25,820 | 68,830 | 55 | 65 | 6 | 9 |
| SR385 | 14,140 | 140,140 | 55 | 65 | 4 | 51 |
| SR155 | 37,230 | 98,310 | 45 | 55 | 4 | 17 |
| SR153 | 45,600 | 77,780 | 55 | 55 | 5 | 8 |
| Route Designation | AADT [veh/day] | Posted Speed Limit [mph] | Truck Percentage [%] | |||
|---|---|---|---|---|---|---|
| Minimum | Maximum | Minimum | Maximum | Minimum | Maximum | |
| I0840 | 11,090 | 64,570 | 70 | 70 | 7 | 31 |
| I0275 | 73,450 | 79,740 | 55 | 55 | 4 | 4 |
| I0026 | 28,390 | 70,620 | 60 | 65 | 6 | 8 |
| I0081 | 36,530 | 41,910 | 65 | 65 | 27 | 36 |
| I0124 | 67,400 | 74,880 | 55 | 55 | 5 | 5 |
| SR386 | 60,030 | 81,290 | 65 | 65 | 3 | 3 |
| SR319 | 28,370 | 28,370 | 55 | 55 | 3 | 3 |
| I0269 | 5,000 | 19,590 | 65 | 65 | 8 | 19 |
Geometric characteristics shown in Table 76 include lane width, outside shoulder width, median width, as well as percentage of positive median barrier and rumble strips present. The shoulder width data in Table 76 considers the outside shoulder width for both directions of the divided roadway. As the minimum shoulder width exceeded zero, minimum shoulder width was included in Table 76. Note that Tennessee only reports shoulder width to the nearest foot. The minimum and mean lane widths are reported based on a combination of the pavement width data element (travel lanes only) and number of lanes data in the roadway description table and road geometry tables, respectively. The minimum and maximum median widths are reported for each route and, in Tennessee, this width does not include the inside/left shoulder widths. Positive barrier presence was determined from the feature composition variable associated with the median features present in the roadway description table. Median barrier types included concrete barrier, other barrier, and cable barrier. For each route, the total length of sections with positive barrier were divided by the corresponding total U6F length for that route, as shown in Figure 27. The Tennessee maintenance inventory table includes shoulder rumble strip data, which was used to generate the rumble strip presence proportions shown in Table 76. These values reflect the proportion of U6F length for each route that has rumble strips present on any of the four travel way edges. This was computed by dividing total rumble strip length for each route by the corresponding total edge length—four times the U6F length reported in Figure 27.
| Route Designation | Min / Mean Lane Width [ft] | Min / Mean / Max Outside Shoulder Width [ft] | Min / Max Median Width [ft] | Median Barrier Presence [%] | Approximate Rumble Strip Presence [%] |
|---|---|---|---|---|---|
| I0040 | 10 / 11.2 | 1 / 11.8 / 24 | 2 / 350 | 76.1 | 49 |
| I0075 | 8 / 11.0 | 4 / 10.9 / 16 | 2 / 200 | 88.8 | 96 |
| I0240 | 8 / 11.7 | 2 / 10.5 / 22 | 2 / 550 | 69.5 | 51 |
| I0024 | 10 / 10.8 | 6 / 11.0 / 46 | 2 / 700 | 77.8 | 56 |
| I0065 | 8 / 10.5 | 3 / 11.0 / 20 | 2 / 250 | 91.9 | 100 |
| I0640 | 12 / 12.0 | 10 / 10.8 / 16 | 2 / 60 | 37.1 | 52 |
| I0055 | 8 / 11.0 | 1 / 8.9 / 12 | 2 / 46 | 92.0 | 45 |
| I0440 | 8 / 10.4 | 6 / 10.9 / 16 | 16 / 60 | 0.0 | 0 |
| SR029 | 8 / 11.6 | 4 / 9.7 / 18 | 2 / 56 | 58.8 | 44 |
| SR385 | 8 / 10.9 | 5 / 9.4 / 12 | 2 / 38 | 96.6 | 41 |
| SR155 | 8 / 8.6 | 4 / 8.5 / 14 | 2 / 55 | 84.0 | 45 |
| SR153 | 8 / 10.9 | 10 / 11.4 / 22 | 2 / 2 | 100.0 | 0 |
| Route Designation | Min / Mean Lane Width [ft] | Min / Mean / Max Outside Shoulder Width [ft] | Min / Max Median Width [ft] | Median Barrier Presence [%] | Approximate Rumble Strip Presence [%] |
|---|---|---|---|---|---|
| I0840 | 8 / 9.3 | 6 / 10.6 / 20 | 60 / 62 | 4.6 | 61 |
| I0275 | 10 / 11.8 | 10 / 10.9 / 12 | 2 / 2 | 100.0 | 42 |
| I0026 | 8 / 8.0 | 5 / 8.5 / 12 | 30 / 40 | 91.7 | 38 |
| I0081 | 8 / 10.0 | 6 / 10.0 / 11 | 2 / 92 | 73.0 | 66 |
| I0124 | 8 / 9.8 | 2 / 9.1 / 12 | 2 / 16 | 100.0 | 0 |
| SR386 | 8 / 8.0 | 4 / 8.9 / 11 | 2 / 39 | 100.0 | 53 |
| SR319 | 12 / 12.0 | 10 / 10.0 / 10 | 2 / 2 | 100.0 | 0 |
| I0269 | 8 / 8.0 | 6 / 9.5 / 11 | 38 / 40 | 42.9 | 26 |
Figure 28 summarizes the 16 available U8F roadways in Tennessee ranked by total U8F length available. The available segment data was processed to combine adjacent U8F segments from the same route to determine the number of contiguous segments for each route. Table 77 and Table 78 present information on the secondary variables (see Table 2) for 9 of the 16 U8F routes shown in Figure 28. Since I-81, I-124, I-275, SR 29, SR 115, and SR 158 have relatively few U8F segments and 0.3 miles or less of U8F length, these routes were excluded from further consideration. Table 77 summarizes the operational characteristics while Table 78 summarizes the geometric characteristics. For each route, the range of AADT, the range of large truck percentage, and the range of posted speed limit are shown in Table 77.
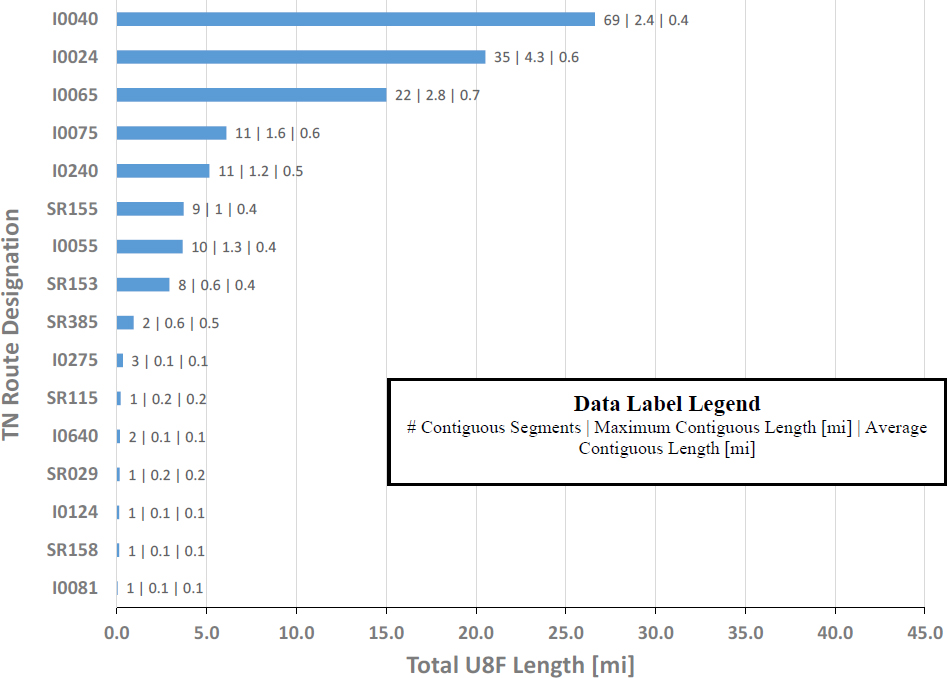
| Route Designation | AADT [veh/day] | Posted Speed Limit [mph] | Truck Percentage [%] | |||
|---|---|---|---|---|---|---|
| Minimum | Maximum | Minimum | Maximum | Minimum | Maximum | |
| I0040 | 36,110 | 212,690 | 45 | 70 | 7 | 36 |
| I0024 | 98,930 | 190,530 | 55 | 70 | 12 | 21 |
| I0065 | 91,590 | 183,350 | 55 | 70 | 6 | 25 |
| I0075 | 62,700 | 130,200 | 55 | 65 | 14 | 24 |
| I0240 | 96,670 | 169,730 | 55 | 55 | 7 | 13 |
| SR155 | 96,270 | 103,300 | 45 | 55 | 4 | 4 |
| I0055 | 58,630 | 91,840 | 45 | 65 | 14 | 45 |
| SR153 | 68,730 | 77,780 | 55 | 55 | 5 | 7 |
| SR385 | 88,950 | 140,140 | 55 | 55 | 4 | 6 |
Geometric characteristics shown in Table 78 include lane width, outside shoulder width, median width, as well as percentage of positive median barrier and rumble strips present. The shoulder width data in Table 78 considers the outside shoulder width for both directions of the divided roadway. As the minimum shoulder width exceeded zero, minimum shoulder width was included in Table 78. Note that Tennessee only reports shoulder width to the nearest foot. The minimum and mean lane widths are reported based on a combination of the pavement width data element (travel lanes only) and number of lanes data in the roadway description table and road geometry tables, respectively. The minimum and maximum median widths are reported for each route and, in Tennessee, this width does not include the inside/left shoulder widths. Positive barrier presence was determined from the feature composition variable associated with the median features present in the roadway description table. Median barrier types included concrete barrier, other barrier, and cable barrier. For each route, the total length of sections with positive barrier were divided by the corresponding total U8F length for that route, as shown in Figure 28. The Tennessee maintenance inventory table includes shoulder rumble strip data which was used to generate the rumble strip presence proportions shown in Table 78. These values reflect the proportion of U8F length for each route that has rumble strips present on any of the four travel way edges. This was computed by dividing total rumble strip length for each route by the corresponding total edge length—four times the U8F length reported in Figure 28.
Table 78. Geometric Characteristics of the Urban/Suburban Divided Freeway (U8F) Routes in Tennessee
| Route Designation | Min / Mean Lane Width [ft] | Min / Mean / Max Outside Shoulder Width [ft] | Min / Max Median Width [ft] | Median Barrier Presence [%] | Approximate Rumble Strip Presence [%] |
|---|---|---|---|---|---|
| I0040 | 9 / 9.7 | 2 / 11.6 / 36 | 2 / 350 | 93.1 | 66 |
| I0024 | 9 / 9.3 | 6 / 11.2 / 30 | 2 / 178 | 81.1 | 64 |
| I0065 | 9 / 9.3 | 4 / 11.5 / 20 | 2 / 200 | 91.8 | 56 |
| I0075 | 9 / 11.0 | 8 / 10.4 / 24 | 2 / 150 | 93.8 | 74 |
| I0240 | 9 / 11.3 | 1 / 12.3 / 24 | 2 / 120 | 90.6 | 50 |
| SR155 | 12 / 12.0 | 6 / 12.3 / 24 | 2 / 12 | 97.6 | 68 |
| I0055 | 9 / 9.1 | 10 / 10.8 / 12 | 2 / 52 | 97.8 | 84 |
| SR153 | 9 / 9.0 | 10 / 10.7 / 12 | 2 / 200 | 93.5 | 0 |
| Route Designation | Min / Mean Lane Width [ft] | Min / Mean / Max Outside Shoulder Width [ft] | Min / Max Median Width [ft] | Median Barrier Presence [%] | Approximate Rumble Strip Presence [%] |
|---|---|---|---|---|---|
| SR385 | 9 / 9.0 | 6 / 7.3 / 10 | 2 / 2 | 100.0 | 51 |
Figure 29 summarizes the nine available U10F roadways in Tennessee ranked by total U10F length available. The available segment data was processed to combine adjacent U10F segments from the same route to determine the number of contiguous segments for each route.

Table 79 and Table 80 present information on the secondary variables (see Table 2) for six of the nine U10F routes shown in Figure 29. Since I-55, SR 29, and SR 6 have relatively few U10F segments and less than 1 mile of U10F length, these routes were excluded from further consideration. Table 79 summarizes the operational characteristics while Table 80 summarizes the geometric characteristics. For each route, the range of AADT, the range of large truck percentage, and the range of posted speed limit ae shown in Table 79.
| Route Designation | AADT [veh/day] | Posted Speed Limit [mph] | Truck Percentage [%] | |||
|---|---|---|---|---|---|---|
| Minimum | Maximum | Minimum | Maximum | Minimum | Maximum | |
| I0040 | 59,520 | 212,690 | 55 | 70 | 7 | 23 |
| I0065 | 91,590 | 183,350 | 55 | 70 | 7 | 25 |
| I0024 | 98,930 | 190,530 | 55 | 70 | 12 | 16 |
| I0240 | 144,230 | 169,730 | 55 | 55 | 7 | 13 |
| SR155 | 96,270 | 103,300 | 55 | 55 | 4 | 4 |
| I0075 | 62,700 | 130,200 | 55 | 65 | 14 | 21 |
Geometric characteristics shown in Table 80 include lane width, outside shoulder width, median width, as well as percentage of positive median barrier and rumble strips present. The shoulder width data in Table 80 considers the outside shoulder width for both directions of the divided roadway. As the minimum shoulder width exceeded zero, minimum shoulder width was included in Table 80. Note that Tennessee only reports shoulder width to the nearest foot. The minimum and mean lane widths are reported based on a combination of the pavement width data element (travel lanes only) and number of lanes data in the roadway description table and road geometry tables, respectively. The minimum and maximum median widths are reported for each route and, in Tennessee, this width does not include the inside/left shoulder widths. Positive barrier presence was determined from the feature composition variable associated with the median features present in the roadway description table. Median barrier types included concrete barrier, other barrier, and cable barrier. For each route, the total length of sections with positive barrier were divided by the corresponding total U10F length for that route, as shown in Figure 29. The Tennessee maintenance inventory table includes shoulder rumble strip data, which was used to generate the rumble strip presence proportions shown in Table 80. These values reflect the proportion of U10F length for each route that has rumble strips present on any of the four travel way edges. This was computed by dividing total rumble strip length for each route by the corresponding total edge length—four times the U10F length reported in Figure 29.
Table 80. Geometric Characteristics of the Urban/Suburban Divided Freeway (U10F) Routes in Tennessee
| Route Designation | Min / Mean Lane Width [ft] | Min / Mean / Max Outside Shoulder Width [ft] | Min / Max Median Width [ft] | Median Barrier Presence [%] | Approximate Rumble Strip Presence [%] |
|---|---|---|---|---|---|
| I0040 | 8 / 8.8 | 4 / 11.0 / 24 | 2 / 40 | 100 | 60 |
| I0065 | 8 / 9.4 | 8 / 11.9 / 20 | 2 / 40 | 98 | 45 |
| I0024 | 8 / 7.9 | 6 / 9.5 / 12 | 2 / 52 | 99 | 77 |
| I0240 | 10 / 9.6 | 10 / 11.0 / 12 | 2 / 2 | 100 | 63 |
| SR155 | 10 / 10.3 | 6 / 10.9 / 20 | 2 / 2 | 100 | 51 |
| I0075 | 8 / 9.5 | 6 / 9.8 / 10 | 2 / 2 | 100 | 100 |
Based on the data from the available U4D segments in Tennessee, the following observations were made:
- The routes with the largest traffic volume variation are SR 15 followed by SR 115 and SR 1. All three have a maximum daily traffic volume in excess of 40,000 vehicles per day and two of the three have a maximum daily traffic volume closer to 60,000 vehicles per day.
- Compared to the Washington State U4D routes, the Tennessee U4D routes generally have a wider variation of posted speed limits.
- Approximately three-fourths of the Tennessee U4D routes have maximum truck traffic percentage at or below 20%.
- Minimum lane widths are narrower than the Washington State U4D routes.
- SR 109 and SR 9 have the largest variation in outside shoulder width. The mean outside shoulder widths are similar to those for the Washington U4D routes but the Tennessee U4D
- routes generally have wider maximum shoulder widths.
- Nearly all of the Tennessee U4D routes have maximum median widths of 40 feet or more and (on average) the median widths are greater than those for the Washington U4D routes. SR 115 and SR 3 have the largest median width range.
- All but one of the longest available U4D routes in Tennessee have positive median barriers along 25% or less of the roadway length.
- The majority of the routes have 50% or less presence of rumble strips.
- Three of the four longest available Tennessee U4D routes, SR 1, SR 34, and SR 15, were previously selected to be included in the study to represent other roadway types.
Based on the data from the available U4F segments in Tennessee, the following observations were made:
- As expected, the minimum and maximum traffic volumes for the U4F routes (on average) are higher than those for the U4D routes. The TN U4F traffic volumes are similar to the WA U4F routes.
- The routes with the largest traffic volume variation are I-65 followed by I-40. Both have a maximum daily traffic volume in excess of 100,000 vehicles per day.
- Most of the U4F routes have a relatively small variation in posted speed limit.
- Compared to the WA U4F routes, the TN U4F routes have a larger proportion of truck traffic. The majority of the TN U4F routes have maximum truck traffic percentage above 25%.
- There is less variation in U4F lane width compared to the TN U4D and rural undivided roadway types.
- Compared to the WA U4F routes, the TN U4F routes (on average) have a wider outside shoulder width, typically between 10 and 12 feet.
- The median widths for the TN U4F routes are similar to the WA U4D routes.
- Compared to the WA U4F routes, median barriers are less prevalent on the TN U4F routes. Nearly half of the longest TN U4F routes have median barriers on less than one-fourth of the U4F length.
- Two of the three longest U4F routes available, I-40 and I-24, were already selected as representative R4F and R6F routes, respectively. The analogous U4F sections of these routes could be included.
Based on the data from the available U6F segments in Tennessee, the following observations were made:
- I-40 has by far the longest available U6F length.
- As expected, the minimum and maximum traffic volumes for the U6F routes (on average) are higher than those for the TN U4D and U4F routes. Compared to the available WA U6F routes, the TN U6F routes generally have a slightly lower traffic volume.
- Nearly half of the longest U6F routes have maximum traffic volumes over 100,000 vehicles per day and the longest route, I-40, has a maximum traffic volume over 200,000 vehicles per day.
- Compared to the WA U6F routes, the TN U6F routes have more variation in posted speed limit but nearly all posted speeds are between 55 and 70 mph.
- More than half of the longest TN U6F routes have a maximum truck traffic of 10% or more.
- Compared to the WA urban divided routes, the TN U6F routes have more variation in lane width and the lanes are narrower.
- Similar to Washington State, the TN U6F routes have mean outside shoulder widths between 7 and 11 feet.
- With the exception of I-275, I-269, SR 153, and SR 319, the U6F routes have a relatively wide variation in median width.
- Positive median barrier presence on the TN U6F routes is similar to that on the WA U6F routes.
- Two of the four longest U6F routes available, I-40 and I-24, were already selected to represent rural divided roadway types. The analogous U6F sections of these routes could be included.
Based on the data from the 16 available U8F segments in Tennessee, the following observations were made:
- Nearly all of the TN U8F routes have a maximum traffic volume over 100,000 vehicles per day.
- Posted speed limits vary between 45 and 70 mph.
- The majority of the longest TN U8F routes have maximum truck percentages greater than 10%.
- Lane widths for the TN U8F routes are narrower than other TN urban divided roadways.
- The available U8F routes have similar outside shoulder widths.
- With the exception of SR 155 and SR 385 that have narrow medians, the majority of the longest TN U8F routes have similar median width variation.
- On average, the TN U8F routes have positive median barrier present on more than 90% of the U8F length.
- The TN U8F routes have rumble strips present on 50% or more of the U8F length.
- Both of the longest U8F routes, I-40 and I-24, were previously selected as rural divided roadway types. The analogous U8F sections of these routes could be included.
Based on the data from the nine available U10F segments in Tennessee, the following observations were made:
- All of the TN U10F routes have a maximum traffic volume over 100,000 vehicles per day and most are above 125,000 vehicles per day.
- Posted speed limits vary between 55 and 70 mph.
- The majority of the TN U10F routes have maximum truck percentages greater than 10%.
- Similar to the TN U8F routes, the lane widths for the TN U10F routes are narrower than other TN urban divided roadways.
- The available U10F routes have similar outside shoulder widths. I-40 has the largest outside shoulder width variation.
- Half of the available TN U10F routes have narrow medians—2 feet wide—while the other half have variable median widths up to approximately 50 feet in width.
- The TN U10F routes have positive median barrier present on nearly 100% of the U10F length.
- The TN U10F routes generally have rumble strips present on 50 percent or more of the U10F length.
- Two of the three longest U10F routes, I-40 and I-24, were previously selected as rural divided roadway types. The analogous U10F sections of these routes could be included.
These observations along with the available Tennessee urban divided roadway characteristics will be combined with corresponding data from the other two state agency partners. This combined data will be used to select representative U4D, U4F, U6F, U8F, and U10F routes from all three state agency partners.
Iowa Urban/Suburban Divided Roadways and Associated Characteristics
Table 81 summarizes the classification results of the available urban/suburban divided roadways in Iowa. In contrast to Washington and Tennessee, the mileage shown includes both directions of a given roadway; e.g., a 1-mile length of east/west divided roadway would appear as 2 miles in Table 81 as there is 1 mile in each direction. As such, the total mileage shown is approximately double that reported in Table 3 for the Iowa urban divided category. Similar to the other states, the vast majority of the available sections are U4D and U4F, a reasonable length of U6F, and a limited length of U8F and U10F sections.
Table 81. Available Iowa Urban/Suburban Divided Roadway Segments
| Urban Divided Roadway Type | Total Length [mi] | Unique Routes |
|---|---|---|
| U4D | 428.9 | 61 |
| U4F | 269.9 | 22 |
| U6F | 110.6 | 23 |
| U8F | 28.2 | 16 |
| U10F | 6.2 | 10 |
As the U8F and U10F subtypes in Iowa have less than 20 unique routes available, all of the available routes were examined for these subtypes. The 20 longest U4D routes are examined in more detail. Figure 30 summarizes the top 20 U4D roadways in Iowa ranked by total U4D length available. The available segment data was processed to combine adjacent U4D segments from the same route to determine the number of contiguous segments for each route. Note that approximately 80% (48 of 61 routes) have 10 miles or less total U4D length available (not shown in Figure 30).

Table 82 and Table 83 present information on the secondary variables (see Table 2) for the top 20 U4D routes shown in Figure 30. Table 82 summarizes the operational characteristics while Table 83 summarizes the geometric characteristics. For each route, the range of AADT, the range of large truck percentage, and the range of posted speed limit are shown in Table 82.
| Route Designation | AADT [veh/day] | Posted Speed Limit [mph] | Truck Percentage [%] | |||
|---|---|---|---|---|---|---|
| Minimum | Maximum | Minimum | Maximum | Minimum | Maximum | |
| 61 | 4,850 | 20,600 | 40 | 65 | 5.3 | 21.3 |
| 6 | 0 | 37,300 | 30 | 55 | 0.8 | 11.8 |
| 30 | 2,840 | 25,500 | 30 | 65 | 5.6 | 20.0 |
| 151 | 10,100 | 24,300 | 45 | 65 | 3.2 | 14.1 |
| 63 | 5,300 | 12,100 | 35 | 65 | 4.3 | 28.6 |
| 65 | 4,660 | 20,100 | 45 | 65 | 3.4 | 14.3 |
| 34 | 4,480 | 18,900 | 45 | 65 | 4.1 | 25.7 |
| 69 | 8,500 | 36,100 | 30 | 55 | 1.7 | 13.1 |
| 20 | 10,900 | 39,000 | 35 | 65 | 5.6 | 15.7 |
| 141 | 4,500 | 37,900 | 50 | 65 | 4.5 | 10.5 |
| 149 | 4,290 | 23,200 | 35 | 55 | 3.1 | 9.9 |
| 163 | 9,900 | 27,600 | 35 | 65 | 3.2 | 17.6 |
| Route Designation | AADT [veh/day] | Posted Speed Limit [mph] | Truck Percentage [%] | |||
|---|---|---|---|---|---|---|
| Minimum | Maximum | Minimum | Maximum | Minimum | Maximum | |
| 28 | 12,300 | 32,700 | 30 | 55 | 1.4 | 4.1 |
| 32 | 11,700 | 25,300 | 25 | 45 | 3.6 | 4.7 |
| 13 | 7,900 | 12,300 | 55 | 65 | 8.2 | 17.8 |
| 100 | 13,100 | 34,000 | 20 | 45 | 1.6 | 5.2 |
| 415 | 8,100 | 35,800 | 35 | 55 | 2.3 | 5.1 |
| 122 | 4,260 | 21,100 | 30 | 55 | 1.8 | 5.6 |
| 275 | 9,100 | 14,600 | 35 | 50 | 4.2 | 9.5 |
| 376 | 6,700 | 18,800 | 35 | 55 | 5.9 | 13.6 |
Geometric characteristics shown in Table 83 include lane width, outside shoulder width, median width, as well as percentage of positive median barrier and rumble strips present. The shoulder width data in Table 83 considers the outside shoulder width for both directions of the divided roadway. As the minimum shoulder width exceeded zero, minimum shoulder width was included in Table 83. The minimum and mean lane widths are reported based on a combination of the pavement width information and number of lanes present in the roadway table. The minimum and maximum median widths are reported for each route and, similar to Washington State, the median width variable in Iowa includes the left/inside shoulder widths. Positive barrier presence was determined using the median type variable, which indicates hard or grass surface and whether or not a barrier is present. For each route, the total length of sections with positive barrier were divided by the corresponding total U4D length for that route, as shown in Figure 30. The Iowa roadway data includes both right and left shoulder rumble strip data. The approximate rumble strip presence proportions in Table 83 do reflect the proportion of U4D length for each route that has shoulder rumble strips present. This percentage was computed by dividing the total shoulder rumble strip length for each route by the corresponding total shoulder edge length available—twice the U4D length reported in Figure 30 for the same route.
| Route Designation | Min / Mean Lane Width [ft] | Min / Mean / Max Outside Shoulder Width [ft] | Min / Max Median Width [ft] | Median Barrier Presence [%] | Approximate Rumble Strip Presence [%] |
|---|---|---|---|---|---|
| 61 | 9 / 12.1 | 0 / 7.6 / 10 | 3 / 100 | 0.2 | 50.7 |
| 6 | 9 / 12.4 | 0 / 5.1 / 10 | 2 / 63 | 5.0 | 0.1 |
| 30 | 9 / 12.8 | 0 / 8.4 / 10 | 3 / 101 | 0.0 | 10.7 |
| 151 | 8 / 12.1 | 0 / 9.6 / 10 | 12 / 103 | 0.0 | 25.5 |
| 63 | 10.5 / 12.3 | 0 / 5.3 / 10 | 2 / 68 | 0.0 | 0.0 |
| 65 | 9 / 12.0 | 0 / 9.4 / 10 | 6 / 176 | 0.0 | 58.1 |
| 34 | 12 / 13.1 | 0 / 8.8 / 10 | 3 / 82 | 0.0 | 31.8 |
| 69 | 8 / 12.6 | 0 / 2.2 / 10 | 3 / 50 | 1.3 | 8.2 |
| 20 | 12 / 12.5 | 0 / 8.1 / 10 | 8 / 64 | 8.1 | 27.7 |
| 141 | 12 / 12.0 | 10 / 10.4 / 12 | 2 / 132 | 0.0 | 0.0 |
| 149 | 12 / 12.4 | 0 / 6.4 / 10 | 4 / 50 | 0.0 | 0.0 |
| 163 | 12 / 12.4 | 0 / 5.6 / 10 | 2 / 82 | 0.0 | 0.3 |
| 28 | 12 / 12.9 | 0 / 4.1 / 10 | 3 / 28 | 27.6 | 0.0 |
| 32 | 12 / 12.4 | 10 / 10.0 / 10 | 4 / 40 | 39.9 | 0.0 |
| Route Designation | Min / Mean Lane Width [ft] | Min / Mean / Max Outside Shoulder Width [ft] | Min / Max Median Width [ft] | Median Barrier Presence [%] | Approximate Rumble Strip Presence [%] |
|---|---|---|---|---|---|
| 13 | 12 / 12.3 | 3 / 9.3 / 12 | 12 / 126 | 0.0 | 0.0 |
| 100 | 12 / 12.4 | 0 / 9.5 / 10 | 3 / 20 | 0.0 | 0.0 |
| 415 | 11 / 12.6 | 6 / 9.6 / 10 | 4 / 30 | 0.0 | 4.4 |
| 122 | 11 / 12.0 | 0 / 5.6 / 10 | 2 / 61 | 0.0 | 1.8 |
| 275 | 11 / 12.2 | 0 / 6.5 / 11 | 6 / 24 | 0.0 | 0.0 |
| 376 | 12 / 13.2 | 0 / 5.0 / 10 | 4 / 220 | 0.0 | 0.0 |
Figure 31 summarizes the top 20 U4F roadways in Iowa ranked by total U4F length available. The available segment data was processed to combine adjacent U4F segments from the same route to determine the number of contiguous segments for each route. Note that the other 2 available routes have 0.3 miles or less U4F classified length.
Table 84 and Table 85 present information on the secondary variables (see Table 2) for the top 20 U4F routes shown in Figure 31. Table 84 summarizes the operational characteristics while Table 85 summarizes the geometric characteristics. For each route, the range of AADT, the range of large truck percentage, and the range of posted speed limit are shown in Table 84.
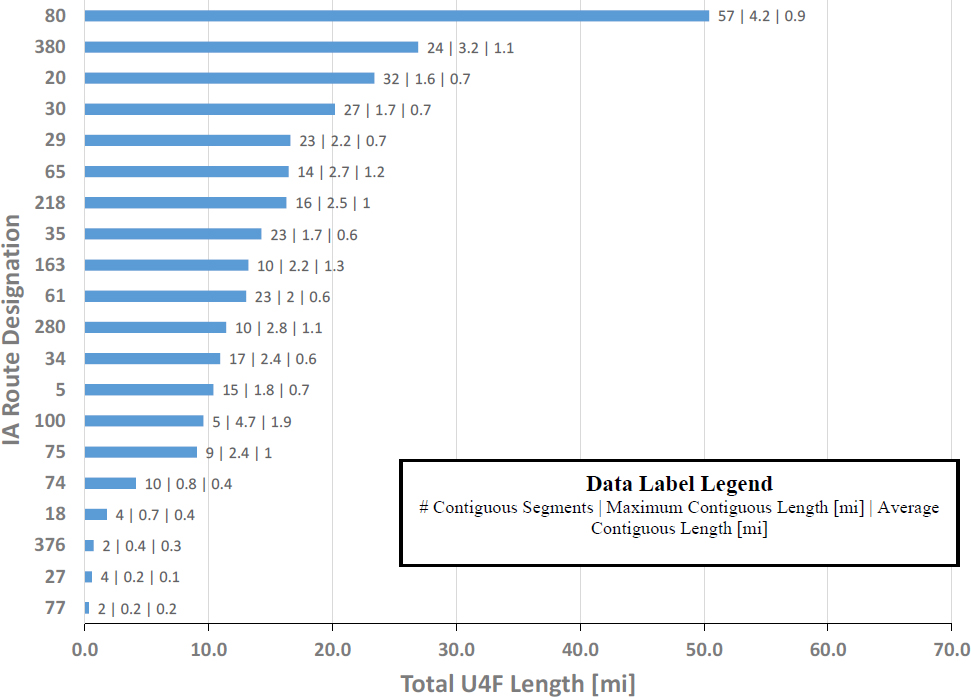
| Route Designation | AADT [veh/day] | Posted Speed Limit [mph] | Truck Percentage [%] | |||
|---|---|---|---|---|---|---|
| Minimum | Maximum | Minimum | Maximum | Minimum | Maximum | |
| 80 | 27,300 | 100,300 | 55 | 70 | 14.8 | 34.0 |
| 380 | 24,700 | 59,800 | 55 | 70 | 11.7 | 19.1 |
| 20 | 5,600 | 30,700 | 65 | 65 | 10.1 | 26.4 |
| 30 | 8,400 | 32,400 | 55 | 65 | 6.5 | 18.9 |
| 29 | 12,800 | 41,300 | 55 | 70 | 10.9 | 26.1 |
| 65 | 17,300 | 30,800 | 65 | 65 | 8.8 | 14.3 |
| 218 | 7,600 | 35,200 | 55 | 65 | 4.8 | 25.6 |
| 35 | 19,300 | 66,100 | 65 | 70 | 10.2 | 33.0 |
| 163 | 5,200 | 11,500 | 65 | 65 | 13.7 | 22.3 |
| 61 | 2,580 | 36,500 | 55 | 65 | 7.7 | 22.9 |
| 280 | 4,110 | 25,900 | 65 | 65 | 20.7 | 49.2 |
| 34 | 7,300 | 17,900 | 30 | 65 | 9.4 | 23.7 |
| 5 | 2,630 | 30,600 | 55 | 65 | 5.9 | 16.7 |
| 100 | 0 | 36,300 | 45 | 65 | 1.2 | 2.0 |
| 75 | 10,300 | 20,300 | 65 | 65 | 11.4 | 14.8 |
| 74 | 23,800 | 72,000 | 55 | 65 | 3.2 | 8.7 |
| 18 | 8,300 | 11,500 | 65 | 65 | 23.3 | 37.4 |
| 376 | 6,500 | 8,300 | 55 | 55 | 8.3 | 13.6 |
| 27 | 16,500 | 25,300 | 55 | 55 | 6.4 | 10.6 |
| 77 | 27,400 | 28,300 | 35 | 40 | 3.4 | 3.4 |
Geometric characteristics shown in Table 85 include lane width, outside shoulder width, median width, as well as percentage of positive median barrier and rumble strips present. The shoulder width data in Table 85 considers the outside shoulder width for both directions of the divided roadway. As the minimum shoulder width exceeded zero, minimum shoulder width was included in Table 85. The minimum and mean lane widths are reported based on a combination of the pavement width information and number of lanes present in the roadway table. The minimum and maximum median widths are reported for each route and, similar to Washington State, the median width variable in Iowa includes the left/inside shoulder widths. Positive barrier presence was determined using the median type variable, which indicates hard or grass surface and whether or not a barrier is present. For each route, the total length of sections with positive barrier were divided by the corresponding total U4F length for that route, as shown in Figure 31. The Iowa roadway data includes both right and left shoulder rumble strip data. The approximate rumble strip presence proportions in Table 85 do reflect the proportion of U4F length for each route that has shoulder rumble strips present. This percentage was computed by dividing the total shoulder rumble strip length for each route by the corresponding total shoulder edge length available—twice the U4F length reported in Figure 31 for the same route.
| Route Designation | Min / Mean Lane Width [ft] | Min / Mean / Max Outside Shoulder Width [ft] | Min / Max Median Width [ft] | Median Barrier Presence [%] | Approximate Rumble Strip Presence [%] |
|---|---|---|---|---|---|
| 80 | 12 / 12.2 | 0 / 9.5 / 12 | 4 / 540 | 83.6 | 96.2 |
| 380 | 12 / 12.0 | 0 / 9.9 / 10 | 40 / 64 | 41.6 | 71.5 |
| 20 | 8 / 12.4 | 6 / 9.5 / 10 | 50 / 64 | 0.0 | 56.5 |
| 30 | 12 / 13.1 | 6 / 9.4 / 10 | 20 / 64 | 0.0 | 24.9 |
| 29 | 12 / 15.0 | 0 / 11.0 / 40 | 10 / 332 | 39.2 | 99.5 |
| 65 | 12 / 12.4 | 10 / 10.0 / 10 | 50 / 64 | 0.0 | 36.0 |
| 218 | 12 / 13.6 | 8 / 9.9 / 10 | 16 / 68 | 1.6 | 4.9 |
| 35 | 12 / 12.4 | 8 / 9.4 / 12 | 34 / 82 | 38.9 | 66.4 |
| 163 | 12 / 12.0 | 10 / 10.0 / 10 | 50 / 64 | 0.0 | 0.0 |
| 61 | 12 / 12.7 | 1 / 9.5 / 10 | 4 / 150 | 28.1 | 1.8 |
| 280 | 12 / 12.0 | 0 / 8.8 / 10 | 5 / 60 | 0.0 | 90.4 |
| 34 | 12 / 14.1 | 6 / 9.3 / 10 | 8 / 146 | 8.5 | 41.3 |
| 5 | 8 / 12.2 | 6 / 9.2 / 10 | 64 / 84 | 0.0 | 44.0 |
| 100 | 12 / 14.2 | 6 / 9.8 / 10 | 6 / 64 | 76.0 | 97.5 |
| 75 | 12 / 12.0 | 10 / 10.0 / 10 | 52 / 64 | 0.0 | 94.4 |
| 74 | 10 / 12.4 | 0 / 4.5 / 10 | 1 / 50 | 0.0 | 73.7 |
| 18 | 12 / 12.0 | 10 / 10.0 / 10 | 68 / 68 | 0.0 | 66.9 |
| 376 | 12 / 18.9 | 10 / 10.0 / 10 | 15 / 220 | 0.0 | 0.0 |
| 27 | 12 / 16.8 | 8 / 9.0 / 10 | 16 / 20 | 99.2 | 0.0 |
| 77 | 15 / 16.6 | 0 / 0.5 / 4 | 6 / 22 | 0.0 | 0.0 |
Figure 32 summarizes the top 20 U6F roadways in Iowa ranked by total U6F length available. The available segment data was processed to combine adjacent U6F segments from the same route to determine the number of contiguous segments for each route. Note that the other three available routes have approximately 0.1 miles or less U6F classified length.
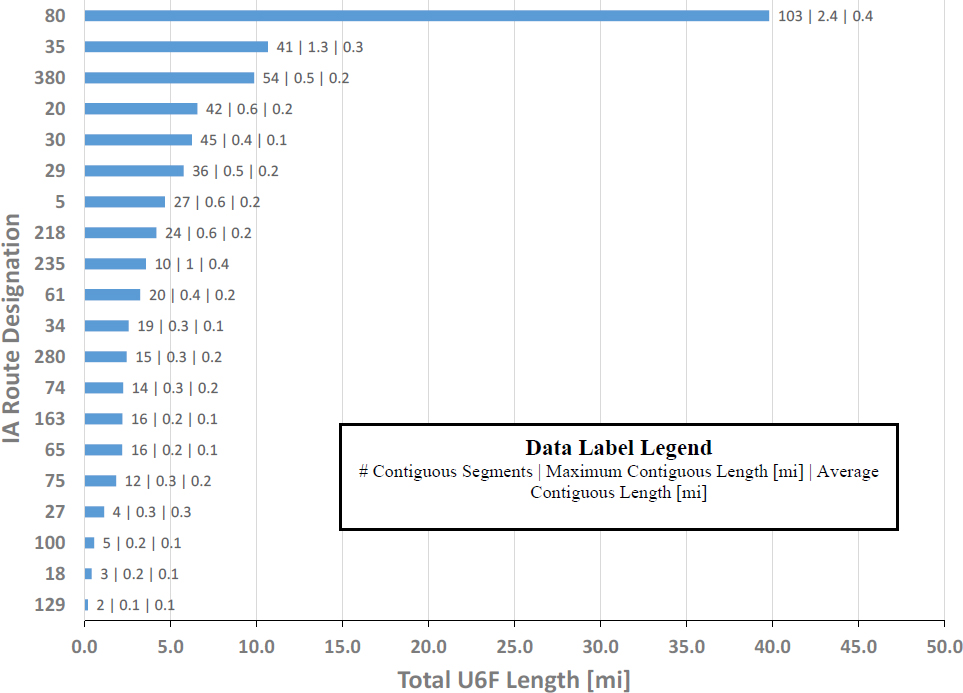
| Route Designation | AADT [veh/day] | Posted Speed Limit [mph] | Truck Percentage [%] | |||
|---|---|---|---|---|---|---|
| Minimum | Maximum | Minimum | Maximum | Minimum | Maximum | |
| 80 | 24,900 | 121,400 | 55 | 70 | 4.2 | 35.7 |
| 35 | 16,500 | 83,800 | 65 | 70 | 9.2 | 33.0 |
| 380 | 8,900 | 88,100 | 55 | 70 | 7.6 | 19.1 |
| 20 | 5,600 | 33,200 | 65 | 65 | 3.2 | 26.4 |
| 30 | 5,700 | 33,400 | 55 | 65 | 6.5 | 26.7 |
| 29 | 12,800 | 69,600 | 55 | 65 | 10.9 | 22.3 |
| 5 | 2,630 | 33,200 | 55 | 65 | 5.9 | 16.7 |
| 218 | 7,600 | 37,200 | 55 | 65 | 7.7 | 25.6 |
| 235 | 68,900 | 128,100 | 55 | 65 | 4.4 | 16.5 |
| 61 | 6,200 | 42,200 | 55 | 65 | 8.0 | 25.4 |
| 34 | 7,000 | 17,900 | 35 | 65 | 9.4 | 24.9 |
| 280 | 16,500 | 24,400 | 55 | 65 | 20.7 | 31.0 |
| 74 | 23,800 | 59,700 | 55 | 65 | 3.4 | 8.7 |
| 163 | 4,960 | 12,100 | 65 | 65 | 12.7 | 22.5 |
| 65 | 17,000 | 30,800 | 65 | 65 | 8.8 | 14.5 |
| 75 | 10,600 | 24,400 | 65 | 65 | 10.6 | 14.8 |
| 27 | 16,000 | 21,600 | 55 | 55 | 6.9 | 8.1 |
| Route Designation | AADT [veh/day] | Posted Speed Limit [mph] | Truck Percentage [%] | |||
|---|---|---|---|---|---|---|
| Minimum | Maximum | Minimum | Maximum | Minimum | Maximum | |
| 100 | 15,400 | 36,300 | 45 | 55 | 0.7 | 2.0 |
| 18 | 8,300 | 11,500 | 65 | 65 | 23.6 | 37.4 |
| 129 | 18,000 | 23,600 | 55 | 55 | 7.5 | 9.1 |
Table 86 and Table 87 present information on the secondary variables (see Table 2) for the top 20 U6F routes shown in Figure 32. Table 86 summarizes the operational characteristics while Table 87 summarizes the geometric characteristics. For each route, the range of AADT, the range of large truck percentage, and the range of posted speed limit are shown in Table 86.
Geometric characteristics shown in Table 87 include lane width, outside shoulder width, median width, as well as percentage of positive median barrier and rumble strips present. The shoulder width data in Table 87 considers the outside shoulder width for both directions of the divided roadway. As the minimum shoulder width exceeded zero, minimum shoulder width was included in Table 87. The minimum and mean lane widths are reported based on a combination of the pavement width information and number of lanes present in the roadway table. The minimum and maximum median widths are reported for each route and, similar to Washington State, the median width variable in Iowa includes the left/inside shoulder widths. Positive barrier presence was determined using the median type variable, which indicates hard or grass surface and whether or not a barrier is present. For each route, the total length of sections with positive barrier were divided by the corresponding total U6F length for that route, as shown in Figure 32. The Iowa roadway data includes both right and left shoulder rumble strip data. The approximate rumble strip presence proportions in Table 87 do reflect the proportion of U6F length for each route that has shoulder rumble strips present. This percentage was computed by dividing the total shoulder rumble strip length for each route by the corresponding total shoulder edge length available—twice the U6F length reported in Figure 32 for the same route.
| Route Designation | Min / Mean Lane Width [ft] | Min / Mean / Max Outside Shoulder Width [ft] | Min / Max Median Width [ft] | Median Barrier Presence [%] | Approximate Rumble Strip Presence [%] |
|---|---|---|---|---|---|
| 80 | 9 / 12.2 | 0 / 10.4 / 22 | 4 / 275 | 84.9 | 70.6 |
| 35 | 9 / 12.0 | 6 / 10.1 / 12 | 34 / 82 | 36.4 | 74.8 |
| 380 | 11 / 11.7 | 10 / 10.0 / 10 | 40 / 64 | 61.2 | 62.3 |
| 20 | 10 / 13.2 | 6 / 9.5 / 10 | 15 / 64 | 17.5 | 78.9 |
| 30 | 10 / 12.3 | 4 / 7.8 / 10 | 20 / 64 | 0.0 | 26.7 |
| 29 | 10 / 13.2 | 0 / 8.9 / 12 | 4 / 316 | 22.4 | 96.5 |
| 5 | 11 / 14.8 | 6 / 7.6 / 8 | 64 / 84 | 0.0 | 60.2 |
| 218 | 10 / 12.8 | 8 / 9.5 / 10 | 16 / 113 | 29.1 | 43.0 |
| 235 | 12 / 12.1 | 0 / 8.8 / 13 | 20 / 50 | 100.0 | 1.7 |
| 61 | 11 / 13.1 | 6 / 9.4 / 10 | 9 / 150 | 7.4 | 7.2 |
| 34 | 10 / 10.8 | 6 / 9.7 / 10 | 18 / 146 | 9.4 | 30.0 |
| 280 | 10 / 11.0 | 10 / 10.0 / 10 | 30 / 60 | 0.0 | 99.9 |
| 74 | 11 / 11.3 | 6 / 9.6 / 10 | 42 / 50 | 0.0 | 100.0 |
| 163 | 10 / 12.6 | 10 / 10.0 / 10 | 50 / 64 | 0.0 | 0.0 |
| Route Designation | Min / Mean Lane Width [ft] | Min / Mean / Max Outside Shoulder Width [ft] | Min / Max Median Width [ft] | Median Barrier Presence [%] | Approximate Rumble Strip Presence [%] |
|---|---|---|---|---|---|
| 65 | 11 / 13.1 | 8 / 9.8 / 10 | 64 / 64 | 0.0 | 13.2 |
| 75 | 10 / 13.3 | 6 / 9.0 / 10 | 52 / 64 | 0.0 | 82.5 |
| 27 | 12 / 14.6 | 6 / 8.8 / 10 | 16 / 16 | 99.8 | 12.6 |
| 100 | 10 / 12.1 | 10 / 10.0 / 10 | 6 / 16 | 84.9 | 85.8 |
| 18 | 13 / 14.1 | 8 / 9.0 / 10 | 68 / 68 | 0.0 | 63.0 |
| 129 | 11 / 11.3 | 10 / 10.0 / 10 | 15 / 15 | 99.0 | 0.0 |
Figure 33 summarizes the 16 available U8F roadways in Iowa ranked by total U8F length. The available segment data was processed to combine adjacent U8F segments from the same route to determine the number of contiguous segments for each route.
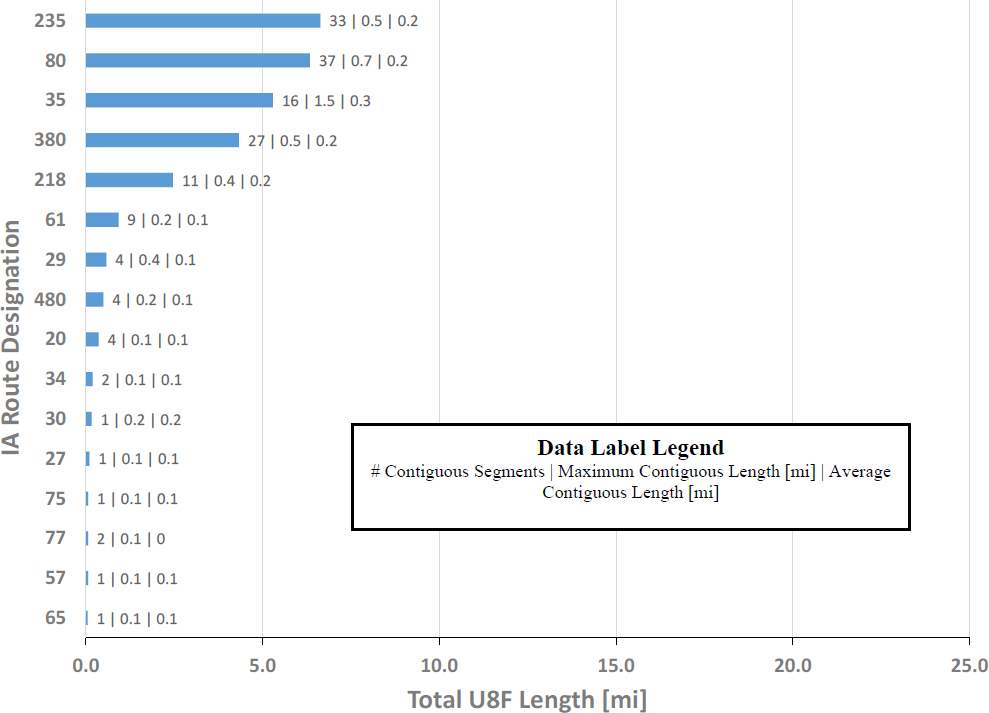
Table 88 and Table 89 present information on the secondary variables (see Table 2) for 9 of the 16 available U8F routes shown in Figure 33. As routes 65, 57, 77, 75, 27, 30, and 34 have one or two segments and less than 0.25 mile of U8F length, these routes were not further considered for selection. Note that Table 88 summarizes the operational characteristics while Table 89 summarizes the geometric characteristics. For each route, the range of AADT, the range of large truck percentage, and the range of posted speed limit are shown in Table 88.
Table 88. Operational Characteristics of the Urban/Suburban Divided Freeway (U8F) Routes in Iowa
| Route Designation | AADT [veh/day] | Posted Speed Limit [mph] | Truck Percentage [%] | |||
|---|---|---|---|---|---|---|
| Minimum | Maximum | Minimum | Maximum | Minimum | Maximum | |
| 235 | 68,900 | 139,000 | 55 | 65 | 4.4 | 11.1 |
| 80 | 36,000 | 121,400 | 65 | 65 | 11.6 | 34.4 |
| 35 | 25,200 | 89,800 | 65 | 65 | 9.2 | 21.6 |
| 380 | 16,100 | 97,700 | 55 | 60 | 7.1 | 17.4 |
| 218 | 11,300 | 34,700 | 35 | 55 | 7.7 | 10.6 |
| 61 | 6,200 | 44,000 | 55 | 65 | 8.4 | 25.4 |
| 29 | 25,600 | 42,000 | 55 | 65 | 11.0 | 20.4 |
| 480 | 20,300 | 50,000 | 55 | 55 | 2.5 | 6.4 |
| 20 | 9,100 | 27,400 | 65 | 65 | 10.6 | 23.1 |
Geometric characteristics shown in Table 89 include lane width, outside shoulder width, median width, as well as percentage of positive median barrier and rumble strips present. The shoulder width data in Table 89 considers the outside shoulder width for both directions of the divided roadway. As the minimum shoulder width exceeded zero, minimum shoulder width was included in Table 89. The minimum and mean lane widths are reported based on a combination of the pavement width information and number of lanes present in the roadway table. The minimum and maximum median widths are reported for each route and, similar to Washington State, the median width variable in Iowa includes the left/inside shoulder widths. Positive barrier presence was determined using the median type variable, which indicates hard or grass surface and whether or not a barrier is present. For each route, the total length of sections with positive barrier were divided by the corresponding total U8F length for that route, e.g. shown in Figure 33. The Iowa roadway data includes both right and left shoulder rumble strip data. The approximate rumble strip presence proportions in Table 89 do reflect the proportion of U8F length for each route that has shoulder rumble strips present. This percentage was computed by dividing the total shoulder rumble strip length for each route by the corresponding total shoulder edge length available—twice the U8F length reported in Figure 33 for the same route.
Table 89. Geometric Characteristics of the Urban/Suburban Divided Freeway (U8F) Routes in Iowa
| Route Designatio n | Min / Mean Lane Width [ft] | Min / Mean / Max Outside Shoulder Width [ft] | Min / Max Median Width [ft] | Median Barrier Presence [%] | Approximate Rumble Strip Presence [%] |
|---|---|---|---|---|---|
| 235 | 10 / 12.4 | 0 / 7.6 / 13 | 20 / 35 | 96.4 | 0.0 |
| 80 | 10 / 11.8 | 6 / 10.8 / 12 | 26 / 65 | 91.2 | 52.4 |
| 35 | 10 / 12.7 | 8 / 11.9 / 12 | 34 / 50 | 88.5 | 16.2 |
| 380 | 11 / 11.7 | 10 / 10.0 / 10 | 14 / 60 | 75.6 | 35.3 |
| 218 | 12 / 14.0 | 0 / 9.1 / 10 | 16 / 250 | 81.9 | 79.6 |
| 61 | 10 / 11.0 | 6 / 9.3 / 10 | 8 / 64 | 71.2 | 0.0 |
| 29 | 10.5 / 12.6 | 0 / 8.3 / 12 | 14 / 50 | 24.0 | 84.0 |
| 480 | 12 / 12.0 | 0 / 5.7 / 10 | 2 / 4 | 0.0 | 0.0 |
| 20 | 10 / 11.7 | 6 / 8.8 / 10 | 64 / 64 | 0.0 | 100.0 |
Figure 34 summarizes the ten available U10F roadways in Iowa ranked by total U10F length. The available segment data was processed to combine adjacent U10F segments from the same route to determine the number of contiguous segments for each route.
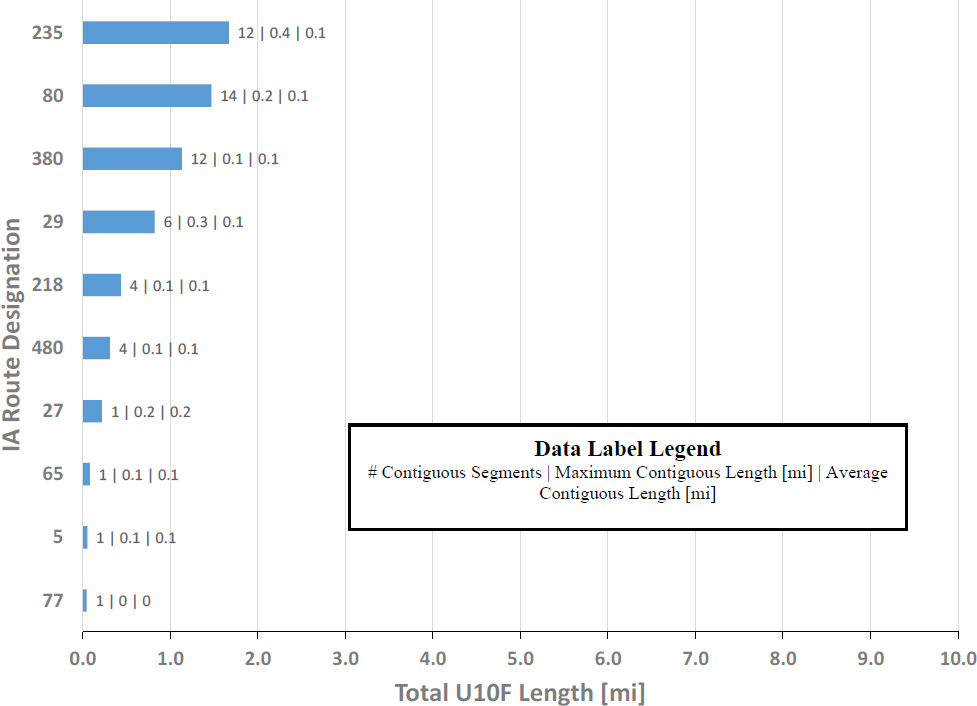
Table 90 and Table 91 present information on the secondary variables (see Table 2) for six of the 10 available U10F routes shown in Figure 34. As routes 27, 65, 5, and 77 have one segment and less than 0.25 mile of U10F length, these routes were not further considered for selection. Note that Table 90 summarizes the operational characteristics while Table 91 summarizes the geometric characteristics. For each route, the range of AADT, the range of large truck percentage, and the range of posted speed limit are shown in Table 90.
Table 90. Operational Characteristics of the Urban/Suburban Divided Freeway (U10F) Routes in Iowa
| Route Designation | AADT [veh/day] | Posted Speed Limit [mph] | Truck Percentage [%] | |||
|---|---|---|---|---|---|---|
| Minimum | Maximum | Minimum | Maximum | Minimum | Maximum | |
| 235 | 122,900 | 139,000 | 55 | 60 | 4.6 | 4.9 |
| 80 | 28,000 | 118,500 | 65 | 65 | 13.6 | 31.0 |
| 380 | 25,200 | 91,100 | 55 | 60 | 7.3 | 13.1 |
| 29 | 22,100 | 42,000 | 55 | 65 | 14.8 | 20.4 |
| 218 | 20,900 | 29,100 | 55 | 55 | 7.9 | 10.4 |
| 480 | 20,300 | 50,000 | 55 | 55 | 2.5 | 6.4 |
Geometric characteristics shown in Table 91 include lane width, outside shoulder width, median width, as well as percentage of positive median barrier and rumble strips present. The shoulder width data in Table 91 considers the outside shoulder width for both directions of the divided roadway. As the minimum shoulder width exceeded zero, minimum shoulder width was included in Table 91. The minimum and mean lane widths are reported based on a combination of the pavement width information and number of lanes present in the roadway table. The minimum and maximum median widths are reported for each route and, similar to Washington State, the median width variable in Iowa includes the left/inside shoulder widths. Positive barrier presence was determined using the median type variable, which indicates hard or grass surface and whether or not a barrier is present. For each route, the total length of sections with positive barrier were divided by the corresponding total U10F length for that route, as shown in Figure 34. The Iowa roadway data includes both right and left shoulder rumble strip data. The approximate rumble strip presence proportions in Table 91 do reflect the proportion of U10F length for each route that has shoulder rumble strips present. This percentage was computed by dividing the total shoulder rumble strip length for each route by the corresponding total shoulder edge length available—twice the U10F length reported in Figure 34 for the same route.
Table 91. Geometric Characteristics of the Urban/Suburban Divided Freeway (U10F) Routes in Iowa
| Route Designation | Min / Mean Lane Width [ft] | Min / Mean / Max Outside Shoulder Width [ft] | Min / Max Median Width [ft] | Median Barrier Presence [%] | Approximate Rumble Strip Presence [%] |
|---|---|---|---|---|---|
| 235 | 10 / 11.5 | 0 / 5.9 / 10 | 20 / 35 | 100.0 | 0.0 |
| 80 | 12 / 13.0 | 9 / 11.1 / 18 | 30 / 540 | 100.0 | 39.5 |
| 380 | 10.4 / 12.2 | 10 / 10.0 / 10 | 14 / 50 | 95.5 | 33.6 |
| 29 | 10 / 10.9 | 10 / 11.4 / 12 | 16 / 50 | 28.0 | 100.0 |
| 218 | 12.4 / 12.8 | 8 / 9.2 / 10 | 24 / 24 | 99.0 | 100.0 |
| 480 | 11.6 / 11.6 | 0 / 2.9 / 10 | 4 / 4 | 0.0 | 0.0 |
Based on the data from the available U4D segments in Iowa, the following observations were made:
- The routes with the largest traffic volume variation are SR 6 followed by SR 141. Both have a maximum daily traffic volume in excess of 35,000 vehicles per day. Generally, the Iowa U4D routes have the lowest traffic volume of the three participant state agencies.
- Compared to the Washington State U4D routes, the Iowa U4D routes generally have a wider variation posted speed limit.
- Similar to Washington and Tennessee, the majority of the Iowa U4D routes have maximum truck traffic percentage at or below 20%.
- In general, the Iowa U4D route lane widths are between the widths of the TN U4D and WA U4D routes.
- The IA U4D routes have maximum outside shoulder widths between 10 and 12 feet.
- Approximately three-fourths of the IA U4D routes have maximum median widths of 40 feet or more. SR 376 and SR 65 have the largest median width range.
- Similar to Tennessee, all but two of the longest available IA U4D routes have positive median barriers along 25% or less of the roadway length.
- The vast majority of the routes have 50% or less presence of rumble strips.
- Two of the three longest available IA U4D routes, SR 6, and SR 30, were previously selected to be included in the study to represent other roadway types.
Based on the data from the available U4F segments in Iowa, the following observations are made:
- As expected, the minimum and maximum traffic volumes for the U4F routes (on average) are higher than those for the U4D routes. The IA U4F traffic volumes are less than the volumes for the U4F routes in the other two states.
- The routes with the largest traffic volume variation are I-80 followed by I-40. Both have a maximum daily traffic volume in excess of 70,000 vehicles per day.
- Most of the U4F routes have a relatively small variation in posted speed limit.
- The IA U4F routes have a similar proportion of truck traffic as the TN U4F routes.
- The average IA U4F lane width is at least 12 feet.
- The IA U4F routes (on average) have a slightly wider outside shoulder width than the WA U4F routes and a slightly narrower outside shoulder width than the TN U4F routes.
- The median widths for the IA U4F routes are similar to the U4F routes in the other two states.
- Compared to the WA U4F routes, median barriers are less prevalent on the IA U4F routes. More than half of the longest IA U4F routes have median barrier on less than one-fourth of the U4F length.
- The longest U4F route available, I-80, was previously selected as the representative R4F route. Also, I-35 and SR 30 have also been selected to represent other roadway types. The analogous U4F sections of these routes could be included.
Based on the data from the available U6F segments in Iowa, the following observations were made:
- I-80 has by far the longest available U6F length.
- As expected, the minimum and maximum traffic volumes for the U6F routes (on average) are higher than those for the IA U4D and U4F routes. Compared to the available WA and TN U6F routes, the IA U6F routes generally have a lower traffic volume with only two of the longest U6F routes having maximum traffic volumes over 100,000.
- The IA U6F routes have similar variation in posted speed limit to the TN U6F routes.
- All but 4 of the longest IA U6F routes have a maximum truck traffic of 10% or more.
- The IA U6F routes have similar mean lane widths to the WA U6F routes but narrower minimum lane widths.
- Similar to the U6F routes in the other two states, the IA U6F routes have mean outside shoulder widths between 7 and 11 feet.
- With the exception of SR 65, SR 18, I-129, and SR 27, the IA U6F routes have a relatively wide variation in median width.
- Positive median barrier presence on the IA U6F routes is less prevalent than on the U6F routes in the other two states.
- Both of the longest U6F routes available, I-80 and I-35, were already selected to represent rural divided roadway types. The analogous U6F sections of these routes could be included. Similarly, SR 18 and SR 30 were previously selected to represent other roadway types and the analogous U6F sections could be included.
Based on the data from the 16 available U8F segments in Iowa, the following observations were made:
- Similar to the other IA urban divided routes, the IA U8F routes generally have lower traffic volumes than the corresponding routes in the other two states. The two longest IA U8F routes have maximum traffic volumes in excess of 100,000 vehicles per day.
- With the exception of SR 218, all posted speed limits are between 55 and 65 mph.
- All but one of the longest IA U8F routes have maximum truck percentages greater than 10%.
- Lane widths for the IA U8F routes are similar to the IA U6F routes and generally narrower than the IA U4F routes.
- The available IA U8F routes have similar outside shoulder widths to the other IA urban divided roadway types.
- With the exception of I-480, the IA U8F routes have narrower maximum median widths than the U8F roadways from the other two states.
- On average, the TN U8F routes have positive median barrier present on more than 50% of the U8F length. Six of the available routes have median barrier present on more than two-thirds of the U8F length.
- Compared to the TN U8F routes, the IA U8F routes generally have less rumble strips present.
- Two of the three longest U8F routes, I-80 and I-35, were previously selected as rural divided roadway types. The analogous U8F sections of these routes could be included. Similarly, SR 218 was previously selected.
Based on the data from the ten available U10F segments in Iowa, the following observations were made:
- The IA U10F routes available are shorter than the TN U10F routes.
- Two of the available IA U10F have maximum traffic volumes in excess of 100,000 vehicles per day but in general, the traffic volumes are lower than those on the TN U10F routes.
- Posted speed limits vary between 55 and 65 mph.
- The IA U10F routes have similar truck traffic percentages to the TN U10F routes.
- On average, the IA U10F routes have wider lanes than the TN U10F routes.
- The available U10F routes have slightly narrower outside shoulder widths compared to the TN U10F routes.
- The available IA U10F routes generally have wider medians than the TN U10F routes.
- With the exception of two routes, the IA U10F routes have positive median barrier present on nearly all of the U10F length.
- Two of the available IA U10F routes have shoulder rumble strips present on along the entire length with the remaining routes having less than 50% rumble strip presence.
- I-80 and SR 218 were previously selected to represent other roadway types. The analogous U10F sections of these routes could be included.
These observations along with the available Iowa urban divided roadway characteristics will be combined with corresponding data from the other two state agency partners. This combined data will be used to select representative U4D, U4F, U6F, U8F, and U10F routes from all three state agency partners.
Urban/Suburban Divided Roadway Selection
Urban 4-lane divided arterials (U4D)
The available U4D roadway characteristics (e.g. secondary variables from Table 2) from each state agency partner combined with the general observations were considered to select representative U4D routes from each state. The selected U4D routes are shown in Table 92. Note that the routes denoted with an asterisk (*) indicate that the route has portions classified as U4D but has been selected to represent a different roadway type category.
Table 92. Selected U4D Routes and Associated Characteristics
| State | Route | Length [mi] | Max AADT [vpd] / Truck Percent [%] | Min / Max Speed Limit [mph] | Mean/Max Shoulder Width [ft] | Min / Max Median Width [ft] | Barrier / Rumble Presence [%] |
|---|---|---|---|---|---|---|---|
| WA | SR 12 | 28.5 | 23,657 / 21 | 20 / 60 | 7.8 / 20 | 5 / 110 | 57.7 / 78 |
| SR 99* | 16.1 | 82,564 / 9 | 40 / 60 | 0 / 4 | 4 / 24 | 14.9 / 0 | |
| SR 2* | 7.0 | 29,907 / 9 | 30 / 60 | 7.3 / 10 | 2 / 60 | 52.7 / 79 | |
| SR 522* | 1.9 | 45,680 / 3 | 35 / 35 | 0.6 / 8 | 2 / 12 | 7.6 / 29 | |
| TN | SR 1* | 84.0 | 44,340 / 31 | 30 / 65 | 7.5 / 24 | 2 / 160 | 4.6 / 23 |
| SR 34* | 54.0 | 34,650 / 64 | 25 / 55 | 9.0 / 24 | 2 / 150 | 2.8 / 28 | |
| SR 15* | 28.3 | 63,660 / 18 | 45 / 70 | 9.8 / 16 | 2 / 42 | 12.3 / 70 | |
| IA | SR 28 | 10.1 | 32,700 / 4.1 | 30 / 55 | 4.1 / 10 | 3 / 28 | 27.6 / 0 |
| SR 6* | 37.2 | 37,300 / 11.8 | 30 / 55 | 5.1 / 10 | 2 / 63 | 5 / 0.1 | |
| SR 30* | 37 | 25,500 / 20 | 30 / 65 | 8.4 / 10 | 3 / 101 | 0 / 10.7 |
*Note: Denotes route selected based on a different roadway type category
WA SR 99 and SR 2, two of the five longest U4D routes in Washington, were already selected as representative routes for other roadway types. SR 99 has the largest variation in traffic volume, a relatively narrow median width, and no rumble strips. SR 2 has a smaller traffic volume variation but a wider variation in posted speed limit and median width than SR 99 as well as a higher proportion of median barrier and rumble strips. SR 522 has a medium traffic volume, the lowest posted speed limit, and the narrowest median. To balance the characteristics of these already selected routes and provide additional U4D length, SR 12 was selected as the representative
Washington U4D route. WA SR 12 is the longest available U4D route, has a wide variation in posted speed limit, higher maximum proportion of truck traffic than the other routes, and the widest variation in median width. In Tennessee, routes selected to represent other roadway types, SR 1 (2U/3T), SR 34 (R4D) and SR 15 (RUMLH), comprise three of the four longest U4D routes. These three routes combined have a maximum traffic volume between 30,000 and 60,000 vehicles per day as well as large variations in posted speed limit and truck percentage. In terms of geometric characteristics, SR 15 has the narrowest median and highest proportion of median barrier and rumble strips. Given these varied characteristics and a total U4D length of more than 150 miles for these routes, no additional TN U4D route was selected. In Iowa, SR 6 (2U/3T) and SR 30 (RU2L2W) were already selected to represent other roadway types and are the second and third longest U4D routes, respectively. Both have maximum traffic volumes greater than 25,000 vehicles per day, a wide range of posted speed limit, similar shoulder widths, and very few median barrier and rumble strips. SR 28 was selected as the representative U4D route given its relatively significant median barrier presence (compared to the other IA U4D routes) and narrow median width.
Urban 4-lane divided freeway (U4F)
The available U4F roadway characteristics (secondary variables from Table 2) from each state agency partner combined with the general observations were considered to select representative U4F routes from each state. The selected U4F routes are shown in Table 93. Note that the routes denoted with an asterisk (*) indicate the route has portions classified as U4F but has been selected to represent a different roadway type category.
Table 93. Selected U4F Routes and Associated Characteristics
| State | Route | Length [mi] | Max AADT [vpd] / Truck Percent [%] | Min / Max Speed Limit [mph] | Mean/Max Shoulder Width [ft] | Min / Max Median Width [ft] | Barrier / Rumble Presence [%] |
|---|---|---|---|---|---|---|---|
| WA | SR 167 | 16.4 | 126,235 / 20 | 30 / 60 | 8.5 / 12 | 16 / 88 | 85.6 / 0 |
| I-5* | 38.9 | 124,494 / 34 | 25 / 70 | 8.8 / 10 | 5 / 100 | 84.8 / UNK | |
| I-90* | 20.8 | 75,257 / 20 | 30 / 70 | 8.8 / 10 | 12 / 76 | 65.2 / UNK | |
| SR 522* | 10.4 | 93,453 / 7 | 35 / 60 | 8.7 / 10 | 4 / 50 | 76.7 / 29 | |
| SR 2* | 5.3 | 78,176 / 11 | 50 / 60 | 7.2 / 16 | 6 / 750 | 44.2 / 79 | |
| TN | SR 386 | 11.6 | 81,290 / 4 | 45 / 70 | 10.9 / 12 | 2 / 200 | 96.0 / 35 |
| I-40* | 85.9 | 178,740 / 46 | 55 / 70 | 10.9 / 18 | 2 / 300 | 57.0 / 59 | |
| I-24* | 41.4 | 154,260 / 43 | 55 / 70 | 10.7 / 20 | 2 / 700 | 14.8 / 72 | |
| IA | I-29 | 16.6 | 41,300 / 26.1 | 55 / 70 | 11.0 / 40 | 10 / 332 | 39.2 / 99.5 |
| I-80* | 50.4 | 100,300 / 34 | 55 / 70 | 9.5 / 12 | 4 / 540 | 83.6 / 96.2 | |
| SR 30* | 20.2 | 32,400 / 18.9 | 55 / 65 | 9.4 / 10 | 20 / 64 | 0 / 24.9 | |
| SR 218* | 16.3 | 35,200 / 25.6 | 55 / 65 | 9.9 / 10 | 16 / 68 | 1.6 / 4.9 | |
| I-35* | 14.3 | 66,100 / 33.0 | 65 / 70 | 9.4 / 12 | 34 / 82 | 38.9 / 66.4 | |
| SR 18* | 1.8 | 11,500 / 37.4 | 65 / 65 | 10 / 10 | 68 / 68 | 0 / 66.9 |
*Note: Denotes route selected based on a different roadway type category
Washington I-5 (R6F) and I-90 (R4F) were selected to represent other roadway types and are the second and third longest U4F routes, respectively. Both routes have a wide range of traffic
volumes and posted speed limit, similar outside shoulder widths, and a significant portion with median barrier present. Also, SR 2 (RU2L2W) and SR 522 (4U/5T) were selected to represent other roadway types and have U4F classified portions. Both state routes have a wide variation in traffic volume and lower truck percentages than I-5 and I-90. SR 2 has a very wide variation in median width and a smaller proportion of median barrier than the other U4D routes. SR 167 was selected as the representative U4F route as it has a wide variation in traffic volume and posted speed limit, reasonable length, and no rumble strips. In Tennessee, I-40 (R4F) and I-24 (R6F) were previously selected to represent other roadway types and are two of the three longest U4F routes available. Both of these routes have similar traffic volume, truck percentage, posted speed limit and outside shoulder width. I-40 has a higher presence of median barrier and lower presence of rumble strips compared to I-24. SR 386 was selected as the representative U4F route as it is a non-interstate, has a wider posted speed limit variation and a smaller truck proportion than the other two routes. In Iowa, five routes already selected to represent other roadway types have portions classified as U4F, including the longest (I-80) and fourth longest (SR 30) U4F routes. The total length of these routes is approximately 50 miles (recall that the mileage for the IA divided roadways was not corrected) and the routes combined have a wide variation in traffic volumes. I-29 was selected as an additional U4F representative for its wide variation in outside shoulder and median width, modest length, and modest median barrier presence.
Urban 6-lane divided freeway (U6F)
The available U6F roadway characteristics (secondary variables from Table 2) from each state agency partner combined with the general observations were considered to select representative U6F routes from each state. The selected U6F routes are shown in Table 94. Note that the routes denoted with an asterisk (*) indicate that the route has portions classified as U6F but has been selected to represent a different roadway type category.
Table 94. Selected U6F Routes and Associated Characteristics
| State | Route | Length [mi] | Max AADT [vpd] / Truck Percent [%] | Min / Max Speed Limit [mph] | Mean/Max Shoulder Width [ft] | Min / Max Median Width [ft] | Barrier / Rumble Presence [%] |
|---|---|---|---|---|---|---|---|
| WA | I – 182 | 5.9 | 61,998 / 6.1 | 70 / 70 | 9.1 / 14 | 76 / 76 | 5.6 / UNK |
| I – 5* | 75.8 | 242,028 / 34 | 50 / 70 | 9.0 / 24 | 4 / 300 | 85.4 / UNK | |
| I – 90* | 31.5 | 162,004 / 25 | 60 / 70 | 9.0 / 18 | 4 / 350 | 70.3 / UNK | |
| TN | I - 240 | 7.5 | 149,760 / 13 | 55 / 55 | 10.5 / 22 | 2 / 550 | 69.5 / 51 |
| I – 40* | 40.1 | 212,690 / 39 | 45 / 70 | 11.8 / 24 | 2 / 350 | 76.1 / 49 | |
| I – 24* | 6.9 | 173,760 / 35 | 55 / 70 | 11.0 / 46 | 2 / 700 | 77.8 / 56 | |
| SR 386* | 0.9 | 81,290 / 3 | 65 / 65 | 8.9 / 11 | 2 / 39 | 100 / 53 | |
| IA | I – 380 | 9.9 | 88,100 / 19 | 55 / 70 | 10 / 10 | 40 / 64 | 61.2 / 62.3 |
| I – 80* | 39.8 | 121,400 / 36 | 55 / 70 | 10.4 / 22 | 4 / 275 | 84.9 / 70.6 | |
| I – 35* | 10.7 | 83,800 / 33 | 65 / 70 | 10.1 / 12 | 34 / 82 | 36.4 / 74.8 | |
| SR 30* | 6.2 | 33,400 / 27 | 55 / 65 | 7.8 / 10 | 20 / 64 | 0 / 26.7 | |
| I – 29* | 5.8 | 69,600 / 22 | 55 / 65 | 8.9 / 12 | 4 / 316 | 22.4 / 96.5 | |
| SR 218* | 4.2 | 37,200 / 26 | 55 / 65 | 9.5 / 10 | 16 / 113 | 29.1 / 43.0 |
*Note: Denotes route selected based on a different roadway type category
Washington I-5 (R6F) and I-90 (R4F) are the two longest U6F routes and were previously selected as representative rural divided freeways. All but two of the remaining U6F routes are less than 5 miles in length. Although longer than I-182, I-405 has similar geometric characteristics, especially median width and median barrier presence, to the already selected I-5 and I-90. Given these similarities, I-182 was selected to provide additional variation, including a lower proportion of median barrier, consistent median width, and relatively low truck traffic percentage. Tennessee I-40 is the longest U6F route and was previously selected as an R4F route. I-24 (R6F) and SR 386 (U4F) were also previously selected to represent other roadway types and have portions classified as U6F. I-40 and I-24 have large traffic volumes, a wide variation in median widths, as well as similar posted speeds, barrier presence and rumble strip presence. SR 386 is much shorter but offers a more modest traffic volume, a narrower median and median barrier along the entire length. I-240 was selected as a representative U6F route as the U6F portion is longer than 5 miles, there is reasonable median width and traffic volume variation, and the truck traffic percentage is less than on I-40 and I-24. In Iowa, the two longest U6F routes, I-80 (R4F) and I-35 (R6F), were previously selected as rural divided roadways. Three other routes already selected also have portions classified as U6F. In combination, these five routes have a wide variation in traffic, maximum outside shoulder width, median width, as well as median barrier presence. I-380 was selected as additional U6F route given its length (ranked third), moderate truck traffic percentage, and consistent outside shoulder and median width.
Urban 8-lane divided freeway (U8F)
The available U8F roadway characteristics (secondary variables from Table 2) from each state agency partner combined with the general observations were considered to select representative U8F routes from each state. The selected U8F routes are shown in Table 95. Note that the routes denoted with an asterisk (*) indicate the route has portions classified as U8F but has been selected to represent a different roadway type category.
Table 95. Selected U8F Routes and Associated Characteristics
| State | Route | Length [mi] | Max AADT [vpd] / Truck Percent [%] | Min / Max Speed Limit [mph] | Mean/Max Shoulder Width [ft] | Min / Max Median Width [ft] | Barrier / Rumble Presence [%] |
|---|---|---|---|---|---|---|---|
| WA | I – 405 | 1.0 | 195,319 / 4.6 | 60 / 60 | 10.1 / 12 | 16 / 450 | 47.9 / UNK |
| I – 5* | 43.6 | 239,490 / 21 | 60 / 70 | 8.6 / 14 | 2 / 300 | 86.8 / UNK | |
| I – 90* | 0.7 | 120,604 / 3.5 | 40 / 60 | 7.4 / 10 | 40 / 50 | 71.8 / UNK | |
| TN | SR 155 | 3.7 | 103,300 / 4 | 45 / 55 | 12.3 / 24 | 2 / 12 | 97.6 / 68 |
| I – 40* | 26.6 | 212,690 / 36 | 45 / 70 | 11.6 / 36 | 2 / 350 | 93.1 / 66 | |
| I – 24* | 20.5 | 190,530 / 21 | 55 / 70 | 11.2 / 30 | 2 / 178 | 81.1 / 64 | |
| I – 240* | 5.2 | 169,730 / 13 | 55 / 55 | 12.3 / 24 | 2 / 120 | 90.6 / 50 | |
| IA | I – 235 | 6.6 | 139,000 / 11 | 55 / 65 | 7.6 / 13 | 20 / 35 | 96.4 / 0 |
| I – 80* | 6.3 | 121,400 / 34 | 65 / 65 | 10.8 / 12 | 26 / 65 | 91.2 / 52.4 | |
| I – 35* | 5.3 | 89,800 / 22 | 65 / 65 | 11.9 / 12 | 34 / 50 | 88.5 / 16.2 | |
| I - 380* | 4.3 | 97,700 / 17 | 55 / 60 | 10.0 / 10 | 14 / 60 | 75.6 / 35.3 | |
| SR 218* | 2.5 | 34,700 / 11 | 35 / 55 | 9.1 / 10 | 16 / 250 | 81.9 / 79.6 | |
| I – 29* | 0.6 | 42,000 / 20 | 55 / 65 | 8.3 / 12 | 14 / 50 | 24.0 / 84.0 |
*Note: Denotes route selected based on a different roadway type category
I-5 (R6F) is by far the longest U8F route in Washington and was previously selected as a rural divided freeway. Similarly, I-90 (R4F) is the third longest U6F route and was previously selected as representative rural divided freeways. I-405 is the only remaining U8F route that has more than a single segment, so this route was selected as an additional U8F route. I-405 has traffic volume comparable to I-5, but a higher mean outside shoulder width and less median barrier percentage. In Tennessee, both of the longest U8F routes, I-40 (R4F) and I-24 (R6F), were previously selected to represent rural divided roadways. Both of these routes have very high traffic volumes, a good range of posted speed limits, as well as similar outside shoulder widths, median width variation, barrier presence, and rumble strip presence. I-240 (U6F) also has a portion classified as U8F that has a more moderate traffic volume and truck percentage. SR 155 was selected as an additional U8F representative roadway primarily for its lower traffic volume, lower truck traffic, lower speed limit, and narrower median. In Iowa, four of the five longest U8F routes were previously selected to represent other roadway types, i.e. I-80 (R4F), I-35 (R6F), I-380 (U6F), and SR 218 (R4D). I-29 (U4D) also has a small section classified as U8F. Given the relatively short lengths of U8F available, I-235 was also selected as it is the longest U8F route available in Iowa and has the highest daily traffic volume.
Urban 10-lane divided freeway (U10F)
The available U10F roadway characteristics (secondary variables from Table 2) from each state agency partner combined with the general observations were considered to select representative U10F routes from each state. The selected U10F routes are shown in Table 96. Note that the routes denoted with an asterisk (*) indicate that the route has portions classified as U10F but has been selected to represent a different roadway type category.
Table 96. Selected U10F Routes and Associated Characteristics
| State | Route | Length [mi] | Max AADT [vpd] / Truck Percent [%] | Min / Max Speed Limit [mph] | Mean/Max Shoulder Width [ft] | Min / Max Median Width [ft] | Barrier / Rumble Presence [%] |
|---|---|---|---|---|---|---|---|
| TN | I - 65 | 7.3 | 183,350 / 25 | 55 / 70 | 11.9 / 20 | 2 / 40 | 98 / 45 |
| I – 40* | 9.7 | 212,690 / 23 | 55 / 70 | 11.0 / 24 | 2 / 40 | 100 / 60 | |
| I – 24* | 3.9 | 190,530 / 16 | 55 / 70 | 9.5 / 12 | 2 / 52 | 99 / 77 | |
| I – 240* | 3.0 | 169,730 / 13 | 55 / 55 | 11.0 / 12 | 2 / 2 | 100 / 63 | |
| SR 155* | 2.8 | 103,300 / 4 | 55 / 55 | 10.9 / 20 | 2 /2 | 100 / 51 | |
| IA | I – 235* | 1.7 | 139,000 / 5 | 55 / 60 | 5.9 / 10 | 20 / 35 | 100 / 0 |
| I – 80* | 1.5 | 118,500 / 31 | 65 / 65 | 11.1 / 18 | 30 / 540 | 100 / 39.5 | |
| I – 380* | 1.1 | 91,100 / 13 | 55 / 60 | 10.0 / 10 | 14 / 50 | 95.5 / 33.6 | |
| I – 29* | 0.8 | 42,000 / 20 | 55 / 65 | 11.4 / 12 | 16 / 50 | 28.0 / 100 | |
| SR 218* | 0.4 | 29,100 / 10 | 55 / 55 | 9.2 / 10 | 24 / 24 | 99.0 / 100 |
*Note: Denotes route selected based on a different roadway type category
Washington State had no U10F classified routes available. In Tennessee, four of the five longest U10F routes, I-40 (R4F), I-24 (R6F), I-240 (U6F), and SR 155 (U8F), were selected to represent other roadway types. Given the relatively short lengths of the available sections, each less than 10 miles in length, I-65 was selected as an additional U10F route, as it is ranked second based on
U10F length. In Iowa, all five of the longest U10F routes were selected to represent other roadway types. Since all of the remaining U10F roadways have less than 0.3 miles of U10F length, no additional IA U10F routes were selected.
References
American Association of State Highway and Transportation Officials (AASHTO). Highway Safety Manual, 1st edition, Volumes 1-3, 2010.
Bonneson JA, Geedipally S, Pratt MP, Lord D. Safety prediction methodology and analysis tool for freeways and interchanges, (NCHRP Project 17-45 Final Report), May 2012.
Bureau of Transportation Statistics (BTS). State Transportation Statistics 2015. US Department of Transportation, 2015. https://www.bts.gov/sites/bts.dot.gov/files/docs/browse-statistical-products-and-data/btspublications/203186/sts2015.pdf
Transportation Research Board (TRB). Highway Capacity Manual 6th Edition: A Guide for Multimodal Mobility Analysis. National Academies of Sciences, Engineering and Medicine, 2016.
Revised Code of Washington (RCW). Specified Act: Motor Vehicles, Rules of the Road. Chapter 46.61, Section 46.61.400, Basic Rule and Maximum Limits. https://app.leg.wa.gov/RCW/default.aspx?cite=46.61.400


