Roadside Encroachment Database and Analysis (2025)
Chapter: 4. Characterizing the Nature and Frequency of Roadside Encroachments
4. Characterizing the Nature and Frequency of Roadside Encroachments
The primary purpose of this chapter is to analyze the compiled NCHRP 17-88 dataset to better understand the nature of roadside encroachments, the frequency of their occurrence, and factors that influence the frequency of encroachments and encroachment-related crashes.
4.1 State Data-Derived Encroachment Crash Rates and Influence of Roadway Characteristics
The data from Washington State was used to illustrate how the NCHRP 17-88 database can be used to characterize encroachments and associated factors. The available data consists of two primary components: (1) the available Washington police-reported and unreported crash events present in the NCHRP 17-88 encroachment database and (2) the available Washington roadway data for the 12 selected representative roadways. While the NCHRP 17-88 encroachment database includes various roadway data elements for each encroachment event, these event-specific characteristics may be different than the cumulative roadway characteristics for all roadway segments from which the NCHRP 17-88 encroachment events were collected. Both data sources are needed to determine the influence of associated factors on encroachment frequency.
4.1.1 Road Segment Data
A total of 12 Washington State routes were selected for use in the current project. The selection process examined readily available roadway characteristic data for the state routes such that the selected roadways had a variety of roadway geometric and operational characteristics. Additional details on the selection process are included in an Appendix to this report. For consistency with the HSM, uniform roadway segments from each of the 12 Washington State routes were classified according to the roadway types identified in the HSM. The roadway type coverage and associated traffic exposure for each roadway type are summarized in Table 42.
Table 42. Summary of Selected Washington State Roadway Segments and Traffic Exposure by Roadway Type
| Route Type | Subtype | Total Length (mi) | MVMT During Study Period, 2012 - 2018 |
|---|---|---|---|
| Rural Undivided | RU2L2W | 804.7 | 4.287 |
| RUMLH | 0 | 0.000 | |
| Ramps | 26.1 | 0.003 | |
| Urban Undivided | 2U/3T | 68.5 | 1.382 |
| 4U/5T | 40.5 | 1.767 | |
| 6U | 14.7 | 0.594 | |
| Ramps | 26.4 | 0.412 | |
| Rural Divided | R4D | 73.8 | 1.537 |
| R4F | 252.2 | 6.241 | |
| R6F | 72.0 | 5.105 | |
| Urban Divided | U4D | 61.5 | 1.929 |
| U4F | 121.0 | 10.139 | |
| U6F | 126.6 | 15.637 | |
| U8F | 45.3 | 9.092 |
The available roadway segment data included a total of 17,252 roadway segments across the 12 selected Washington routes. The distribution of segments and segment length by route is summarized in Table 43. For each roadway segment, various roadway operational and geometric characteristics were known, including traffic volume, percent heavy vehicles, posted speed limit, number of lanes, lane width, shoulder type/width, horizontal curve radius (if applicable), and vertical grade.
Table 43. Summary of Washington Roadway Segments for Selected Routes
| Route Designation | Segment Length (mi) | N | ||
|---|---|---|---|---|
| Minimum | Mean | Maximum | ||
| I-5 | 0.01 | 0.102 | 1.71 | 3295 |
| I-90 | 0.01 | 0.165 | 4.46 | 2544 |
| I-182 | 0.01 | 0.091 | 0.70 | 194 |
| I-405 | 0.01 | 0.057 | 0.46 | 597 |
| SR 2 | 0.01 | 0.187 | 3.56 | 3280 |
| SR 8 | 0.01 | 0.194 | 1.51 | 119 |
| SR 12 | 0.01 | 0.196 | 6.99 | 1900 |
| SR 99 | 0.01 | 0.059 | 2.37 | 1088 |
| SR 101 | 0.01 | 0.173 | 5.47 | 2405 |
| SR 167 | 0.01 | 0.088 | 3.75 | 758 |
| SR 202 | 0.01 | 0.077 | 1.17 | 481 |
| SR 522 | 0.01 | 0.072 | 0.94 | 591 |
4.1.2 Reported and Unreported Crash Data
The available crashes included police-reported and unreported crashes that occurred on the selected Washington routes between 2012 and 2018, inclusive. This included 34,818 single-vehicle police-reported crashes, 9,146 multiple-vehicle reported crashes (with at least one vehicle departing the road), and 3,536 unreported crashes with guardrail, crash cushions, and cable barrier. The unreported crashes were determined based on maintenance repair records over the same time period for all guardrail, crash cushions, and cable barrier on the 12 selected Washington routes. The distribution of crashes by route is summarized in Table 44.
| Route Designation | Number of Crashes | Total Number of Crashes | ||
|---|---|---|---|---|
| Single Vehicle | Multiple Vehicle | Unreported | ||
| I-5 | 14946 | 4536 | 1904 | 21386 |
| I-90 | 7283 | 1401 | 372 | 9056 |
| I-182 | 767 | 99 | 34 | 900 |
| I-405 | 2008 | 701 | 139 | 2848 |
| SR 2 | 2132 | 468 | 236 | 2836 |
| SR 8 | 315 | 23 | 58 | 396 |
| SR 12 | 1680 | 212 | 157 | 2049 |
| SR 99 | 1533 | 745 | 55 | 2333 |
| SR 101 | 2097 | 307 | 253 | 2657 |
| SR 167 | 1207 | 427 | 239 | 1873 |
| SR 202 | 301 | 70 | 8 | 379 |
| SR 522 | 549 | 157 | 81 | 787 |
4.1.3 Methods
The overall approach for this study was to match the available encroachment-related crashes, both reported and unreported, to the corresponding road segment data and tally the crashes for each roadway segment. Encroachment rates can be computed for each segment based on the matched crashes and available traffic volume data for the segment. These encroachment rates were computed for all crashes and reported and unreported crashes separately and examined by the four primary roadway categories (i.e., rural/urban and divided/undivided), as well as more specific roadway classifications within each of the four primary roadway categories. Unreported crashes were also examined by roadside hardware type (i.e., guardrail end terminal, guardrail face, cable barrier, and crash cushion).
A statistical model was developed to predict the number of encroachment-related crashes using the available roadway segment geometric and operational characteristics. The model was used to examine how a specific characteristic influences encroachment crash frequency, while controlling for other confounding factors within the same model. All data manipulation and analysis were conducted using SAS (version 9.4)
4.1.4 Road Segment Data Processing and Crash Merging
The road segment data available from the Highway Safety Information System (HSIS) include a roadlog file from each year. As the traffic volume and truck percentages may differ from year to year, the yearly data for each segment were combined to compute a total traffic volume and truck percentage for the study period. The combined values were then divided by the study period (7 years) to determine average values over the study period. These average values were used to compute vehicle miles traveled (VMT) for each available segment. VMT was computed by multiplying the average traffic volume for the segment over the study period by the number of days in a year (365) and the number of years in the study period (7) and then divided by 1 million (i.e., MVMT). Ramp segments were initially included, as some had traffic volume available, but the majority of ramps did not have traffic volume available.
Prior to combining the HSIS roadlog file from each year, the associated HSIS horizontal curve data file was merged with the roadlog file. The segments in the roadlog file do not necessarily align with the start and end of the horizontal curves. The team developed SAS code to merge these files and relabel the start and end mileposts such that segments remained homogeneous. For instance, if a horizontal curve (MP 10.5 to 11) spanned part of two adjacent roadlog segments (MP 10 to 10.75 and MP 10.75 to 11.25), the two segments would become three segments (i.e., a horizontally curved section from MP 10.5 to 11 and two tangent segments, MP 10 to 10.5 and MP 11 to 11.25). Note that the segment length information provided in Table 43 was prior to the merging of the roadlog and curve files.
The combined roadlog/curve file for 2012 through 2018 was merged with the available encroachment-related crashes occurring over the same time period, both police-reported and unreported. To accomplish this, an SQL procedure was used that matched a unique road inventory identifier (for reported crashes) or route number (for unreported crashes) and ensured that the crash location occurred between the beginning and ending mileposts of the segment in the roadlog/curve file. Once combined, the file was consolidated, and counts of reported and unreported crashes were recorded for each segment. This final combined table including counts of reported and unreported encroachment-related crashes and roadway data was used as the basis for the subsequent analysis.
4.1.5 LOS Background and LOS Estimation
A specific request for the project was to consider LOS with respect to roadside encroachment characteristics. LOS is a qualitative description of the operating conditions of a roadway at a specific time. Although typically computed for the peak traffic hour, LOS on a given roadway section may vary throughout the day as traffic volume fluctuates. Note that procedures exist to compute LOS for various travel modalities on a given roadway (i.e., motor vehicle, pedestrian, bicyclist). Although LOS is a qualitative scale ranging from A to F, LOS for motor vehicle travel is determined using detailed quantitative roadway and traffic data, that is, primarily traffic volume, proportion of large vehicles in the traffic stream, and number of travel lanes.
LOS data are not recorded in any of the source datasets used to populate the NCHRP 17-88 encroachment database. For the in-depth crash source datasets, data elements that could be used to estimate LOS are also generally not collected (e.g., primarily traffic volume). Further, to protect the privacy of the participants of the in-depth studies, these datasets do not include specific crash location data, which precludes any subsequent post hoc LOS estimation. Unlike the in-depth crash datasets, however, the state data have crash location data available as well as sufficient traffic and roadway data available to facilitate an estimation of LOS for the included roadway sections.
The HCM (TRB 2016) outlines procedures for determining motor vehicle LOS for various roadway types. The data elements required, procedures, and performance measures used to determine LOS vary by roadway type (e.g., controlled access freeway versus two-lane undivided highway) and roadway facility component (e.g., basic freeway segment versus freeway weaving segment). The HCM procedures are comprehensive but require a relatively large amount of input data and detailed multi-step computations.
Margiotta and Washburn (2017) developed simplified procedures for determining LOS using data available from the Highway Performance Monitoring System (HPMS). Similar to the available state data, the HPMS includes AADT volume information. For a specific roadway type, lookup tables were developed to provide an estimate of LOS based on various roadway and traffic parameters based on the roadway segment AADT. As an example, AADT volume thresholds are
provided for freeways by area type (e.g., urban or rural, number of lanes, and truck percentage category; see Table 45 for an excerpt from one of the provided tables). The values shown in Table 45 are thresholds; for example, a four-lane rural freeway with no heavy vehicles and AADT less than or equal to 46,100 vehicles per day would have an LOS of B.
| Area Type | Number of Lanes | Truck Percent | AADT Threshold for LOS | |||
|---|---|---|---|---|---|---|
| B | C | D | E | |||
| Rural | 4 | 0 | 46,100 | 62,000 | 74,800 | 84,700 |
| 10 | 43,900 | 59,000 | 71,200 | 80,700 | ||
| 20 | 41,900 | 56,300 | 68,000 | 77,000 | ||
| 30 | 40,100 | 53,900 | 65,000 | 73,700 | ||
| Urban | 4 | 0 | 43,700 | 60,100 | 73,100 | 83,000 |
| 10 | 41,600 | 57,200 | 69,600 | 79,100 | ||
| 20 | 39,700 | 54,600 | 66,400 | 75,500 | ||
| 30 | 38,000 | 52,200 | 63,600 | 72,200 | ||
Although the team generally followed the more detailed HCM procedures described in the previous section, assumptions were required to allow for a LOS determination. The assumptions vary by roadway type, but the primary assumption is the K factor value, which allows determination of the peak hour traffic volume from the AADT value.
The team used the Margiotta and Washburn (2017) method as a means of estimating roadway LOS associated with the state data encroachments included in the NCHRP 17-88 encroachment database. These simplified procedures were selected over the traditional HCM procedures primarily based on the large number of LOS estimates to be completed, the relatively limited project time/resources remaining, and the readily available state roadway and traffic data.
To the extent possible, the traffic volume tables developed by Margiotta and Washburn (2017) were used directly to estimate the roadway LOS for the available Washington roadway segments. Table 46 shows the roadway types for which Margiotta and Washburn (2017) developed lookup tables with a summary of the required input data.
Table 46. Roadway Types and Required Input Data
| Facility Type | Required Input Type | Categories | LOS Threshold Levels Specified |
|---|---|---|---|
| Freeway (controlled access) | Area Type | Urban, Rural | B, C, D, E |
| Number of Lanes | 4, 6, 8, 10, 12 | ||
| Truck Percentage | 0, 10, 20, 30 | ||
| Multilane Highways (unsignalized) | Area Type | Urban, Rural | B, C, D, E |
| Number of Lanes | 4, 6, 8, 10 | ||
| Truck Percentage | 0, 10, 20, 30 | ||
| Signalized Highway | Number of Lanes | 2, 4, 6, 8 | B, C, D, E |
| Speed Limit | 35, 40, 45, 50, 55, 60 | ||
| Percent Green Time | Varies by number of lanes but all between 40 and 80% | ||
| Rural 2-Lane Highways | Speed Limit | 45, 50, 55, 60, 65 | B, C, D |
| Terrain | Flat, Rolling, Mountainous | ||
| Truck Percentage | 0, 2, 4, 6, 8, 10 |
All of the required input data from Table 46 are available for the Washington NCHRP 17-88 encroachment cases except for the percent green time for signalized roadway sections. Given the lack of green time data and the relatively large variation in LOS thresholds by percent green time, LOS estimates were not generated for signalized highway sections. Below are some additional notes on how the Margiotta and Washburn (2017) method was applied to the Washington data:
- LOS was computed for mainline sections only. No LOS was estimated for ramp sections.
- Area type, posted speed limit, terrain, and number of lanes were determined directly from the available Washington data. These data were derived from the Washington HSIS roadlog file for the corresponding year of the crash and generally matched the categories shown in Table 46.
- Only divided roadways with fully controlled access were classified as freeways. All others were considered multilane highways.
- The Washington data include data on traffic control presence on the roadway segment. LOS was only estimated for unsignalized sections.
- For multilane highways, threshold values were linearly interpolated for sections containing a non-even number of lanes (e.g., five, seven, or nine lanes) within the available categories. These represent segments with a different number of through lanes in each direction.
- Truck percentage categories were determined using the available Washington truck percentage data. The categories included the entire range of traffic volumes; for instance, the 10% truck category includes any non-zero truck percentage up to and including 10%.
- A number of the included sections had truck percentage values greater than the maximums listed in Table 46 (e.g., 10% for rural two-lane highways and 30% for multilane highways and freeways). For these sections, the threshold values for the largest truck percentage were used, and the LOS value is denoted with an “e” to indicate that the truck percentage
- exceeded the available ranges in the lookup tables. We would expect these LOS estimates to be less reliable than those for sections within the available truck percentage ranges.
- For freeways and unsignalized multilane highways, LOS determination includes LOS B, C, D, E, and F. LOS F is estimated any time the freeway or multilane highway exceeds the associated traffic volume threshold for LOS E. As there is no threshold for LOS A, no LOS A values are reported.
- For rural two-lane highways, thresholds are only provided for LOS B, C, and D. Any segments exceeding the associated LOS D threshold traffic volume were labeled “< D” to indicate an LOS less than D (e.g., E or F), but the exact classification is not known.
4.1.6 Roadway Characteristics and Model Development
The roadway characteristics and associated data types and categories used in the analysis are summarized in Table 47.
Table 47. Summary of Roadway Characteristics
| Data Element | Data Type | Applicable Categories and/or Other Notes |
|---|---|---|
| Land Use | Binary | Rural/Urban |
| Median Presence/Width | Categorical | Undivided Divided, ≤ 10 ft Divided, 11 - 25 ft Divided, 26 - 50 ft Divided, 51 - 100 ft Divided, >100 ft |
| Curb | Binary | Yes/No |
| Curve | Categorical | Tangent Section Horizontal Curve, Radius ≤ 500 ft Horizontal Curve, 500 ft < Radius ≤ 2800 ft Horizontal Curve, Radius > 2800 ft |
| Shoulder Width | Categorical | Width ≤ 4 ft 4 ft < Width ≤ 10 ft Width > 10 ft |
| Posted Speed | Categorical | Low Speed (PSL ≤ 45 mph) High Speed (PSL > 45 mph) |
| AADT | Continuous | Raw vehicle per day value and log transformed value |
| Segment Length | Continuous | Segment length in miles |
| VMT | Continuous | Combination of AADT and segment length. Raw value and log transformed value |
| Lane Width | Categorical | Lane Width < 12 feet Lane Width 12+ feet |
| LOS | Categorical | LOS B or higher LOS C LOS D LOS E/F or lower |
| Data Element | Data Type | Applicable Categories and/or Other Notes |
|---|---|---|
| Number of Lanes | Categorical | ≤ 4 Lanes 4 – 8 Lanes >8 Lanes |
| Land Use | Binary | Rural/Urban |
A negative binomial model was used to model encroachment-related crash frequency on the available roadway segments. Negative binomial models are generally preferred for modeling data where the variance is greater than the mean (Washington et al. 2011). This is often true of crash data, and numerous researchers have applied negative binomial models to study crash frequency (Abdel-Aty and Radwan 2000; Carson and Mannering 2001; Miaou 1994; Schneider et al. 2010; Shankar et al. 1995).
All models were developed with the number of encroachment crashes occurring on a given roadway section as the dependent variable. Continuous predictor variables included AADT, segment length, and VMT. Natural logarithm transformed versions of the continuous variables were also explored during model development. Categorical predictor variables included number of lanes, shoulder width, horizontal curve radius, median width, lane width, LOS, curb presence, and land use (rural/urban).
A final negative binomial model was selected based on comparing the full log likelihood, Akaike’s Information Criterion (AIC), and the Bayesian Information Criterion (BIC) fit statistics of each developed model. The estimated parameters of the final negative binomial model were then used to examine the relationship between the roadway characteristics and the frequency of encroachment-related crashes. Estimated percentage increases or decreases in crash frequency associated with a specific predictor were computed by exponentiation of the corresponding coefficient and subtracting 1.0 from the result prior to converting to a percentage value.
4.1.7 Results
The following sections provide additional details on the analysis of the available Washington encroachment-related crashes and associated roadway data.
Encroachment Rate by Roadway Type and Encroachment Type
The overall encroachment rate by land use type and roadway type (i.e., divided/undivided) is summarized in Table 48. In general, undivided and rural roadways had higher rates of all types of encroachment-related crashes. Also, the police-reported crashes comprised the majority of the total encroachment-related crash rates.
Table 48. Mean Encroachment Rate (per MVMT) by Land Use and Roadway Segment Configuration
| Land Use | Encroachment Type | Roadway Segment Configuration | |
|---|---|---|---|
| Undivided | Divided | ||
| Rural | All | 3.364 | 1.052 |
| Police-Reported | 3.117 | 0.960 | |
| Unreported | 0.247 | 0.093 | |
| Urban (suburban) | All | 1.751 | 0.851 |
| Police-Reported | 1.614 | 0.768 | |
| Unreported | 0.137 | 0.084 | |
Encroachment-related crash rates by specific roadway types are summarized in Table 49. Note that no rural undivided multilane highway segments (RUMLH) were available in the Washington road network. Based on the data shown, there appeared to be differences in encroachment-related crash rates among the more specific roadway types. In general, it appears that the divided, controlled access freeways (i.e., R4F, R6F, U4F, U6F, and U8F) have the lowest incidence of encroachment-related crashes. While ramps do seem to have high encroachment-related crash rates, note that only 45% of available ramp segments had any traffic information available. The rate of missing traffic volume data for ramps is much higher than mainline roadway segments, which have less than 1% of traffic volume missing in the available data.
Table 49. Washington State Total and Unreported Encroachment Rate (per MVMT) by Roadway Type
| Route Type | Subtype | MVMT | Mean Encroachment Rate per MVMT | Unreported Encroachment Rate per MVMT | Unreported Encroachment Percentage |
|---|---|---|---|---|---|
| Rural Undivided | RU2L2W | 8,187 | 1.32 | 0.10 | 7.3 |
| RUMLH | 0 | 0.00 | 0.00 | 0.0 | |
| Ramps | 7 | 4.23 | 0.00 | 0.0 | |
| Urban Undivided | 2U/3T | 2,749 | 0.72 | 0.03 | 4.5 |
| 4U/5T | 3,204 | 0.78 | 0.07 | 8.5 | |
| 6U | 1,208 | 0.83 | 0.01 | 0.9 | |
| Ramps | 964 | 1.82 | 0.00 | 0.0 | |
| Rural Divided | R4D | 2,669 | 1.21 | 0.17 | 14.5 |
| R4F | 13,957 | 0.56 | 0.04 | 6.7 | |
| R6F | 10,993 | 0.46 | 0.02 | 4.8 | |
| Urban Divided | U4D | 3,806 | 0.98 | 0.03 | 3.6 |
| U4F | 18,826 | 0.74 | 0.12 | 15.9 | |
| U6F | 34,569 | 0.28 | 0.02 | 7.8 | |
| U8F | 20,388 | 0.30 | 0.03 | 9.7 |
Figure 5 and Figure 6 show the distribution of encroachment-related crash rate as a function of segment traffic volume for the available divided and undivided roadway segments, respectively. In each plot, the average encroachment-related crash rate is shown for each general roadway facility type. Based on these plots, there is larger variation in encroachment-related crash rates at lower segment traffic volumes. The variation in encroachment-related crash rate is also larger for rural roadway segments compared to urban roadway segments.


Unreported Crashes by Roadside Hardware Type
The total number of unreported and police-reported impacts with various roadside hardware devices is summarized in Table 50 along with the ratio of unreported to reported crashes for each device.
Table 50. Washington State Unreported and Reported Impacts by Roadside Hardware Type
| Roadside Hardware | Police-Reported Impacts | Unreported Impacts | Unreported/Reported Ratio |
|---|---|---|---|
| Guardrail End Terminal | 793 | 517 | 0.65 |
| Guardrail Standard Section | 6841 | 1935 | 0.28 |
| Cable Barrier | 2353 | 889 | 0.38 |
| Crash Cushion | 707 | 195 | 0.28 |
End terminals were found to have the highest ratio of unreported to reported crashes and cable barriers were found to have a higher unreported to reported ratio compared to non-terminal guardrail sections and crash cushions.
Negative Binomial Model Results
The final negative binomial model results are summarized in Table 51. For parameters with two or more categories, the reference category is denoted by blank values in Table 51 (e.g., curb presence is relative to no curb present). Positive coefficient values indicate that the specific category tends to increase the number of encroachment-related crashes on a specific roadway segment (compared to the reference category), while negative coefficient values indicate that the specific category tends to decrease the number of encroachment-related crashes. A p-value less than 0.05 for any category indicates that the relationship is statistically significant. An example interpretation of the effect of curbs is as follows: the model indicates that the presence of curbing decreases the number of encroachment-related crashes compared to non-curbed sections, but this result was not statistically significant. To determine the percentage increase or decrease in encroachment-related crash frequency, exponentiate the coefficient and subtract 1.0 (for positive coefficients) or subtract from 1.0 (for negative coefficients).
Based on the model, VMT, horizontal curve presence/value, posted speed limit, lane width, median presence, land type and, to a lesser extent, LOS and shoulder width, were found to be statistically significant influencers of the frequency of encroachment-related crashes. Horizontally curved road segments with radii less than 2,800 feet were found to increase encroachment-related crash frequency compared to tangent sections, while larger radius sections were found to decrease encroachment-related crash frequency. Compared to mid-width shoulders, narrower shoulders increased encroachment-related crash frequency. Higher posted speed limit roads were found to have a statistically significant increase in encroachment-related crashes. Narrower lanes, rural area type, and higher LOS values were found to increase this crash type.
Table 51. Final Negative Binomial Model Results Predicting Number of Encroachment-related Crashes
| Parameter | Category/Description | Coefficient | Standard Error | Wald Chi-Square | p-Value |
|---|---|---|---|---|---|
| Constant | N/A | -9.994 | 0.185 | 2928.8 | < 0.001 |
| VMT | Natural log of the segment VMT (vehicle miles) | 0.659 | 0.008 | 6875.5 | < 0.001 |
| Parameter | Category/Description | Coefficient | Standard Error | Wald Chi-Square | p-Value |
|---|---|---|---|---|---|
| Curb | Present | -0.022 | 0.048 | 0.21 | 0.650 |
| Absent | - | - | - | - | |
| Horizontal Curve (HC) Presence/Value | HC, Radius > 2800’ | -0.136 | 0.024 | 31.9 | < 0.001 |
| HC, 500’ < Radius ≤ 2800’ | 0.293 | 0.030 | 98.3 | < 0.001 | |
| HC, Radius ≤ 500’ | 1.291 | 0.132 | 95.8 | < 0.001 | |
| Tangent Section | - | - | - | - | |
| Shoulder Width | Width > 10’ | -0.005 | 0.052 | 0.01 | 0.927 |
| Width ≤ 4’ | 0.092 | 0.034 | 7.48 | 0.006 | |
| Width 4 – 10’ | - | - | - | - | |
| Posted Speed Limit (PSL) | PSL 50+ mph | 0.249 | 0.051 | 23.9 | < 0.001 |
| PSL ≤ 45 mph | - | - | - | - | |
| Lane Width | Width < 12’ | 0.195 | 0.045 | 18.8 | < 0.001 |
| Width ≥ 12’ | - | - | - | - | |
| Median Presence/Width | Divided, ≤ 10 ft | 0.444 | 0.056 | 63.6 | < 0.001 |
| Divided, 11 - 25 ft | 0.440 | 0.040 | 118.7 | < 0.001 | |
| Divided, 26 - 50 ft | 0.377 | 0.039 | 93.2 | < 0.001 | |
| Divided, 51 - 100 ft | 0.250 | 0.038 | 44.2 | < 0.001 | |
| Divided, >100 ft | 0.203 | 0.048 | 17.7 | < 0.001 | |
| Undivided | - | - | - | - | |
| Number of Lanes | ≤ 4 Lanes | 0.159 | 0.114 | 1.93 | 0.165 |
| 4 – 8 Lanes | -0.011 | 0.113 | 0.01 | 0.921 | |
| >8 Lanes | - | - | - | - | |
| Land Type | Urban | -0.125 | 0.030 | 17.7 | < 0.001 |
| Rural | - | - | - | - | |
| LOS | LOS B or higher | 0.090 | 0.033 | 7.3 | 0.007 |
| LOS C | 0.050 | 0.035 | 2.0 | 0.156 | |
| LOS D | -0.018 | 0.041 | 0.18 | 0.669 | |
| LOS E/F or lower | - | - | - | - |
Note. n = 15,174; log likelihood = 24,693; χ2/DF = 1.072; Dispersion = 0.651 (95% CI: 0.62-0.68).
Based on the model results, the team made the following observations relative to the influence of roadway characteristics on the frequency of encroachment-related crashes:
- A one-unit increase in the natural log of the segment VMT results in a 93% increase in encroachment-related crash frequency.
- Compared to tangent roadway segments, presence of a medium radius horizontal curve (500' < R ≤ 2,800') or small radius horizontal curve (R ≤ 500') increased encroachment-related crash frequency by 34% and 264%, respectively. Presence of a large horizontal curve (R > 2,800') was found to reduce encroachment-related crash frequency by 13%.
- Segments with posted speed limits 50 mph and higher were found to have 28% increase in encroachment-related crashes.
- Narrower shoulders (≤ 4') were found to increase encroachment-related crash frequency by 10% compared to medium width shoulders (Width 4-10'). According to the model, wider shoulders (> 10') tended to decrease encroachment-related crash frequency, but this result was not statistically significant.
- Compared to rural roadway segments, urban classified segments were found to reduce encroachment-related crash frequency by approximately 12%.
- Higher LOS values were associated with increases in encroachment-related crash frequency. Compared to segments with LOS E/F, LOS C segments were found to increase encroachment-related crash frequency by approximately 5%. For LOS B and higher, this increase was approximately 10%.
- Presence of curbing was associated with a lower encroachment-related crash frequency, but this result was not statistically significant.
- Narrower median widths were found to be associated with higher encroachment-related crash frequency. Compared to undivided road segments, presence of a narrow median (≤ 10') increased encroachment-related crash frequency by approximately 56%. This increase generally decreased with increasing median width, as presence of wide median (> 100') increased encroachment-related crash frequency by approximately 20%.
4.2 Discussion
The encroachment-related crash rates were similar in magnitude to those reported by others and summarized in the literature review section of this report. In general, undivided and rural roadways had higher rates of encroachment-related crashes compared to divided and urban roadway sections. Controlled access freeways were found to have the lowest encroachment rates. This may be in part due to the more rigorous geometric design standards for these typically higher functionally classified routes.
In general, the unreported encroachment rates were relatively low, approximately 10% of police-reported encroachment-related crashes, which is lower than the estimates of some previous researchers. Our unreported estimate is likely a lower bound estimate on unreported crashes for several reasons. First, several unreported impacts may be responsible for triggering sufficient damage to a roadside hardware device. For these cases, our data would have had only one repair record, and thus count this as a single unreported crash event. Second, our estimate includes only w-beam guardrail, cable barrier, and crash cushions because these may be damaged sufficiently by an unreported crash to trigger a repair by maintenance. Concrete barriers were not included, as unreported hits to these devices would almost never trigger a repair event, but these devices could be subjected to unreported crashes. Lastly, there are likely unreported events of severity so low that a repair is never triggered or all encroachments where a vehicle does not impact one of these devices would also be omitted.
In terms of impacts with a specific roadside hardware device type, unreported crash rates ranged from approximately 30% to 60% of the total number of reported crashes into the same device. For the reasons enumerated in the previous paragraph, this estimate is likely a lower bound for unreported crashes. Nevertheless, the ratios seem reasonable compared to one another. We would
expect end terminal and cable barrier ratios to be higher given the higher likelihood these devices would need to be repaired in the event of a vehicle impact.
The developed negative binomial model provided insight into how various roadway geometric and operational characteristics affect the frequency of encroachment-related crashes. The largest determinate of this crash type appears to be a measure of exposure (e.g., VMT in the final model, which incorporates traffic volume and segment length simultaneously). Horizontal curves with radii less than 2,800 feet, higher posted speed limits, narrower lane widths, and the rural area type were all found to increase this crash type. While accounting for other characteristics, divided roadways with any median width were also found to increase the number of encroachment-related crashes. Similarly, higher LOS values were associated with an increase in the number of encroachment-related crashes.
4.3 Encroachment Modification Factors
4.3.1 Introduction
RSAPv3 uses estimates of encroachment rate based on road/roadside conditions to predict the potential crash costs and savings of alternate roadside designs (Ray et al. 2012). The encroachment rates currently used in RSAPv3 are based on a reevaluation of the original Cooper data (Cooper 1980) collected by De Leuw Cather (1978). This roadside encroachment database primarily contained encroachments that occurred on two-lane undivided, three-lane undivided, and four-lane divided Canadian roadways between July and October of 1978. Because encroachments were identified based on tire marks along the roadside, small lateral encroachments that did not extend beyond a paved shoulder were not captured. A Weibull model with gamma random effects was used to account for smaller encroachments in the encroachment rate estimates (Ray et al. 2012). According to the RASPv3 engineering manual, “about 44% of the encroachments were estimated to be unrecorded for the two- and three-lane undivided road segments, and about 34% unrecorded for the four-lane divided segments” in the Cooper data (Ray et al. 2012).
The base encroachment rate, including the correction for the underreporting of small encroachments, was determined via a second Poisson regression that accounted for AADT (veh/day), posted speed limit (1 if >90 km/h), rolling terrain (1 if rolling), mountainous terrain (1 if mountainous), three-lane highway (1 if three-lane highway), and access-point density (access points per km) (Ray et al. 2012). Once the base encroachment rate was determined from the Poisson regression, individual encroachment modification factors (EMFs) were computed for RSAPv3. These EMFs are multiplicative adjustments to the base encroachment rate to account for many different roads and/or roadside characteristics. Using 7,082 median crashes in Texas that occurred from 1998 to 1999, a Poisson regression analysis was completed to estimate the effect of additional lanes on the encroachment rate (Ray et al. 2012). The best performing model found an adjustment factor of 0.962 for divided roads with three lanes in the direction of travel relative to divided roads with two lanes in the direction of travel, but this value was not statistically significant. A second approach computed EMFs for specific subsets of the roads. For example, an EMF for divided roads with three lanes in the direction of travel relative to divided roads with two lanes in the direction of travel was computed to be 0.854 for roads with an AADT between 40,000 and 80,000 vehicles per day, barrier separated, a median width less than 30 ft, and a posted speed limit of 55 mph. The average EMF from the two methods was the EMF used in RSAPv3 for the multilane adjustment lookup table (Table 52). Therefore, RSAPv3 assumed that three-lane divided roadways had a 9% lower encroachment rate compared to one-lane roadways.
| Lanes | Undivided | Divided |
|---|---|---|
| 1 | 1.000 | 1.000 |
| 2 | 0.755 | 1.000 |
| 3 | 0.755 | 0.910 |
| 3+ | 0.755 | 0.910 |
The NCHRP 17-88 research team had identified roadside encroachments in multiple datasets to cover the breadth of vehicle types and encroachment severities. Three datasets, NCHRP 17-43, LTCCS, and MCCS cover more severe encroachments that were sampled by NHTSA and represented passenger vehicles, large trucks, and motorcycle encroachments, respectively. The research team has also extracted encroachments that resulted in a police-reported crash from Washington State, Iowa, and Tennessee crash data. These datasets are extremely useful for understanding the characteristics of roadside encroachments that result in a crash across different vehicle types. However, these datasets were unable to capture encroachments that did not result in an impact event. The research team has identified encroachments in the SHRP 2 NDS based on the lane position of the vehicle. The research team has been able to identify many more encroachments than previous datasets, including encroachments with small lateral excursions. The encroachments from SHRP 2 allow the computation of encroachment rates and EMFs using observed data and do not rely on an estimated frequency of small lateral excursions. The purpose of this study was to develop a method of computing EMFs from naturalistic driving data and to compare them to the EMFs used in RSAPv3.
4.3.2 Methods
The datasets used for this study were the weighted trip distributions in the SHRP 2 NDS (McLaughlin et al. 2016), the SHRP 2 RID (Smadi et al. 2015), and the SHRP 2 encroachment dataset found in previous reports. The weighted trip distributions in the SHRP 2 NDS contain the number of trips and unique drivers that traveled through each link in the RID. Only links with more than 30 trips were included in the normal driving dataset to protect personally identifying information. Encroachment events were identified from the entirety of all trips with valid lane tracking data, including the infrequently traveled segments that were not included in the normal driving dataset. Only encroachments with a lateral excursion more than 1ft were examined. This lateral excursion threshold was selected based on the accuracy of the SHRP 2 lane tracking data to ensure that the vehicle did in fact cross the lane line.

In some identified encroachments, the vehicle encroaches far enough laterally that the SHRP 2 lane tracking system loses the location of the lane line itself (Figure 8). Lane tracking would resume as normal once the vehicle returns close enough to the lane line for the system to identify its location. These encroachments that were segmented due to the detection algorithm were linked back together to ensure that no encroachments were counted more than once.

For divided and undivided road segments and the number of lanes, the encroachment rate was computed as the number of encroachments with a lateral excursion over 1 ft divided by the number of miles driven by a SHRP 2 vehicle on that road type. For example, there was an estimated encroachment rate in SHRP 2 of 106 encroachments per MVMT on two-lane undivided roadways. The EMF for each variable was computed by dividing the encroachment rate of a specific condition by the encroachment rate of a base condition. Thus, the EMF was a relative metric with a value below 1 indicating a reduction in the encroachment rate for the given parameter condition.
| (Equation 4) |
4.3.3 Results
On two-lane undivided roads, the overall encroachment rate used in RSAPv3 was 0.68 encroachments per million vehicle kilometers traveled (MVKT) or 1.09 encroachments per MVMT (Table 53). On four-lane divided roads, the overall encroachment rate used in RSAPv3 was 0.68 encroachments per MVKT. On two-lane undivided roads, the rate of encroachments larger than 1 ft was 105.87 encroachments per MVMT. On four-lane divided roads, the rate of encroachments larger than 1 ft was 170.83 encroachments per MVMT. Unlike RSAPv3, the encroachment rate was higher on divided roadways compared to undivided roadways. The SHRP 2 encroachment rate was much higher than the encroachment rate used in RSAPv3 because the SHRP 2 estimate includes encroachments with a small lateral excursion.
| 2-Lane Undivided | 4-Lane Divided | |||
|---|---|---|---|---|
| Enc/MVKT | Enc/MVMT | Enc/MVKT | Enc/MVMT | |
| RSAPv3 | 0.68 | 1.09 | 0.42 | 0.68 |
| SHRP 2 | 65.79 | 105.87 | 106.17 | 170.83 |
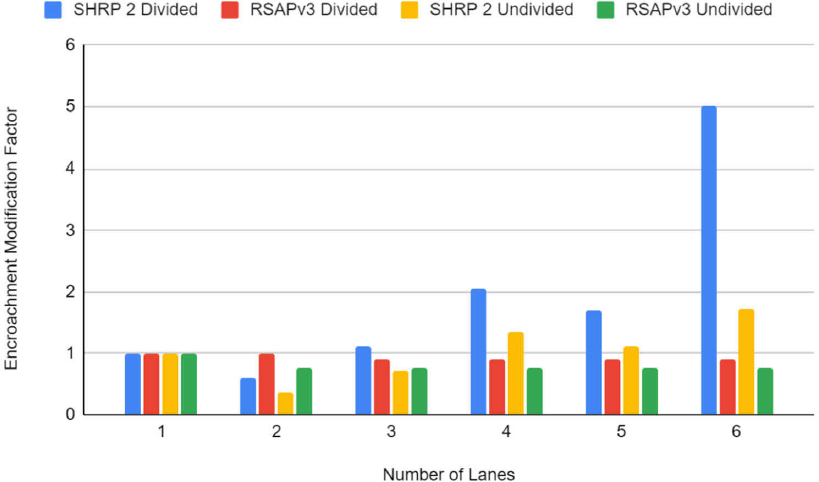
The EMFs for the number of lanes was computed for SHRP 2 and compared to RSAPv3 (Table 54). For undivided roads, the EMFs in SHRP 2 indicated that the number of encroachments was generally higher for roads with more than three lanes. This was the same for divided roadways, but the encroachment rate increased sharply with additional lanes. This could be due to the wider range of roads included in SHRP 2. The RSAPv3 EMFs for number of lanes was based on roads
with posted speed limits at least 55 mph, and the SHRP 2 EMF estimates for number of lanes conforms to this 55-mph limit as well.
| Divided | Undivided | |||||
|---|---|---|---|---|---|---|
| Lanes | RSAPv3 EMF | SHRP 2 EMF | SHRP 2 (enc/MVMT) | RSAPv3 EMF | SHRP 2 EMF | SHRP 2 (enc/MVMT) |
| 1 | 1.000 | 1.00 | 286.99 | 1.000 | 1.00 | 286.99 |
| 2 | 1.000 | 0.60 | 170.83 | 0.755 | 0.37 | 105.87 |
| 3 | 0.910 | 1.12 | 321.38 | 0.755 | 0.72 | 206.63 |
| 4 | 2.04 | 586.49 | 1.36 | 389.11 | ||
| 5 | 1.70 | 488.30 | 1.12 | 322.55 | ||
Similar to the findings in RSAPv3, the EMF increased with a larger magnitude in vertical road grade (Table 55 and Figure 10). In addition to showing the same overall symmetric trend, the specific EMF values by grade were very similar between the two methods. The primary difference was that the EMF in SHRP 2 was considerably lower than the RSAPv3 estimate for roads with a vertical grade of -4% to -5% and 4% to 5%.
Table 55. EMF by Vertical Grade
| Grade | RSAPv3 EMF | SHRP 2 EMF | SHRP 2 (enc/MVMT) |
|---|---|---|---|
| -8 | 8.32 | 7.76 | 4,252.71 |
| -7 | 7.28 | 6.36 | 7,083.01 |
| -6 | 6.24 | 5.25 | 5,803.57 |
| -5 | 5.20 | 2.55 | 4,790.57 |
| -4 | 4.16 | 1.68 | 2,323.58 |
| -3 | 3.12 | 2.69 | 1,530.57 |
| -2 | 2.08 | 2.68 | 2,453.67 |
| -1 | 1.04 | 1.76 | 2,444.84 |
| 0 | 1.00 | 1.00 | 1,604.95 |
| 1 | 1.04 | 1.71 | 912.18 |
| 2 | 2.08 | 2.66 | 1,560.23 |
| 3 | 3.12 | 3.02 | 2,427.89 |
| 4 | 4.16 | 2.20 | 2,758.66 |
| 5 | 5.20 | 3.06 | 2,006.07 |
| 6 | 6.24 | 5.54 | 2,795.38 |
| 7 | 7.28 | 6.49 | 5,052.78 |
| 8 | 8.32 | 7.44 | 5,922.36 |

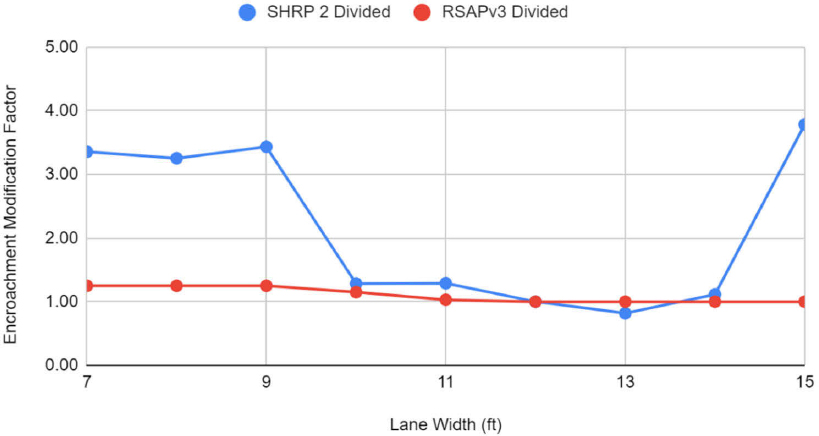
RSAPv3 provided EMFs primarily for roadways with lane widths between 9 ft and 12 ft (Table 56). Within that range of lane widths, SHRP 2 had very similar EMFs for both divided and undivided roads (Figure 11 and Figure 12). Surprisingly, as the lane width increased above 13 ft, the EMF in SHRP 2 also increased. These larger lane widths tended to occur in locations where multiple lanes merged. These results may indicate that the rate of roadside encroachments may increase in areas with lanes merging, such as entrance ramps.
Table 56. EMF by Lane Width for Divided and Undivided Roadways
| Divided | Undivided | |||||
|---|---|---|---|---|---|---|
| Lane Width (ft) | RSAPv3 EMF | SHRP 2 EMF | SHRP 2 (enc/MVMT) | RSAPv3 EMF | SHRP 2 EMF | SHRP 2 (enc/MVMT) |
| 7 | - | 3.36 | 1,722.53 | - | 1.37 | 1,061.24 |
| 8 | - | 3.25 | 1,670.16 | - | 1.32 | 1,028.89 |
| 9 | 1.25 | 3.43 | 1,762.55 | 1.5 | 1.14 | 886.45 |
| 10 | 1.15 | 1.28 | 659.04 | 1.3 | 0.93 | 724.29 |
| 11 | 1.03 | 1.29 | 661.74 | 1.05 | 0.88 | 686.39 |
| 12 | 1.00 | 1.00 | 513.29 | 1.00 | 1.00 | 777.14 |
| 13 | - | 0.82 | 420.10 | - | 1.65 | 1,281.77 |
| 14 | - | 1.11 | 571.88 | - | 2.33 | 1,807.36 |
| 15 | - | 3.78 | 1,942.54 | - | 2.94 | 2,284.40 |
| 16 | - | 6.24 | 3,181.27 | - | 3.01 | 2,340.39 |

In RSAPv3, the EMFs for speed limit were computed relative to 65-mph roadways (Table 57). In SHRP 2, there were not enough miles traveled on 65 mph, undivided roadways to compute an EMF. Therefore, for SHRP 2, the EMF was instead computed relative to 55-mph roadways. On undivided roadways, lower speed roads tended to have larger EMFs (Figure 13). On divided roadways, 55-mph roads had the highest EMF. For every posted speed limit, the EMF on divided roadways was lower than on undivided roadways. However, the rate of encroachments was higher on divided 55-mph roadways (1,025 encroachments per MVMT) compared to undivided 55-mph roadways (335 encroachments per MVMT). Unlike the RSAPv3 estimates, the SHRP 2 EMF estimates do not control for the number of lanes.
Table 57. EMFs by Speed Limit for Divided and Undivided Roadways
| Divided | Undivided | |||||
|---|---|---|---|---|---|---|
| Speed Limit | RSAPv3 EMF | SHRP 2 EMF | SHRP 2 (enc/MVMT) | RSAPv3 | SHRP 2 | SHRP 2 (enc/MVMT) |
| None | - | 0.72 | 741.73 | - | 6.04 | 2024.59 |
| 20 | - | - | - | - | 5.16 | 1728.26 |
| 25 | - | 0.78 | 796.29 | - | 5.65 | 1892.49 |
| 30 | - | 0.95 | 977.64 | - | 3.69 | 1238.60 |
| 35 | - | 0.76 | 778.54 | - | 1.97 | 661.42 |
| 40 | - | 0.45 | 462.69 | - | 1.62 | 544.51 |
| 45 | - | 0.36 | 371.16 | - | 1.48 | 497.05 |
| 50 | - | 0.79 | 806.55 | - | 0.88 | 294.62 |
| 55 | - | 1.00 | 1024.71 | - | 1.00 | 335.24 |
| 60 | 1.179 | 0.51 | 521.39 | 1.423 | - | 49.15 |
| 65 | 1.00 | 0.56 | 568.84 | 1.00 | - | - |
| 70 | 1.00 | 0.12 | 123.59 | 1.00 | - | - |

The EMFs for horizontal curvature were computed in SHRP 2 for 100-ft increments in the radius of curvature relative to a tangent road section. The estimated EMF was larger for roads with a smaller radius of curvature, or a tighter curve (Figure 14).

4.3.4 Discussion and Future Work
The SHRP 2 encroachment rate was much higher than that of the RSAPv3 for both two-lane undivided and four-lane divided roadways. This could be due to the Cooper data being left-censored, in that very few of the encroachments with a lateral excursion less than 2 m (6.6 ft) were captured. The Cooper data typically only captured encroachments that left the pavement and traversed across the shoulder. The method described in the RSAPv3 Engineer’s Manual (Ray et al. 2012, Appendix B) adjusts for the left-censoring assuming a Poisson distribution, which leads
to the encroachment rates increasing by 44% for undivided roads and 34% for divided roads. In contrast, the SHRP 2 dataset was limited to encroachments with at least a 1-ft lateral excursion. Because the encroachment rate in SHRP 2 was higher than that in RSAPv3, the proportion of unrecorded small encroachments may be larger than the estimated 44% for undivided roads and 34% for divided roads in the Cooper data.
One of the limitations in using the SHRP 2 dataset to compute EMFs was the relatively small population of drivers sampled. This study assumed that the encroachment rate of drivers in SHRP 2 were no different than the U.S. driving population. However, the SHRP 2 study specifically recruited teenage drivers and older drivers. These populations are overrepresented compared to the U.S. driving population, and they also may be more likely to depart the roadway. This could contribute to the large encroachment rates observed in SHRP 2.
One of the key differences between the SHRP 2 EMFs and the RSAPv3 EMFs was how the values were computed. The RSAPv3 EMFs were estimated from Poisson regression that accounted for multiple road factors, including AADT. The SHRP 2 EMFs were computed individually based on the exposure to each road type and not from a model coefficient. This method can allow nonlinear relationships between a factor and its EMF to be identified. For example, the SHRP 2 calculated EMF for vertical road grade was reduced for roads with a 4% to 5% uphill or downhill grade. This method that can capture the nonlinear relationship was only possible due to the large size of the SHRP 2 dataset relative to other datasets containing encroachments. Future analyses could utilize a Poisson regression technique to estimate the EMFs and account for multiple roadside factors simultaneously.


