Paratransit Fleet Configurations (2024)
Chapter: Chapter 3 - Survey
CHAPTER 3
Survey
This chapter describes the purpose, methodology, and results of the fleet configuration survey conducted as part of this synthesis effort.
Survey Purpose
The purposes of the survey were to:
- Learn how transit agencies have configured their paratransit fleets
- Learn why transit agencies changed their paratransit fleet configurations
- Learn what benefits, challenges, and lessons learned came with those changes
- Identify transit agencies for more detailed discussions in the form of case examples
The remainder of this chapter summarizes the survey methodology and results.
Methodology
The first step in designing the survey instrument was to consider what data would be collected. In short, the purpose of the survey was to collect information about how and why transit agencies have diversified their paratransit service’s dedicated fleet or why they chose to maintain or revert to a uniform fleet. Second, the authors were interested in collecting data on what benefits and other unexpected outcomes resulted from those changes. Last, the authors wanted to determine whether and how the changes led to changes in scheduling, dispatching and operations, and planning decisions.
The survey instrument was presented to the SB-38 project panel for review. Panel feedback was used to modify and add to the questions on the survey.
The next step was to create the online version of the survey from the survey questions. The final version of the survey can be found in Appendix A. The online survey was pilot-tested first by TTI staff (not affiliated with the project) and then by one of the panel members. The survey was launched in early February 2023 and remained open until March 17, 2023. A request to participate in the survey, along with the final link, was then sent to hundreds of transit agencies and other organizations with the assistance of several entities:
- APTA assisted the effort by getting out the link via APTA connect.
- CTAA included the survey link in its February 22, 2023, newsletter.
- National Rural Transit Assistance Program (RTAP) shared the survey with its eNews mailing list on February 12, 2023, and with its Twitter followers on February 21, 2023.
- Requests for assistance in distributing the survey link were also sent to all state departments of transportation (DOTs) and all known state and regional transit associations, as well as to
- the national transit/operations companies. However, it was difficult to identify which state, association, or company actively complied.
TTI bolstered this effort by sending requests to several transit agency colleagues around the country. Because the early survey returns were mostly from smaller to midsize transit agencies, these additional requests were sent to larger transit agencies and resulted in several completed surveys returned, thereby ensuring a more varied survey response in terms of paratransit service size. In total, TTI received 80+ surveys. Many of the surveys were not completed or pertained to services that were provided primarily to the general public. The SB-38 panel directed TTI to screen out the surveys that pertained primarily to the general public, leaving the TTI researchers with 37 pertinent survey responses, with 10 of these respondents completing the entire set of survey questions. A list of these 37 transit agencies is found in Appendix B. The locations of these transit agencies are shown in Figure 1. The findings from these surveys were then analyzed using tools available in the online survey.

Survey Results
Type of Paratransit Service
The first survey question asked responding agencies about the types of paratransit services they provide. Twenty-four agencies provide ADA complementary paratransit, while 13 provide services to ADA paratransit-eligible riders plus other specific types of riders.
Paratransit Ridership and Fleet Size
The first question then asked responding agencies about their paratransit ridership in 2022. Utah Transit Authority reported the largest ridership of over 1.5 million passenger trips. In comparison, the County of Hawai’i Mass Transit Agency (on the Big Island of Hawaii) served 2,728 passenger trips.
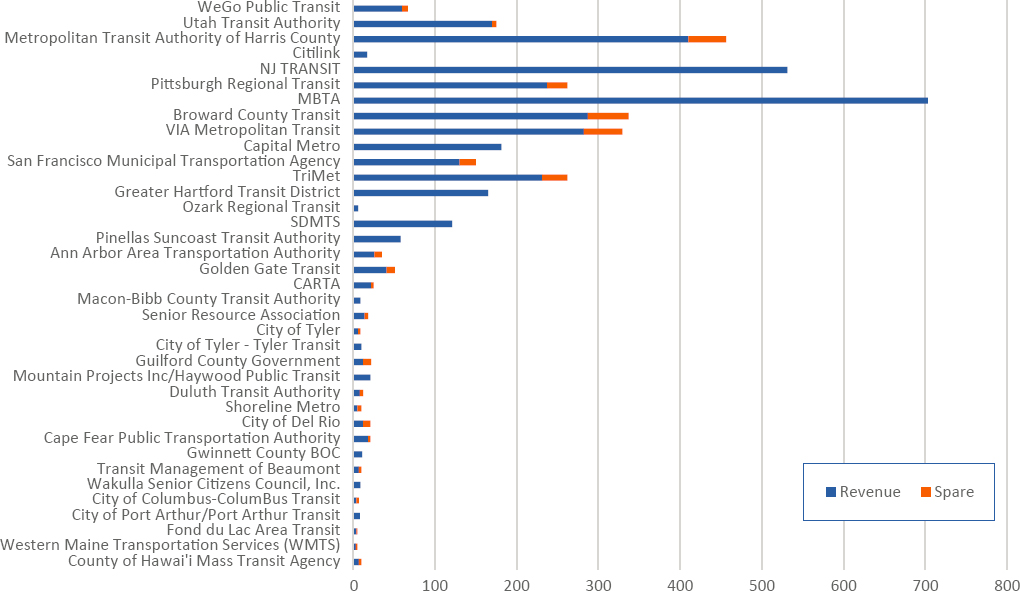
Figure 2 shows the number of vehicles used by the responding transit agencies to provide paratransit service. The mix of revenue and spare vehicles is also shown in Figure 3. Twelve agencies indicated they had no spare vehicles (and two did not answer), while 23 agencies indicated that they did have spare vehicles.
Paratransit Fleet Uniformity
The survey asked responding agencies about the distribution of respondents who had a uniform paratransit fleet versus respondents who had a fleet mix of vehicles of varying sizes and types. Fourteen of the 37 agencies have only one type of dedicated vehicle to provide services. The remaining 23 agencies each had two or more vehicle categories. Two agencies, Tyler (Texas) Transit and NJ TRANSIT, in New Jersey, use five different vehicle types for their paratransit services.
Paratransit Fleet Accessibility
In the section of the survey that sought to ascertain whether responding agencies had an all-accessible dedicated fleet versus a fleet mix of WAVs and non-WAVs, the TTI team decided to divide those fleets into three categories:
- All-accessible fleet with the same size/type of vehicles (uniform fleet of WAVs)
- All-accessible fleet with different sizes and types of WAVs (non-uniform fleet of WAVs)
- A fleet mixture of WAVs and non-accessible vehicles
No respondent had a 100% non-accessible fleet, which is likely because the survey focused on paratransit fleets. Among the 37 responding agencies, there was a fairly even split among the three categories.
WeGo’s Access service in Nashville, Tennessee, is an example of a transit agency with a uniform paratransit fleet of 60 WAVs (with each vehicle having a maximum of 12 seats and three wheelchair positions). Houston, Texas, METRO is an example of an agency that operates an all-accessible dedicated 456-vehicle fleet for its METROLift paratransit but with different types of WAVs. The contractors for Pittsburgh (Pennsylvania) Regional Transit’s ACCESS service collectively operate a mixed fleet with 181 WAVs and 81 non-WAVs.
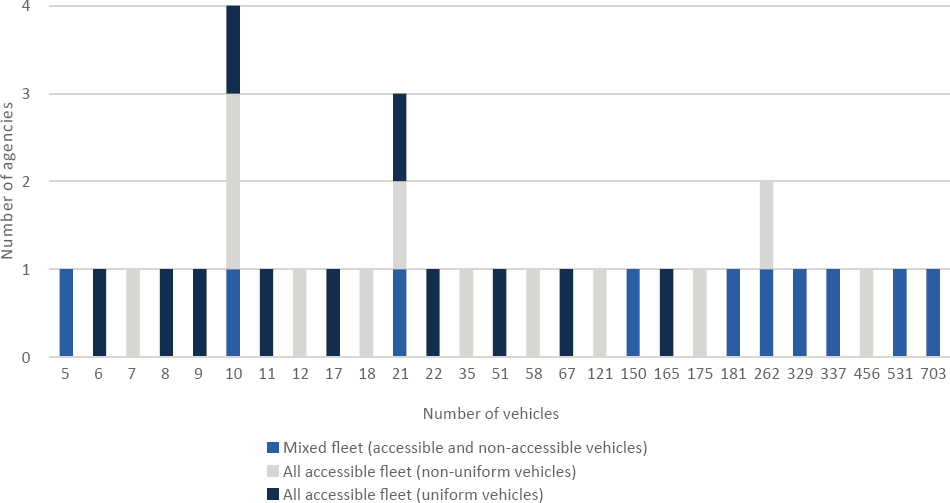
Paratransit Fleet Accessibility by Fleet Size
Figure 4 shows that uniform, all-accessible fleets are more common in smaller fleets, while mixed fleets are more common in larger fleets. Meanwhile, the non-uniform accessible fleets appear to be less connected with fleet size.
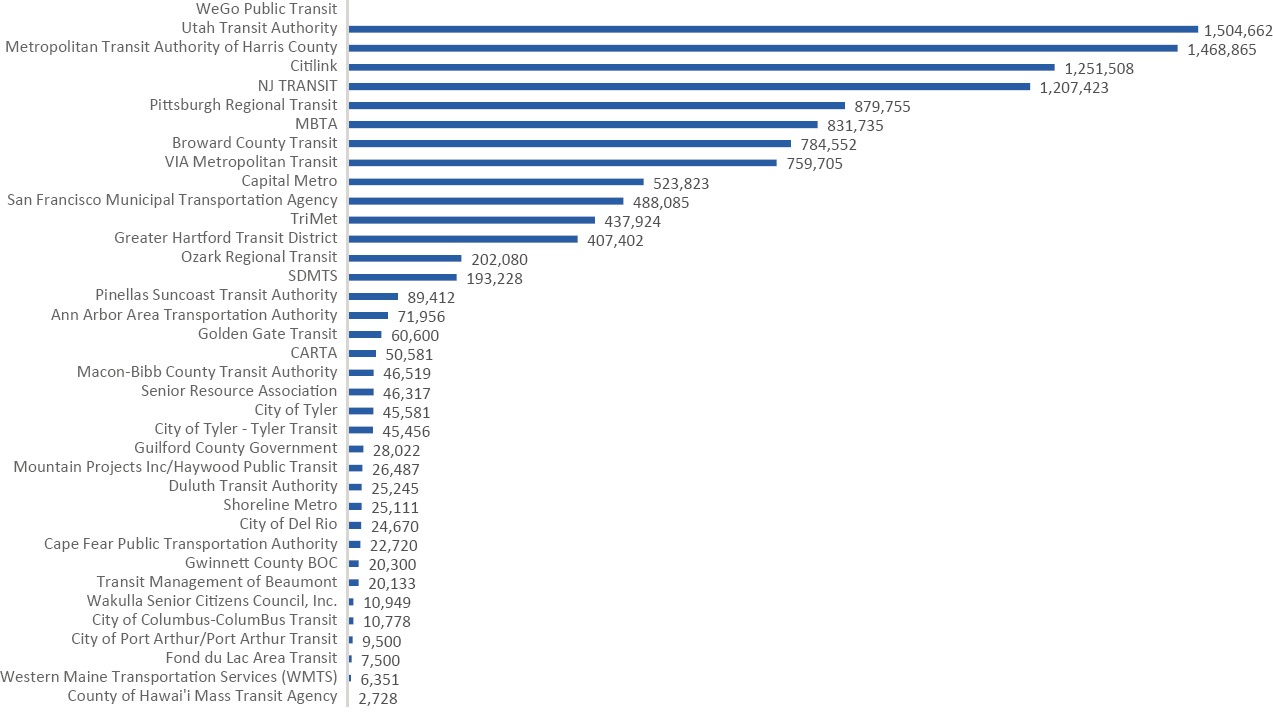
Figure 2. Paratransit ridership (2022).
Paratransit Fleet Accessibility by Percentage of Accessible Vehicles
Twenty-five responding agencies have all-accessible vehicle fleets, further grouped into those with a uniform fleet of WAVs and those with a non-uniform fleet of WAVs. The number of agencies with various gradations of accessibility with respect to the mixed fleets is as follows:
- Nine agencies had a 100% accessible fleet
- Eight agencies had between 50% and 75% of their fleet that was mixed-accessible
- Eight agencies had a 100% uniform-accessible fleet
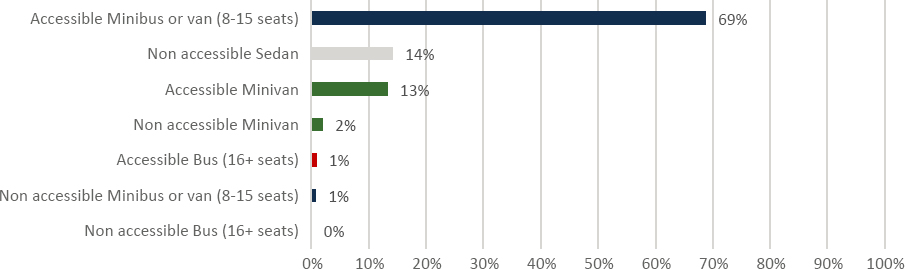
Paratransit Fleet Accessibility by Vehicle Type
Figure 5 shows the percentage of the 4,007 dedicated paratransit vehicles being collectively operated by the survey respondents (or their contractors) by vehicle type. The most common vehicle type, reflecting 69% of all vehicles, is the accessible minibus or van (8–15 seats). Based on the case examples, most of these are likely cutaways. Figure 5 also shows that only 1% of the cutaways are not accessible. The next most common vehicle types are non-accessible sedans and accessible minivans, at 14% and 13%, respectively. The accessible versus non-accessible vehicle types reflect 17% of the vehicles, while WAVs reflect 83% of the vehicles in the paratransit fleets, on average.
Paratransit WAV Accessibility Equipment
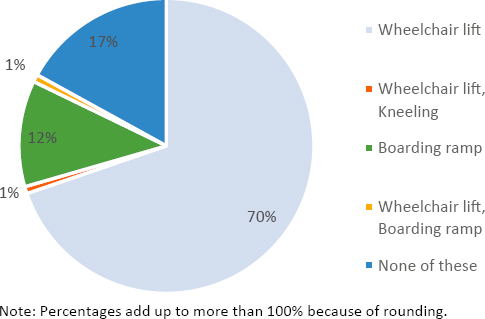
Figure 6 shows the proportions of various accessibility features equipped on responding agencies’ fleets, which are composed of 4,007 vehicles (non-accessible vehicles included). The most common accessibility feature (70% of vehicles) is the wheelchair lift, or 71% of the vehicles with both lifts and kneeling capabilities. Twelve percent of all vehicles (all minivans) have a boarding ramp. However, 17% of all vehicles were not equipped with any accessibility features. This number includes sedans (14%), non-accessible minivans (2%), and non-accessible minibuses or vans (1%).
Paratransit Vehicle Wheelchair Capacities
A breakdown of the 4,007 vehicles represented in the survey responses by the number of wheelchair positions is shown in Table 1.
As shown in the table, WAVs composed 83% of the vehicles. Of 3,326 WAVs, the 1,088 vehicles able to accommodate up to two wheelchairs reflect 33%. The next most common is the 921 WAVs
with three wheelchair positions that reflect 23% of the WAV vehicles. Together, these two vehicle types (1,088 + 921 = 2,009 vehicles) reflect 60% of the WAV fleet and 50% of the total 4,007 vehicles.
One finding in Table 1 was the 170 midsize WAVs that can accommodate up to six wheelchairs. The Utah Transit Authority (UTA) operates all 170 for its Special Services. In a follow-up interview, UTA’s acting chief operating officer (COO) and former head of Special Services said that about 70% of the pre-COVID-19 Special Services trips were dually eligible subscription trips being taken by clients of sponsoring agencies such as United Cerebral Palsy and by Medicaid (especially for Home and Community Based Services enrollees with intellectual and developmental disabilities going to and from day programs). The UTA COO also reported that many of these subscription trips are being taken by riders in wheelchairs and that in about 5% of the trips, all six wheelchair positions are used. Furthermore, the COO pointed out that the vehicles were configured to use flip seats in the same space as all six wheelchair positions.
Paratransit Vehicles by CDL Requirement
Figure 7 shows the percentage of buses and minibuses being operated by the respondents that require a CDL driver. As shown, about 20% of midsized vehicles require a CDL driver, while 83% of the larger buses require a CDL, noting that the definition of passenger vehicles that require a CDL (in terms of weight and maximum capacity) varies from state to state.
Table 1. Revenue vehicles and wheelchair spaces.
| Vehicle Types | Number of Vehicles By Wheelchair Positions | Total WAVs | Total Vehicles | Percentage | ||||||
|---|---|---|---|---|---|---|---|---|---|---|
| 0 | 1 | 2 | 3 | 4 | 5 | 6 | ||||
| Sedans | 569 | 0 | 569 | 14% | ||||||
| Minivans | 80 | 460 | 74 | 534 | 614 | 15% | ||||
| Midsize vehicles (8-15 passengers) | 32 | 53 | 1002 | 907 | 607 | 17 | 170 | 2756 | 2788 | 70% |
| Large vehicles (16+ passengers) | 0 | 0 | 12 | 14 | 0 | 10 | 0 | 36 | 36 | 1% |
| All vehicles | 681 | 513 | 1088 | 921 | 607 | 27 | 170 | 3326 | 4007 | 100% |
| Percentage | 17% | 13% | 27% | 23% | 15% | 1% | 4% | 83% | 100% | |

Use of Non-Dedicated Overflow Providers
In looking at the usage of non-dedicated service providers for overflow, 24 responding agencies do not use non-dedicated service providers, while 10 agencies use non-dedicated overflow service providers. Of the 10 agencies using non-dedicated service providers, the percentage of trips assigned to overflow providers ranges from 3% to 46% of annual paratransit trips. In addition, those 10 agency providers had fairly large paratransit services. Six had dedicated paratransit fleet sizes ranging between 121 and 465 vehicles, while four had dedicated paratransit fleet sizes ranging between 10 and 58.
Impact of Overflow Providers on Fleet Mix
The data do not show a relationship between the use of overflow providers and transit agencies having an all-accessible, if not uniform, dedicated fleet. Instead, the survey results show that of the 10 transit agencies that do use overflow providers, about seven have an all-accessible fleet. Of the 24 transit agencies that do not use overflow providers, 16 have an all-accessible fleet.
Changes in the Configuration of the Paratransit Fleet
Twenty-four responding agencies made no changes to their paratransit fleet configuration in the last five years, while 10 agencies did make changes. Possible reasons for the changes are discussed in the next section.
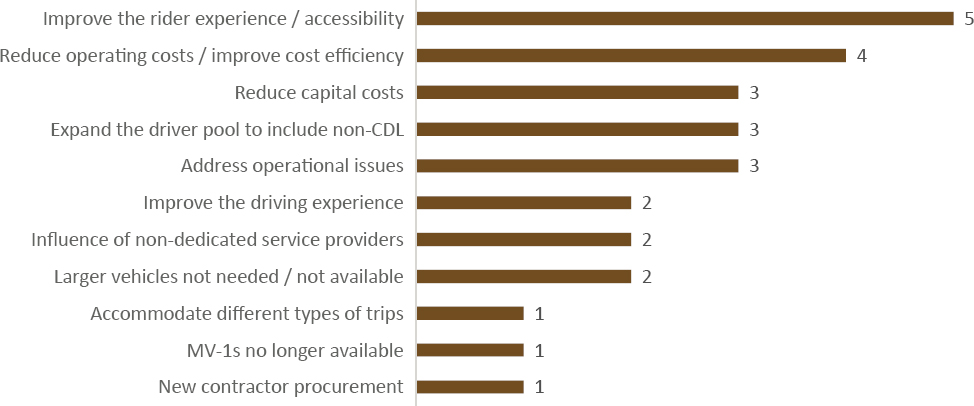
Reasons for Fleet Reconfiguration
Ten of the 37 agencies responding to the survey also indicated the underlying reasons that they opted to make a change in their paratransit fleet configuration. The most common reasons were to improve the riding experience and accessibility for riders, followed by improving cost-efficiency and reducing operating/maintenance costs, reducing capital costs, expanding the driver pool to include non-CDL drivers, and addressing operational issues with smaller vehicles (see Figure 8).
Benefits of Fleet Reconfiguration
Seven of the 10 responding agencies that did make changes reported achieving expected benefits, two reported achieving partial benefits, and one agency did not find any differences.
Significant achievements include improving service efficiency, scheduling flexibility, and riding experience. As for the two agencies that reported achieving partial benefits, the cost of the new fleet was the major contributor that resulted in the agencies not being fully satisfied with the fleet changes. No further explanation was provided for the agencies’ reported lack of benefits.
Other Impacts of Fleet Reconfiguration
Table 2 shows whether those 10 responding agencies perceived there to be an impact of reconfiguring their paratransit fleets on various functions, policies, or procedures.
Five of the responding agencies indicated that their fleet reconfiguration had a positive impact on the ease of scheduling and dispatching and that this, in turn, improved service efficiency. Five of the responding agencies also stated that the fleet reconfiguration impacted their vehicle purchasing and retirement plans. The primary reason mentioned by these agencies was replacing traditional cutaway buses with smaller vehicles to provide a more economical alternative and a more flexible service. In some of these cases, the state vehicle programs had different retirement ages/mileages for the smaller vehicles.
Two of the responding agencies experienced unexpected challenges related to fueling and maintenance issues. One agency mentioned specific challenges in implementing new procedures/
Table 2. Impacts of fleet configuration.
| Impacts on… | Yes | No |
|---|---|---|
| Scheduling/Dispatching | 5 | 5 |
| Vehicle Purchasing/Retirement Plans | 5 | 5 |
| Fueling and Maintenance | 2 | 8 |
| Hiring | 1 | 9 |
| Service Supply Levels | 1 | 9 |
| Service Performance Standards | 1 | 9 |
| Operational Policies and Procedures | 0 | 10 |
protocols or equipment to accommodate vehicles with different vehicle types or fuel grades and fueling protocols. Another agency mentioned having to retrain mechanics on the new vehicles and expanding their parts inventory. One agency indicated that the fleet reconfiguration impacted their hiring, specifically because they were now able to hire operators that did not hold CDLs.
Another agency, Pinellas Suncoast Transit Authority (PSTA), featured as a case example in Section 4, reported that the fleet changes were instrumental in being able to provide more service. However, this may have had more to do with the fleet reconfiguration change created by hiring a new contractor and implementing a new service that reflected a higher use of non-dedicated vehicles. PSTA also mentioned that the fleet change led to a need for stricter performance standards. However, it is similarly suspected that this may have had more to do with the fleet reconfiguration change that was created by hiring a new contractor under a new service model.
And lastly, none of the 10 agencies perceived that the fleet configuration changes had any impact on operational policies or practices.


