Toward a New Era of Data Sharing: Summary of the US-UK Scientific Forum on Researcher Access to Data (2024)
Chapter: 2 Addressing the Challenges of Data Volume and Heterogeneity
2 | ADDRESSING THE CHALLENGES OF DATA VOLUME AND HETEROGENEITY
TODAY’S SCIENTIFIC OBSERVATIONS, experiments, and simulations can generate huge volumes of data, and the datasets pertaining to a given research question can be extremely heterogeneous. Both factors “get in the way of interoperability,” said Feryal Özel, professor and chair of the School of Physics at the Georgia Institute of Technology. Experiments in genomics, high-energy physics, climate, and other fields are generating terabytes, petabytes, and exabytes of data. The formats of different datasets may not be familiar even to everyone within a single discipline, much less across disciplines. “We’re building amazing instruments,” said Özel, but they are generating data that cannot be easily analyzed, interpreted, or transferred.
As an example, Özel described her own experiences with the Event Horizon Telescope, which took the first two photographs of black holes in our galaxy and in the galaxy Messier 87. Consisting of 10 telescopes scattered across the globe, the project recorded 1 petabyte of data per night. “The hard drives from our 2017 campaign weighed more than half a ton and were FedExed in crates,” she said. Transferring such large quantities of data from place to place and making such data available to researchers have posed problems, requiring in some cases that researchers who want to work with the data be in close proximity to where the data are stored. “This requires a different type of infrastructure that we’ve begun to invest in. But it is not mature to the level that it’s readily accessible and used, at least in my community.”
Özel also pointed out that big data and big computing are intertwined. Sometimes big computing generates large amounts of data; in other cases, big computing is applied to massive datasets from the analysis and interpretation of data that have been collected. For example, Özel has been involved in large-scale simulations of the behavior of plasma around a black hole to understand and interpret telescopic data, and collecting and organizing all the simulations from multiple groups around the world has been a challenge. The data have been generated using different simulations, coding schemes, data formats, and assumptions, which has made the simulations difficult to compare. People in the collaboration also tended to be resistant to learning new ways of generating, formatting, accessing, and analyzing data. Instead, they often analyzed just a subset of the data, making it difficult for them to gain a global view of the simulations that were done.
The first session of the forum explored how new developments and approaches, from organizational techniques to federated systems and artificial intelligence (AI)-driven tools, can help researchers overcome the access barriers caused by very large or heterogeneous datasets. Drawing on real-world examples in the fields of astrophysics, genomics, and environmental science, the session examined possible responses to managing data volume and curating data that lack uniformity.
Making Astronomical Data Accessible and Usable
The challenges of data volume and heterogeneity are evident in the plans being developed for the Vera C. Rubin Observatory, said Leanne Guy, data management scientist at the observatory. The Rubin Observatory is a large-
aperture, wide-field, ground-based telescope located on Cerro Pachón in Chile that is scheduled to start operations in 2025. Though its primary mirror is more than 8 meters across, the Rubin Observatory is not the biggest telescope ever constructed, Guy said. What makes it unique is its very large field of view—the equivalent of more than seven full moons across—combined with its light-collecting area. The telescope can also move very quickly, slewing from one image to a new field of view in just 4 seconds. This combination of features will enable the telescope to image the entire visible southern sky, along with some of the lower parts of the northern sky, in just three nights.
In its first 10 years of operation, the Rubin Observatory will execute as its prime mission the Legacy Survey of Space and Time (LSST), a wide, fast, and deep sky survey that will enable researchers to better understand dark matter and dark energy, the structure of the Milky Way, the constituents of the solar system, and transient events such as supernovae and variable stars. The LSST will generate immense quantities of data—20 terabytes of data per night, or about 5 petabytes per year. The final dataset will consist of 6 million images, representing half an exabyte of derived data products. “The legacy of this dataset will be enormous and will live on well past the lifetime of the survey itself,” said Guy.
The data management system for the observatory will produce a variety of data products that will be released on different timescales to the community. Alert streams will go out every 60 seconds so that rapidly changing events can be detected quickly and studied. Every 24 hours, the databases associated with the alert streams will be updated. Every 80 hours, images will be made available. A fully processed and calibrated version of the catalogs will be released every year. “These different timescales are meant to enable different science and to ensure that the community gets access to our data as soon as it’s available,” said Guy.
Downloading petascale datasets onto a laptop to analyze data locally is not feasible. Instead, the observatory has established the Rubin Science Platform to allow scientists to access, visualize, subset, and perform next-to-the-data analyses. Through a set of web-based applications, the platform will democratize access to the data by providing the same level of access to everyone with an internet connection, irrespective of where in the world they are and what resources they have.
The LSST is an optical and near infrared survey, and much could be learned by combining the LSST data with data from other telescopes. The Rubin Science Platform supports integration with these other data products through protocols developed by the International Virtual Observatory Alliance (IVOA).1 Even if it is infeasible for petabyte-scale survey datasets to be copied from one location to another for analysis, a network of interoperable science platforms could enable researchers “to do vastly more science.”
Finally, the Rubin Science Platform has been designed to share knowledge with, educate, and support a large and diverse community of people to work with its data products and ultimately publish science. It uses a platform called Discourse to have a forum where someone can ask a question and get responses from a global community of thousands of people.
The Rubin Observatory is committed to open science, Guy concluded. Its 1.5 million lines of code are all publicly accessible on GitHub. Documentation is comprehensive, high-quality, and easily discoverable. The observatory is committed to lowering the barriers to doing science, especially for under-resourced and under-represented communities, by providing the same level of power and accessibility to any user with an internet connection. Though some data are subject to a 2-year proprietary period, alerts, prompt processing of images, and catalogs are fully public around the world. Interoperability and standardization will make it possible to combine datasets to get the maximum amount of science out of the survey. By making data widely accessible, the observatory hopes to engage the public in its exploration of the universe.
___________________
1 Desai, V., M. Allen, C. Arviset, et al. 2019. A science platform network to facilitate astrophysics in the 2020s. Bulletin of the American Astronomical Society 51(7).
Managing and Providing Pharmacogenomic Data
Business magazines often compare data to oil, noted Casey Greene, founding director of the Center for Health AI at the University of Colorado, but “at least in my experience this does not appear to be true.” Oil is consumed with use, whereas the genomic data Greene and his colleagues use become better understood and therefore more valuable with use. Though some uses of oil may require different kinds of refining, the underlying feedstock is largely fungible, whereas data have specific contexts in which they are valuable and may not have much value outside those contexts. Oil is refined through an infrastructure that is expensive to construct, whereas data can be made useful through many paths, from infrastructure-heavy experimentation to small-batch “artisanal” analyses.
Greene also pointed out that sometimes people think of him as being in the data business, but he thinks of himself as being in the serendipity business. “I want you to have an aha moment. I want you to see something in your data that you did not expect that leads you to make a different decision.” Someone who is in the data business tends to want to hoard and limit the use of data. Someone in the serendipity business wants to link and interconnect data.
At the Colorado Center for Personalized Medicine, Greene has been involved in the return of pharmacogenomic data to patients to guide care. Seven out of 10 people, at some point in their lives, will receive a prescription for a medication that could be affected by their genetics. Physicians could order a pharmacogenomic test when they prescribe those medications, but generally they do not, said Greene, because using the results would require lengthy and expensive interpretation. Greene and his colleagues have instead put the information that physicians need in a database so that if a provider makes a medication decision that could be influenced by a patient’s genetics, an alert will pop up in the electronic health record. “This puts that information at hand the moment it’s needed. It’s essentially industrializing serendipity.”
The ultimate goal is to have genomic data available not just for pharmacogenomics but also in all areas of health care with all types of data. This will require the integration of many types of data from many sources, which will be possible only if the data are open and can be linked, Greene said. In addition, data linked to health are much more expensive to gather and analyze than the data that tech companies gather from cellphones and computers, biomedical experiments can be expensive, samples are often irreplaceable, and diseases may affect only small groups of people.
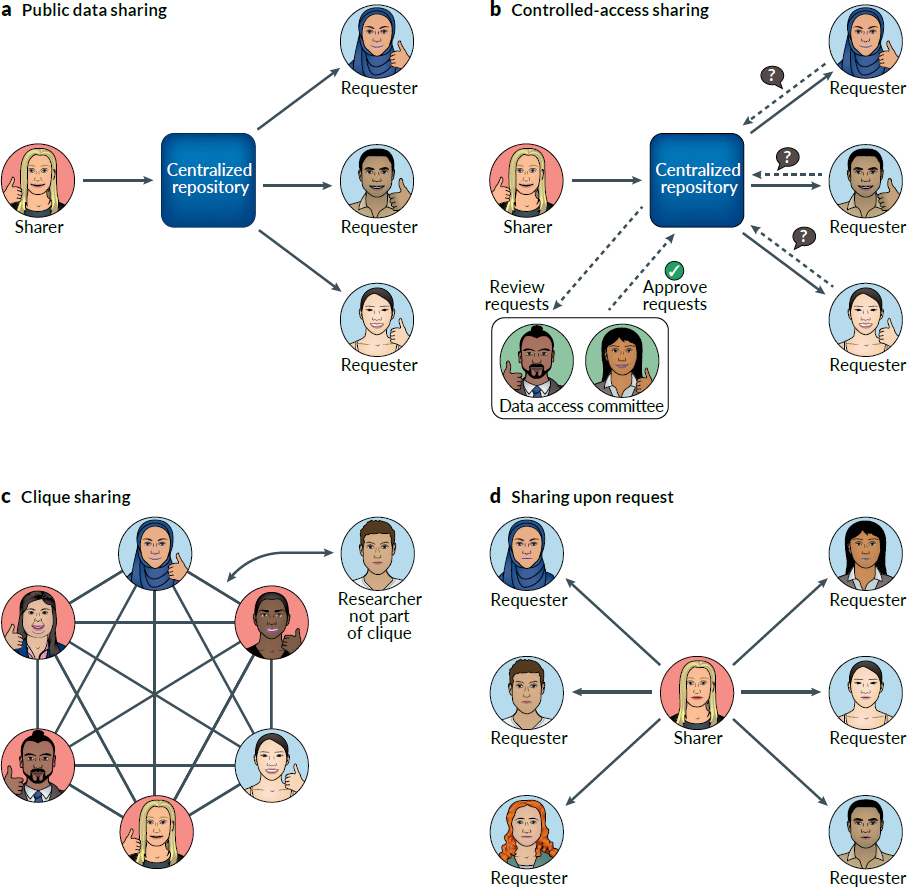
Genomic data can be shared in a variety of ways (see Figure 2-1). If data are sent to a central repository, sharing can be either controlled or open. Data may be shared among groups or upon request. Some data may have no privacy implications, but data from human subjects may need controlled access.
For data sharing to be effective, there should be a single point of truth, Greene said, and that single point of truth should be in the most widely used repository for that data type. Other platforms that integrate data, such as the “commons” being developed for much health data, should derive their data from those single points of truth, because “once you get away from the right data type, all of a sudden it becomes very hard to integrate those data across studies.” In addition, the barriers to entry and aggregation should be low, said Greene.
The policies of funders have a substantial effect on data sharing. Drawing from a resource sharing policy developed by Alex’s Lemonade Stand Foundation, Greene pointed out that a major goal of data sharing is to enable faster translation of research into cures.2 Incentives for sharing include reviewing both data-sharing plans and past sharing behavior as part of the peer review process. Accountability can be enhanced by making future grant funding contingent on adherence to a data-sharing plan. A relatively small number of funders can have an “outsized impact” by instituting such policies, he observed.
___________________
SOURCE: Byrd, J.B., A.C. Greene, D. Venkatesh Prasad, X. Jiang, and C.S. Greene. 2020. Responsible, practical genomic data sharing that accelerates research. Nature Reviews Genetics 21:215–239.
Analyzing and Disseminating Data in Near Real Time at the National Oceanic and Atmospheric Administration
As part of its mission to understand and predict changes in climate, weather, ocean, and coasts; to share that knowledge and information with others; and to conserve and manage coastal and marine ecosystems and resources, the National Oceanic and Atmospheric Administration (NOAA) collects immense quantities of data that it must analyze and disseminate to researchers and the public. Megan Cromwell, assistant chief data officer with NOAA’s National Ocean Service, described a particular challenge as an example of the broader issues: the data gathered by the NOAA ship Okeanos Explorer, which is operated by NOAA Ocean Exploration.
The work of the Okeanos Explorer, which is the United States’ only fully federally funded exploration vessel, is inductive and conducted in real time. In the past, ships gathered data that were analyzed when the ships returned
to port, and results based on those data might have appeared years later. The Okeanos livestreams video feeds and syncs its data overnight so that people on land can access those data in near real time. “A scientist sitting in the Smithsonian can say, ‘That’s a new species. We don’t know what it is. Gather a sample of it.’ They’re actively participating in the science while we’re out there.”
As an example of the data gathered by the ship, Cromwell described the video portal in more detail. Once the ship docks, the video data that were livestreamed are transferred via hard drive to NOAA’s computers. There annotations are expanded, metadata are generated, and the video is analyzed, though analyzing an hour of video data takes 4–8 hours because the data are qualitative and need to be quantified. The video is also divided into 5-minute segments, representing approximately 5 gigabytes of data, and low-resolution versions are created and made available so that people can stream the video to look for specific things before downloading the high-resolution versions.
NOAA has also been working with the users of its data and with data analysis groups to develop AI solutions to data analysis. Algorithms can tell whether something in an image has changed or is significant and whether a scientist needs to pay attention to that image. It has also created an online, open-source, completely free training database for ocean imagery data and has invited researchers from around the world to contribute to this database.
In addition, NOAA has partnered with Ocean Vision AI to experiment with gamification. The team has been working on a video game called FathomVerse that is intended to crowdsource training data. “It’s very similar to what [the National Aeronautics and Space Administration] is doing, except it’s more complicated, because there are so many different species that we’re not aware of. There are a pair of fish species in the Gulf of Mexico where one single ray on the upper fin is the only difference between them. Yet they’re genetically different species.”
Cromwell cited the need to standardize and automate data gathering and analysis among the lessons learned from NOAA’s experiences, along with the advantages to be gained when the data access and analyses components overlap. AI, machine learning, crowdsourcing, and community engagement all hold promise in analyzing data the agency has collected, she said. NOAA faces many challenges, such as maintaining operations during major events, the heterogeneous nature of its data, shifts in government funding from year to year, and position and salary constraints in accessing talent. One approach it has taken in light of these challenges is to build products piece by piece. “We have to find ways to start building out the pieces even if we can’t do the whole picture at once.”
Creating a Digital Ecosystem for Oceanographic Data
One-stop shops for data need global supply chains, said Pier Luigi Buttigieg, principal investigator and senior data scientist at the Alfred Wegener Institute of the Helmholtz Centre for Polar and Marine Research, and the key to such chains is robust and flexible interoperability. “There’s no such thing as one [database] that lives in isolation,” he said. “The world is too complicated. We need to be able to move data around effectively.”
As an example, Buttigieg used the Ocean Data and Information System (ODIS) and the technology that lives on top of that system, the Ocean InfoHub (OIH). ODIS is designed to provide a foundation stable enough to accommodate many stakeholders, experiences, indices, and models. States have different compute infrastructures, nations have different capabilities, some people have multi-petabyte systems while others use single web pages, and policymakers have different needs than scientists, yet they all have to participate in the same system. Buttigieg cited a colleague’s comparison of information systems like ODIS to the plumbing beneath a fountain. “Everybody wants the sparkly fountain, but very few people are thinking of the boring plumbing system underneath it.”
The mission of ODIS and OIH is to build a sustainable, interoperable, and inclusive digital ecosystem for all ocean stakeholders. It is designed to do the following:
- Improve discovery and interoperability of existing information systems across sectors.
- Improve access to global ocean information, data, and knowledge products for sustainable ocean management.
- Link and anchor a network of regional and thematic nodes that will share the metadata that they choose to expose.
- Provide capacity building to support contributors and end users of OIH.
- Connect independent digital initiatives to form a diverse but interoperable and inclusive ODIS.
“Ecosystem” in this case is a sociotechnical system, Buttigieg explained. The technology to interoperate among nodes exists and works well. “It’s the social part of the sociotechnical that needs work—building agreements, building conventions, and cogoverning them in a neutral space.”
The development of ODIS, which has been occurring under the auspices of the Intergovernmental Oceanographic Commission within the United Nations Educational, Scientific and Cultural Organization, is aligned with the plans of the ongoing United Nations Decade of Ocean Science for Sustainable Development and has provided a unique opportunity “for the ocean community to come together … to share data.” ODIS links nodes through a decentralized interoperability architecture that is already used by every major search engine, and the partners aligned to this architecture are discoverable by those search engines. The partners are all independent and have complete control over what they share and how they share it, though there is some internal moderation and visibility to see that things are working properly. Any partner can build whatever interface they want—“they can choose how the fountain that they build sparkles”—to satisfy the needs of different stakeholders.
Three regions have participated in designing the project and are taking the lead on pilot projects to test interoperability between existing information hubs—Latin America and the Caribbean, Africa, and Pacific Small Island Developing States. More than 35 partners are currently integrated into the system, and when additional partners arrive, new interoperability norms and conventions are developed for those partners. The idea is that the same foundation should work for multiple implementations, such as different portals, with a build that is granular, modular, and containerized.
Goals for the future are to generate more data reports that are dashboard based and do not require trolling through publications, which provides “an incentive for scientific institutions to start plugging in and getting their research or data out there, because they know it will be visible within a week of releasing it.” ODIS is also serving as an exchange layer between other major initiatives within the United Nations, and these multidisciplinary linkages could be greatly expanded. “We’re trying to make sure that all those different initiatives with very different scientific communities behind them can talk to each other through something like ODIS.”
Creating Incentives
Incentives and disincentives in sharing data—and ways to overcome the latter—were major topics in the discussion that followed the presentation of the case studies. In biomedical research, said Greene, the ultimate incentive for data sharing is to reduce human suffering and promote health—“we should start from that.” Funders can make that point while also providing rewards for exemplary behavior, and the combination can yield quick progress.
To change behaviors, rewards have to be clear, said Buttigieg. For example, a clear reward in partnering with ODIS is that it makes the partners more visible, particularly if funders can check something like a dashboard to see if data are being shared.
Researchers can also motivate sharing, Buttigieg continued. For example, the users of ocean data can say that if data are not available through ODIS, “it doesn’t exist to us. It’s a harsh thing to say, and it doesn’t make you many friends in the consortium, but it’s capacity building.” ODIS also provides support and training to potential partners.
Sharing can be tied to the value of data not just for current research but also for future research. “Your papers will, with exceptions, be forgotten in 5 years,” said Buttigieg. “But data will be important for a long, long time.”
Data sharing is not rewarded in career progressions in many institutions, which is an impediment to sharing. One way to provide these rewards is to track the use of datasets, said Cromwell. “You get the reward of saying, ‘I published, but also these other people have published with my data.’ It’s going to take a cultural shift, a huge cultural shift, but I think it’s happening.”
Enhancing Interoperability
Interoperability is a major topic in astronomy and astrophysics in the 2020s and beyond, Guy noted. Large surveys yield immense datasets from instruments that are very specific and have different characteristics, whether they are optical telescopes, instruments that work at different wavelengths, or even different kinds of messengers, such as neutrino observatories. “How do you come up with a data model that can enable interoperability but also preserve the unique characteristics of each of these surveys and instruments? It’s very challenging.”
Astrophysics is fortunate to have the IVOA, which has worked for many years to establish standards and interoperability for the field. The Rubin Observatory, for example, has adopted what it calls a Virtual Observatory–first strategy, which means that if the Virtual Observatory has defined an interface or standard model, the Rubin Observatory will choose that rather than adopting its own standard. By following the IVOA, the Rubin Observatory sets an example for the field, which helps smaller projects pick up on the technology and standards. At the same time, the Virtual Observatory is not static, because things change over time. “You want to evolve and be very dynamic,” said Guy.
Responding to a question about the tension between stability and innovation in datasets, Buttigieg emphasized the importance of high-level, generic metadata exchange even as individual datasets use their own domain-specific standards, vocabulary, semantics, and so on. By creating a generic gateway to find disciplinary-specific schemas so that data can be shared more widely, people can become interested enough in sharing to allocate resources toward a deeper interoperability. “Getting the engineering and the ideation closer to each other is key.”
In response to a question about whether technological advances are needed to help manage large datasets, Cromwell emphasized the importance of incentivizing the rescuing of data, which is “going to be huge in the long run, because it keeps us from losing the data on hard drives.” Cromwell recommends that people use multiple arrays or have backups, both of which also could fail before data are placed into an archive. Another need is for faster pipelines to transfer data to the cloud. Currently, “it is still faster to ship a hard drive than to upload that much data, so technology is a problem,” Cromwell said.
Fostering Collaboration
A question was asked about both moving data to the compute versus moving the compute to the data and moving a community to the data rather than moving data to a community. Guy observed that bringing the community to the data through community forums can produce benefits even with very small communities, because “five more people is potentially a better group of people to help solve a question than five less people…. You start to share, [and] you start to crowdsource solutions. Even on those small scales, there’s a lot of benefit.” A major challenge, she added, is getting people out of their habits of sending emails or direct messages to others to ask questions. With a community of 10,000 astronomers worldwide, asking questions by direct messenger will not scale, she said. “We have to start changing the way people think about solving problems.”
On this point, Greene observed that not everyone bears the same cost of participating in crowdsourcing. “People bear different costs based on their backgrounds [and] based on what will be assumed about them. The
best way to have healthy environments for crowdsourcing is if those environments are safe spaces. If you don’t have a safe space, only a small number of people will participate.”
Regulatory mechanisms designed to foster collaboration need to be neutral and inclusive of affected communities, Buttigieg pointed out. If intermediaries are needed, an important factor is that they be neutral parties whose interest is the stabilization of information exchange.
Finally, Jennifer Heimberg, director of the Strategic Council for Research Excellence, Integrity, and Trust at the National Academies of Sciences, Engineering, and Medicine, reminded participants of the need to update data when they are found to be inaccurate or incomplete, such as when quality control is applied to the data or when new data are generated. “Using the most accurate datasets shouldn’t be an afterthought; it should be part of the original plan.”
Breakout Group Questions
Following the presentation and discussion of the case studies, forum participants broke into five groups to consider three questions related to the challenges of data volume and heterogeneity. The following observations made by reporters for each group should not be seen as the conclusions of the Royal Society or the National Academy of Sciences. Rather, they are starting points for further deliberation and action.
What are some challenges for sharing large volumes of data and simulation outputs between distributed institutions, researchers, and communities? What are some promising avenues to achieve this?
- The issues associated with data volume and data heterogeneity are different and have different solutions.
- No one platform is the solution to all data challenges, and heterogeneity will continue to be important to allow people to work in different ways.
- Besides moving the data to the compute or the compute to the data, money and people can be moved to either or both. However, both money and people often have constraints on their movement.
- The relationship between tools and data will have to be managed. For example, not all tools can be moved to the data.
- The issue of data sharing is not only sociological but also political. For example, some countries are reluctant to share data because of the political implications of those data.
- In 5 years, many researchers likely still will be using hard drives to store and move data because of the expense of moving everything to the cloud. For example, the amount of data generated by experiments can be unpredictable, which can be a barrier to committing to cloud-based data solutions.
- The environmental costs of working with large volumes of data are likely to increase. Even when gathering data is possible, the question must be asked: Should an experiment be done? Regulatory discussions in this area may be needed, and norms may need to be adopted.
What is one tool or resource you wish you had for organizing, accessing, sharing, and/or finding data?
- In many cases, a tool for finding data would be a valuable resource. For example, in most fields, people still find data through papers, although genomics, where data are published quickly and are available for users, is an exception. How could other fields move toward the genomics model?
- Could there be a Google Scholar for data? What are barriers to such a tool?
- Intermediaries, whether automated or not, could link data to resources in ways that help downstream users make good use of those data.
- Federal funding is inherently short term, pointing to the need for long-term funding of data generation, analysis, and stewardship.
- Long-term stewardship of data provides a way to transition among hardware generations and different groups of data users.
- Mechanisms for community input and decision making on data issues affect the transparency and acceptance of decisions, which in turn affect long-term funding for data stewardship.
- Some communities that could benefit from data need capacity building to do so, such as communities that could benefit from environmental data.
- Fields have much to learn from each other about best practices in the versioning of data and software.
- Once accepted and supported within an institution’s culture, data personnel could flourish and have enough time to implement processes that will prove useful over the long term.
- Some fields have developed interesting solutions to support data career paths, and other fields could borrow these solutions.
What are the challenges and benefits of standardizing data formats across different disciplines? What incentives may work to achieve this?
- The requirement by journals to deposit data in publicly accessible repositories is not possible in all research areas, such as some parts of translational clinical science. But focusing discussion on what data should be deposited and how to raise the standards of data sharing is important.
- A potential risk of data standardization is the loss of local nuance, though this risk can be minimized through appropriate governance and flexibility.
- Problems can arise when the costs and benefits of creating and standardizing data fall on different groups of people, and a misalignment of costs and benefits may require different funding models.
- Those who have the authority to dictate what data are important or relevant have power over those data, and this power indicates a need for accountability. Though these decisions often come from the top down, they could come from the bottom up, giving the users of data more control over decisions about what data are made available and how they are made available.
- The benefits of using common data ontologies and terminologies could be better communicated to communities that use data rather than creating new ontologies and terminologies.
- Quality and value should not be confused. Data can be of high quality but little value, whereas low-quality data can be valuable—for example, if the data are the starting point for an important line of investigation.
- Data that might be of good quality for one purpose might be of little value for something else, and data that are of no use for one person could be valuable for someone else. Similarly, data might need great certainty to serve one purpose, while they may serve another purpose while being barely significant. In some fields, the differences between high-throughput and high-performance data can raise particular challenges. The use of AI to make such decisions about the value and use of data will complicate these distinctions.
- Mandates to treat data in particular ways are of little practical value unless accompanied by the resources to carry out those mandates.


