A Roadmap for Disclosure Avoidance in the Survey of Income and Program Participation (2024)
Chapter: Appendix E: Data Collection Report
Appendix E
Data Collection Report
The panel felt that it needed to understand how Survey of Income and Program Participation (SIPP) data users access SIPP data and how they use the data. Panel members pursued multiple approaches. First, they studied publications based on SIPP data. There were three separate studies: one based on a bibliography of published studies that used SIPP data compiled by the Census Bureau, a second based on articles in the past five years across a mixture of methodological approaches, and the last based on the 50 most-cited studies based on SIPP data as defined by the Scopus citation index. The results provided in Chapter 5 reflect the papers that are included in each category, though the details in the assessments based on these studies may reflect the judgment of the analyst who summarized the papers.
The panel also decided to collect information directly from SIPP data users. However, there is no list of SIPP users to provide a valid sampling frame for a scientific sample survey. The approach that was used and its limitations are described in this appendix.
DATA COLLECTION AND RESPONSE RATES
On September 13, 2022, the National Academies of Sciences, Engineering, and Medicine’s Committee on National Statistics (CNSTAT) published notice of an invitation to SIPP users and potential users to complete a questionnaire concerning their experiences in using SIPP data. The notice was published online, through an e-blast to CNSTAT subscribers, to the American Association for Public Opinion and Survey Research Methods Section of the American
Statistical Association listservs, to users of SIPP Synthetic Beta, and by using #EconTwitter. A follow-up notice was published on September 29, 2022. The last response was received on October 5, 2022.
A total of 65 responses were received, with 41 respondents completing the full questionnaire and 24 partially completing the questionnaire. Because the notification was published as a general announcement, and neither the number who received the announcement nor the total number of SIPP users are known, true response rates cannot be calculated. However, there are 275 known users of the synthetic data, and 18 respondents reported using the synthetic data; this is approximately a 6 percent response rate for the synthetic data users.
The call for information was not designed to produce nationally representative results. Thus, these data provide a picture of the experiences of SIPP users that responded to the call for information, but a truly representative sample might show different proportions in the responses. Typically, those who are most involved and have the strongest opinions are the most likely to respond to surveys, so the results are likely to overrepresent those who are heavy users of SIPP, who care deeply if access might be changed, and who had either highly positive or highly negative experiences. They are likely to underrepresent those who might want only peripheral involvement with SIPP data, such as those who only wish to download tables.
The respondents to the questionnaire were promised that only summary statistics and possibly verbatim quotations would be made publicly available. For this reason, the database containing their responses will not be released.
CHARACTERISTICS OF THE RESPONDENTS
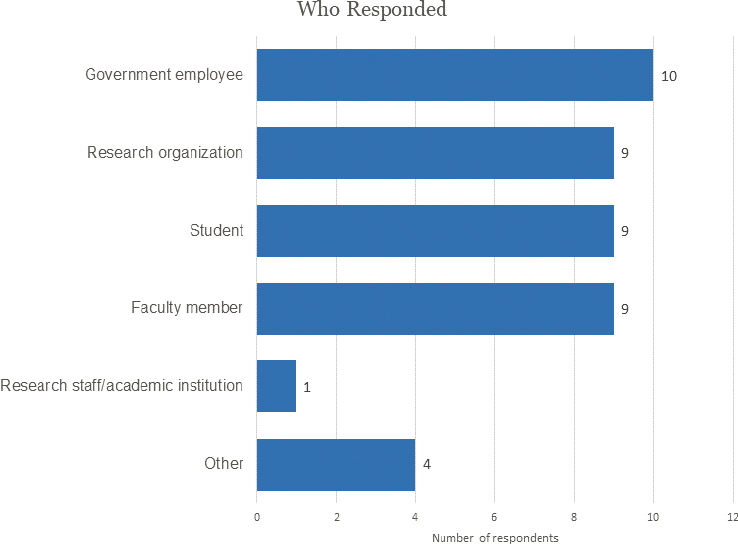
A total of 42 respondents provided information on their personal situation, with 10 being government employees, nine being faculty members, nine being students, and nine belonging to research organizations (Figure E-1).
TYPES OF DATA USED
Respondents were asked which ways they used SIPP data, with multiple responses allowed. Overall, 42 reported downloading the public-use file, 18 accessed the synthetic data, 17 downloaded tables or reports, and seven accessed the data through a Federal Statistical Research Data Center (FSRDC). Additionally, eight of the respondents had not yet used SIPP data.
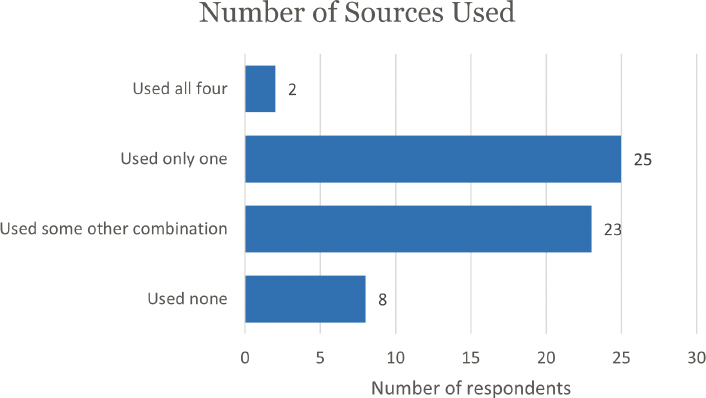
Looking at what combinations of data sources were used, two reported using all four sources, 25 reported using only one source, and 23 reported using some other combination of sources (Figure E-2).
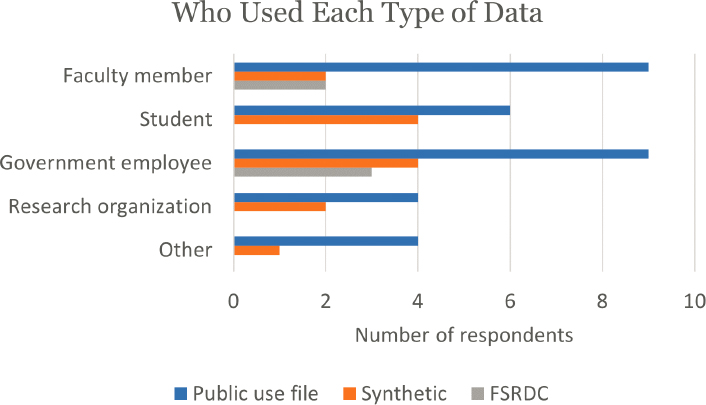
Faculty members and government employees were the most likely to use downloaded public-use data, while students and government employees were the most likely to use the synthetic data. Only government employees and faculty members used FSRDCs (Figure E-3).
WHICH DATA WERE USED
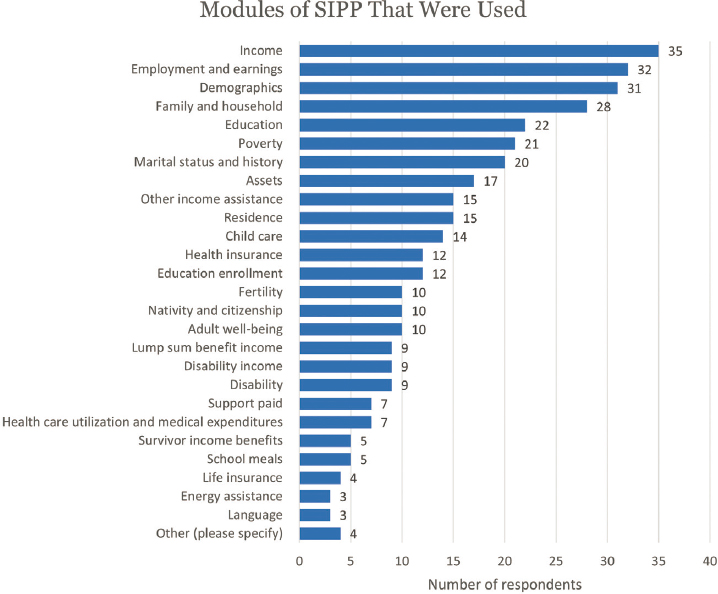
Every listed SIPP module, or topic area, was used by at least three respondents, and six were each used by at least half of those responding (Figure E-4). The most commonly used modules were income, employment and earnings, demographics, family and household, education, and poverty.
Under “Other,” respondents wrote in the following:
- “Commuting and work schedule,”
- “Informal care module,”
- “Work schedules,” and
- “Tax.”
As might be inferred from the above statistics, SIPP data users typically used multiple modules, with every respondent using at least two of the listed modules, and one using all 26 (Figure E-5).1 More than half used between
___________________
1 Of the four respondents who wrote in additional modules, only the person adding “tax” failed to mark any other modules as having been used.
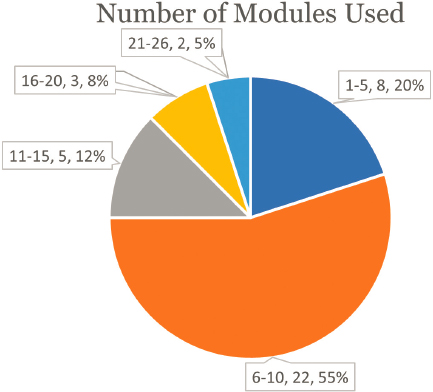
one and 10 modules, but if a package of the top 10 modules was created, that would have met the needs of only six of the 41 users. No two respondents used exactly the same set of modules.
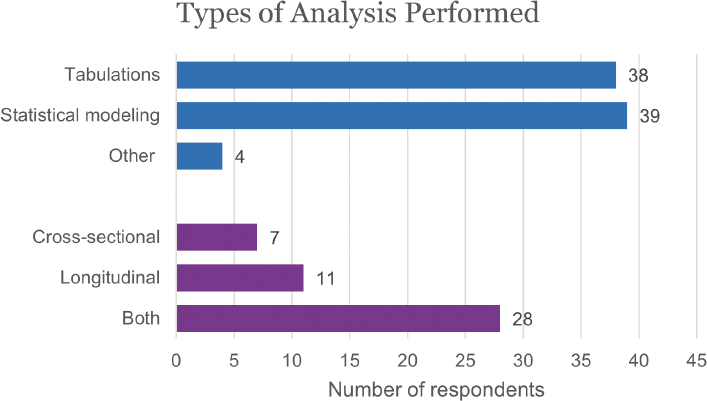
Most typically, the analysis each respondent had performed was both cross-sectional and longitudinal, and next most often it was longitudinal only (Figure E-6).
Almost all respondents performed both tabulations (83%) and statistical modeling (85%). Next to “Other,” respondents offered the following comments:
- “Small area estimation,”
- “No results,” and
- “None.”
DIFFICULTIES ENCOUNTERED WHEN USING THE PUBLIC-USE FILES
Of the 42 respondents who had downloaded public-use files, 10 experienced some kind of difficulty, including both problems with the actual data (not having needed measures or losing important details) and more general issues reflecting weaknesses in documentation and in clarity on which files to download (Figure E-7). Next to “other,” respondents wrote in the following:
- “Difficulties merging across waves due to sample redesign, questionnaire changes, especially when topical modules were used and then when they were not.”
- “The older panels were difficult to understand. Changes to the structure and variables of the panels made it difficult to compare data over time.”
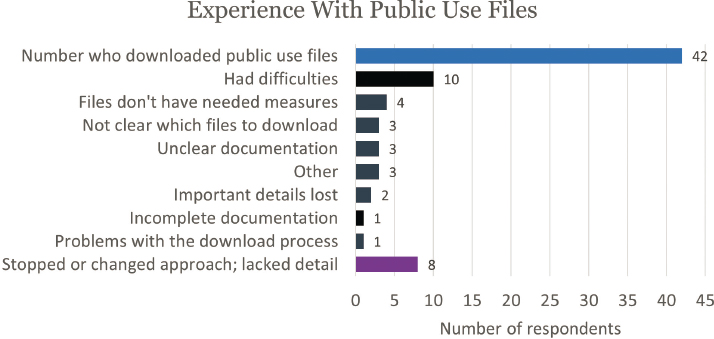
- “Found the oldest panels confusing to use. Changes to data structure and individual variables made it difficult to compare results across panels.”
Eight respondents said they either could not complete a research project or had to significantly change it because of a lack of access to detailed categories in the public data.
DIFFICULTIES ENCOUNTERED WHEN USING SYNTHETIC DATA
Fewer respondents reported using synthetic data than public-use data (18 vs. 42), and fewer reported encountering difficulties (5 vs. 10), but the percentage encountering difficulties was roughly the same (28% vs. 24%; Figures E-7 and E-8). Equal numbers reported having difficulties getting clearance for access, incomplete documentation, and unclear documentation. One person, responding to “Other,” offered the following comment:
The Cornell server and the validation server had different programming software versions. My code would run on the Cornell server but not the Census server, and I couldn’t help fix the problem. This delayed my validation request for a few weeks, but Census staff were super nice and got it figured out.
Only one respondent reported having to stop or change the research approach because of inadequate data, but this may reflect how access to the synthetic data is obtained: to gain access to synthetic data, researchers must submit a proposal that the Census Bureau determines to be feasible.
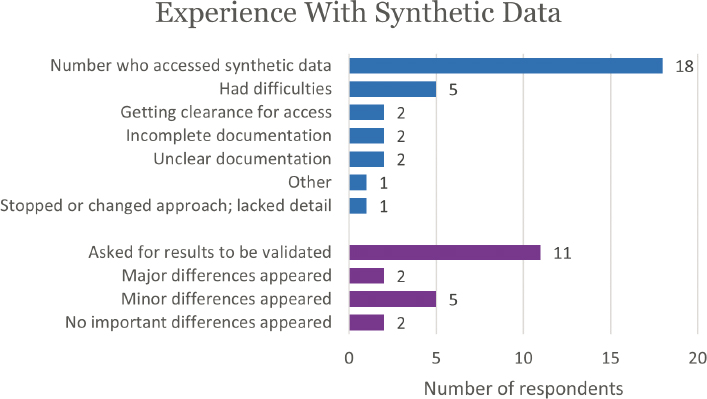
A difference between the public-use data and the synthetic data is that synthetic data users are encouraged to have their data validated on the Gold Standard File. Eleven of the 18 users reported asking for their results to be validated; two said major differences appeared, and five said minor differences appeared. Following are the comments provided by the respondents on this experience:
- “It was many years ago and I don’t remember. I used the results from the internal file, not the synthetic results.”
- “It was years ago, I don’t remember. I used the results from the confidential file (after having them reviewed).”
- “Below are some of my experiences using the SSB/GSF [SIPP Synthetic Beta/Gold Standard File] and disclosing results. I say ‘we’ because all of this work is coauthored. The big caveat here is that we haven’t done anything simple with the SSB/GSF, meaning, we haven’t done anything that uses the SSB in a way that matches how they synthesized the data (at least as I understand it). I can’t think of anything we’ve done where I would be comfortable using the point estimates from the SSB as a substitute for the GSF. An example of where things ‘worked’ is our work on mobility. In this paper, we estimate a bunch of decile transitions matrices, and some other measures of mobility that are closely related to the transition matrix. If I recall correctly, we wrote an entire draft of the paper with the results from the SSB. When we got the GSF results, we had to change point estimates, but none of
- the substantive conclusions changed. In general, mobility was lower in the GSF than the SSB, but relative mobility among groups and at different points in the initial earnings distribution remained the same and changes through time were largely the same (trends, not absolute levels). To me, this is a tough test for the SSB, and I recall being really impressed with how qualitatively close the SSB was to the GSF. An example of where things sort of work, but it is much harder to draw qualitative conclusions from the SSB, is the work on fine volatility. Volatility is a measure [of] short-run earnings [in-]stability. On the one hand, though the level of volatility is a lot higher in the SSB than the GSF, overall trends are remarkably similar. Subgroup trends by gender and race are also similar between the SSB and the GSF. Trends by education, if I recall correctly, are different enough that qualitative conclusions change between the SSB and the GSF. It’s also difficult to draw conclusions from decomposition models that try to separate short-run instability from long-run trends because transitory inequality is much higher in the SSB, and the measure of earnings used in much of the related literature relies on knowing an individual’s level of education (I’ll explain this below). Also, it’s impossible to compare estimates on the SSB to other datasets because of the substantial difference in levels between the SSB and the GSF. The upshot is that results on the SSB work fine for specification and sample testing, and for drawing most qualitative conclusions that rely only on SSB/GSF estimates but are not useful at all for comparing those results to other results and point estimates [which] are substantially different. An example of where things have not worked is our work on the effect of access to TDI [Temporary Disability Insurance] on labor market outcomes. This work relies on a set of diff-in-diff regressions comparing people with/without a work limiting disability in/out of states with a TDI program. We’ve had two problems in this context. The main issue here is that point estimates have changed signs (e.g., if I recall correctly the SSB has positive effects for women and negative for men, while the GSF shows the opposite). With this project, we really haven’t been able to draw any conclusions at all from the SSB. Like volatility by education and the decomposition models, this work also relies on SIPP survey information that cannot be treated as fixed prior to the individual’s SIPP panel, in addition to the admin data. In summary, I think there are two basic issues. First is whether a sample uses SIPP panel characteristics that can be treated as time invariant both before and after an individual’s SIPP panel. The GSF links all SIPP participants, including kids. The SSB synthesizes the pooled SIPP panels, including those kids. Volatility by race largely works because race can be treated as fixed prospectively and retrospectively, so those
- kids age into the sample. Volatility by education doesn’t work because it can only be treated as fixed after a SIPP panel, so kids can’t age into the sample. Our mobility estimates overall and by gender worked better than those by education for the same reason. The second is that, unless you’re comparing means of variables using the full GSF, comparing point estimates in the SSB to any other dataset will likely be problematic. So, in our experience, it’s usually possible to do all sorts of specification/sample/method testing on the SSB and expect those changes to effect the GSF in the same way, but it may take a number of disclosures before you can know whether this is true. But, there hasn’t been any situation in which we can rely on point estimates in the SSB given the type of work we’re doing. And, again, it would take a number of disclosures before anyone could learn where their specific work can rely on SSB point estimates.”
- “The coefficients were mostly of the same sign and significance but were more precise in validated results.”
- “There were differences in estimating how the variance of log earnings changes had evolved over time—in particular around the 2007 recession.”
- “Age was a key variable in constructing microdata results; birth-date variable was very difficult to use.”
- “Some barely significant differences (in the synthetic data) in earnings across groups became more significant in the GSF results. This was particularly true when looking at more narrowly-defined groups (e.g., by sex and education) where sample sizes became smaller.”
- “Certainly, differences did appear. But keeping in mind that the SSB was not meant to be scientifically valid for all use cases on its own, the SSB results were similar enough to the GSF results that I was able to still build my samples and analyses using the synthetic data.”
- “I am still waiting for validation.”
- “Our results were qualitatively unchanged.”
DIFFICULTIES ENCOUNTERED WHEN USING FSRDCS
Only one of the seven FSRDC users reported having difficulties, expressing the following issues: a time delay in getting clearance for access, unclear documentation, and file(s) without the measures that were needed.
IMPACT OF DIFFICULTIES
Describing the impacts resulting from their difficulties in accessing the data, five gave up on obtaining access, including three who had difficulty accessing the public-use files (Figure E-9). Four said their research was never
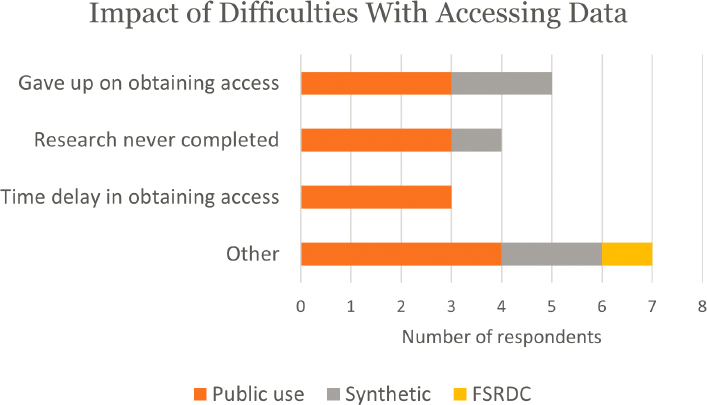
completed, and three said there was a time delay in obtaining access. Notably, all three who said there was a time delay were users of the public-use file, which can be downloaded, so they were not referring to clearance procedures.
Following are the text comments for those who responded “Other”:
- SSB: “Data not available now.”
- SSB: “Delayed our analysis of results.”
- Public-use: “Scaled down our research project to only recent panels.”
- FSRDC: “Adjusted measures used in research.”
- Public-use: “Delay research progress.”
- Public-use: “Incomplete analysis.”
- Public-use: “Time delay in using the data.”
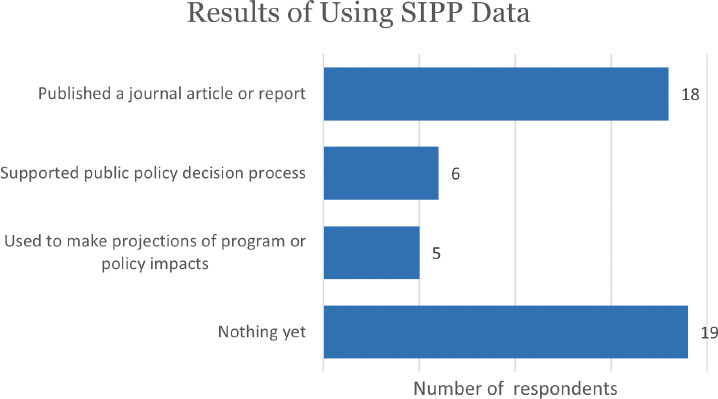
HOW THE DATA WERE USED
Eighteen respondents reported having published a journal article or report as a result of using SIPP data, six reported that the results supported the public policy process, and five reported that the data were used to make projections of program or policy impacts (Figure E-10). Some respondents reported multiple uses: one reported both published articles/reports and supporting the policy decision process, one reported both publishing and making projections, and two reported all three. Nineteen respondents reported no results yet from their use of SIPP data.
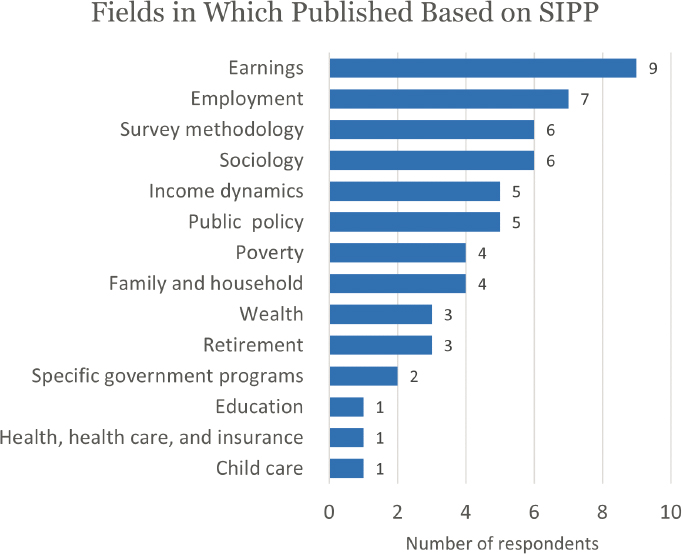
Those 18 respondents who reported publishing articles or reports based on SIPP also reported publishing across a wide span of areas. Most often they reported publishing on earnings, employment, survey methodology, and sociology (Figure E-11). Of the 17 fields listed on the questionnaire, respondents reported publishing in 14 of them, with each publishing in one to six fields.2 Among the 18 who reported publishing, 16 supplied the number of articles they published, for a total of 57 articles or reports, a mean of 3.2 per respondent.
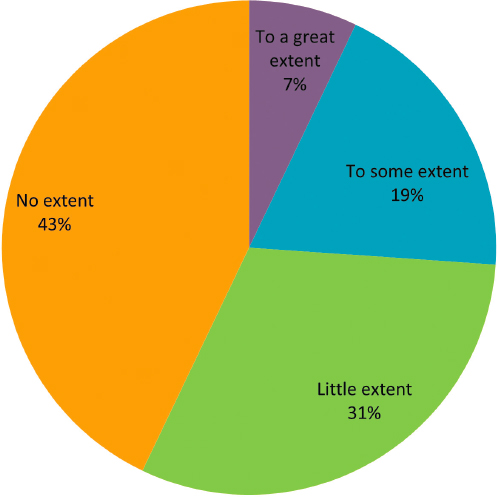
WHETHER RESEARCH NEEDS COULD BE MET THROUGH STANDARDIZED TABLES
Only 7 percent of the respondents said their research needs could largely be met through the availability of a comprehensive set of standardized tables (Figure E-12). By contrast, roughly three-fourths said their research needs would be met only to a little extent (31%) or no extent (43%). These results are consistent with the results above that the respondents often engaged in statistical modeling rather than depending only on tabulations. However, these results may be biased in the sense that those most heavily involved in using SIPP data, and having the greatest vested interest in access to the data, may have been the most likely to respond. There may be a pool of less committed SIPP users or of potential future users, if the data were more readily accessible, who are not well represented in these results.
___________________
2 The respondent checking “Other” wrote in “NA.”
OTHER COMMENTS BY SIPP USERS
The respondents were also invited to provide open-ended text comments that they felt would be helpful to the panel. Eighteen respondents provided comments. These are presented verbatim below.
Ease of Use
- “I watched the Census Bureau’s webinar series about using SIPP data, and those webinars helped me a lot. But it was a steep learning curve to gain even basic skills accessing and interpreting SIPP data. I would like to be able to create state-level tabulations using SIPP data.”
- “The variables showing receipt of housing subsidies are not internally consistent across waves of the same panel. The editing and imputation procedures that the SIPP uses produce inconsistent four-months spells of subsidized housing receipts. This makes the data very hard to use for any research on housing subsidies. This problem does not exist for the 1996 Panel.”
- “Please provide example code/syntax for various statistical software programs using the synthetic data. Please include limitations that should be considered, especially if subpopulation analyses could be problematic.”
- “The biggest issues I’ve had with the SIPP are important changes across panels that are poorly (or even incorrectly) documented, and general documentation, website, and data presentation not being user friendly (and especially not beginner friendly).”
Value of the Data
- “I had hoped to use the tax module, but it was almost empty. This was many years ago, I don’t know if the situation has improved.”
- “The information was sound; the income in 2020 compares to now.”
- “Learning tool for me. And it’s been amazing and enlightening.”
- “I am relying on the SIPP Synthetic Beta (SSB) for the second paper in my dissertation and currently access the file through the [Virtual Research Data Center] (CED2AR) at Cornell.”
- “Both the public-use SIPP and Synthetic SIPP have become invaluable tools in my research. I am very sad to hear we may be without the SSB for some time. The W-2 earnings records in the SSB are priceless for my work on earnings dynamics. I hope the SSB comes back and perhaps with even more merged/generated variables from the public-use SIPP.”
- “I was interested in correlations in income across time with different lag periods.”
- “Data coding of categories across panels. No newer data beyond 2008 panel for Informal Care (adult caregiving).”
Accuracy of the Data with Respect to Disclosure Avoidance
- “When considering the probability of reidentification, also consider how complex the SIPP data are (and how high the learning curve for using it), and all of the uncertainty introduced from editing the data. In general, it seems that everyone assumes that respondents respond honestly and correctly to every question, and the public data reflect that. While I do think the data are of high quality, I suspect there is an additional layer of protection introduced just through human error and data processing that is typically ignored by those concerned about disclosure.”
- “The risks of disclosure avoidance have to be balanced with the benefits of research insights. Over-weighting disclosure avoidance means that only a few researchers can have access to these important datasets. This would undermine everyone’s understanding of important socioeconomic questions and increases inequality in research (only the very well-established, well-connected researchers will have data). A lot of our staff already have Census Sworn Status among other certifications. So there are ways to virtually eliminate disclosure issues without limiting access. Access to microdata is crucial to our work as published tabulations are virtually useless to the work that we do.”
- “Many data users fail to appreciate the amount of error that is already in the data; both error due to traditional survey error components and error for disclosure avoidance. It is important that data users understand that changing/strengthening disclosure avoidance does not mean the survey is changing from ‘the truth’ to ‘not the truth.’”
Providing Access to the Data
- “I think the GSF is the single most important ‘non-standard’ data product that Census has produced because it provides access to the types of administrative data that are increasingly being considered ‘the best’ thing for researchers. It is of course debatable whether this is true, but as long as people continue to believe that it’s true, it is critical for as many researchers as possible to have access to these types of data. The current way of providing access to the GSF is not sustainable. It seems like some amount of automation is critical. My experience working with the SSB/GSF suggests that it is unrealistic to think that a synthetic SIPP would be a suitable substitute to the real thing.”
- “I would be happy to comply with a more detailed onboarding process + disclosure process if I got to see the microdata in better detail. The current tradeoff is difficult to use and often requires repeated interfacing with Census staff to get things right; it would
- be easier to access better data remotely, with a more comprehensive data disclosure process at the end.”
- “I think individual data is necessary for statistical analysis, which is why I am not sure that comprehensive summary tables are a great solution. I would love for the data to be harmonized so it is easier to use several panels of the SIPP together. Especially because the codebooks prior to 2014 are not in such a user-friendly form and with all the variable name changes, it is quite an undertaking to merge datasets.”
- “I had a great experience using the SSB. Its synthetic nature didn’t cause any problems for either of the projects I used it for. If researchers are no longer going to be allowed access to the full public-use SIPP, I’d rather have to use something like the SSB with a validation step, than only be given aggregated data.”


