Effects of Human-Caused Greenhouse Gas Emissions on U.S. Climate, Health, and Welfare (2025)
Chapter: 2 Natural and Human-Caused Influences on Earth's Energy Imbalance
2
Natural and Human-Caused Influences on Earth’s Energy Imbalance
2.1 KEY MESSAGES
Emissions of greenhouse gases from human activities are increasing the concentration of these gases in the atmosphere. Human activities, such as the extraction and burning of fossil fuels, cement and chemical production, deforestation, and agricultural activities, emit greenhouse gases (GHGs)—which include carbon dioxide (CO2), methane (CH4), nitrous oxide (N2O), and fluorinated gases (F-gases)—to the atmosphere.
Total global greenhouse gas emissions continue to increase, even though U.S. emissions of CO2 have decreased slightly in recent years largely due to changes in energy production and consumption. The United States has the highest cumulative emissions1 and is among the highest per capita emissions of GHGs in the world. The most recent decade (2010–2019) marked the largest decadal increase in global CO2 emissions on record. Since 2009, methods of monitoring, observing, and synthesizing inventories of these emissions have improved.
Increased greenhouse gases in the atmosphere are changing Earth’s energy balance, which governs the physics and dynamics of the climate system. Earth’s climate is regulated by its radiative energy balance—the difference between solar energy absorbed by the surface and atmosphere and infrared energy emitted back to space. GHGs absorb and re-emit infrared radiation (energy) in all directions, including downward to the surface and upwards to space. The overall imbalance (net total of human and natural forcings2) has led to warming of the climate system since 1750. Advances in remote sensing, longer term records, and analyses provide continued and more robust support for conclusions about Earth’s energy imbalance than was available in 2009.
Multiple lines of evidence show that greenhouse gas emissions from human activities are the primary drivers of the observed long-term warming trend and other changes in Earth’s energy balance and that natural forces cannot account for observed changes. No known natural drivers, such as incoming solar radiation or volcanic emissions, can explain observed changes. This is particularly true for the magnitude of warming at Earth’s surface and the vertical distribution of warming in the troposphere (lower atmosphere) and cooling in the stratosphere (upper atmosphere). These changes are consistent with the physics and dynamics of the climate response to GHG increases.
___________________
1 Cumulative emissions are the total sum of GHGs released over time. This is usually calculated using 1750, when the industrial revolution began, as a starting point.
2 Forcings are factors that influence Earth’s radiative balance. Human forcings (or “anthropogenic” forcings) consist of the emissions of GHGs and land-use change. Natural forcings are nonhuman factors that affect Earth’s radiative balance. This includes factors such as solar radiation, Earth’s orbital cycle, and volcanic activity.
Statements from EPA (2009a) continue to be true and are supported by improved scientific evidence. Evidence for human-caused increases in greenhouse gas emissions, their effects on Earth’s climate, and the attribution of climate change to human activities has grown stronger and more compelling, backed by multiple, independent lines of improved data and analysis.
2.2 GREENHOUSE GASES AND THEIR EMISSIONS
EPA (2009a) considered six well-mixed GHGs emitted by human activities: CO2, CH4, N2O, HFCs, PFCs, and SF6 (Box 2.1). Both global and U.S. emissions of GHGs are dominated by those of CO2. Emissions of other GHGs are often reported as the amount of CO2 emissions that would produce an equivalent amount3 of radiative forcing (the imbalance between incoming and outgoing energy in Earth’s atmosphere; see Section 2.3) over a 100-year period, which is referred to as carbon dioxide equivalents, or “CO2e.”
In its 2022 assessment, the Intergovernmental Panel on Climate Change (IPCC) (Dhakal et al., 2022) estimated that total global annual emissions of GHGs had increased to approximately 59 billion metric tons CO2e per year (gigatons per year, Gt/y). During the decade beginning in 2010, the average emissions were 56 Gt/y, which is 9 Gt/y (or 16%) higher than the decade from 2000 to 2009, leading to the greatest decadal growth in atmospheric
BOX 2.1
Legislative Requirements Applying to Greenhouse Gas (GHG) Emissions Regulations
The 2009 Endangerment Finding (see Box 1.1) identified carbon dioxide (CO2), methane (CH4), nitrous oxide (N2O), hydrofluorocarbons (HFCs), perfluorocarbons (PFCs), and sulfur hexafluoride (SF6) as the primary GHGs emitted by human activities not already covered by the Montreal Protocol (which controls additional GHGs: chlorofluorocarbons [CFCs] and hydrochloro-fluorocarbons [HCFCs]). Three of the GHGs identified by the Endangerment Finding—CO2, CH4, and N2O—are vehicle as well as stationary source emissions. In addition to the GHGs identified in the Endangerment Finding, vehicle emissions also include “criteria pollutants”—nitrogen oxides, carbon monoxide, sulfur oxides, and particulate matter—which are associated with direct human health effects.
As recognized in the Endangerment Finding, the Clean Air Act Section 202(a) requires EPA to create emission standards to limit air pollutants that endanger public health or welfare. These regulations focused initially on criteria pollutants but apply also to vehicle GHG emissions. Additionally, the Clean Air Act broadly together with the American Innovation and Manufacturing Act of 2020 require EPA to control stationary source emissions for all GHGs included in the Endangerment Finding.
At the time of the Endangerment Finding, EPA vehicle exhaust emission standards regulating criteria pollutants had been in place for many years. Vehicle CH4 and N2O emissions have been subsequently regulated since 2015. Vehicle emission standards for CO2 are planned to start in 2027. CO2 emissions have also been regulated indirectly by evolving Corporate Average Fuel Economy standards, administered by the National Highway Traffic Safety Administration since 1975. CO2 from stationary power plants has recently been regulated by EPA. Two of the gases identified in the Endangerment Finding, HFCs and PFCs, are regulated with stationary source emissions limits, and SF6 is limited in some cases and required to be reported in others.
___________________
3 Global Warming Potential is a common metric in discussions of GHGs used in EPA (2009a). Global Warming Potential compares how much total heat a GHG traps over a chosen time horizon (e.g., 100 years) relative to CO2. Carbon dioxide equivalents (CO2e) express a GHG quantity as the amount of COv that would cause the same trapping of heat over that horizon, calculated as mass multiplied by Global Warming Potential.
concentrations in the modern record. In contrast, over the same period, GHG emissions from the United States have decreased (Figure 2.1). EPA (2009a) used the latest data available at the time (from 2007) to estimate U.S. emissions as 7.150 Gt/y of CO2e. Since that time, improvements in the emission estimation procedures used by EPA facilitated a refining of the estimate of 2007 emissions to 7.530 Gt/y CO2e (EPA, 2024a). Estimated emissions for 2022, the latest year for which EPA has developed a comprehensive national emission estimate, are 6.343 Gt/y CO2e. This decrease in total emissions is largely the result of changes in the relative amounts of different energy sources used in the United States.
Since 2007, the United States has transformed from an energy importing country to the world’s largest producer of oil and natural gas and a major exporter of energy. Major trends with consequences for GHG emissions include widespread substitution of coal used for electricity generation with natural gas and renewable sources of energy and increases in the efficiency of petroleum use for transportation (Figure 2.2). The changes in electricity generation have led to decreases in CO2 emissions because burning coal results in higher emissions of CO2 per unit of energy produced than burning natural gas or using renewable sources of energy.
Improvements in the fuel efficiency of vehicles and introduction of electric vehicles has led to a relatively constant to slightly decreasing amount of petroleum use, despite increases in total miles travelled by vehicles in the United States (U.S. Bureau of Transportation Statistics, 2025). While total emissions in the United States have decreased due to these changes in patterns of energy use, the country still remains one of the largest sources of GHG emissions both in total and per capita, and the largest cumulative emitter of GHGs (IPCC, 2022b; Jones, Peters et al., 2024).
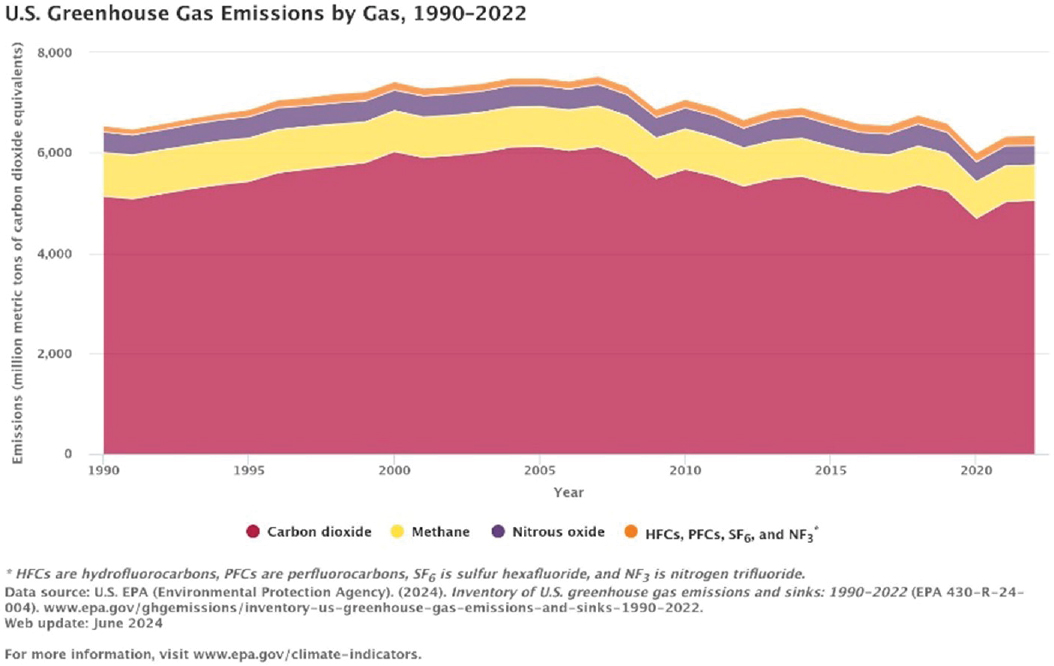
SOURCE: EPA, https://www.epa.gov/climate-indicators/climate-change-indicators-us-greenhouse-gas-emissions. Accessed September 2025.
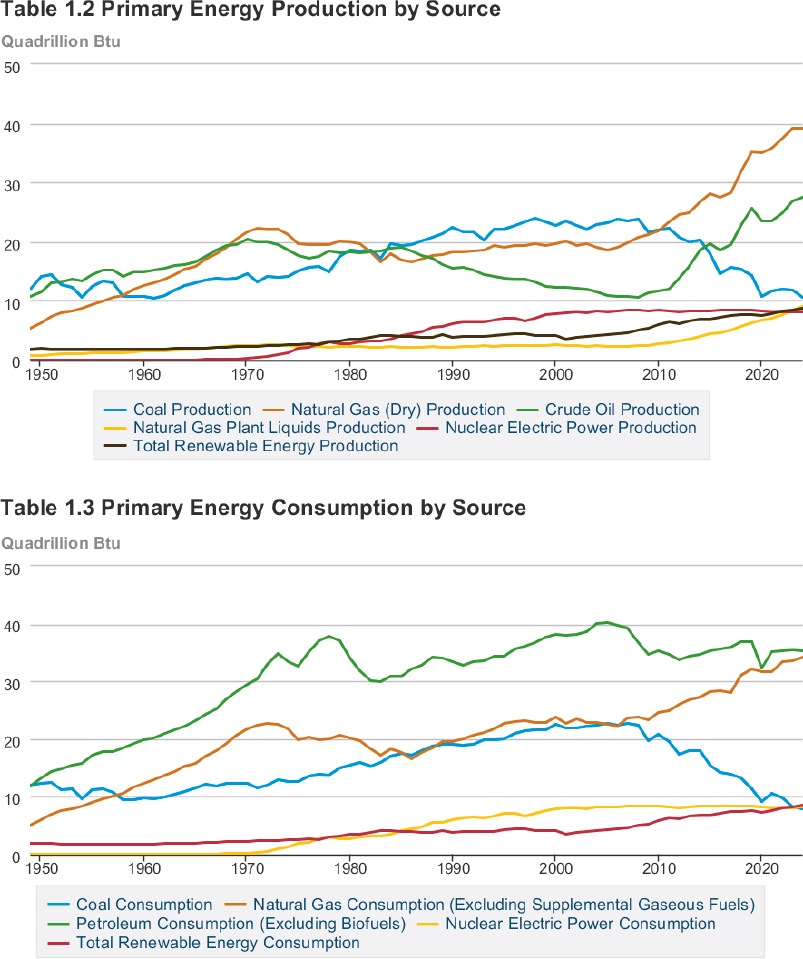
SOURCES: EIA, 2025a, 2025b.
Changes in energy use have also affected emissions other than GHGs. EPA (2009a) noted that emissions of sulfur dioxide (SO2) and particulate matter (particles less than 10 microns in diameter, PM10), which accompany the burning of fossil fuels, had decreased in the decades prior to 2009. SO2 emissions have continued to decrease since 2009 due to shifts away from the use of coal in electricity generation and the lowering of the sulfur content in fuels in diesel-fueled vehicles. As reported through EPA’s National Emissions Inventory,4 emissions of SO2 decreased from 16.3 million tons per year in 2000 to 8.0 million tons per year in 2009 (EPA, 2025a). From 2010 to 2020, total emissions were further reduced to 1.8 million tons per year. These decreasing emissions in SO2 led to reduced formation of sulfates found in particulate matter in the atmosphere. Because sulfates in particles have a net cooling effect, the reduced sulfate concentrations would be expected to lead to reduced cooling.
Direct emissions of particulate matter, not including those associated with wildfires, are more complex, having decreased by approximately one-third from 2000 to 2009 then having remained relatively constant since. The quantity of particulate matter emissions from wildfires varies widely from year to year. For example, in 2022, a year which had large areas burned by wildfires, PM10 emissions from wildfires were estimated to be an order of magnitude larger than in 2009. The wildfire emissions in 2022 occurred in localized areas for limited time periods but were estimated to increase total national PM10 emissions for the year by roughly 20%, resulting in very high concentrations of PM10 during the time periods when the fires were occurring (EPA, 2025h).
Estimates of emissions of GHGs and other pollutants have differing levels of associated uncertainty in available data and methodologies. Among GHGs, estimates of CO2 emissions have the lowest uncertainties because the majority of these estimates are based on fuel consumption data, which are accurately and precisely tracked, multiplied by the emissions per usage, which is also well-known. Estimates of emissions of other GHGs, such as CH4, have higher uncertainties, but these uncertainties have been reduced by advances in measurement technologies over the last decade (NASEM, 2018). In reviewing the status of CH4 emission measurements, the National Petroleum Council (2024) concluded in a report to the U.S. Secretary of Energy that “new measurement technologies have emerged over the last five years that are dramatically improving emission detection and the accuracy of emission estimates” (p. 3-1).
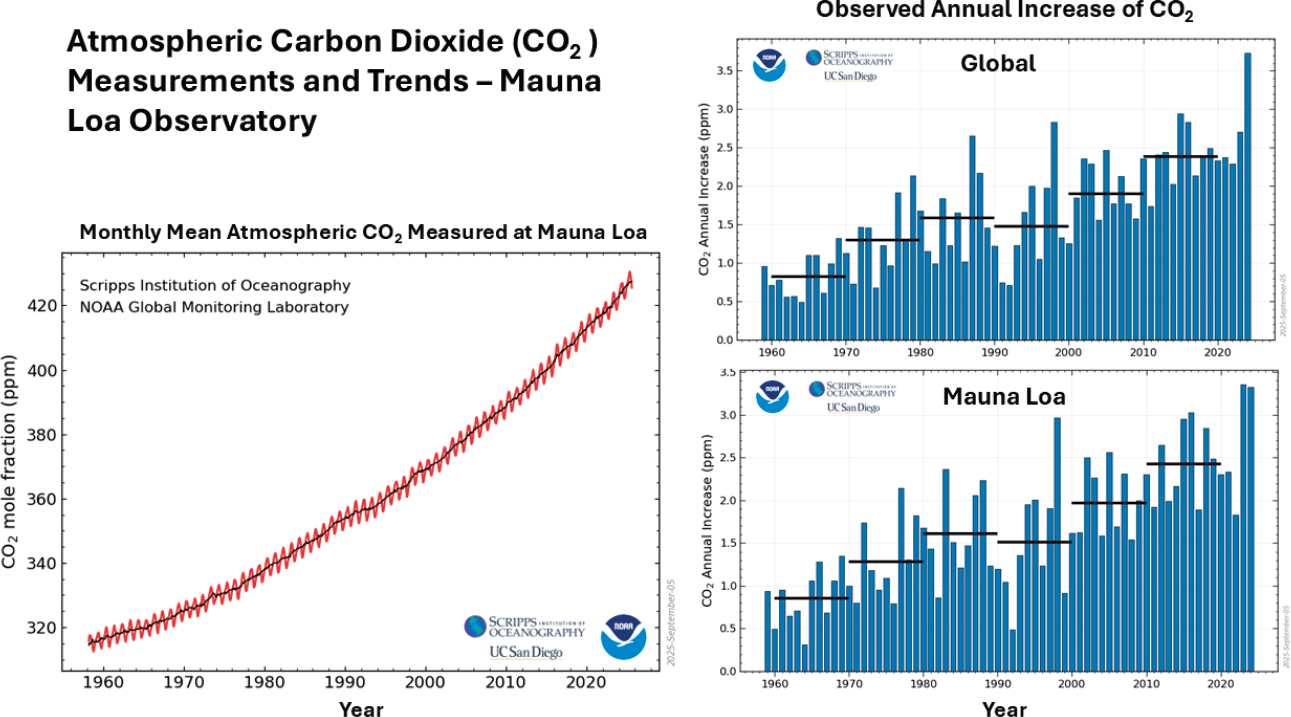
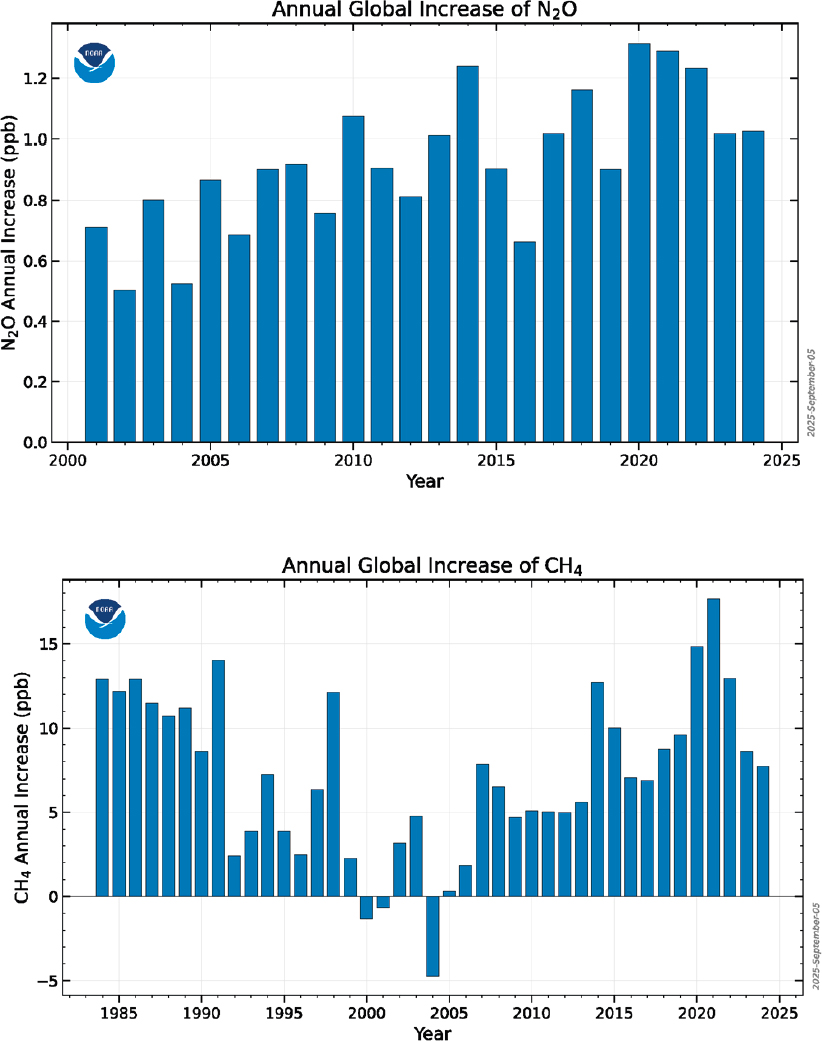
Observations of atmospheric concentrations provide additional evidence of increasing global GHG emissions. Concentrations of GHGs in the lower atmosphere, such as those measured at the Mauna Loa monitoring station in Hawaii, are increasing (Figure 2.3). Figure 2.4 shows annual increases in N2O concentrations, which have been increasing at a generally accelerating rate, and CH4 concentrations, for which emission increases have had more complex behavior but overall have been increasing at a generally accelerating rate since 2009.
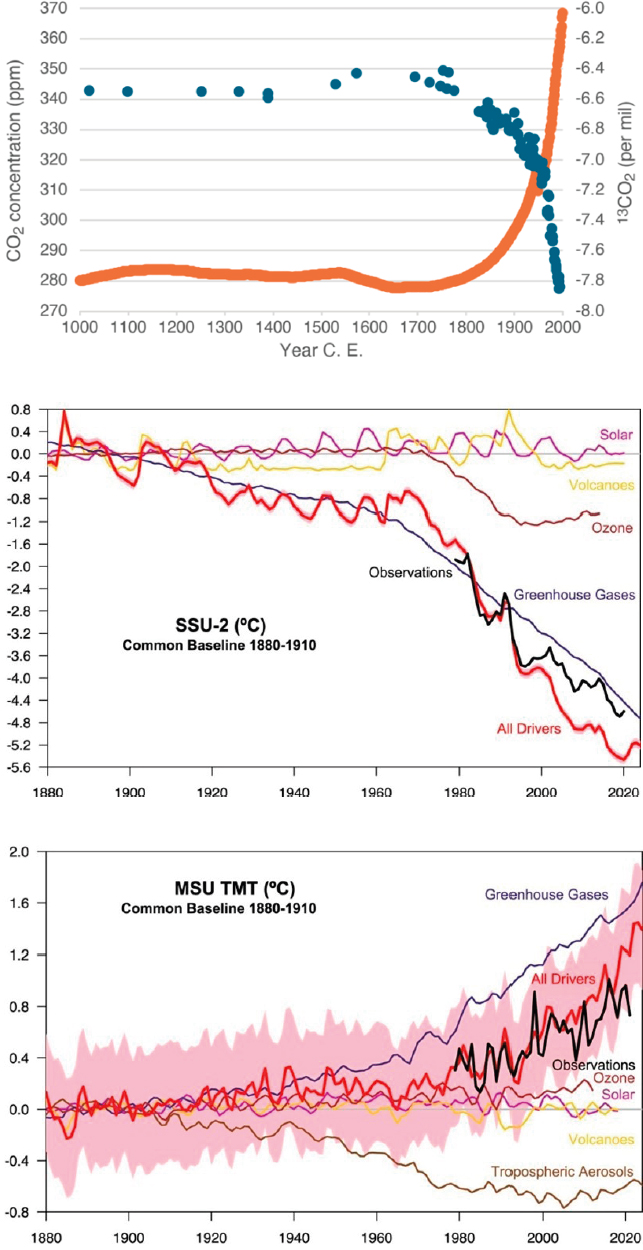
The most recent average decadal increase in CO2 concentration is more than 2 parts per million (ppm) per year. This rate of increase is more than 100 times faster than natural increases, such as those that occurred at the end of the last Ice Age 11,000–17,000 years ago. Further documentation of increases in atmospheric GHG emissions comes from the relative abundance of carbon isotopes in the observations. Measured decreases in the fraction of the carbon isotopes 14C and 13C in ice core records show that the rise in CO2 is largely from combustion of fossil fuels, which have low 13C fractions and no 14C (NRC, 2020; Figure 2.7, top). Figure 2.5 shows these longer historic trends combined with observations from recent atmospheric concentrations, which demonstrate the steep rate of increase beginning in approximately 1750. Beyond these historical records, fundamental physical and chemical processes also indicate that once emitted, CO2 persists in the atmosphere for centuries,5 ensuring today’s emissions will contribute to atmospheric concentrations far into the future.
2.3 EARTH’S ENERGY IMBALANCE
Understanding how energy flows through the Earth system, quantifying those flows in the form of energy fluxes, and evaluating the factors that influence and change these fluxes are the foundation for understanding the physical climate system and are the basis for characterizing and predicting changes to Earth’s climate. Changes in energy flows, referred to as “forcings,” operate on a variety of timescales and can be human-caused or from natural
___________________
4 See https://www.epa.gov/air-emissions-inventories/national-emissions-inventory-nei.
5 For more information about the global carbon cycle, see “Global Carbon Budget 2024” (Friedlingstein et al., 2025).
1 The Global Greenhouse Gas Reference Network is based in NOAA’s Global Monitoring Laboratory and uses observations from observatories, aircore samples from ballons, and air samples taken by small aircrafts and volunteers.
SOURCE: NOAA, 2024.
sources. The influence of any individual forcing is typically compared using a measure of its impact on the Earth’s radiative balance, measured as the annual average net change in radiation (in Watts) at the top of the atmosphere per square meter of the planet’s surface (W/m2).
Since 2009, advances in observations and the analysis of expanding time series have shown that Earth has a positive energy imbalance—i.e., more energy is coming in than going out—and this imbalance is increasing over time (Hakuba et al., 2024; Loeb et al., 2021). Over the longer-term, this imbalance will drive additional net heating of the planet. Human-caused, or anthropogenic, forcings are the primary driver of the imbalance in Earth’s energy and resulting heating. Total anthropogenic forcing comes mainly from GHG emissions from human activities but also includes contributions from aerosols (particulates that are mostly cooling agents) and changes in the Earth’s surface cover. Combining all of these human-caused contributions leads to a best estimate of +2.97 (+2.05 to +3.77) W/m2 in net total anthropogenic radiative forcing for 1750 to 2024 (Forster et al., 2025). This estimate has increased by more than 80% since the estimate cited in EPA (2009a); the net total anthropogenic forcing for 1750 to 2005 was +1.6 W/m2 (+0.6 to +2.4 W/m2).
Observations of Earth’s Energy Imbalance
The international community has developed a robust and comprehensive understanding of Earth’s energy balance, along with its associated uncertainties, through decades of careful and sustained assessments (e.g., Stephens et al., 2022). Today, more objective methodologies that jointly constrain both the water and energy budgets are
SOURCE: Lan et al., 2022.
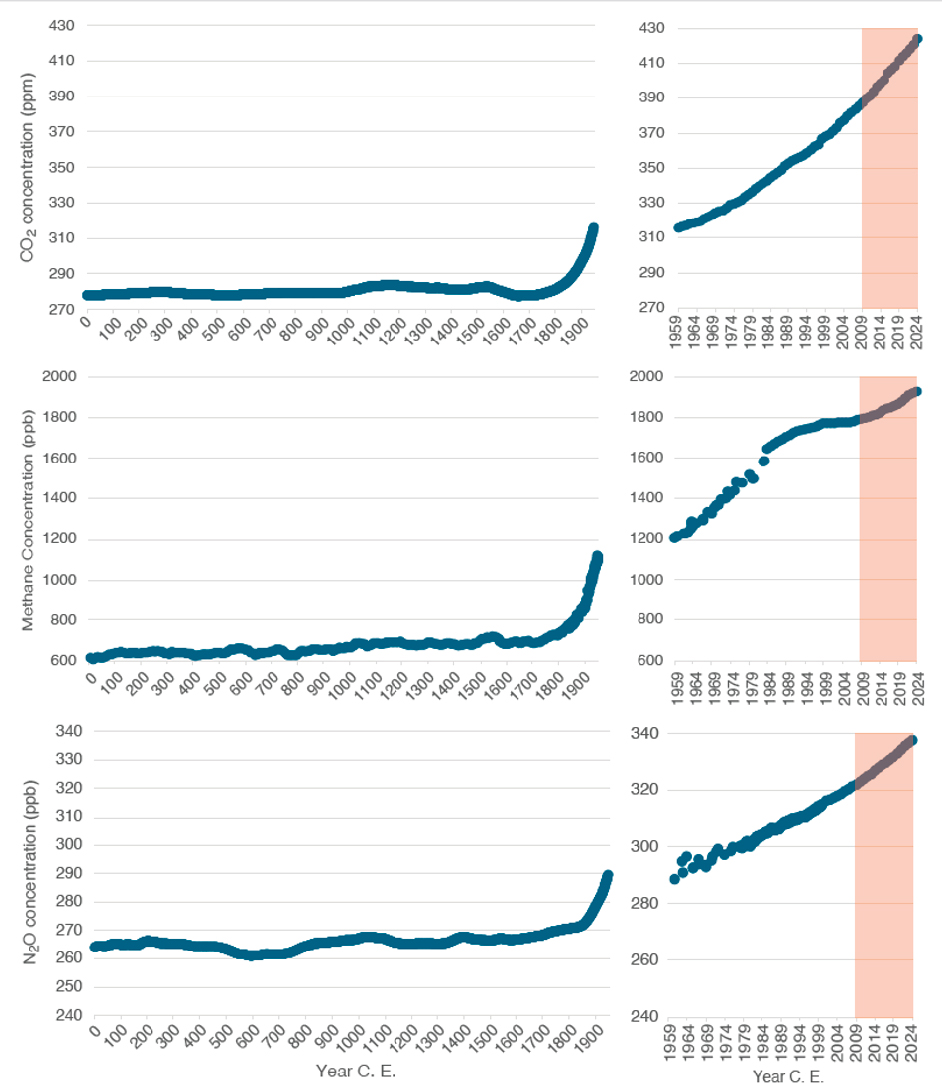
SOURCES: Data in the left panels are from ice cores (Ahn, 2023) while data in the right panels are from NOAA observations (Lan et al., 2022; NOAA Global Monitoring Laboratory, n.d.).
used (L’Ecuyer et al., 2015; Rodell et al., 2015), moving away from prior, more ad hoc, methods used at the time of EPA (2009a). These methodologies support the finding that Earth, in the annual mean, currently experiences a radiative imbalance at the top of the atmosphere, referred to as Earth’s Energy Imbalance (EEI). While net radiative forcing represents the combined effect of external drivers of Earth’s energy balance, EEI is the portion of the forcing not yet offset by the planet’s radiative response and observed directly as the annual mean of Earth’s heat uptake. EEI is measured as the sum of all heat content changes occurring in the ocean, land, atmosphere, and cryosphere. EEI is the most holistic picture to date of heat accumulation by the Earth system and a quantitative measure of the cumulative impact of both natural and anthropogenic radiative forcings and feedbacks. Independent estimates of the heat uptake, taking account of all heat content changes, largely match estimates of EEI (Hakuba et al., 2024; Meyssignac et al., 2019; von Schuckmann et al., 2016) (see Figure 2.6).
Approximately 90% of Earth’s heat uptake occurs in the ocean. Hakuba et al. (2024) offer a comprehensive review of 18 different sources of ocean heat content data and conclude that the range of annual mean EEI falls between 0.40 to 0.96 W/m2 where the spread is due to differing sources of ocean data, mapping methods, and quality control procedures across ocean data products (Figure 2.6). They also assess the rate of change of EEI over the observation record and, while ranging from 0.1 to 1.0 W/m2 per decade, conclude that all major sources of data indicate an increasing rate of EEI over the past approximately 20 years. This pattern points to an accelerating warming of the planet (e.g., Mauritsen et al., 2025), which is also consistent with observations that suggest an accelerated rise in sea level due in part to thermal expansion of sea water (see also Section 3.5).
EEI methods and estimates provide more robust support for the EPA (2009a) conclusion that “the global average net effect of the increase in atmospheric GHG concentrations, plus other human activities (e.g., land-use change and aerosol emissions), on the global energy balance since 1750 has been one of warming” (p. ES-2).
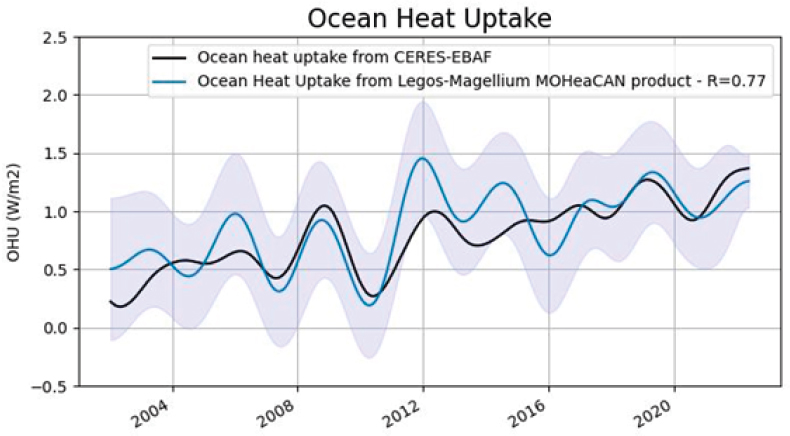
SOURCE: Hakuba et al., 2024. CC BY 4.0.
Natural Forcings on Earth’s Energy Imbalance
Over timescales of decades to centuries, the most important known natural forcings are solar output and volcanic eruptions. Prior to modern measurement techniques, estimates of long-term changes in the output of the Sun have substantial uncertainties. Nevertheless, solar forcing from the preindustrial average over the ~11-year solar cycle to the average over the last complete solar cycle (2009–2019) is estimated by the IPCC’s Sixth Assessment Report and more recent analyses (Forster et al., 2025) to be +0.01 W/m2 (−0.06 to +0.08; 90%6 confidence interval). The best estimate of solar forcing is roughly 300 times less than anthropogenic forcing. Even the high end of the range of solar forcing is equal to only a few percent of anthropogenic forcing over this period. Uncertainties in observations since the preindustrial period do not support conclusions about trends in solar forcing over that period. However, over the last approximately 45 years, for which satellite observations are available (leading to higher confidence in the observed trends), it is very likely that solar forcing has decreased (Amdur and Huybers, 2025; Matthes et al., 2017; Montillet et al., 2022). This likely decrease in solar forcing was observed at the same time that the Earth has been warming at its most rapid pace since the preindustrial period.
Volcanic forcing is highly irregular and sporadic, with large eruptions that inject material into the stratosphere driving short-term cooling but with no evidence for long-term trends over the last two centuries (Forster et al., 2021). CO2 emissions from volcanoes are negligibly small. Hence, natural forcing is both very small over the time since industrialization and has very likely caused a minor amount of cooling over recent decades rather than contributing to the observed warming.
Radiative Forcing of Greenhouse Gases
Owing to the successful implementation of the Montreal Protocol (1987 international treaty to control ozone-depleting substances), concentrations of several fluorinated GHGs (CFCs) have decreased, whereas concentrations of other fluorinated gases are still increasing (i.e., CFC-replacements, such as hydrofluorocarbons and the industrial PFCs) (Forster et al., 2025). The 2024 estimate of radiative forcing relative to the 1750 baseline7 from halogenated gases (primarily fluorine-containing, or F-gases) is +0.41 (+0.33 to +0.49) W/m2 (Forster et al., 2025), with relatively flat growth rates owing to the offsetting influence of declining CFCs and increases in other F-gases. These gases are entirely anthropogenic in origin.
CO2 concentrations have increased by ~50% (through 2023) relative to the mean of the range seen from 1000 to 1850, with analogous increases of ~160% and 25% for CH4 and N2O, respectively (Figure 2.5). The observed concentration increase in these gases is attributable almost exclusively to anthropogenic activities based on analyses of budgets for each GHG and on the isotopic signature of atmospheric carbon (see Figure 2.7). Current CO2 levels are likely the highest they have been in the last 3 million years (Canadell et al., 2021; de la Vega et al., 2020; Martínez-Botí et al., 2015), and the rates of change in all three of the main GHGs (CO2, CH4, and N2O) are faster than those seen at any time in the last million years of ice core records (Canadell et al., 2021).
Understanding of the effect of GHGs on the Earth’s energy balance remains solidly grounded in physics and in laboratory measurements, which date back to the 19th century (e.g., Tyndall, 1863), as well as in surface and satellite measurements (e.g., Harries et al., 2001; Teixeira et al., 2024). This understanding of the fundamental physics of the Earth’s energy system, combined with observational constraints on feedback8 processes, mean that at the global scale the effect of a GHG forcing can be evaluated with a simple equation and does not require the use of complex numerical models or other complicated analyses. In practice, relatively simple models used decades ago can now be seen to have performed extremely well in matching the observed global mean warming over time per unit radiative forcing (Hausfather et al., 2020; Supran et al., 2023).
___________________
6 The range in parentheses included with radiative forcing estimates represents the “very likely” range, meaning there is a 90% likelihood that the actual value falls within this range.
7 Unless otherwise specified, estimates of radiative forcing (W/m2) are given relative to a preindustrial (1750) baseline.
8 Feedbacks are natural or human-induced processes that impact a system (i.e., hydrologic, climate, atmospheric). Positive feedback amplifies the initial change, and negative feedback decreases the initial change.
Since EPA (2009a), the radiative forcing due to increasing atmospheric concentrations of the three main human-caused GHGs has increased from the +2.30 (+2.07 to +2.53) W/m2 estimate in 2005 to +3.13 (+2.7 to +3.6) W/m2 in 2024 (Forster et al., 2025). This rapid rise in forcing continues the trend reported in EPA (2009a) that “the rate of increase in positive radiative forcing due to these three GHGs during the industrial era is very likely to have been unprecedented in more than 10,000 years” (p. ES-2).
Though not emitted directly by anthropogenic activities, ozone is another important GHG. Ozone in the lower atmosphere (the troposphere) has a large warming impact on climate, especially in the upper troposphere. Ozone in the upper atmosphere (the stratosphere) has only a weak effect on climate but is important in protecting the surface from ultraviolet radiation. Tropospheric ozone has increased since industrialization due to human-caused emissions of ozone precursor gases that lead to photochemical ozone production. The effect of this tropospheric ozone increase has outweighed the impact of ozone loss in the stratosphere, leading to a net positive forcing of +0.50 (+0.25 to +0.75) W/m2 in 2024 (Forster et al., 2025). Importantly, roughly half the radiative forcing from tropospheric ozone increases is due to emissions of CH4, which contributes to the chemical formation of ozone in the troposphere. Hence, the overall climate influence of the three main GHGs is larger than that attributed to changes in their concentrations alone.
Non-GHG Radiative Forcing: Aerosols
Aerosols affect radiative forcing both through direct influences on radiation and indirect effects on cloud micro-physics and lifetime, which impact the radiative properties of clouds. The IPCC’s Sixth Assessment Report (IPCC, 2021) provides an updated assessment of this combined aerosol forcing. Forster et al. (2021) conclude with high confidence9 that the radiative forcing from aerosols is negative (cooling) and estimate, with medium confidence, that for 2019 it is −1.1 (−1.7 to −0.4) W/m2; the total effective radiative forcing from aerosols in 2024 is estimated to be −1.07 (−1.90 to −0.43) W/m2 (Forster et al., 2025). This aerosol forcing (about −1 W/m2) does affect the energy balance, although the cooling effect is only about a quarter of the warming associated with GHGs (about +4 W/m2 from combined CO2, CH4, N2O, ozone, and F-gases forcings included above) over the Industrial Era.
2.4 ATTRIBUTION OF EARTH’S WARMING AND ENERGY IMBALANCE TO HUMAN ACTIVITIES
As stated in EPA (2009a), “[GHGs], once emitted, can remain in the atmosphere for decades to centuries, meaning that (1) their concentrations become well-mixed throughout the global atmosphere regardless of emission origin, and (2) their effects on climate are long lasting” (p. ES-1). Atmospheric concentrations of the three main GHGs—CO2, CH4, and N2O—have continued to increase since 2009 as discussed in the previous sections, and it is virtually certain that this increase is due to human activities. These resulting concentration increases in the atmosphere represent human-forcing on Earth’s energy balance. The increased concentrations of well-mixed GHGs impact the climate though the increased infrared radiation they emit. This enhanced emission downward to the surface is an expression of the GHG radiative forcing and drives the surface and lower atmospheric warming. The enhanced emission of infrared radiation upward to space, by contrast, results in a cooling of the upper atmosphere. This warming-cooling dipole pattern, a unique signature of GHG radiative forcing of Earth’s climate, is well documented in observations of temperature change (Santer et al., 2023).
No known natural process could account for observed increases in GHGs that both (1) are well beyond the range of values seen over the past million years and (2) occur simultaneously for all three of the main well-mixed GHGs. Furthermore, the isotopic record of CO2 (Figure 2.7, top) shows an increase in very old, plant-based CO2 (depleted in 13C) that is a signature of fossil fuel burning (Graven et al., 2020). Consistent with the attribution
___________________
9 When referencing IPCC assessments, statements that include likelihood or confidence levels follow the same established scales used by those authors—e.g., for likelihood: “virtually certain” equates to 99–100% probability; very likely equates to 90–100%; likely equates to 66–100%, etc. For confidence, “very high confidence” refers to at least a 9 out of 10 chance of being correct and “high confidence” to at least 8 out of 10. For more information on these designations, see IPCC (2023).
of increasing GHG concentrations to human activities, and based on understanding of the radiative forcing of different climate drivers and the strength and speed of the climate response to forcing, the best estimate of the anthropogenic contribution to the observed surface warming of 2.23°F (1.24°C; 2 to 2.43°F/1.11 to 1.35°C) for 2015–2024, relative to 1850–1900, is 100% (Eyring et al., 2021; Forster et al., 2025; Gulev et al., 2021). Natural forcings are estimated to have contributed only about 0.09°F (0.05°C; −0.18 to 0.36°F/−0.1 to 0.2°C) to this warming (Eyring et al., 2021), which is higher than the contribution typically found when using the standard practice of comparing periods that both occur at solar minima to avoid the decadal fluctuations of the ~11-year solar cycle.
The observed vertical pattern of warming (lower atmospheric warming [Figure 2.7, middle], upper atmospheric cooling [Figure 2.7, bottom]) is consistent with the effect of increasing GHGs but is inconsistent with the effect of increased solar forcing (Casas et al., 2023; Santer et al., 2023). Thus, it is virtually certain that observed warming is due to human activities (Figure 2.7).