Planning and Operations Initiatives to Support Nighttime Transit Ridership (2025)
Chapter: 3 Survey

CHAPTER 3
Survey
Introduction
This chapter details the survey process, including the identification of transit agencies to survey, survey response rates, and final usable survey response totals. The chapter pulls out key findings from survey responses and accompanies the narrative with charts and graphs. Findings provide a sense of what a broad set of agencies are doing to support and serve the nighttime economy, nighttime transit planning challenges and opportunities, how agencies monitor service at night, and safety initiatives agencies employ. Following the respondentsʼ overview, this chapter details findings in five sections, corresponding to how the survey was structured (See Appendix A for the questionnaire).
Respondents Overview
An online survey was sent via email to 63 agencies that currently operate or recently operated transit services between 9:00 p.m. and 6:00 a.m., and 25 returned completed responses, a response rate of 40 percent. Of the agencies that responded (Table 2), nine are in the Western U.S. Census region, nine in the South, six in the Midwest, and one in the Northeast. Agency size is determined by the size of an agencyʼs service area population reported in the 2022 National Transit Database (NTD); 10 responding agencies have a service area population below 500,000 residents, eight agencies have a population between 500,000 and two million residents, and seven agencies have a population above two million. Respondents also have a mix of agency tiers reported in the 2022 NTD, with 11 Tier I Rail agencies, seven Tier I Fixed Route Vehicles Operated in Annual Maximum Service (VOMS) agencies, six Tier II agencies, and one Tier I Non-Fixed Route Vehicles Operated in Annual Maximum Service (VOMS) agency.
Role of Nighttime Transit
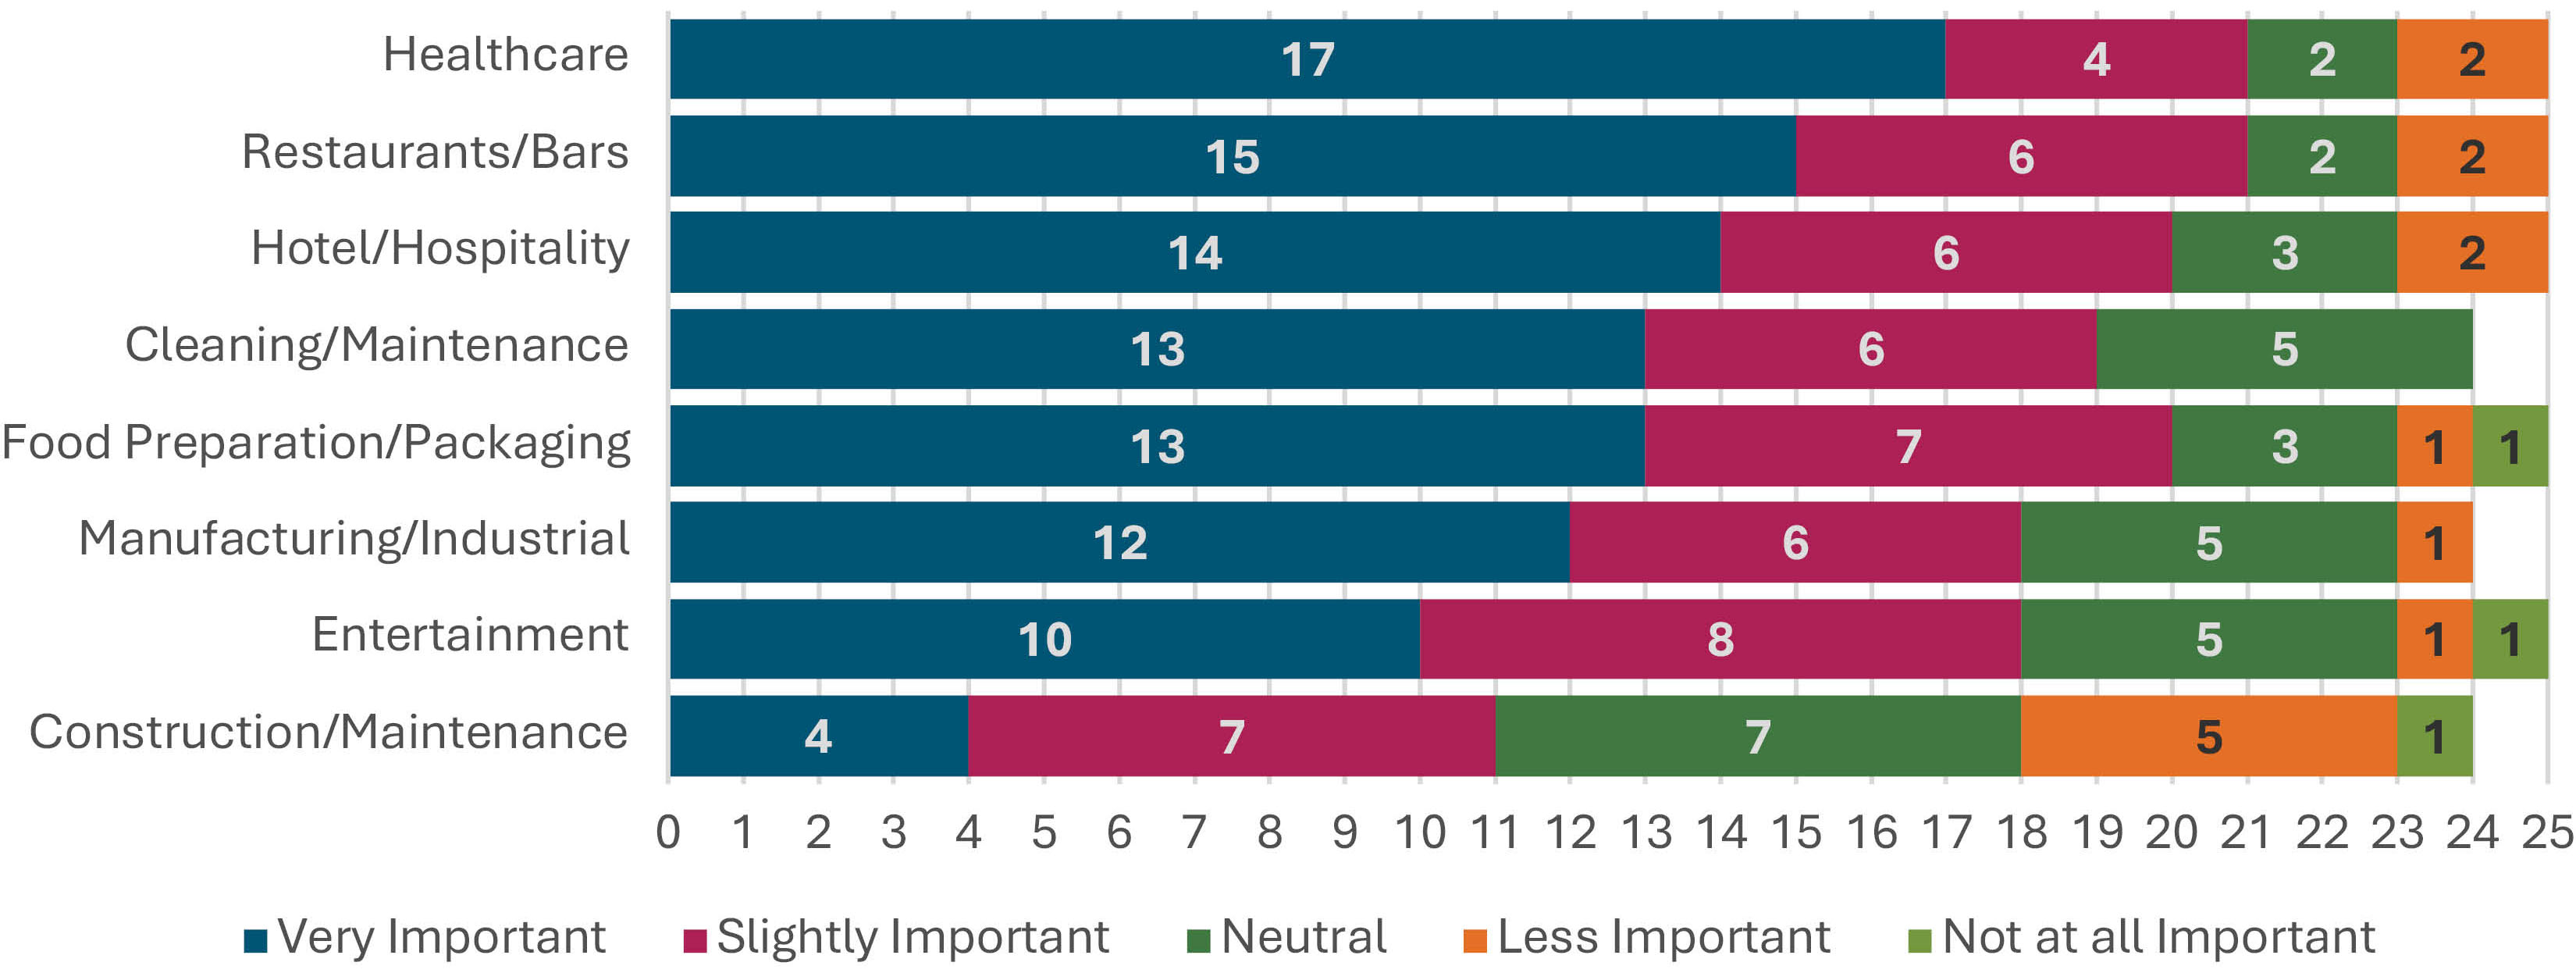
The survey asked which workers and industries, identified as having a high share of nighttime workers in the literature review, were important to serve with nighttime transit. Figure 13 and Figure 14 show the results of agencies rating the importance of each worker type and industry to their nighttime service goals. Most agencies found nighttime service important in serving all the workers and industries listed, except for construction and maintenance industries; only 11 agencies (44 percent) listed construction and maintenance industries as very important or slightly important to nighttime transit service.
Most respondents believed nighttime transit is important for service and shift workers. Twenty-four agencies (96 percent) responded that serving service workers and shift workers was “very important” or “slightly important” for nighttime operations. Twenty-one agencies (86 percent)
Agency |
Location |
Census Region Division |
Service Area Population |
Tier |
|---|---|---|---|---|
City of Madison |
Madison, WI |
East North Central |
348,359 |
Tier I (Fixed Route VOMS) |
Greater Richmond Transit Company |
Richmond, VA |
South Atlantic |
452,319 |
Tier I (Fixed Route VOMS) |
Southwest Ohio Regional Transit Authority |
Cincinnati, OH |
East North Central |
744,901 |
Tier I (Fixed Route VOMS) |
Montgomery County, Maryland |
Montgomery County, MD |
South Atlantic |
1,062,061 |
Tier I (Fixed Route VOMS) |
Pinellas Suncoast Transit Authority (PSTA) |
Saint Petersburg, FL |
South Atlantic |
1,100,607 |
Tier I (Fixed Route VOMS) |
Alameda-Contra Costa Transit District |
Oakland, CA |
Pacific |
1,586,454 |
Tier I (Fixed Route VOMS) |
Valley Metro Rail, Inc. |
Phoenix, AZ |
Mountain |
2,034,618 |
Tier I (Rail) |
Regional Transportation Commission of Southern Nevada |
Las Vegas, NV |
Mountain |
2,265,461 |
Tier I (Fixed Route VOMS) |
Blue Water Area Transportation Commission |
Port Huron, MI |
East North Central |
159,128 |
Tier I (Non-Fixed Route VOMS) |
Connecticut Department of Transportation |
Hartford, CT |
New England |
448,608 |
Tier I (Rail) |
City and County of San Francisco (Muni) |
San Francisco, CA |
Pacific |
842,754 |
Tier I (Rail) |
City of Charlotte |
Charlotte, NC |
South Atlantic |
1,306,574 |
Tier I (Rail) |
Capital Metropolitan Transportation Authority |
Austin, TX |
West South Central |
1,330,916 |
Tier I (Rail) |
Tri-County Metropolitan Transportation District of Oregon |
Portland, OR |
Pacific |
1,558,315 |
Tier I (Rail) |
Dallas Area Rapid Transit |
Dallas, TX |
West South Central |
2,530,800 |
Tier I (Rail) |
(continued on next page)
Metropolitan Transit Authority of Harris County, Texas |
Houston, TX |
West South Central |
3,757,692 |
Tier I (Rail) |
Washington Metropolitan Area Transit Authority |
Washington, DC |
South Atlantic |
5,089,918 |
Tier I (Rail) |
Maryland Transit Administration |
Baltimore, MD |
South Atlantic |
7,811,145 |
Tier I (Rail) |
Los Angeles County Metropolitan Transportation Authority |
Los Angeles, CA |
Pacific |
10,394,849 |
Tier I (Rail) |
City of DeKalb |
Dekalb, IL |
East North Central |
50,091 |
Tier II |
Bloomington Public Transportation Corporation |
Bloomington, IN |
East North Central |
86,987 |
Tier II |
City of Fort Collins |
Fort Collins, CO |
Mountain |
169,810 |
Tier II |
Lane Transit District |
Eugene, OR |
Pacific |
317,600 |
Tier II |
Des Moines Area Regional Transit Authority |
Des Moines, IA |
West North Central |
354,320 |
Tier II |
Gold Coast Transit District |
Oxnard, CA |
Pacific |
374,827 |
Tier II |

Long Description.
The horizontal axis shows numbers from 0 to 25 in increments of 1. The vertical axis shows two components. Each bar consists of five sections labeled Very important, slightly important, neutral, less important, and not at all important. The data given in the graph are as follows: Shift workers: 21 agencies rated them very important, 3 agencies rated them slightly important, and 1 agency rated them not at all important. Service workers: 20 agencies rated them very important, 4 agencies rated them slightly important, and 1 agency rated them not at all important.
Long Description.
The horizontal axis shows numbers from 0 to 25 in increments of 1. The vertical axis shows eight components. Each bar consists of five sections labeled Very important, slightly important, neutral, less important, and not at all important. The data given in the graph are as follows: Healthcare: 17, 4, 2, 2, 0. Restaurants or Bars: 15, 6, 2, 2, 0. Hotel or Hospitality: 14, 6, 3, 2, 0. Cleaning or Maintenance: 13, 6, 5, 0, 0. Food Preparation or Packaging: 13, 7, 3, 1, 1. Manufacturing or Industrial: 12, 6, 5, 1, 0. Entertainment: 10, 8, 5, 1, 1. Construction or Maintenance: 4, 7, 7, 5, 1.
stated shift workers are “very important” and 20 agencies (80 percent) stated service workers are “very important,” although there is overlap between workers in these two groups. Maryland MTA specifically noted the importance of providing a level of service in their system to accommodate shift workers in a way that does not impact their lives more negatively than traditional daytime workers.
For industries, respondents stated that nighttime transit is important for serving the healthcare and restaurant/bar industries. Twenty-one agencies (84 percent) responded that serving those working in healthcare and restaurants/bars was “very important” or “slightly important.” The hotel/hospitality and food preparation/packaging industries also proved important to serve with nighttime transit. Twenty agencies (80 percent) stated those in these industries were “very important” or “slightly important” to serve. LA Metro noted that people without housing or shelter were another important group to serve at nighttime in their service area.
Scope of Nighttime Transit Services
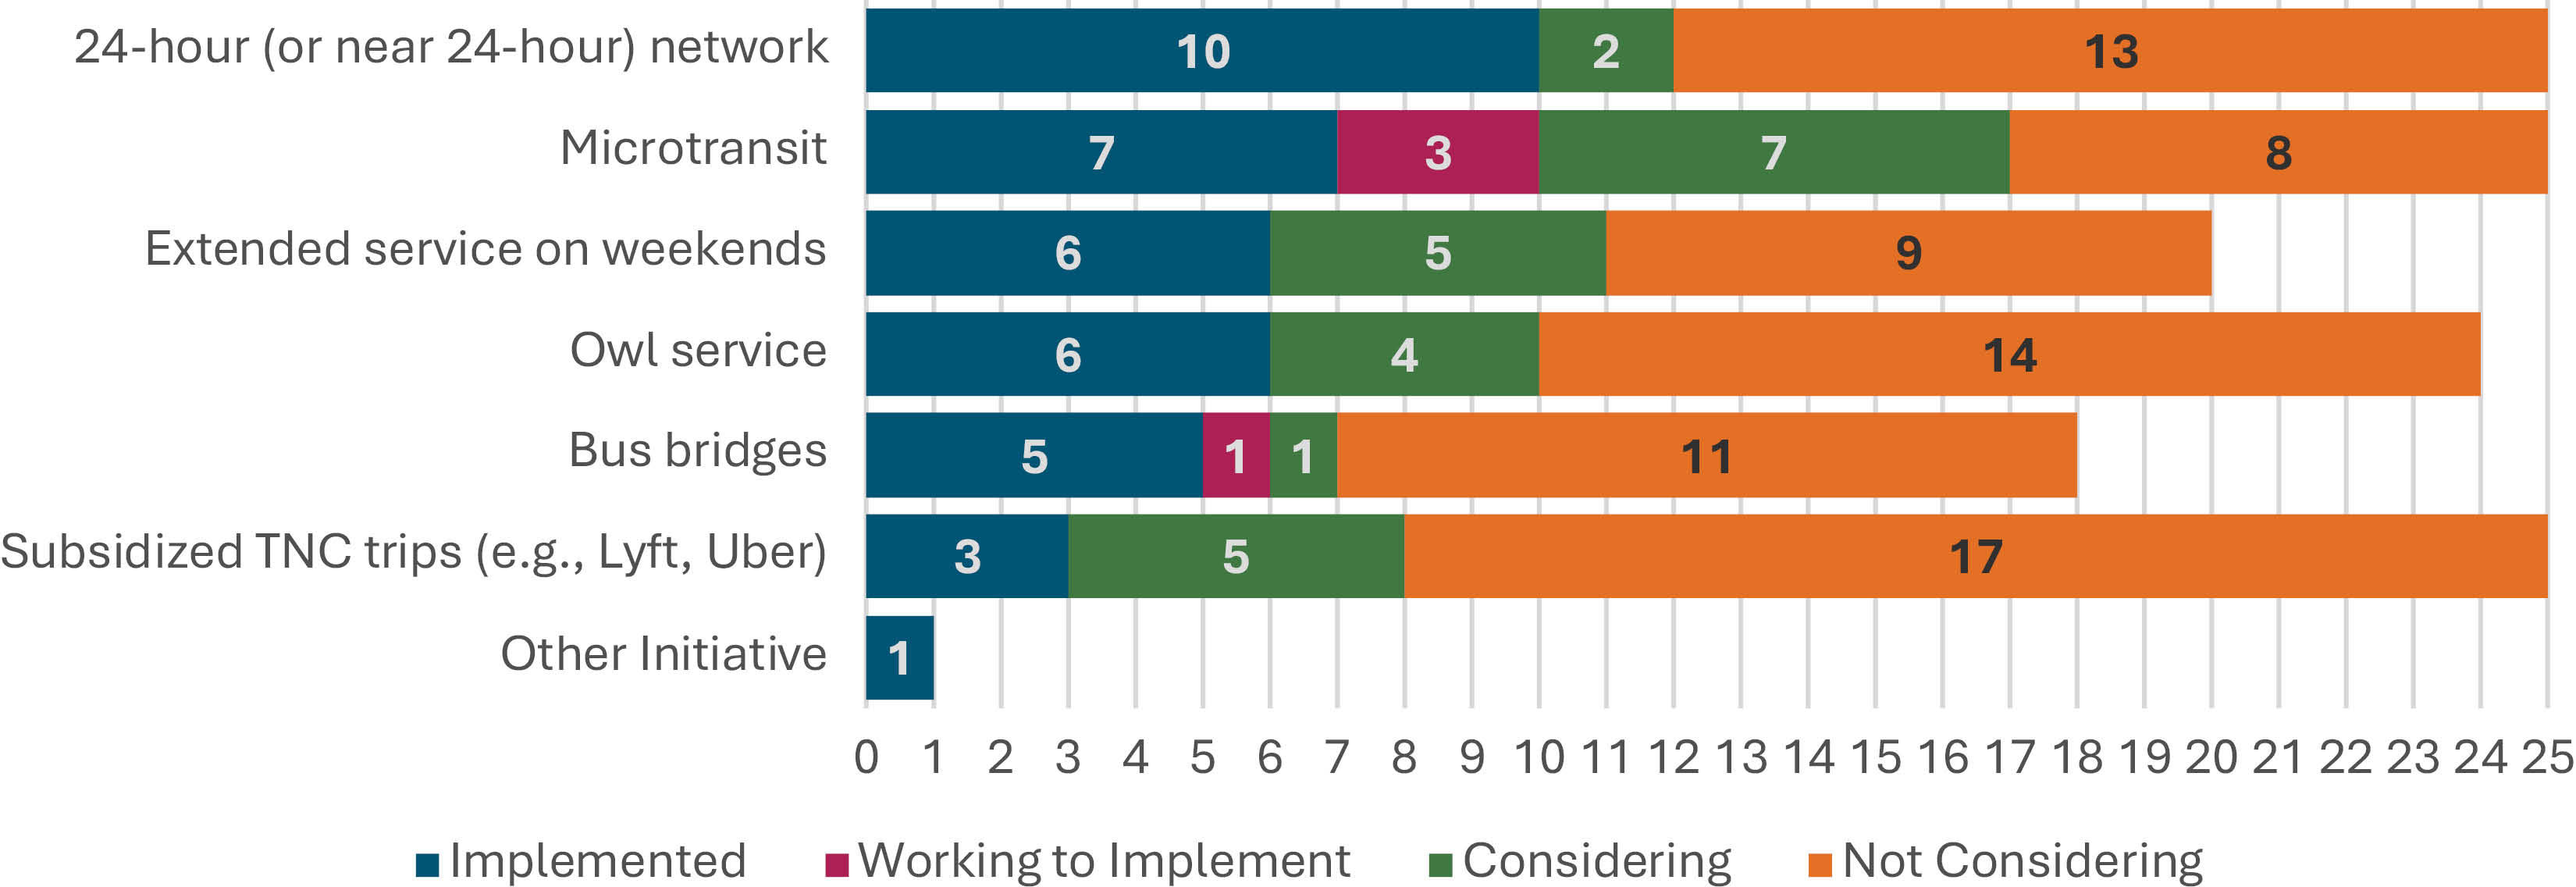
Agencies were asked which nighttime services they operate, based on the six categories identified in the literature review. Figure 15 shows the number of agencies that operate (have implemented), are working to implement, considering, or not considering each type of nighttime service. Of agencies that responded, 10 agencies (40 percent) have complete, or near, 24-hour bus routes, while seven agencies (28 percent) have implemented microtransit at night. Six agencies (30 percent) extend service hours on Fridays and Saturdays and (25 percent) have owl service. Fewer agencies replace rail service with buses and subsidize TNC trips; five agencies have implemented the former and three do the latter.
Of the service types that agencies are working to implement or are considering, microtransit has the highest rate of interest among respondents. Ten agencies (56 percent) that have not already implemented the service are working to implement the service or are considering it. Some agencies are considering subsidizing TNCs, but most agencies are not. The survey respondents that are considering TNCs are smaller agencies that stated that they were considering multiple different options. In the Other category, MTA Maryland notes that in addition to a network of buses that run nearly 24 hours, they also run some trips on daytime routes to serve nighttime employers based on shift times.
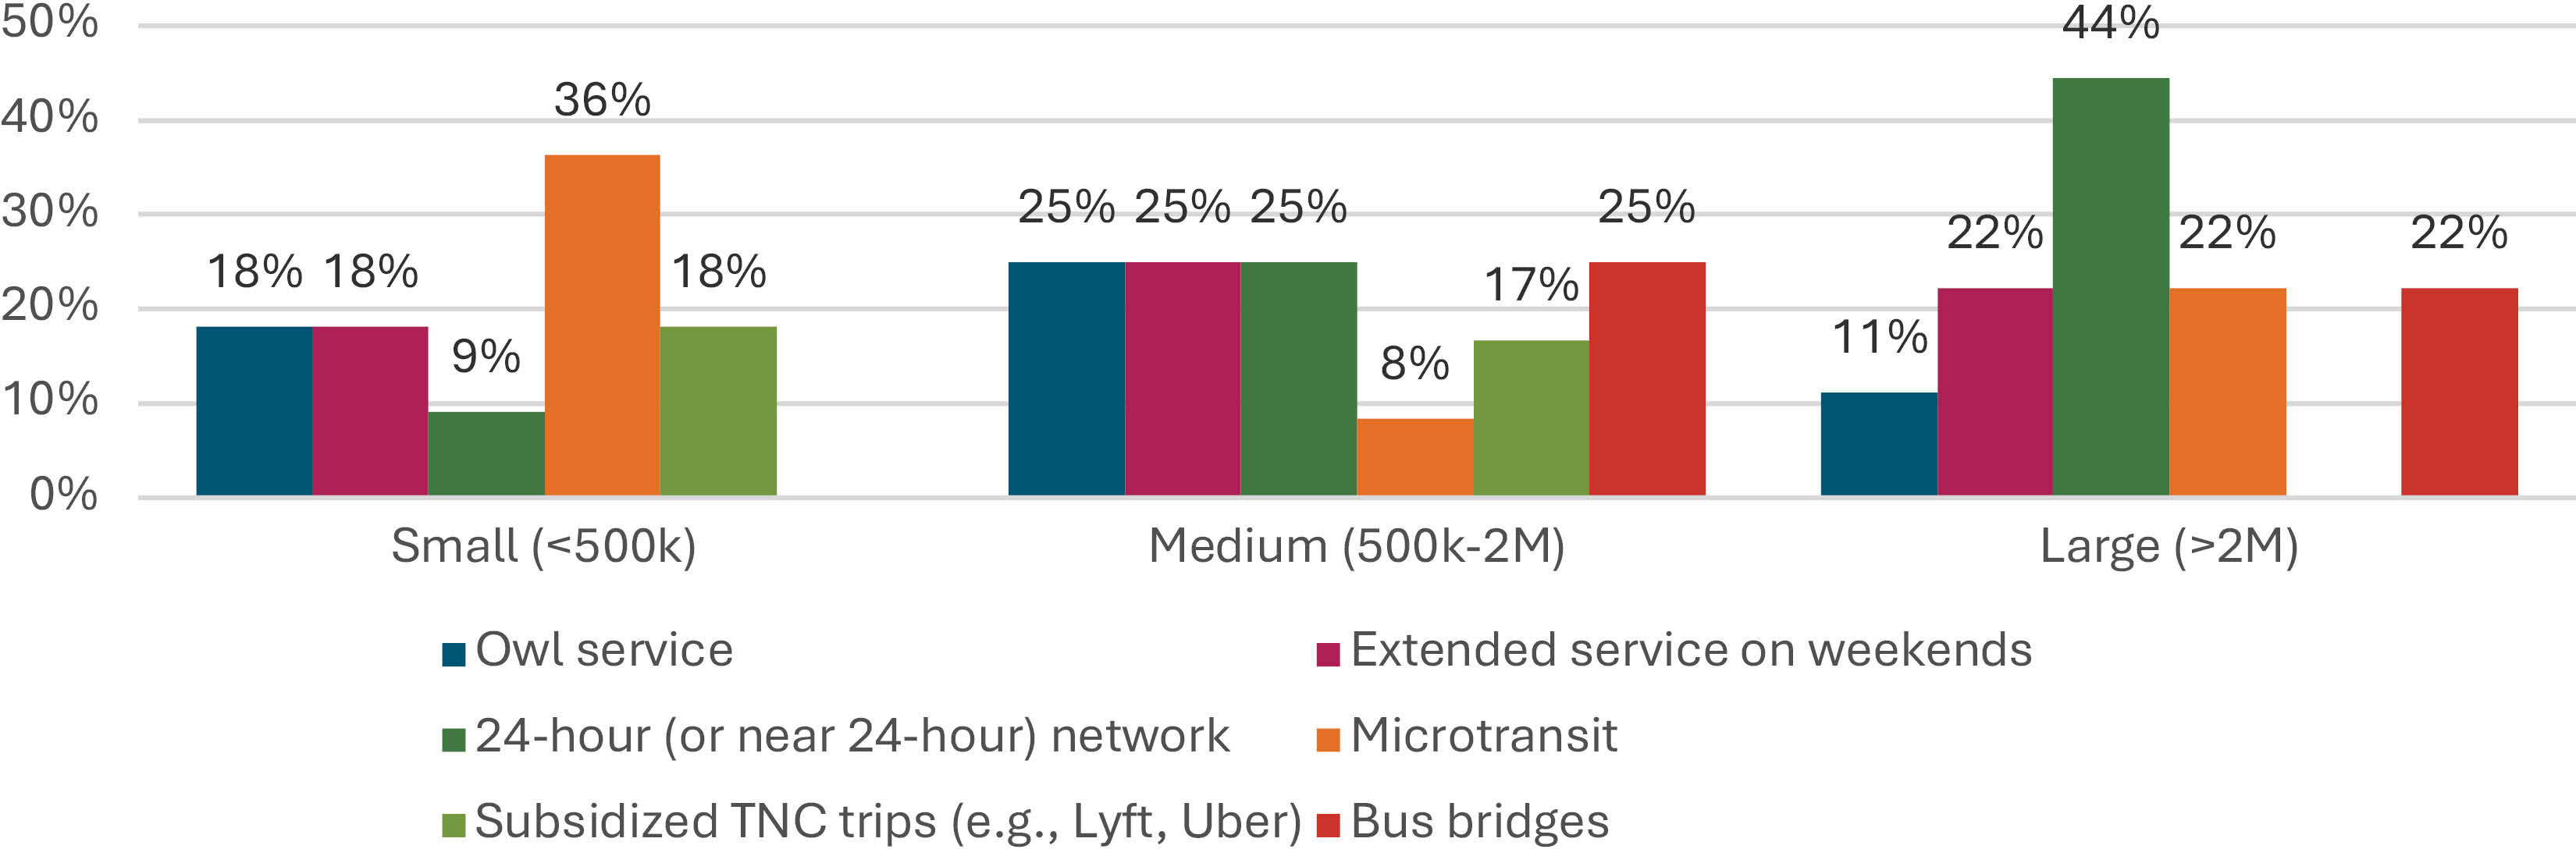
Based on sampled agencies, there may be a slight correlation between agency size and the type of service implemented. Figure 16 shows that the number of agencies with complete or near-complete 24-hour transit service increased with agency size; one small agency, or 9 percent of small agencies, has this type of service compared to four large agencies, or 44 percent of large
Long Description.
The horizontal axis shows numbers from 0 to 25 in increments of 1. The vertical axis shows seven components. Each bar consists of four sections labeled Implemented, working to implement, considering, and not considering. The data given in the graph are as follows: 24-hour (or near 24-hour) network: 10, 0, 2, 13. Microtransit: 7, 3, 7, 8. Extended service on weekends: 6, 0, 5, 9. Owl service: 6, 0, 4, 14. Bus bridges: 5, 1, 1, 11. Subsidized TNC trips (Example, Lyft, Uber): 3, 0, 5, 17. Other initiative: 1, 0, 0, 0.
Long Description.
The horizontal axis shows three agency sizes. Each agency size consists of six nighttime services representing Owl service, extended service on weekends, 24-hour (or near 24-hour) network, microtransit, subsidized TNC trips (For example, Lyft, Uber), and bus bridges. The vertical axis shows percentage values from 0 to 50 in increments of 10. The data given in the graph are as follows: Small (less than 500k): 18, 18, 9, 36, 18, 0. Medium (500k to 2M): 25, 25, 25, 8, 17, 25. Large (greater than 2M): 11, 22, 44, 22, 0, 22.
Implemented |
Working to |
Considering |
Not Considering |
|---|---|---|---|
5 |
1 |
1 |
5 |
agencies. Microtransit services do not show this same trend, but small agencies are twice as likely to have this type of service as each other type in the sample.
Though five agencies stated they have implemented bus bridges at night, 12 of the surveyed agencies operate rail service (42 percent) and replace rail service with buses. Table 3 shows the breakdown of responses of these agencies to this service type.
Figure 17 displays the responses for each agency and highlights which agencies offer nighttime fixed-route services and those that provide microtransit options. Most agencies provide nighttime fixed-route services; 10 out of 25 agencies provide either owl service or 24-hour bus routes, with an additional three agencies extending their services on Friday and Saturday nights. Although fewer agencies offer microtransit options, these seem to be gaining popularity. Eight agencies currently offer microtransit or subsidized TNC trips, and another 10 are considering or working to implement such programs. Notably, Las Vegas RTC and Pinellas Suncoast Transit Authority (Saint Petersburg, FL) provide fixed-route and demand-response nighttime services, with Las Vegas operating 24-hour services and Pinellas extending services on weekends.
Additionally, several agencies without listed nighttime initiatives are either exploring new initiatives or have other plans in place. Dallas Area Rapid Transit (DART) has extended services seven days a week; Tri-County Metropolitan Transportation District of Oregon (TriMet) is considering bus bridges; Ride-On in Montgomery County, MD, is contemplating owl service, microtransit, and TNC; and Charlotte Area Transit System (CATS) in Charlotte, NC, is working toward implementing microtransit at night.
Planning Activities to Support Nighttime Transit
Internal Agency Practices
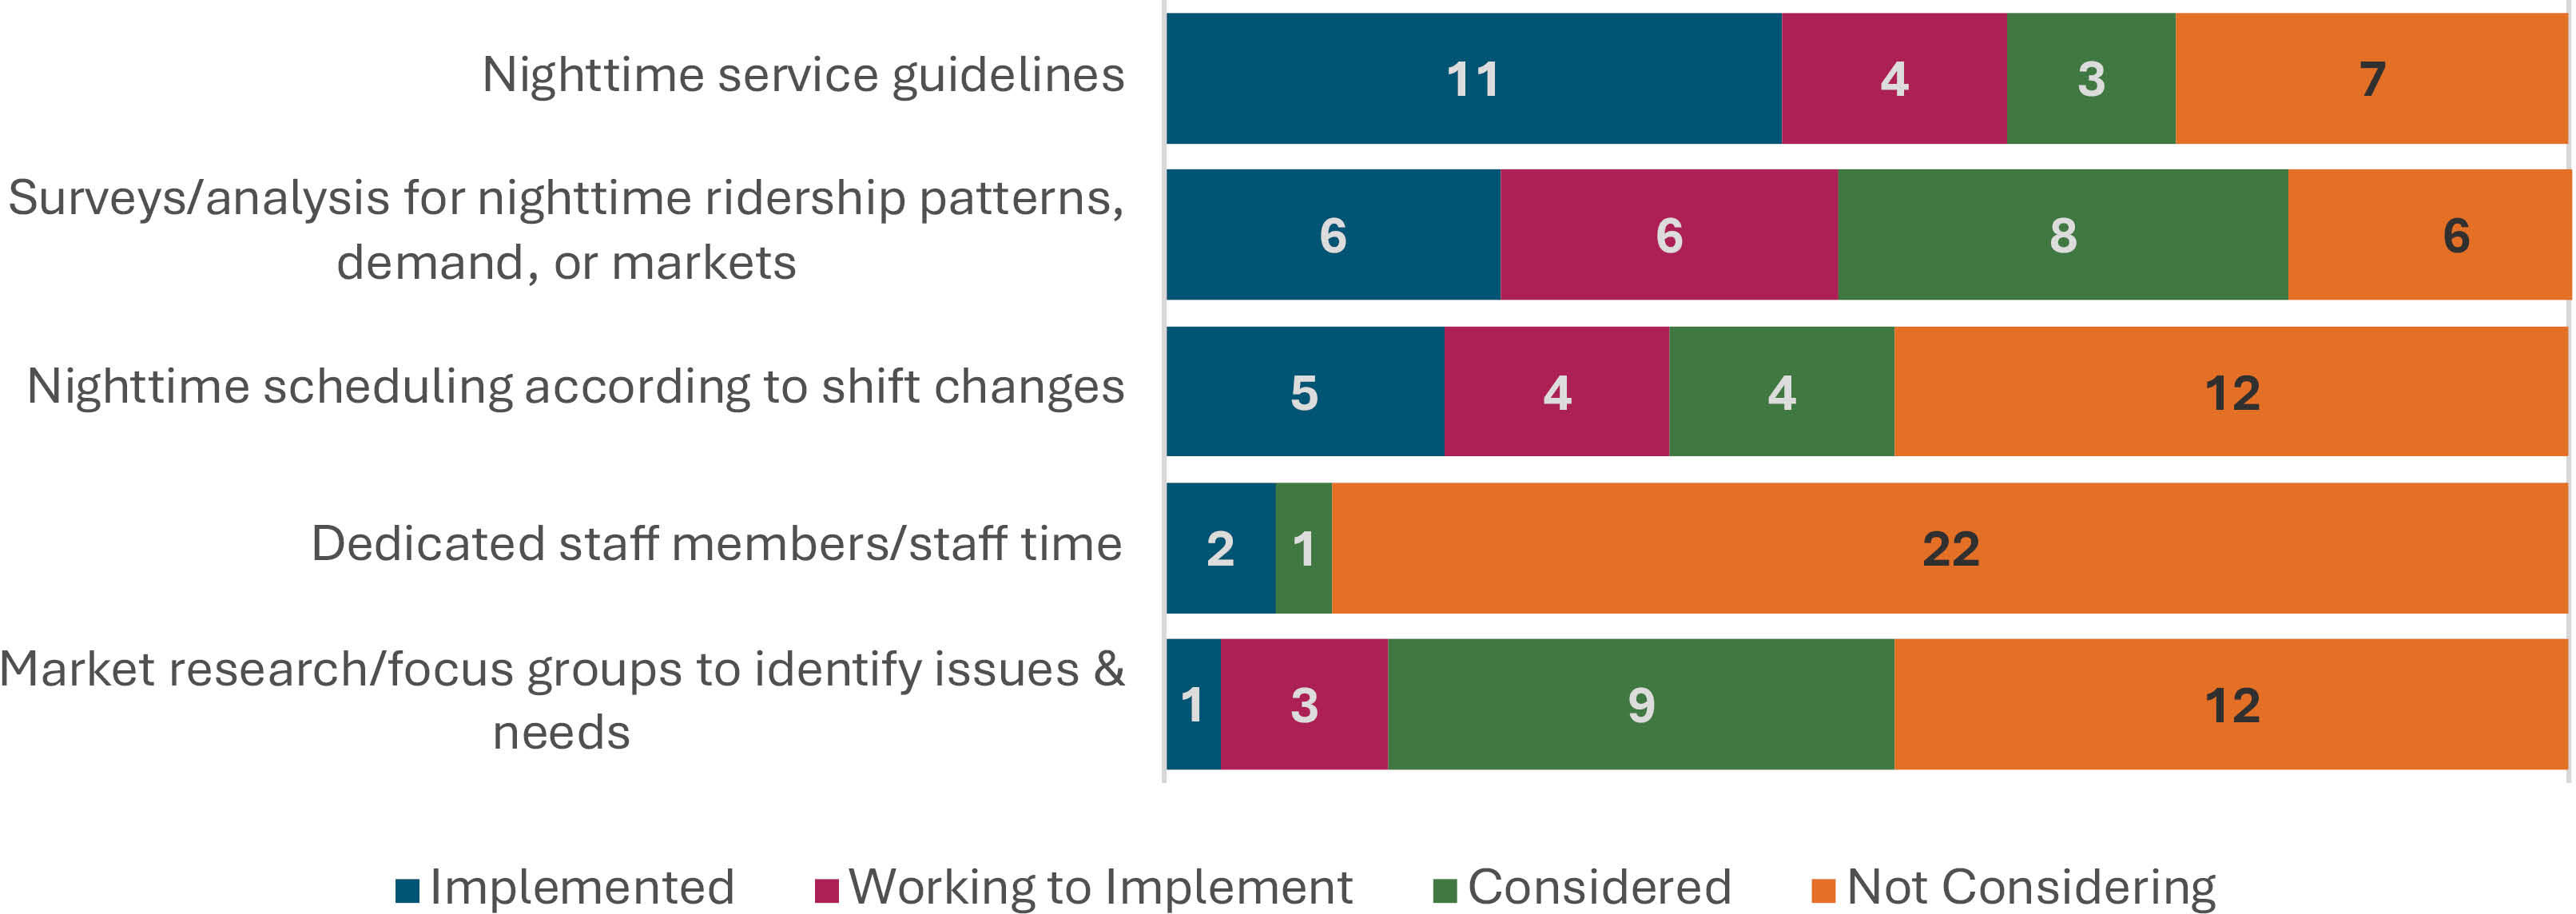
Survey respondents were asked to choose which planning practices were done within their agency to facilitate nighttime transit service operations. Figure 18 shows that the most common internal planning practice is to establish nighttime service guidelines. Eleven agencies (44 percent) have implemented these guidelines, with an additional four (16 percent) working to implement them. Few agencies have dedicated staff members or staff time devoted to planning nighttime service, with most agencies not considering implementing the practice.

Long Description.
The table consists of seven columns with headers Agency, Owl service, Network of 24-hour bus routes, extended service hours on Friday and Saturday nights, Microtransit, Subsidized TNC trips, and Bus bridges. The data given in the table row-wise are as follows: Row 1, AC Transit: Implemented, Implemented Considering, Considering, Not Considering, Implemented. Row 2, City of DeKalb: Implemented, Implemented, Not Applicable, Implementing, Not Considering, Not Applicable. Row 3, Muni: Implemented, Implemented, Not Applicable, Not Considering, Not Considering, Implemented. Row 4, LA Metro: Implemented, Implemented, Not Considering, Not Considering, Not Considering, Implemented. Row 5, City of Madison: Implemented, Not Considering, Implemented, Not Considering, Not Considering, Not Applicable. Row 6, CapMetro: Implemented, Not Considering, Considering, Not Considering Not, Considering, Not Applicable. Row 7, WMATA: Considering, Implemented, Not Considering, Not Considering, Not Considering, Considering. Row 8, MTA Maryland: Not Considering, Implemented, Implemented, Considering, Considering, Implemented. Row 9, Go Metro: Not Considering, Implemented, Implemented, Considering, Considering, Implemented. Row 10, RTC Southern NV: Not Considering, Implemented, Not Applicable, Implemented, Not Considering, Not Applicable. Row 11, City of Fort Collins: Considering, Considering, Implemented, Considering, Considering, Not Applicable. Row 12, RideOn: Considering, Not Applicable, Considering, Considering, Considering, Not Applicable. Row 13, Valley Metro: Considering, Not Considering, Implemented, Implemented, Not Considering, Implemented. Row 14, METRO Houston: Not Applicable, Considering, Not Applicable, Implemented, Not Considering, Not Considering. Row 15, Blue Water Area Transit: Not Considering, Not Applicable, Not Considering, Implemented, Not Considering, Not Applicable. Row 16, PSTA: Not Considering, Not Considering, Implemented, Implemented, Implemented, Not Applicable. Row 17, Bloomington Transit: Not Considering, Not Considering, Not Considering, Implemented, Implemented, Not Applicable. Row 18, CDOT: Not Considering, Not Considering, Not Considering, Not Considering, Not Considering, Not Considering. Row 19, Gold Coast Transit: Not Considering, Not Considering, Considering, Implementing, Considering, Not Applicable. Row 20, GRTC: Not Considering, Not Considering, Not Applicable, Implemented, Considering, Not Applicable. Row 21, CATS: Not Considering, Not Considering, Considering, Not Considering, Not Considering, Not Applicable. Row 22, Lane Transit District: Not Considering, Not Considering, Considering, Not Considering, Not Considering. Row 23, Implementing Tri-Met: Not Considering, Not Considering, Not Considering, Not Considering, Not Considering. Row 24, Implemented DART Dallas: Not Considering, Not Considering, Not Considering, Not Considering, Not Considering, Not Applicable. Row 25, DART Des Moines: Not Considering, Not Considering, Not Considering, Not Considering, Not Considering, Not Applicable.
Challenges
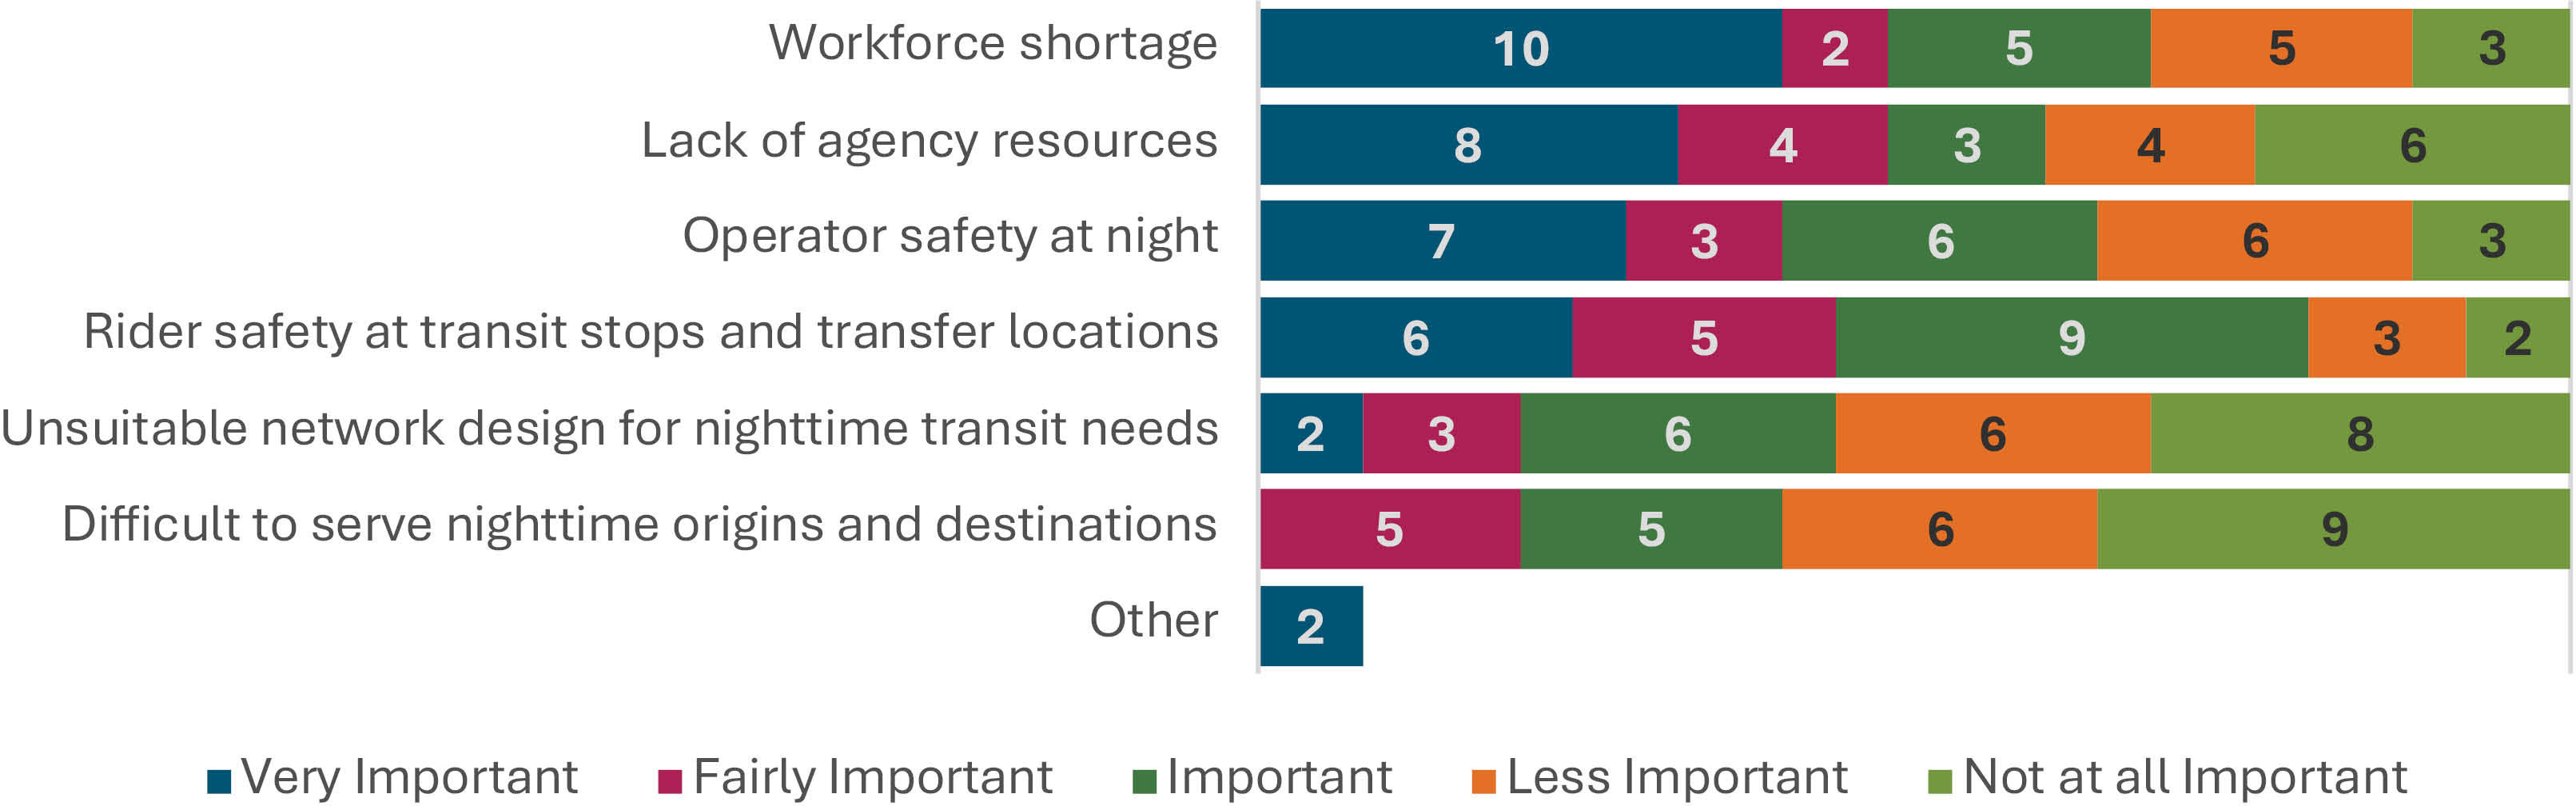
Figure 19 shows agency responses to a question about challenges agencies experience in implementing and operating nighttime service. A challenge that agencies find important in affecting nighttime service is workforce shortages; 17 agencies (68 percent) cite this as an “important,” “fairly important,” or “very important” challenge, with 10 agencies (40 percent) responding this was a “very important” challenge.
Safety is also an important concern, with 20 agencies (80 percent) stating rider safety was an important challenge at night, and 16 agencies (64 percent) stating operator safety was an important challenge to nighttime service initiatives. Safety at layover locations for operators, as well as securing restroom access, can pose a challenge for nighttime route alignment.
An additional challenge that Maryland MTA and Metro in Houston, TX, note in the Other category is matching the correct level of service with nighttime demand in their service area. CATS is addressing this issue in its service area by creating a microtransit service to supplement coverage and replace low-performing routes in its network.
Partnerships
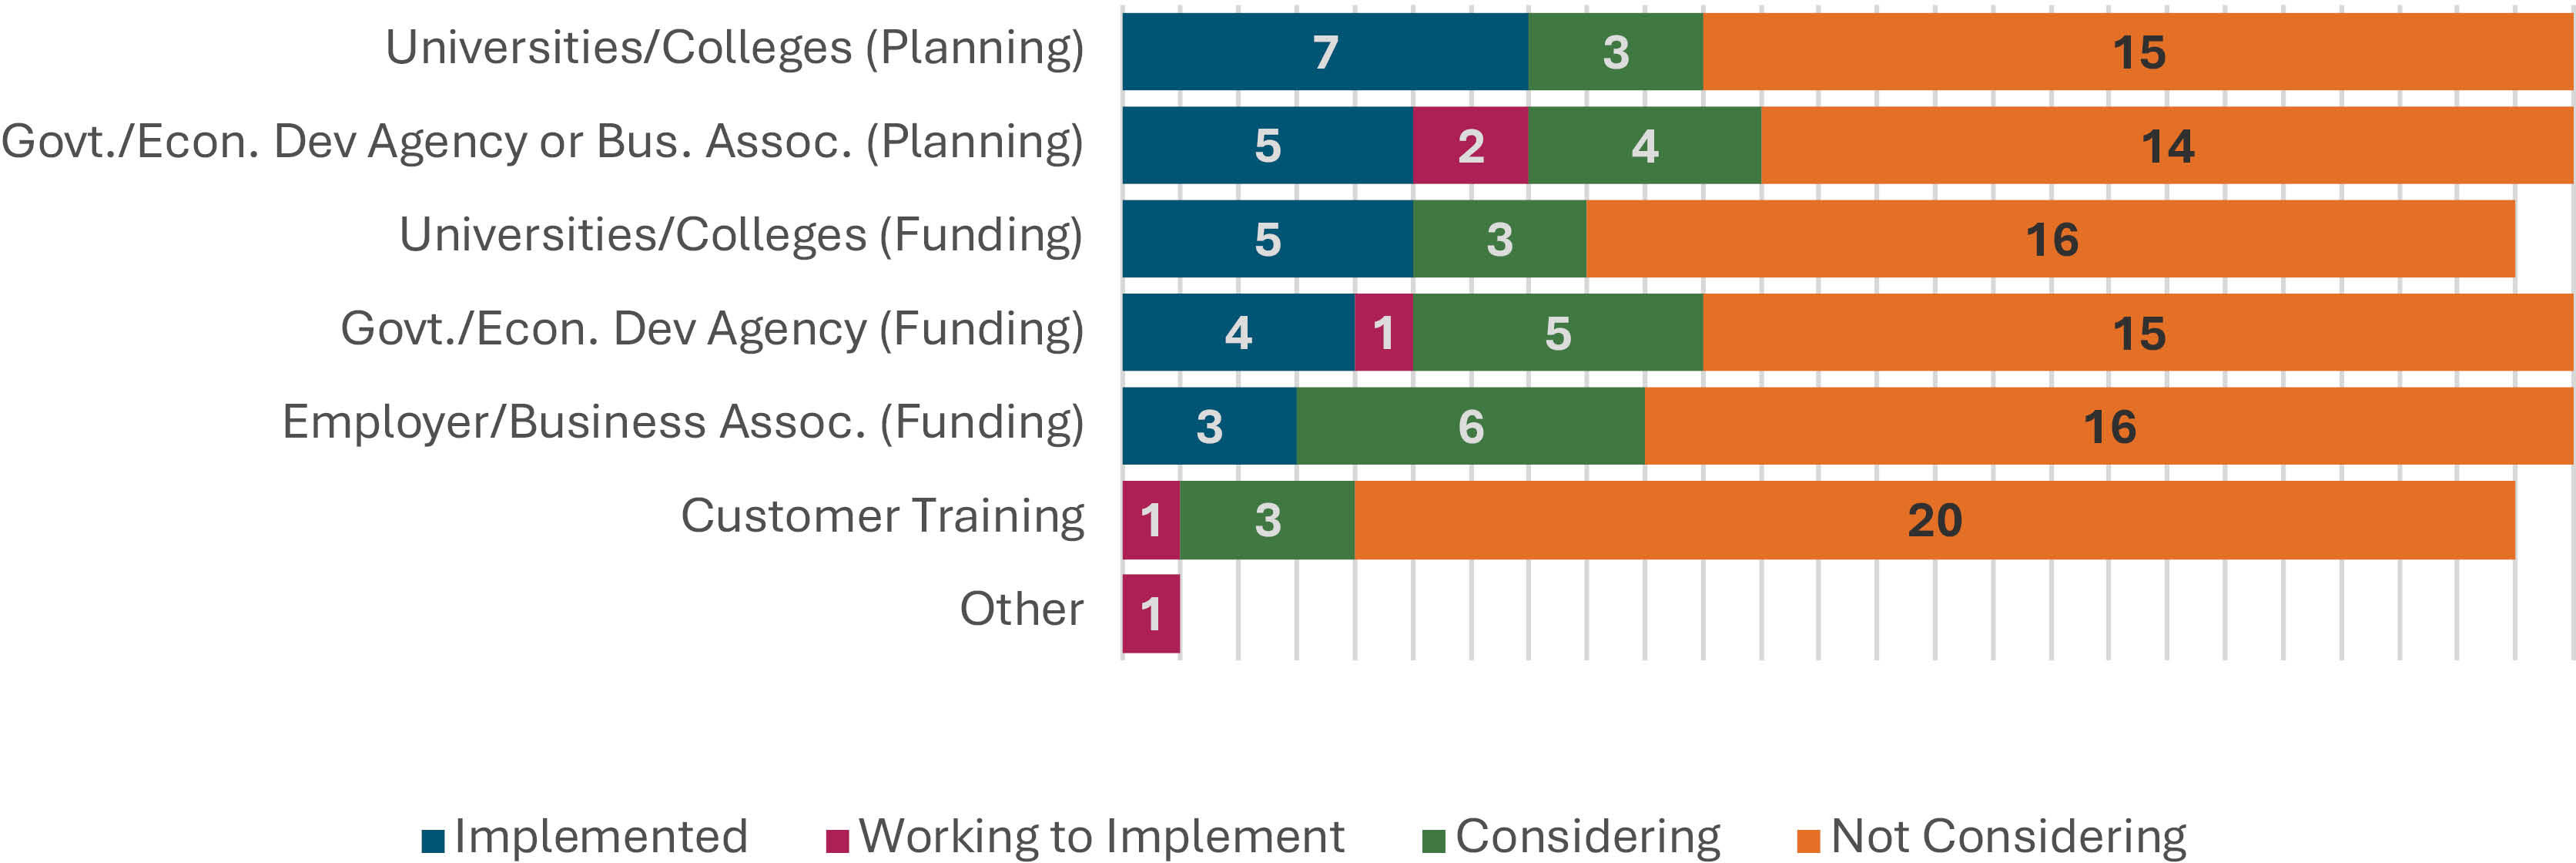
Agencies were asked to select which planning and funding partnerships they have implemented or are considering for nighttime service (Figure 20). Overall, partnerships for planning and funding nighttime services are not common among the sample agencies, and many are not
Long Description.
The graph has no horizontal axis. The vertical axis shows five components. Each bar consists of four sections labeled Implemented, working to implement, considering, and not considering. The data given in the graph are as follows: Nighttime service guidelines: 11, 4, 3, 7. Surveys or analysis for nighttime ridership patterns, demand, or markets: 6, 6, 8, 6. Nighttime scheduling according to shift changes: 5, 4, 4, 12. Dedicated staff members or staff time: 2, 0, 1, 22. Market research or focus groups to identify issues and needs: 1, 3, 9, 12.
Long Description.
The graph has no horizontal axis. The vertical axis shows seven components. Each bar consists of five sections labeled Very important, slightly important, important, less important, and not at all important. The data given in the graph are as follows: Workforce shortage: 10, 2, 5, 5, 3. Lack of agency resources: 8, 4, 3, 4, 6. Operator safety at night: 7, 3, 6, 6, 3. Rider safety at transit stops and transfer locations: 6, 5, 9, 3, 2. Unsuitable network design for nighttime transit needs: 2, 3, 6, 6, 8. Difficult to serve nighttime origins and destinations: 0, 5, 5, 6, 9. Other: 2, 0, 0, 0, 0.
Long Description.
The graph has no horizontal axis. The vertical axis shows seven components. Each bar consists of four sections labeled Implemented, working to implement, considering, and not considering. The data given in the graph are as follows: Universities/Colleges (planning): 7, 0, 3, 15. Government or Economic Development Agency or Business association (planning): 5, 2, 4, 14. Universities or Colleges (funding): 5, 0, 3, 16. Goverment or Econonmic Development Agency (funding): 4, 1, 5, 15. Employer/Business Association (funding): 3, 0, 6, 16. Customer Training: 0, 1, 3, 20. Other: 0, 1, 0, 0.
considering forming them. Planning partnerships with universities/colleges and government/economic development agencies are the most prevalent type of the partnerships agencies have implemented or are working to implement. Seven agencies (28 percent) have implemented planning partnerships with universities and colleges. For CapMetro and the City of Dekalb, universities played an important role in creating nighttime service, either to prevent students from drinking and driving or to meet nighttime service demand for a group with lower car ownership. Seven agencies (28 percent) have implemented or are working to implement a planning partnership with a public (government or economic) or a private (employer or business association) organization. Four agencies (16 percent) have implemented funding partnerships with government agencies, but WMATA successfully partnered with the District of Columbia government to fund 24-hour service on its most frequent routes. Maryland MTA added that they partner with employers and other organizations to create and locate safe bus stops and layovers for customers and operators.
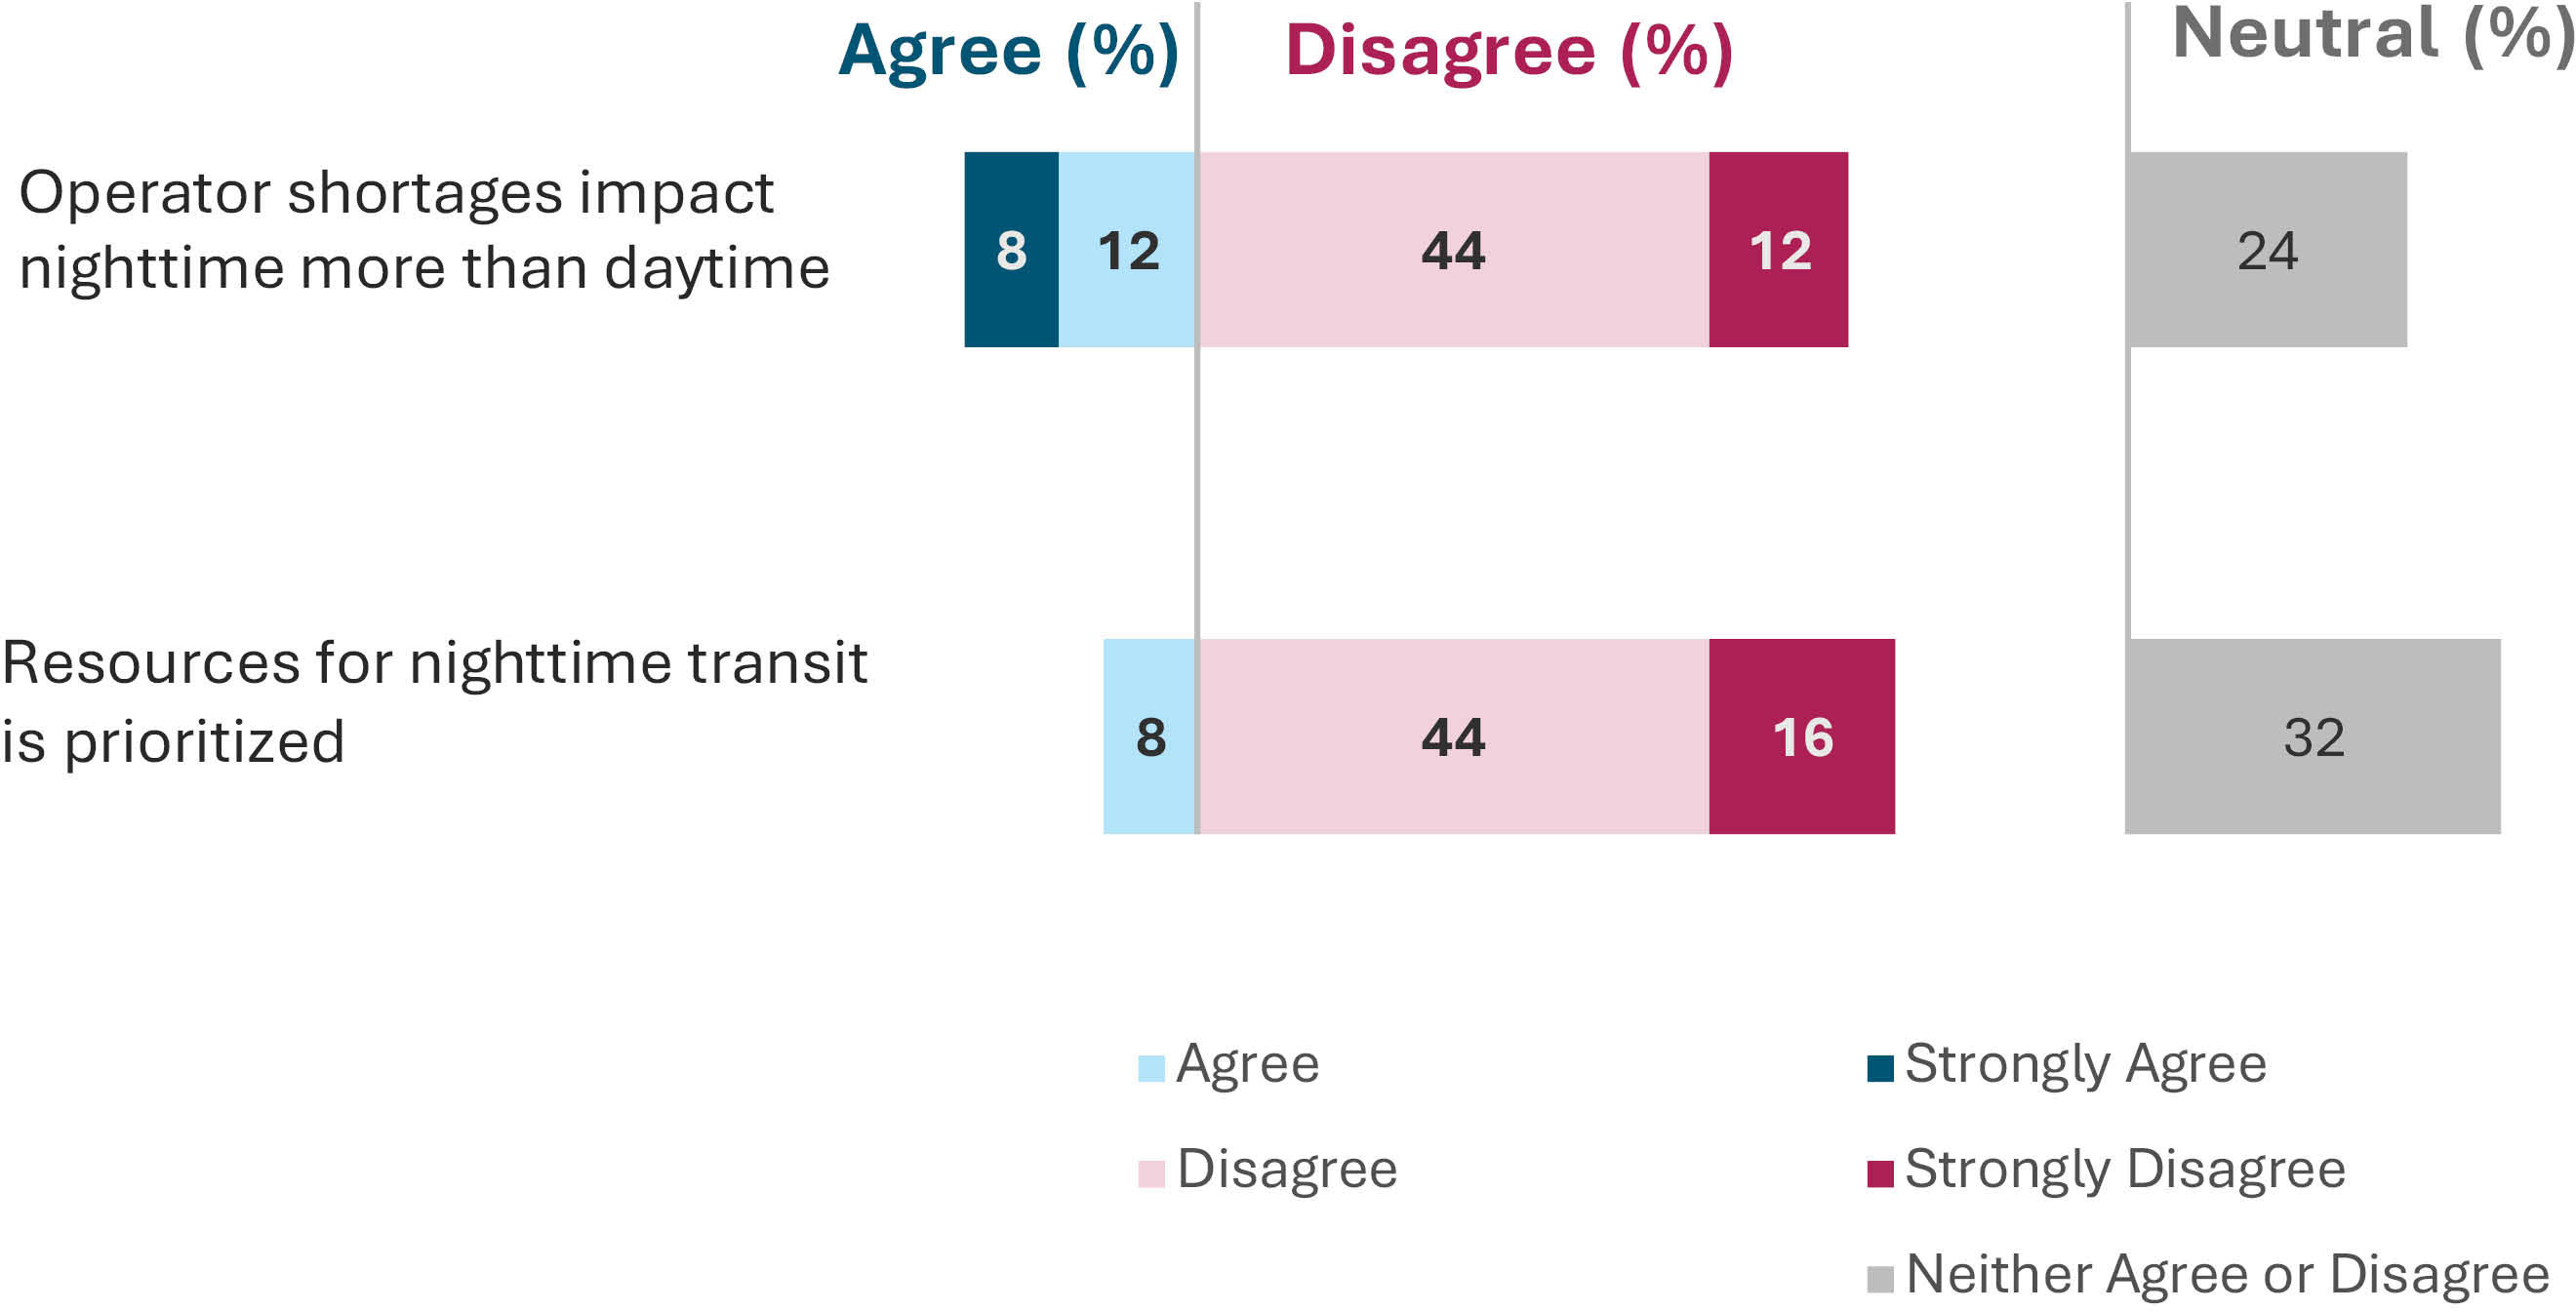
Resources
Agencies were asked whether they agreed or disagreed with statements regarding resources for nighttime versus daytime transit service (Figure 21). Overall, most agencies disagreed that resources for nighttime service are prioritized and that operator shortages impact nighttime service more than daytime.
Two agencies (8 percent of respondents), prioritize nighttime resources over daytime. Nighttime service may be seen as a service with the goal of increasing access and might have some resources set aside to safeguard it, perhaps similar to a lifeline bus route. However, low productivity and ridership often mean that resources may go further in serving more riders when allocated to daytime service. Five agencies (20 percent) agreed or strongly agreed that operator shortages impact nighttime service more than daytime service, but 14 agencies (56 percent) disagreed. Some agencies report being less affected by systemwide operator shortages at night due to infrequent service and operators incentivized by overtime/bonus pay, while others reported shortages may be exacerbated at night if operators are concerned about safety within the service area.
Fares
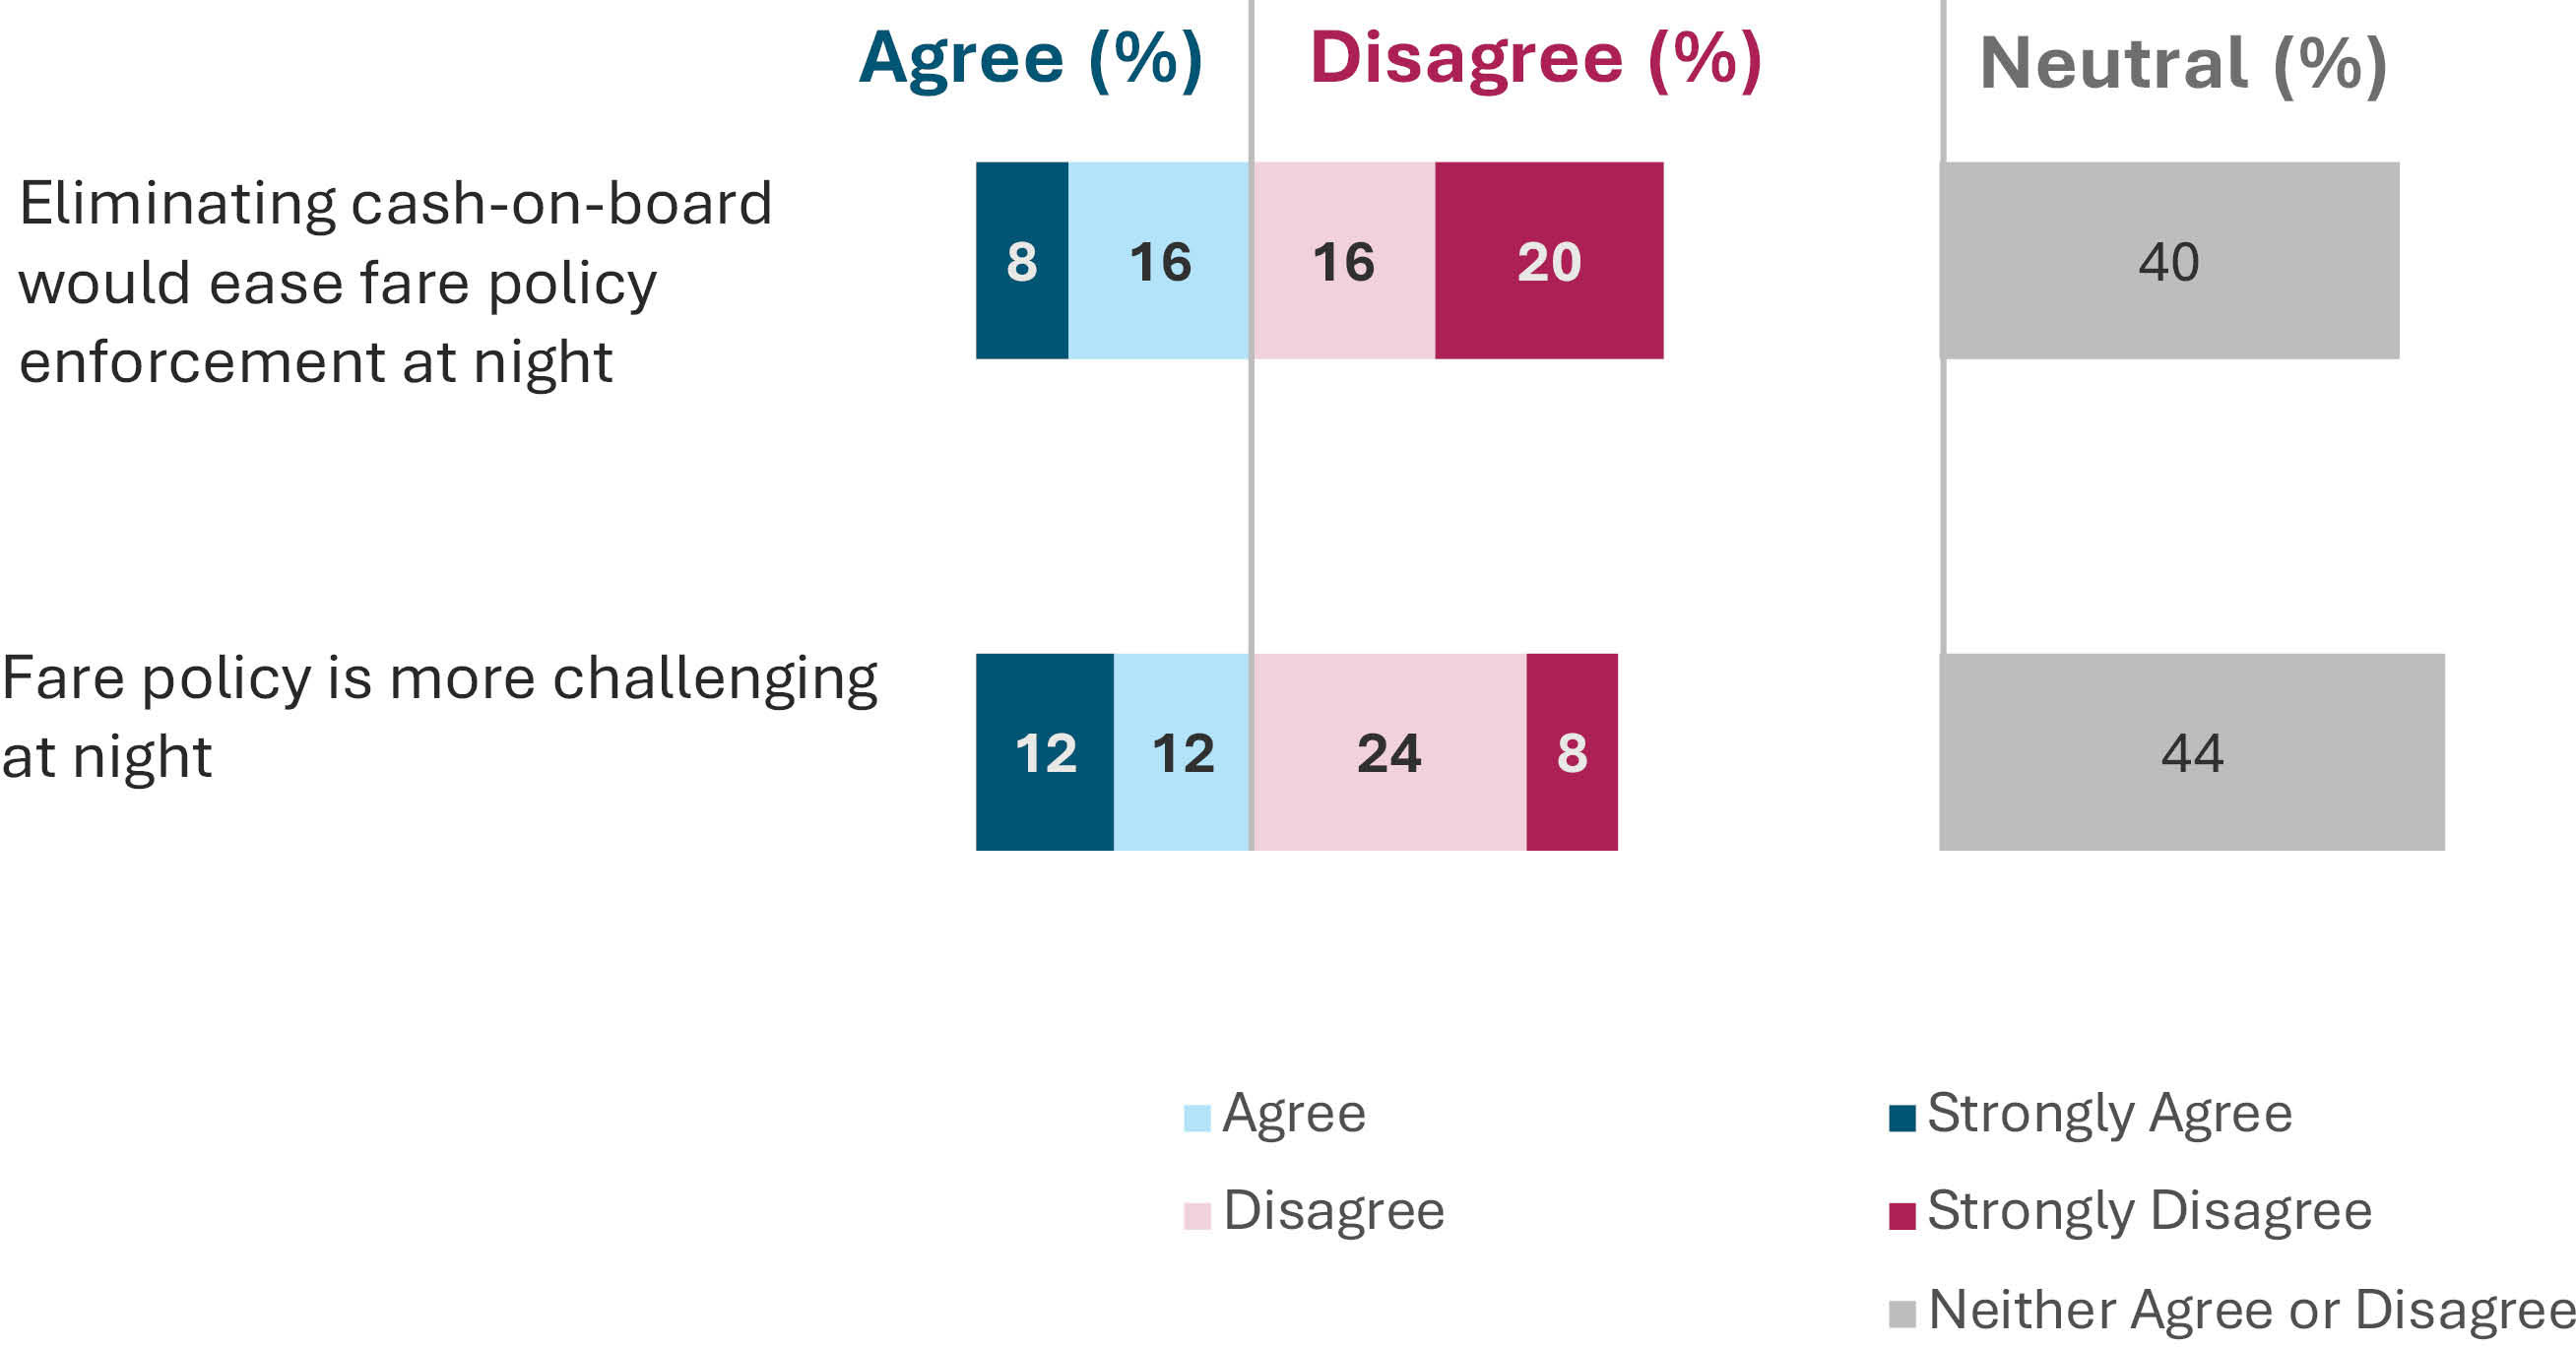
Agencies were asked to state whether they agreed or disagreed with statements regarding fare policy and enforcement for nighttime versus daytime transit service (Figure 22). Fare enforcement does not seem to be an outsized challenge at night; a few agencies responded that
Long Description.
The horizontal axis shows five components, Strongly agree, Agree, Disagree, Strongly disagree, and Neutral (in percent). The vertical axis shows two components. The data given in the graph are as follows: Operator shortages impact nighttime more than daytime: 8, 12, 44, 12, 24. Resources for nighttime transit are prioritized: 0, 8, 44, 16, 32.
Long Description.
The horizontal axis shows five components, Strongly agree, Agree, Disagree, Strongly disagree, and Neutral (in percent). The vertical axis shows two components. The data given in the graph are as follows: Eliminating cash-on-board would ease fare policy enforcement at night: 8, 16, 16, 20, 40. Fare policy is more challenging at night: 12, 12, 24, 8, 44.
fare enforcement was more challenging at nighttime than daytime hours. While six agencies (20 percent) “agreed” or “strongly agreed” that policy enforcement is more difficult at night and eliminating cash-on-board would ease it, eight agencies “disagree” or “strongly disagreed” that it is more challenging at night; nine agencies “disagree” or “strongly disagreed” that eliminating cash fares would ease this challenge. Ten agencies (40 percent) answered that fare enforcement and policies are neither more nor less difficult at night compared to daytime hours. TriMet elaborated that though eliminating cash fares may pose some benefits, those riding as a means of shelter can pose a challenge to nighttime service operations, and enforcing a fare policy can serve to limit the number of riders doing so.
Performance Monitoring
Agencies were asked a series of questions regarding the importance of certain performance metrics in nighttime service. Performance metrics were chosen based on common agency focus areas, and questions were asked to fill a gap in the literature on how these focus areas differ between daytime and nighttime service.
When comparing the importance of tracking performance metrics specifically for the nighttime (Figure 23), agencies overall thought it was just as important to track metrics for daytime and nighttime, except for safety, timed transfers, and stop infrastructure. Though the question had the three metrics listed as separate answer options, the metrics are linked to safety. Fourteen agencies (56 percent) stated that tracking safety at nighttime and daytime separately was “much more important” or “slightly more important,” with a majority of these 14 agencies (71 percent) finding it “much more important” at nighttime. Timed transfers ensure that riders will not be at bus stops or transit stations for excessively long times at night; 13 agencies (52 percent) believed tracking timed transfers separately for night service was “much more important” or “slightly more important.” Eleven agencies (44 percent) stated it was “much more important” or “slightly more important” to track stop infrastructure for nighttime service. Conversely, financial performance and travel speed are two metrics that more agencies have stated were “slightly less important” or “much less important” than important to track specifically for nighttime service. Though seven agencies (28 percent) also stated ridership and productivity were “slightly less important” or “much less important,” Southwest Ohio Regional Transit Authority (Metro) reported a productivity rate of seven passengers per hour for their seven

Long Description.
The horizontal axis shows five components: Much more important, slightly more important, slightly less important, much less important, and just as important (in percent). The vertical axis shows ten components. The data given in the graph are as follows: Safety: 40, 16, 4, 4, 36. Timed transfers: 28, 24, 0, 4, 44. Stop infrastructure: 12, 32, 0, 8, 48. Reliability and on-time performance: 12, 16, 8, 0, 64. Service availability: 16, 8, 12, 0, 64. Ridership and productivity: 12, 12, 24, 4, 48. Financial performance: 4, 16, 28, 12, 40. Frequency: 0, 16, 20, 8, 56. Cleanliness: 0, 8, 4, 12, 76. Travel speed: 0, 8, 16, 16, 60.
nighttime routes. For the remaining metrics, most agencies stated it was “just as important” to track performance metrics.
Survey respondents who reported that tracking nighttime performance metrics separately from daytime metrics was “slightly more important” or “much more important” were prompted to answer whether they tracked the performance metric within their agency (Figure 24). Of the agencies that were prompted to answer for each metric, most respondents track them.
Of the agencies that selected “tracking” or “working to track” for the prior question, they were prompted to answer how they track each metric (Figure 25). In general, agencies reported using customer surveys to measure safety and cleanliness metrics and software services to measure service availability, financial performance, and timed transfers.

Long Description.
The graph has no horizontal axis. The vertical axis shows eleven components. Each bar consists of three sections labeled tracking, working to track, and considering. The data given in the graph are as follows: Safety: 7, 3, 2. Timed transfers: 5, 4, 4. Service availability: 4, 2, 0. Reliability and on-time performance: 6, 0, 1. Stop infrastructure: 5, 0, 0. Ridership and productivity: 6, 0, 0. Financial performance: 5, 0, 0. Frequency: 4, 0, 0. Cleanliness: 0, 2, 0. Travel speed: 2, 0, 0. Other: 1, 0, 0.
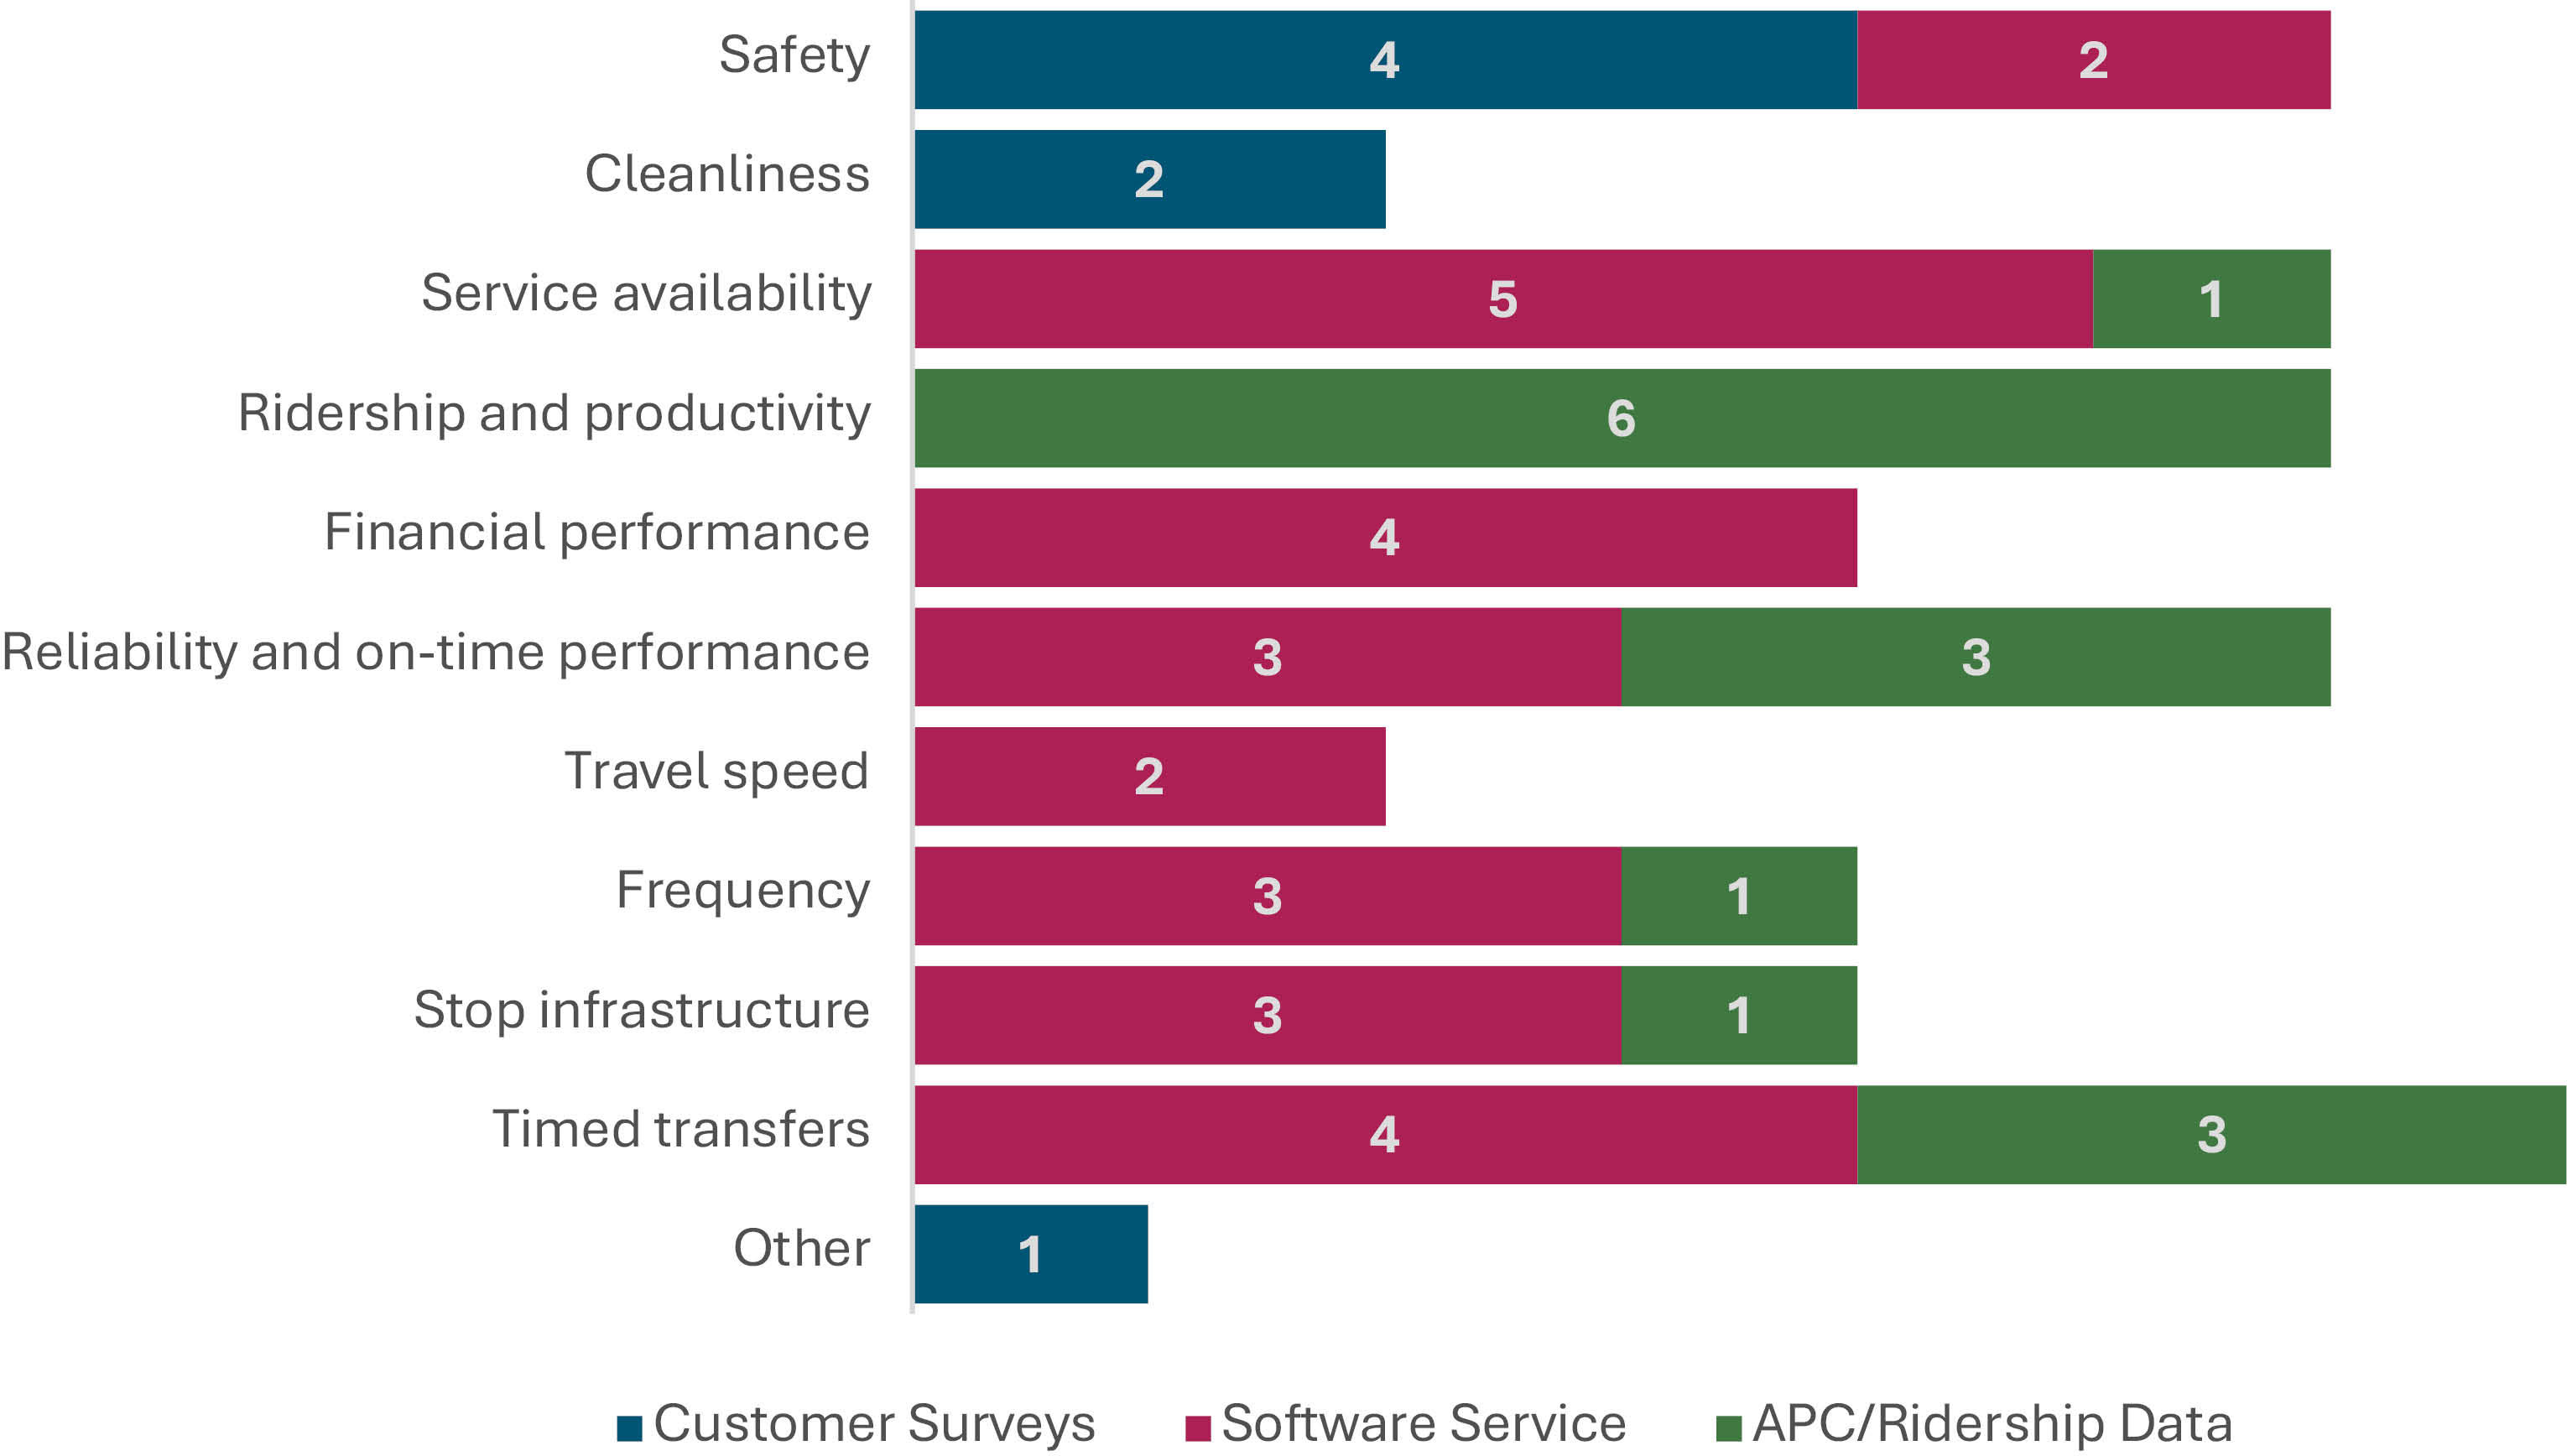
Long Description.
The graph has no horizontal axis. The vertical axis shows eleven components. Each bar consists of three sections labeled customer surveys, software service, and APC or ridership data. The data given in the graph are as follows: Safety: 4, 2, 0. Timed transfers: 2, 0, 0. Service availability: 0, 5, 1. Ridership and productivity: 0, 0, 6. Financial performance: 0, 4, 0. Reliability and on-time performance: 0, 3, 3. Travel speed: 0, 2, 0. Frequency: 0, 3, 1. Stop infrastructure: 0, 3, 1. Timed transfers: 0, 4, 3. Other: 1, 0, 0.
Safety Initiatives
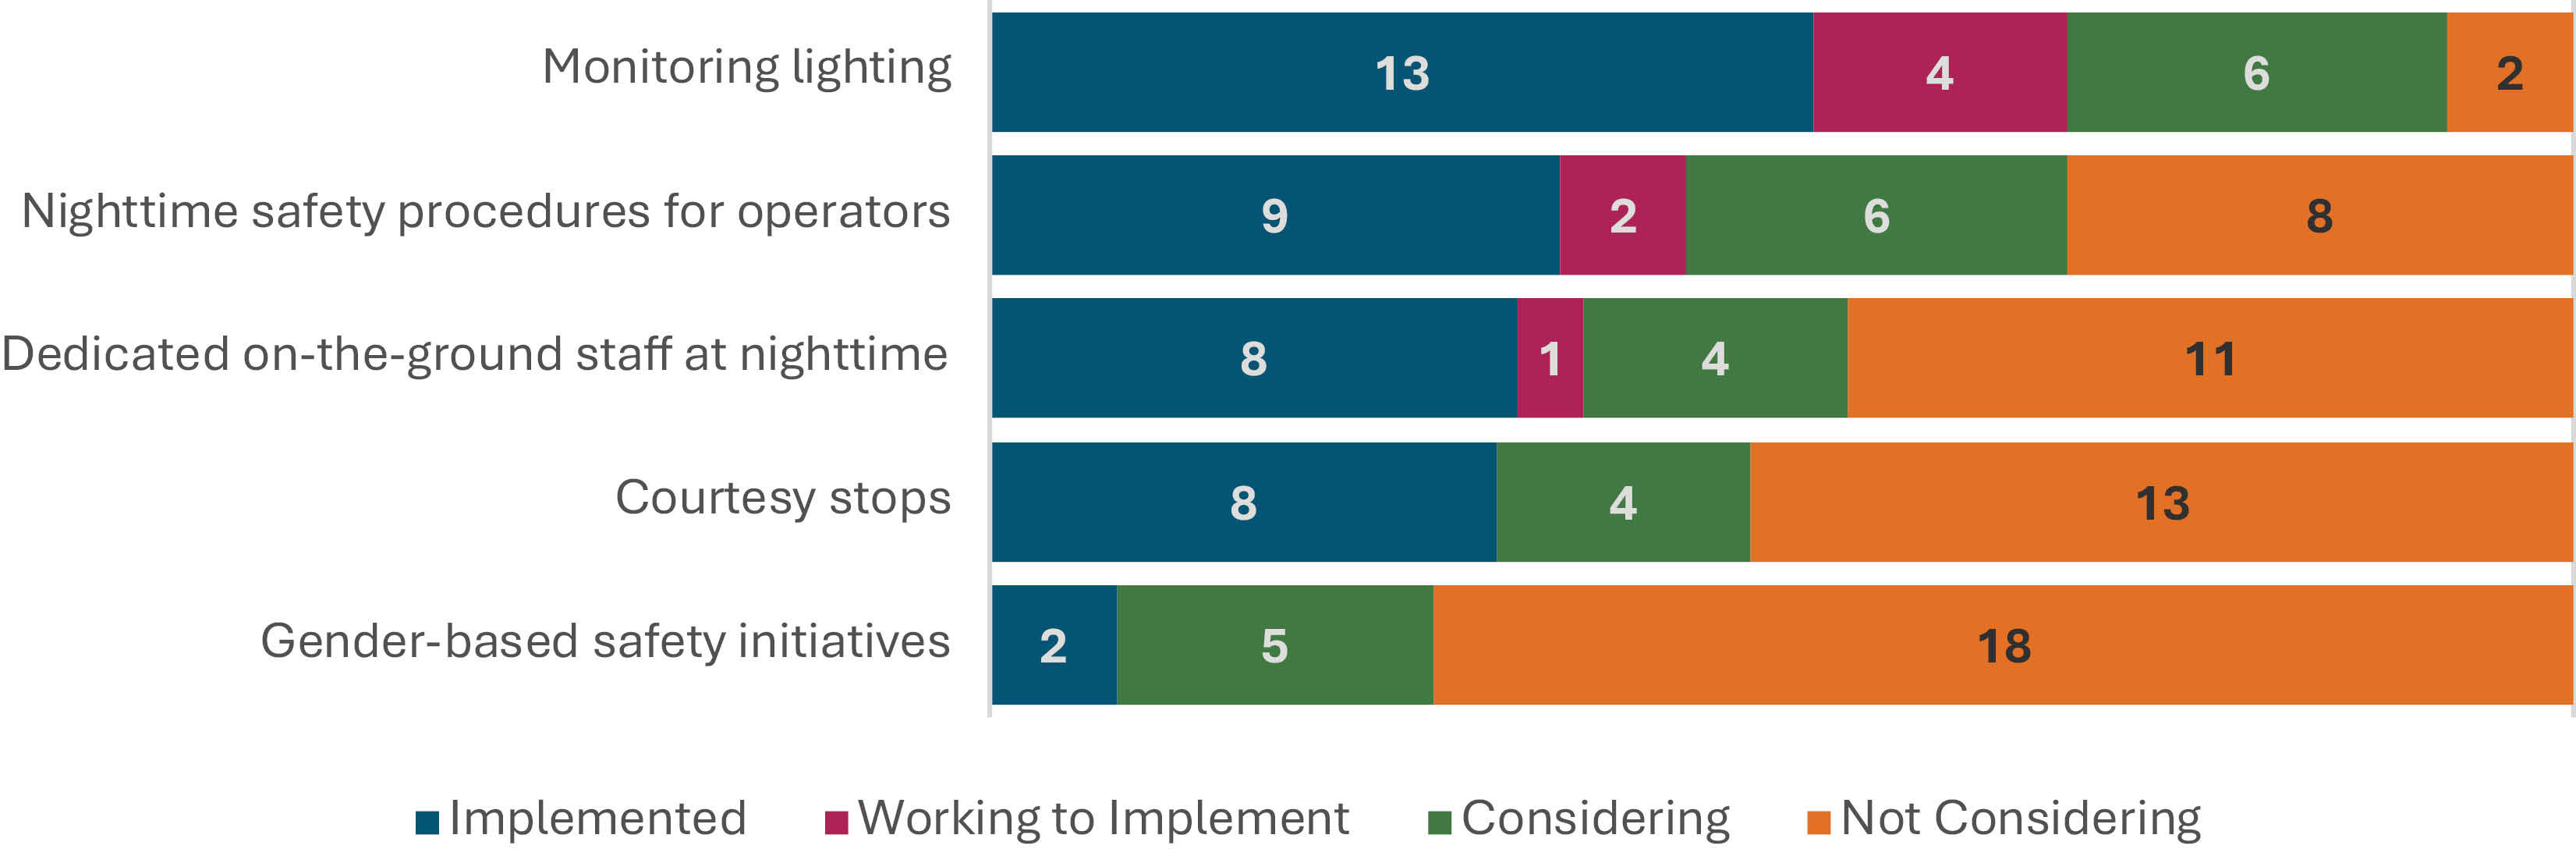
According to the literature and survey results, safety is a vital consideration of nighttime transit ridership. Respondents answered a question regarding safety initiatives their agencies deploy for nighttime service. The results in Figure 26 show that many agencies monitor lighting as a way of increasing and maintaining safety at night; 13 agencies (52 percent) have implemented a means of monitoring lighting, and four agencies (16 percent) are working to implement a way to track it. Lane Transit District monitors their lighting and runs a “Be Safe Be Seen” campaign to inform riders on how to improve their visibility for bus operators at night.
Some agencies have implemented nighttime safety procedures for operators (nine agencies, or 36 percent), on-the-ground staff (eight agencies, or 32 percent), and courtesy stops on bus routes (eight agencies, or 32 percent). Agencies added that their on-the-ground staff includes supervisors, public safety officers, staff on duty, and end-of-line staff. CapMetro stated that its service is monitored 24/7 via a control center, and bus vehicles are equipped with cameras.
Few agencies are considering gender-based safety initiatives. Two agencies (8 percent) stated they had implemented gender-based safety initiatives, and five (20 percent) are considering them. One of these agencies, SFMTA, launched an initiative to collect data on the perception of
Long Description.
The graph has no horizontal axis. The vertical axis shows five components. Each bar consists of four sections labeled Implemented, working to implement, considering, and not considering. The data given in the graph are as follows: Monitoring lighting: 13, 4, 6, 2. Nighttime safety procedures for operators: 9, 2, 6, 8. Dedicated on-the-ground staff at nighttime: 8, 1, 4, 11. Courtesy stops: 8, 0, 4, 13. Gender-based safety initiatives: 2, 0, 5, 18.
safety by gender, partnerships with community organizations, and expanded options on their feedback form and 311 menu options to include gender-based harassment complaints.
Key Takeaways
The transit agency survey on nighttime transit services revealed insights across several key nighttime transit issues. Nighttime transit plays a critical role in serving shift and service workers, with 24 agencies (96 percent) emphasizing its importance for these groups. Additionally, the survey identified the healthcare and hospitality sectors as crucial industries supported by nighttime transit, with 21 agencies (84 percent) recognizing the importance of providing service to the healthcare sector and 20 agencies (80 percent) to the hospitality sector.
The scope of nighttime transit services varies among agencies, with a range of service types being implemented. Most agencies provide nighttime fixed-route services, while fewer provide flexible or on-demand microtransit services. Notably, microtransit have garnered significant interest, with 10 agencies (40 percent) without existing microtransit service considering or actively working to implement such services. The survey also revealed a correlation between agency size and the type of nighttime services offered, with larger agencies more likely to provide complete 24-hour services and smaller agencies favoring microtransit options.
In terms of planning activities, the most common internal practice is establishing nighttime service guidelines, implemented by 11 agencies (44 percent). However, agencies face significant challenges, particularly workforce shortages and safety concerns. These issues were highlighted by 17 agencies (68 percent) and 20 agencies (80 percent), respectively. While few agencies have developed planning or funding partnerships, those that have typically collaborated with universities and government entities to support nighttime services. Resource allocation for nighttime services is generally not prioritized over daytime services, and a minority of agencies report that operator shortages impact nighttime services more significantly than daytime services.
Performance monitoring is equally important for both daytime and nighttime services, except when it comes to safety, timed transfers, and stop infrastructure. Agencies utilize customer surveys and software services to measure various performance metrics, including safety, cleanliness, service availability, financial performance, and timed transfers. Although financial performance and travel speed are considered less critical for nighttime monitoring, agencies emphasize the importance of tracking safety and ensuring timely transfers to minimize wait times for riders during nighttime.
Safety initiatives are a vital aspect of nighttime transit. Monitoring lighting is the most implemented safety measure, with over half of agencies tracking it to enhance safety at night. Agencies also employ various safety procedures, such as courtesy stops and 24/7 service monitoring via control centers. While gender-based safety initiatives are less common, some agencies are beginning to consider them, aiming to address safety concerns specific to different rider demographics.
These findings provide a comprehensive overview of current practices, challenges, and innovations in nighttime transit services. Along with the literature review findings, the survey results highlight key topics for further examination through case examples, including safety, operational solutions, resource allocation, ridership patterns and recovery, and the development of partnerships. These areas are crucial for highlighting notable initiatives to support nighttime ridership and understanding how to enhance nighttime transit services and better support nighttime riders and the economy.


