Practices for Collecting, Managing, and Using Light Detection and Ranging Data (2025)
Chapter: 5 Survey Results
CHAPTER 5
Survey Results
The ongoing advancement of Lidar technology has revolutionized the planning, construction, and maintenance of transportation infrastructure. Lidar captures high-resolution 3D data for geospatial analysis in transportation projects. Despite its capabilities, the integration and utilization of Lidar data varies significantly across different jurisdictions and applications. This chapter delves into the current state of Lidar adoption across the United States DOTs, presenting the comprehensive responses gathered from a nationwide questionnaire given to state DOTs.
The questionnaire documented the diverse practices related to the technical, administrative, and policy aspects of managing and using Lidar data within state DOTs. Through this exploration, the synthesis highlights existing knowledge gaps and pinpoints opportunities for future investigation that could provide solutions to overcome barriers preventing unified approaches for collecting, processing, and managing Lidar data across the DOTs.
Overview of Survey Methodology and Participation
To ensure a thorough understanding of the current practices and challenges associated with the use of Lidar technology across state DOTs, a detailed questionnaire was developed and distributed. The full questionnaire is provided in Appendix A. This section outlines the methodology employed, detailing the design and creation of the questionnaire, and the methods for its distribution and collection.
Questionnaire Design
The design of the questionnaire was an important step to ensure that the survey effectively captured the diverse and comprehensive practices associated with the use of Lidar technology across state DOTs.
The questionnaire was structured to include a variety of question types such as single response, multiple options, multiple-choice, and slider bars to gather qualitative and quantitative data. Several questions included “other” options to provide some flexibility to the respondents. The questions were carefully crafted to elicit detailed information on the current use, challenges, and future needs related to Lidar technology within transportation projects. To help inform the overall impact of Lidar technology on project outcomes, key areas covered included the adoption and integration of Lidar systems, applications, data life cycle, data mining, data management and governance practices, QA practices, policies and standards, and ROI. Questions were also included to help identify potential innovative case examples.
Qualtrics was chosen for its robust functionality that supports complex data collection strategies. Additionally, logic was employed to filter later questions based on the sensors and applications
indicated by the DOTs. Qualtrics also provided tools for data analysis and real-time tracking of response rates, helping manage the survey process and ensuring high-quality and complete data collection.
To reach a broad audience across all state DOTs, including the District of Columbia, the research team identified appropriate contacts in the survey, photogrammetry, GIS, or information technology divisions. A similar review of personnel web profiles was implemented to ensure the research team found the best candidate respondent within that DOT.
To address small rounding errors in the charts and tables to ensure total percentages sum to 100%, the largest values were adjusted slightly by adding or removing the rounding error. As a result, the percentage for a specific number of state DOTs in one chart may differ slightly from another chart because of this correction process.
Response Rate and Participant Demographics
Understanding the response rate and the demographics of the survey participants is important to assess the representativeness and validity of the findings. This section provides an analysis of the participation levels across the state DOTs and the demographic breakdown of the respondents.
The survey achieved a response rate of 100%, with participation from all targeted state DOTs, including the District of Columbia (N = 51). Detailed response information is provided in Appendix B.
The demographic data of the survey participants varied widely, reflecting the diverse roles within the DOT that interact with Lidar technology. Most respondents had a management role within their division (58.8%) while the other respondents consisted of surveyors (21.6%), engineers (11.8%), and technicians (7.8%). Respondents included representatives from surveying and photogrammetry (56.9%), information technology (13.7%), planning (5.9%), design (5.9%), maintenance and operations (3.9%), aviation (3.9%), engineering (3.9%), asset management (2.0%), construction (2.0%), and traffic (2.0%).
This diversity of experience enriches the survey results, providing insights from multiple perspectives within the transportation sector. The broad spectrum of participants not only strengthens the validity of the survey results but also highlights the widespread integration of Lidar technology in different facets of transportation projects. The varied demographic data helps in understanding how Lidar data is perceived and used across different levels of responsibility and expertise within DOTs.
Use of Lidar Data Within DOTs
This section explores the deployment and integration of Lidar technology across various state DOTs. It covers the history of their experience and level of integration, current usage frequency, and types of platforms.
Historical Adoption and Integration of Lidar
This analysis provides insights into the broader patterns and specific nuances of Lidar use by examining historical adoption trends, the extent of technological integration into daily workflows, and operational impacts. Each subsequent subsection delves into different aspects of Lidar application, starting with an overview of its historical adoption and reasons for its integration
or non-use within DOTs, setting the stage for a deeper understanding of the technology’s role in supporting modern transportation infrastructure.
Adoption Timeline
The adoption of Lidar technology by state DOTs across the United States exhibits a significant variation in timeline, reflecting differing levels of technology integration and infrastructure development. Analysis of the survey responses reveals a diverse range of adoption timelines, which have been categorized into three distinct periods: over a decade ago, within the last 10 years, and within the last 5 years. Figure 4 visually illustrates the distribution of these responses, providing a clear overview of the historical perspective on Lidar adoption across the DOTs. This figure will help in understanding the timeline of adoption and the factors influencing the integration of Lidar technology at different stages.
A considerable number (49.1%) of DOTs reported that they have been utilizing Lidar data for over 10 years, indicating early adoption and integration of this technology in their operations as well as sustained usage. Conversely, several state DOTs have adopted Lidar technology more recently, within the last 10 years (25.5%). The most recent adopters (17.6%) are those who have started using Lidar within the last 5 years. This recent adoption reflects the ongoing expansion of Lidar applications and their increasing importance in modern transportation projects.
Non-usage and Reasons
Despite the widespread adoption of Lidar technology among many state DOTs, there remains a subset (7.8%) of DOTs that indicated they are not currently using Lidar data: Arizona, Nebraska,
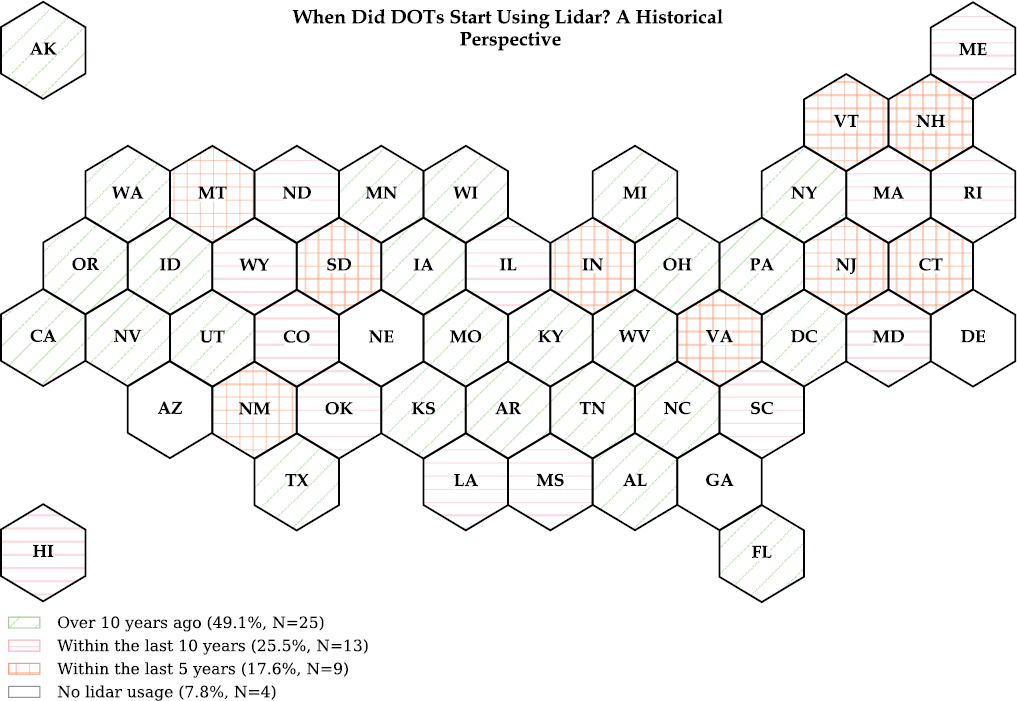
Georgia, and Delaware. These state DOTs were not asked the remaining questions as they were not applicable. They were simply asked the reasons for not using Lidar, and only Arizona DOT responded to that question. Arizona DOT cited limited experience, training, and capabilities; insufficient information technology (IT) infrastructure (data storage, network latency, software tools, etc.); other methods providing higher ROI; and the effort required to extract information from Lidar data as their reasons for not using the technology. They also indicated that they had used the technology almost a decade ago and felt it did not meet their needs for asset management.
In follow-up conversations with additional personnel in Arizona DOT, they indicated that they had previously led a pooled fund research study at the University of Arizona to map existing rock cut slopes using Lidar for kinematic analysis of rockfall stability (Kemeny 2015). Lidar was used to model a large boulder alongside State Road 88 near Tortilla Flat to evaluate the volume and rockfall parameters for safe removal. Arizona DOT indicated that they may still use Lidar for the roadway asset management program to identify roadway features such as signage and guardrail, though this work is no longer done in-house. Lidar has also been infrequently used for surveying purposes; however, high-resolution photogrammetry has largely replaced it for project surveying. Hence, to the best of their knowledge, Arizona DOT is not currently using Lidar for any applications, except potentially for outsourced roadway asset management, where contractors may be using Lidar or photogrammetry data for the work.
For the other DOTs, some limited Lidar usage in other divisions was uncovered through additional conversations or literature searches. In follow-up conversations with personnel from Georgia DOT, they indicated that they are currently exploring potential usages of Lidar but the actual usage is currently limited. Airborne Lidar data that may sometimes be used by the DOT are currently managed by other state agencies rather than the DOT. Georgia DOT provides a map catalog of projects using Lidar data (Georgia DOT, n.d.). The GDOT Automated Survey Manual (Georgia DOT 2020) also contains a section with guidelines for the use of Lidar on projects, including specific guidance for UAS-based Lidar. An additional literature search found examples of Lidar usage within Nebraska DOT that the respondent was not aware of, including an airborne Lidar mapping guideline (Nebraska DOT 2017) and a recent request for qualifications (Nebraska DOT 2022) for aerial photogrammetric and Lidar services. Likewise, Delaware DOT shows some limited usages of Lidar, including scanning to support an archaeological investigation of US Route 301 (Delaware DOT 2013), Lidar-based contour mapping for site assessment in the Erosion and Sediment Control Design Guide (Delaware DOT 2020), and Lidar measurements for speed control systems (Delaware DOT 2022).
Level of Integration in DOT Workflows
The integration of Lidar data into the workflows of state DOTs varies significantly (Figure 5). Responses to the questionnaire reveal a spectrum of integration levels, from full incorporation across multiple departments to rare usage or a lack of a centralized plan. This subsection explores the different degrees of Lidar integration within DOT operations, highlighting the diversity in how this technology is employed in current operations.
Several (17.6%) state DOTs report that Lidar technology is fully integrated into their workflows and utilized by various departments for a wide range of applications. A considerable number (37.3%) of DOTs indicate a mixed level of integration where some departments have fully embraced Lidar technology while others use it periodically. Other state DOTs (27.5%) report scattered usage with no centralized oversight or plan, highlighting a more fragmented approach to Lidar integration. In Vermont (2.0%), Lidar usage is described as rare, indicating minimal adoption within the state’s transportation projects. A few state DOTs (7.8%) categorized their usage as “Other,” suggesting unique or unspecified patterns of Lidar integration.
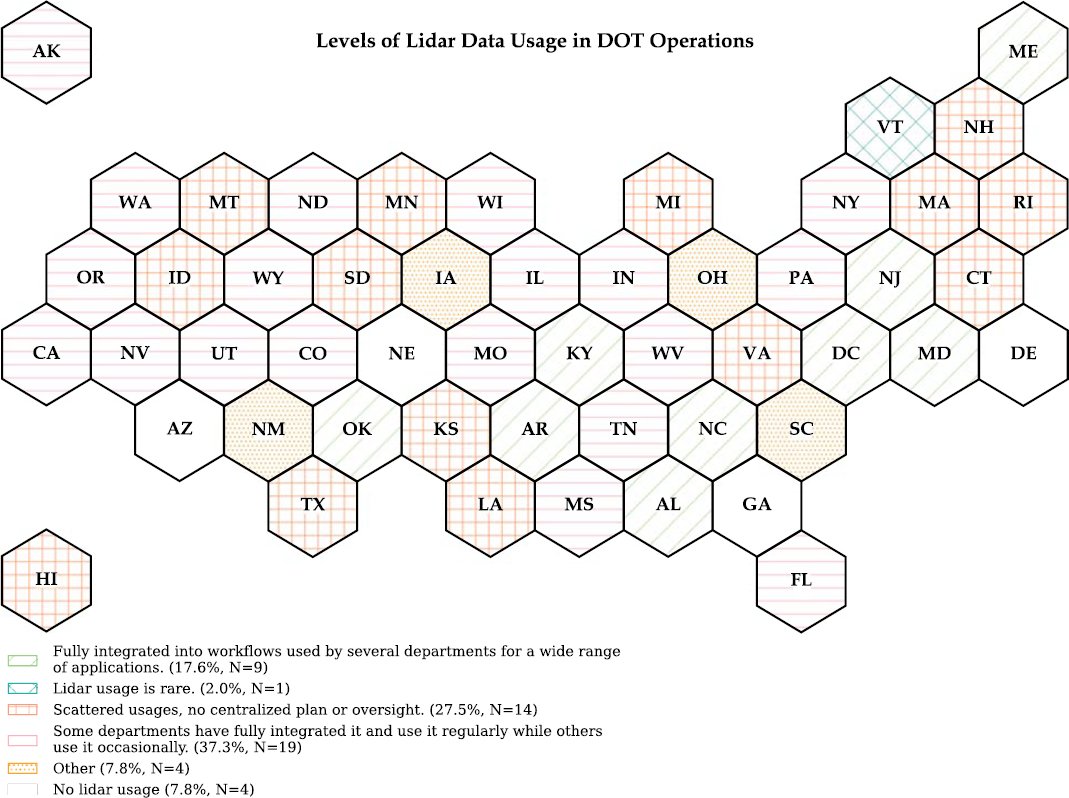
This varied landscape of Lidar integration within DOT workflows demonstrates the adaptive and evolving nature of technology adoption in public sector infrastructure projects. Understanding these patterns helps in identifying effective protocols and areas where further support or resources could enhance the effectiveness of Lidar technology in state transportation projects.
Frequency and Platform Utilization
This section explores the frequency with which various Lidar platforms are utilized across state DOTs and the specific types of platforms that are most commonly employed. Understanding the usage patterns of different Lidar platforms provides insights into how DOTs are integrating this technology into their operational workflows.
Frequency of Usage
The frequency with which various Lidar platforms are utilized by state DOTs showcases a diverse landscape of technology adoption, reflecting tailored approaches to integrating these systems based on specific operational needs and project objectives.
“Routine Use” demonstrates a robust integration of Lidar into their routine operations, using multiple platforms consistently across a wide array of projects.
“Occasional Use” shows the utilization of a variety of Lidar platforms for occasional projects where high-resolution data and precision are needed.
“Research or Pilot Projects” means using Lidar technology, particularly newer or less traditional platforms like pocket Lidar or certain UAS-mounted systems, in the context of research or pilot projects. This usage suggests that while Lidar holds potential for broad-based applications, its adoption in some regions is still in the experimental or evaluative stages, aiming to validate the technology’s effectiveness and operational viability before wider rollout.
This varying frequency of usage across different state DOTs and Lidar platforms illustrates a nuanced integration landscape, where technological uptake is closely aligned with regional priorities, project requirements, and the evolving capabilities of Lidar technology.
Lidar Platforms
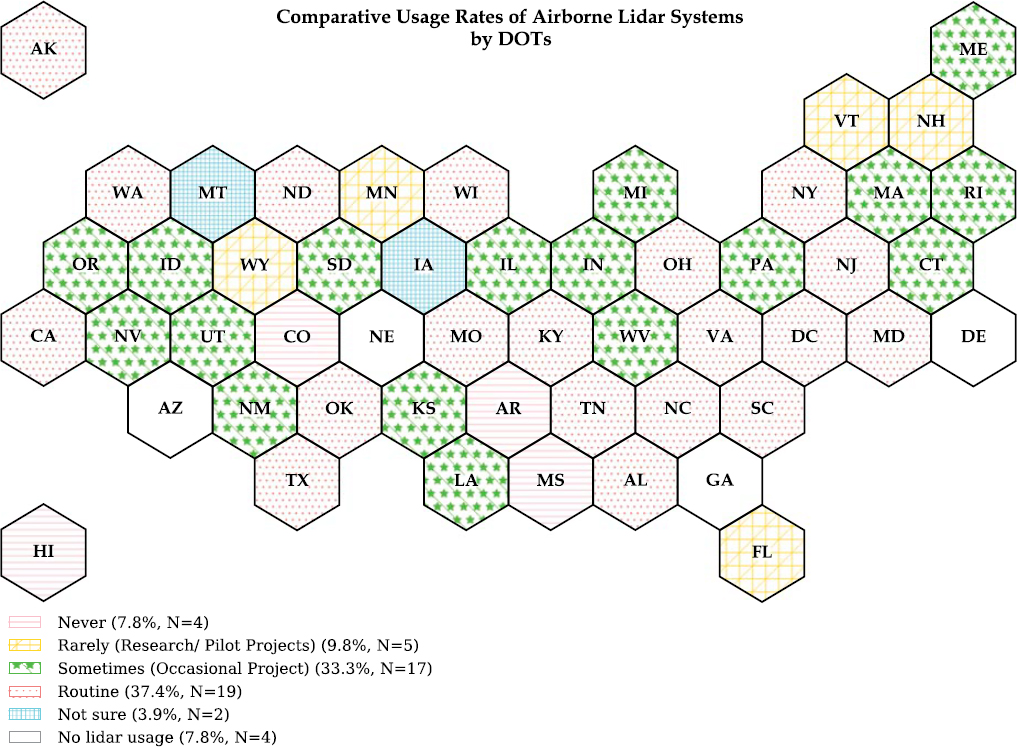
State DOTs employ a variety of Lidar platforms based on their specific needs and project types. Table 6 summarizes the adoption rates of each platform. Overall technologies such as airborne, terrestrial, and mobile Lidar show high adoption rates. Newer technologies such as UAS Lidar and pocket Lidar show growing levels of adoption.
Airborne
Airborne Lidar technology continues to be an integral tool for state DOTs across the United States, with usage ranging from routine applications to more sporadic or research-oriented projects (Figure 6). The varied adoption rates illustrate the diverse strategies associated with integrating this technology into transportation workflows. Many states indicated routine (37.4%) or occasional (33.3%) usage of airborne Lidar data.
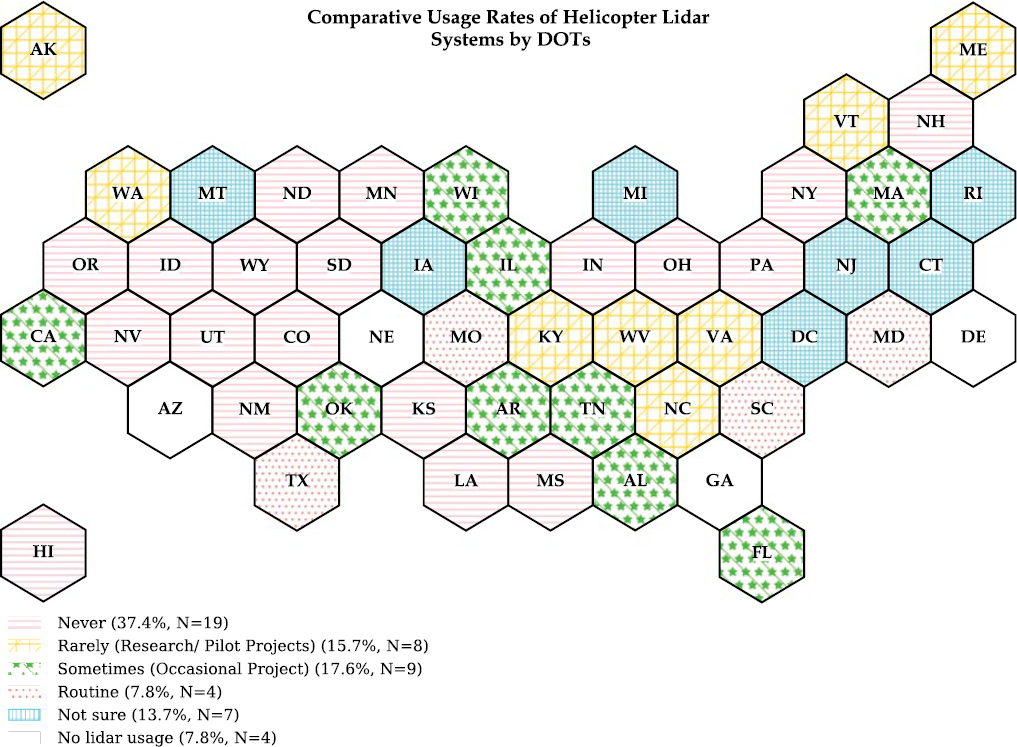
Helicopter
Helicopter-mounted Lidar systems (Figure 7) offer a specialized solution for linear corridor mapping and similar type projects given the ability to efficiently fly closer to the ground and obtain higher detail. Helicopter Lidar shows a lower level of adoption with 37.4% of DOTs indicating they never use helicopter Lidar and 15.7% specifying rare usage, in addition to the 7.8% not using Lidar.
Terrestrial (Tripod) Lidar
Terrestrial Lidar systems, particularly those mounted on tripods, are extensively used across various state DOTs for a range of precise surveying tasks (Figure 8). This technology is capable of
Table 6. Level of usage for different Lidar platforms (N = 51).
| Platform | Routine | Sometimes (Occasional Project) | Rarely (Research/Pilot Projects) | Never /No Lidar Usage* | Not Sure |
|---|---|---|---|---|---|
| Airborne | 37.4% | 33.3% | 9.8% | 15.6% | 3.9% |
| Helicopter | 7.8% | 17.6% | 15.7% | 45.2% | 13.7% |
| Terrestrial (Tripod) | 51.0% | 31.4% | 0.0% | 9.8% | 7.8% |
| Mobile | 43.2% | 39.2% | 3.9% | 11.7% | 2.0% |
| UAS | 21.6% | 35.3% | 23.5% | 17.6% | 2.0% |
| 2.0% | 0.0% | 19.6% | 62.6% | 15.7% | |
| Other | 0.0% | 0.0% | 2.0% | 11.7% | 86.3% |
*Includes the 7.8% of DOTs that are not using Lidar data.
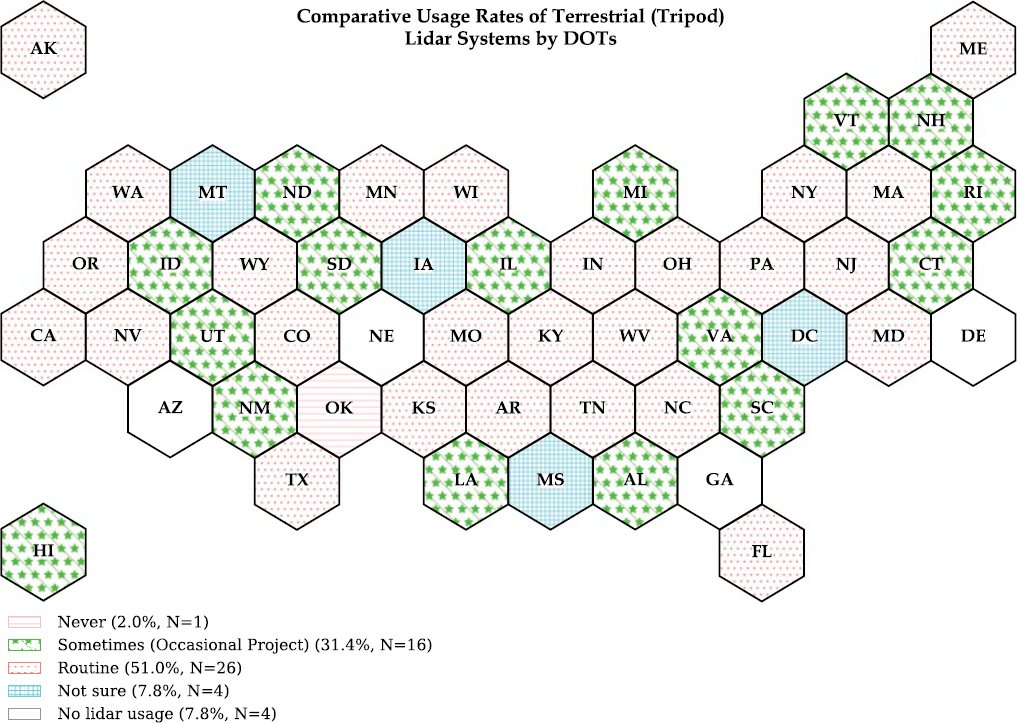
high accuracy and reliability in capturing detailed topographical data for infrastructure projects. DOTs indicated high levels of usage (51.0% routine and 31.4% occasional) of terrestrial Lidar.
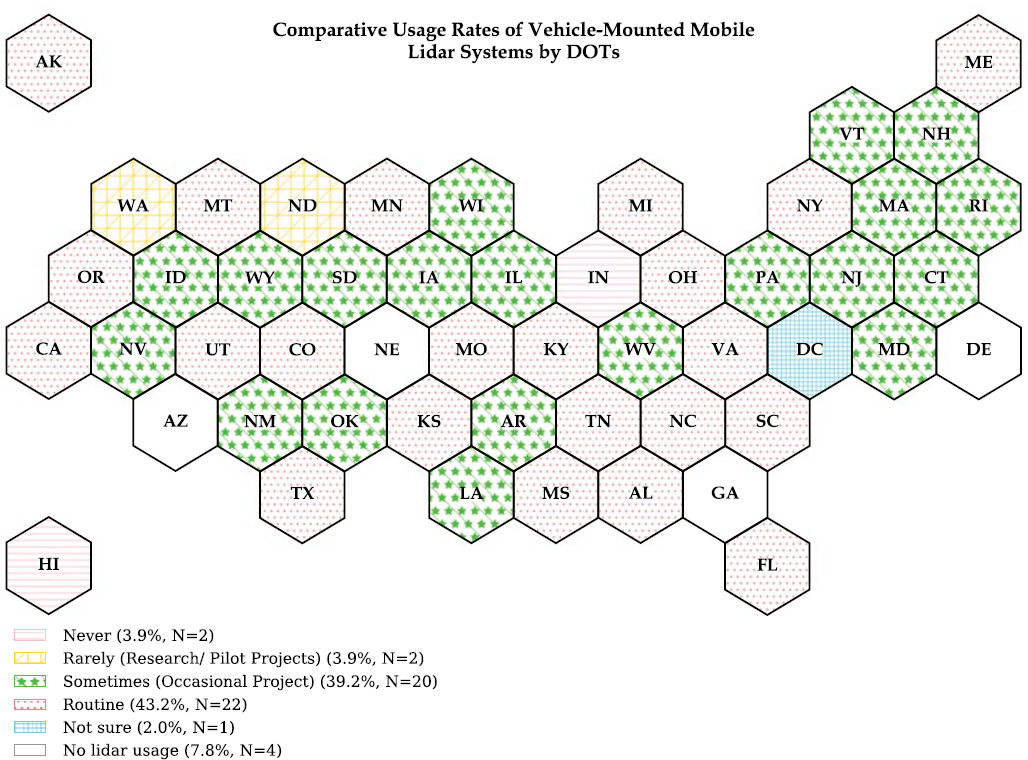
Mobile (Vehicle Mounted) Lidar
Vehicle-mounted mobile Lidar systems (Figure 9) are widely utilized by state DOTs for their capacity to efficiently collect detailed data on road conditions and infrastructure while in motion. This technology is especially advantageous for large-scale projects and routine monitoring because of its operational efficiency and safety. DOTs indicated high levels of usage (43.2% routine and 39.2% occasional) of mobile Lidar technology. Notably, Oregon DOT was the first state to purchase a mobile Lidar system in 2013 and recently purchased their third-generation mobile scanner.
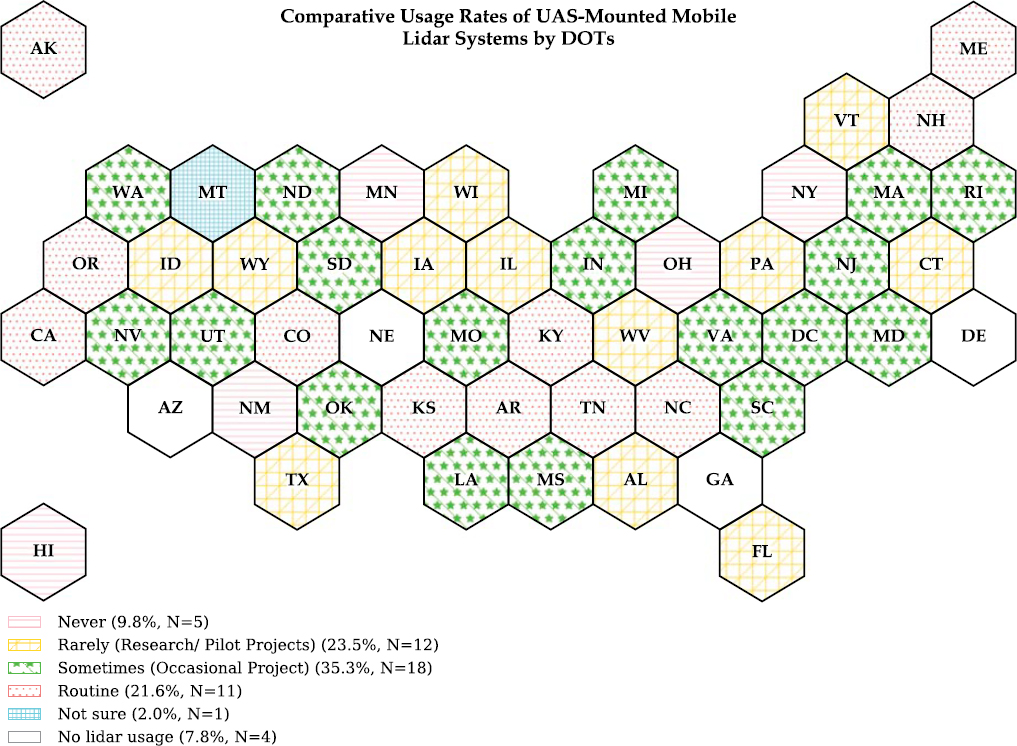
UAS-Mounted Lidar
UAS-mounted mobile Lidar systems (Figure 10) are increasingly being adopted by state DOTs because of their flexibility and ability to access difficult terrains and structures, making them ideal for targeted surveys and specific project needs. However, it should be noted that although the use of UAS technology for photogrammetric mapping, traffic monitoring, and other works is prolific across DOTs, the integration of Lidar technology on UAS platforms is not as widespread (21.6% routine and 35.3% sometimes) because of payload constraints and regulatory challenges. Nevertheless, as described in the literature review, the potential for precise data collection in hard-to-reach areas continues to drive interest and innovation in UAS-mounted Lidar applications.
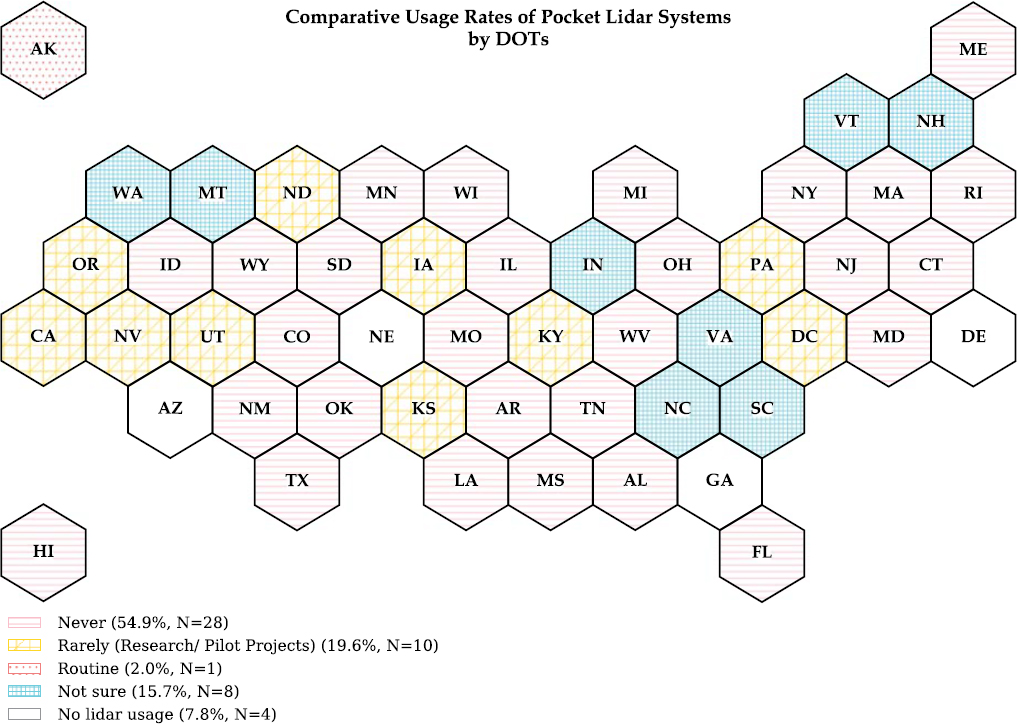
Pocket Lidar
Pocket Lidar systems (Figure 11), known for their portability and ease of use in field applications, are well suited for the inspection of small areas and quantity calculations. They show limited adoption across state DOTs, with many (54.9%) state DOTs reporting that they never use this technology. This pattern reflects the newness of the technology with limited use cases demonstrating their capabilities as well as the niche application of pocket Lidar.
Other Specified Systems
The questionnaire data indicates a generally low level of specificity and certainty among state DOTs regarding the usage of alternative or less common Lidar systems, which are categorized as “Other Lidar Systems.” Most state DOTs responded with “Not Sure” or did not provide any details, suggesting a limited deployment of non-standard Lidar technologies or a lack of comprehensive tracking of such technologies within their operations. Notable exceptions include Idaho, which uses fixed Lidar systems in salt sheds to manage inventory—a specific application demonstrating the utility of Lidar in non-traditional settings. Ohio also mentions a unique approach, noting that while they own certain Lidar technologies, they do not specify the methods for data collection to consultants, focusing instead on performance-based specifications. This variability in responses highlights the exploratory stage of adopting less conventional Lidar systems within DOTs, with a few state DOTs pioneering specific applications that may not yet be widespread.
External Dependency for Lidar Data Collection
As state DOTs increasingly incorporate Lidar technology into their operations, many rely on external resources to meet their data collection and processing needs (Table 7). This section delves into the extent of external dependency in the utilization of Lidar data, focusing on three key aspects: the outsourcing of data collection, the outsourcing of data processing, and the use of public domain Lidar data.
As can be seen from Table 7, nearly all state DOTs (95.0%) report some level of outsourcing for airborne Lidar data collection, with 87.5% outsourcing more than half. Furthermore, the median and mode values of 100% indicate that most DOTs have no in-house airborne Lidar collection capabilities. Similarly, 90.5% of the DOTs using helicopter Lidar outsource the collection, with 81.0% outsourcing more than half. This reflects the specialized nature of helicopter Lidar operations, which often require specific skills and equipment. In addition, mobile Lidar shows a strong external dependency, with 92.9% of state DOTs outsourcing at least some mobile Lidar tasks and 83.3% outsourcing over half of these operations.
Outsourcing UAS Lidar data collection is slightly less frequent compared with mobile and airborne, yet still significant at 84.6% for some level of outsourcing and 56.4% for major dependency (outsourcing ≥ 50%). However, the lower average (50.5%) and median (50.5%) percentage of outsourcing of UAS Lidar shows the tendency of state DOTs to use in-house equipment and resources for data collection. Similarly, the outsourcing percentage drops for terrestrial systems, with 80.0% of state DOTs outsourcing to some degree and only 52.5% outsourcing more than half. Pocket Lidar shows the least external dependency, with only 54.5% of state DOTs outsourcing at all, and a mere 27.3% heavily relying on external resources. The standard deviations reflect variability in the degree of outsourcing, with higher values in UAS and pocket Lidar, suggesting a wider range of practices among the state DOTs.
Data Processing Outsourcing
State DOTs demonstrate varying degrees of reliance on external firms for processing Lidar data, reflecting diverse operational and financial strategies across the state DOTs. The data underscores a notable trend toward outsourcing, with several state DOTs relying heavily on external expertise to manage the complexities of Lidar data processing.
Several state DOTs (11.8%) have fully outsourced their Lidar data processing, while only 3.9% of state DOTs are not outsourcing their Lidar data processing. Overall, 99.2% of state DOTs use some level of outsourcing and 76.5% have a major dependency on outsourcing (outsourcing ≥ 50%).
Table 7. Level of outsourcing for Lidar data collection for those utilizing each platform.
| Platform | Airborne | Helicopter | Terrestrial | Mobile | UAS | |
|---|---|---|---|---|---|---|
| % outsourcing > 0% | 95.0% | 90.5% | 80.0% | 92.9% | 84.6% | 54.5% |
| % outsourcing >= 50% | 87.5% | 81.0% | 52.5% | 83.3% | 56.4% | 27.3% |
| Average | 89.5% | 82.9% | 43.5% | 79.5% | 50.5% | 25.5% |
| Median | 100.0% | 100.0% | 50.0% | 100.0% | 50.0% | 10.0% |
| Mode | 100.0% | 100.0% | 0.0% | 100.0% | 100.0% | 0.0% |
| Standard Deviation | 28.0% | 36.6% | 35.5% | 33.6% | 39.9% | 39.6% |
| Count | 40 | 21 | 40 | 42 | 39 | 11 |
NOTE: Percentages based on DOTs that indicated they are using each specific platform. Values ranged from 0–100% for all platforms.
The average (64.9%) and median (70%) percentage of state DOTs show their tendency to outsource Lidar data processing.
Use of Public Domain Lidar Data
The reliance on public domain repositories for Lidar data among state DOTs showcases a broad spectrum of integration, with several state DOTs incorporating substantial amounts of publicly available data into their projects, while others utilize these resources sparingly. Notably, 27.5% of state DOTs download 10% of their Lidar data from public domain repositories, making it the most common usage rate. Conversely, state DOTs like Montana (100%) and Alabama (80%) are at the higher end of the spectrum, demonstrating a significant reliance on public repositories. On average, state DOTs report downloading 27.2% of their Lidar data from these repositories. However, the usage distribution varies widely, with 78.4% of state DOTs using some amount of public domain Lidar data, but only 19.6% relying on it for 50% or more of their data needs, and the median usage rate stands at 20%.
Transition to 3D Workflow
The transition from 2D to 3D workflows in state DOTs showcases a spectrum of strategies and levels of integration, particularly concerning the application of Lidar technologies. These strategies range from specific project implementations to department-wide transitions.
- 15.7% of state DOTs have embarked on extensive, comprehensive transformations, reflecting a significant commitment to modernizing their operational frameworks fully.
- 25.5% of state DOTs have designated specific projects to spearhead their 3D workflow integration, serving as pilot initiatives for broader applications.
- 27.4% of state DOTs display a gradual adoption of 3D workflows with their project cycles and readiness.
- 9.8% of state DOTs selected “Other” and provided comments on their transition. Washington reports that their state-wide project development approach is now in 3D, integrating Lidar data into 3D terrains when available. Oklahoma uses bare-earth Lidar models, with ongoing considerations to utilize full Lidar point clouds. South Carolina notes that while contractors create 3D models for construction, the current DOT policy still adheres to 2D plans as the controlling documents for construction projects.
- Rhode Island (2.0%) indicated that there was no transition in place, with workflows being primarily 2D.
- 11.8% of respondents indicated they were not sure.
- The option “Utilizing High Definition Mapping Infrastructure (HDMI) or base maps for Autonomous Vehicles (AVs)” was not selected by any state DOT.
Staffing for Lidar Initiatives
The allocation of staff resources dedicated to Lidar efforts within DOTs demonstrates a broad spectrum of commitment and capacity across the state DOTs, reflecting their respective strategies and priorities in leveraging Lidar technology (see Figure 12):
- Extensive Staffing (6 or more dedicated personnel): 23.5% of state DOTs have invested heavily in their Lidar operations, signifying a robust engagement with the technology.
- Moderate Staffing (3–5 individuals, a small team): A common staffing level for Lidar efforts, seen in 39.3% of state DOTs.
- Limited Staffing (1–2 individuals): 21.6% of state DOTs operate with minimal personnel dedicated exclusively to Lidar efforts.
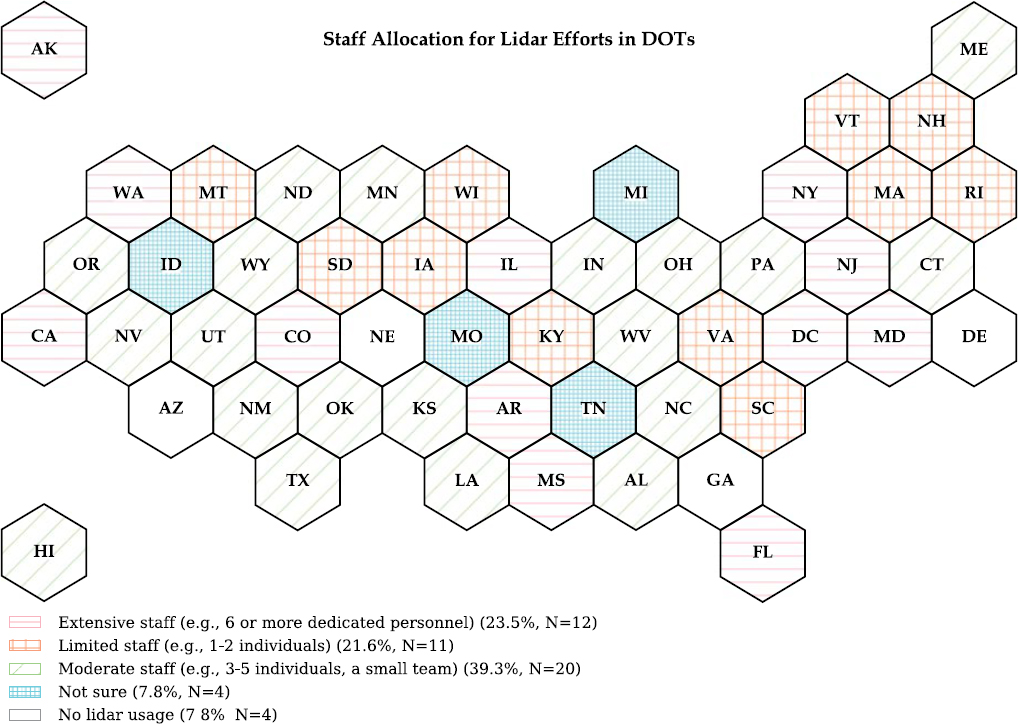
- Uncertainty or Unspecified Staffing: 7.8% of state DOTs have not specified their staffing levels.
The analysis of the provided data and corresponding plot reveals a clear correlation between the adoption period of Lidar technology by various state DOTs and their staff allocation toward Lidar efforts (Figure 13). States that adopted Lidar technology over 10 years ago generally show extensive staffing levels, indicating a deep integration and heavy reliance on this technology. Recent adopters within the last 10 years also demonstrate significant staff commitment, suggesting a rapid scaling of human resources to support Lidar operations. State DOTs that have adopted Lidar within the last 5 years display a varied range of staff allocations, reflecting diverse stages of integration. Notably, non-adopters or states with minimal use of Lidar report no or very limited staff dedicated to Lidar efforts.
Applications of Lidar Data
The utilization of Lidar technology across applications within DOTs is extensive (see Table 8). This section provides a detailed breakdown of how Lidar data is applied in specific operational contexts. Each application area discussed represents a unique way in which Lidar technology enhances the capabilities of transportation departments, from the design and construction of roadways to the management and safety enhancements of existing infrastructure. The following subsections delve into these applications, providing insights into the practical benefits and implementations of Lidar data in real-world scenarios.
Table 8 reveals that 78.5% of state DOTs utilize Lidar technology for roadway project design, either regularly (31.5%), routinely (29.4%), or sometimes (17.6%), meaning it is the most frequent
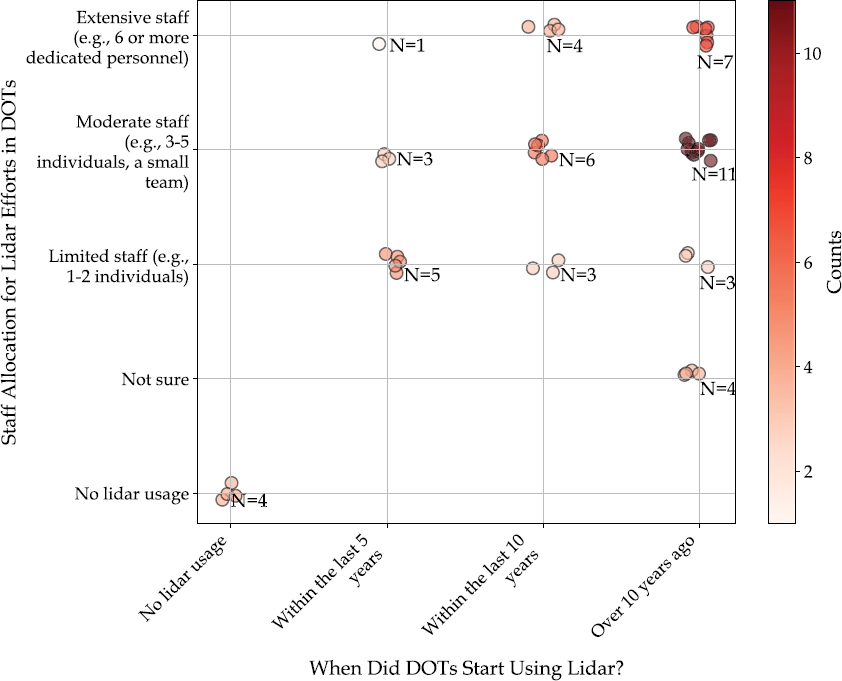
Table 8. Frequency of Lidar applications across state DOTs (N = 51).
| Application | Never | Rarely (Research/Pilot Projects) | Sometimes | Regularly (frequently but not constantly) | Routine (consistently and as part of standard practice) | No Response/No Usage | |
|---|---|---|---|---|---|---|---|
| Roadway Projects | Design | 3.9% | 7.8% | 17.6% | 31.5% | 29.4% | 9.8% |
| Environmental Analysis | 27.5% | 17.6% | 25.5% | 11.8% | 2.0% | 15.6% | |
| Construction Quality Control | 23.5% | 21.6% | 29.4% | 11.8% | 0.0% | 13.7% | |
| As-Builts | 33.3% | 21.6% | 21.6% | 5.9% | 2.0% | 15.6% | |
| Operations, Maintenance, and Safety | Bridge Inspection | 19.6% | 37.3% | 15.7% | 7.8% | 5.9% | 13.7% |
| Slope Stability | 15.7% | 15.7% | 23.6% | 19.6% | 7.8% | 17.6% | |
| Hydrological Studies | 21.6% | 7.8% | 23.6% | 21.6% | 9.8% | 15.6% | |
| Road Safety Analysis | 13.7% | 27.5% | 27.5% | 13.7% | 2.0% | 15.6% | |
| Highway Performance Monitoring System | 19.6% | 25.7% | 17.6% | 3.9% | 17.6% | 15.6% | |
| Mapping | 2.0% | 5.9% | 13.7% | 15.7% | 25.5% | 37.2% | |
| Asset Management | 15.7% | 15.7% | 19.6% | 21.6% | 11.8% | 15.6% | |
| Emergency Response | 29.4% | 19.6% | 25.5% | 5.9% | 2.0% | 17.6% | |
| Crash Reconstruction for Quick Clearance | 49.1% | 13.7% | 15.7% | 0.0% | 3.9% | 17.6% | |
application of Lidar technology among state DOTs. In contrast, only 19.6% of state DOTs use Lidar data for crash reconstruction for quick clearance of the roadway, with 3.9% doing so routinely and 15.7% sometimes. Almost 50% indicated that they have never used Lidar technology for this application, making it the least Lidar-utilized application among state DOTs. Furthermore, other common applications such as hydrological studies, mapping, asset management, and slope stability see approximately 50% of state DOTs employing Lidar technology to a substantial degree.
Roadway Projects
Lidar technology’s role in the design of roadway projects is highlighted by its routine usage in many state DOTs that consistently incorporate Lidar into their standard practices, with 29.4% of all surveyed DOTs doing so routinely. An additional 31.5% of DOTs use Lidar frequently but not constantly. In environmental analysis, Lidar technology is less commonly utilized on a routine basis, with only Missouri reporting consistent use. The broader adoption patterns reveal that 11.8% of state DOTs use Lidar regularly, and 25.5% do so occasionally, depending on specific project needs. Lidar’s application in construction QC shows a diverse level of use, with 11.8% of state DOTs employing it regularly. Occasional use was reported by 29.4% of state DOTs. 21.6% of state DOTs indicated rare uses such as research or pilot projects. Minnesota is noted for its routine use of Lidar in as-built creation. Only 5.9% employ it regularly and 21.6% occasionally. A few of the state DOTs utilize Lidar technology for other applications. For example, Alabama regularly uses Lidar technology for 3D visualization and animation.
Operations, Maintenance, and Safety Projects
Three state DOTs (5.9%) routinely use Lidar for bridge inspection practices, fully integrating it into their standard practices. Rare application is seen in many state DOTs (37.3%). Lidar’s application in slope stability is embraced to varying degrees, with 7.8% of state DOTs employing it routinely to monitor slopes while it is occasionally used in 23.6% of the state DOTs. In hydrological studies, 9.8% of state DOTs routinely incorporate Lidar, 21.6% of state DOTs use it frequently for precise water-related assessments, and 7.8% of state DOTs employ it rarely, mostly in research contexts.
Alaska is notable for the consistent use of Lidar in their safety projects, while 27.5% of state DOTs utilize Lidar data occasionally for these analyses. However, for several DOTs (27.5%), it is rarely used or not employed at all (13.7%). The application of Lidar for HPMS sees routine use in 17.6% of state DOTs. However, 25.7% of state DOTs use it sparingly, primarily for research or pilot projects. Lidar technology is rarely used for other applications of operation, maintenance, and safety by state DOTs.
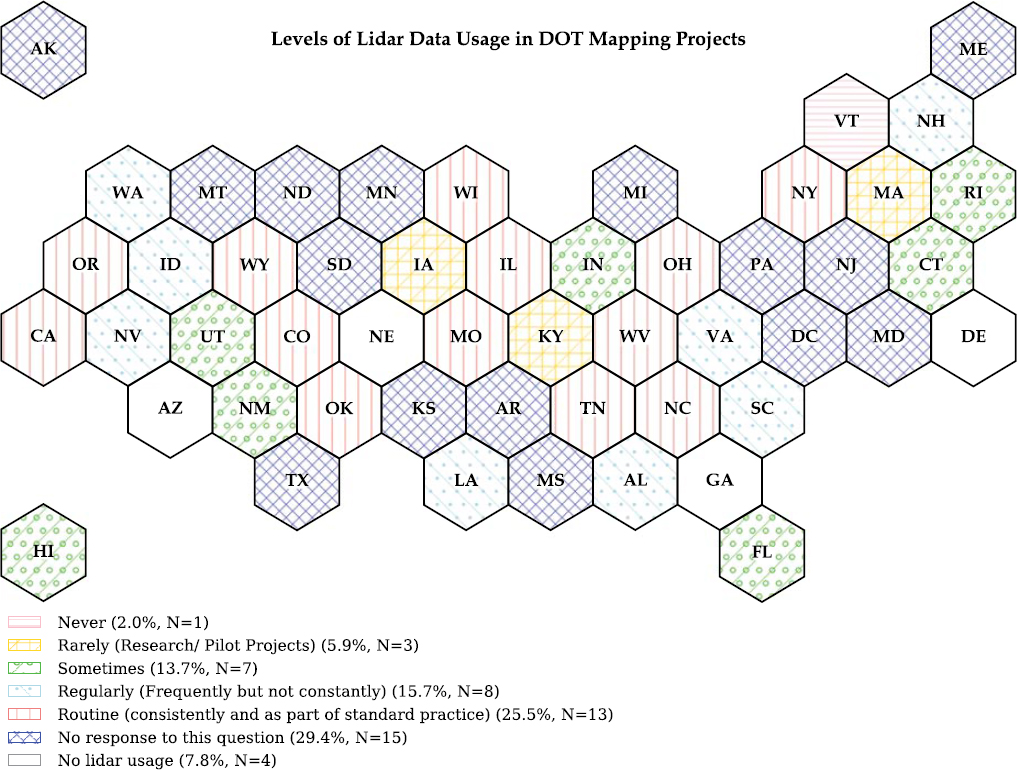
Mapping
As Table 8 and Figure 14 show, 25.5% of the state DOTs use Lidar as a routine part of their mapping practices, and 15.7% of state DOTs utilize it regularly. On the other end of the spectrum, Vermont has never applied Lidar data for mapping projects. Additionally, 13.7% of state DOTs use Lidar selectively for mapping.
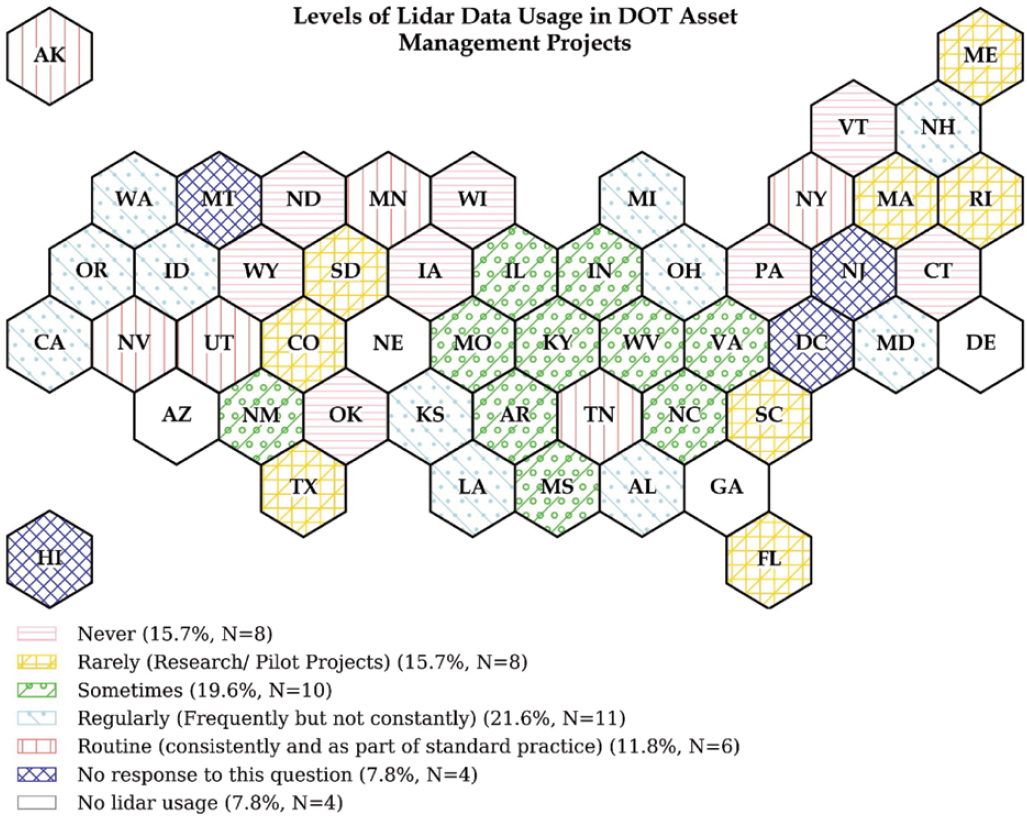
Asset Management
Alaska, Minnesota, Utah, New York, and Nevada show routine usage, accounting for 11.8% of DOTs that integrate Lidar into their regular operations (Figure 15). Meanwhile, 21.6% of state
DOTs also demonstrate significant but not constant use of Lidar to enhance asset management tasks. Conversely, 15.7% of state DOTs do not employ Lidar in asset management; they may utilize it for other applications.
Emergency Response
Lidar’s integration into emergency response measures is pivotal for rapid and effective crisis management across state DOTs (Figure 16). This technology can provide accurate, near real-time data during emergencies, aiding in swift decision-making. However, currently Alaska (2.0%) is the only DOT that indicates routine Lidar use for emergency responders. Additionally, only 5.9% of state DOTs use it regularly for this purpose. However, a substantial number of state DOTs (29.4% of DOTs) have never used Lidar in emergency responses. In addition, 19.6% of state DOTs handle Lidar on an experimental basis, typically in pilot studies, to evaluate its effectiveness in emergency scenarios. Notably, in several states, the state police have the mandate to conduct the emergency response rather than the DOT.
Crash Reconstruction for Quick Clearance
Crash reconstruction for quick clearance sees a varied application of Lidar among state DOTs (Figure 17). Alaska and Minnesota use it routinely (3.9%), as part of their standard practices in quickly clearing crash sites. On the other hand, nearly half of state DOTs (49.1%) do
not use Lidar for this purpose. It is important to note that the low use of Lidar data for crash reconstruction/quick clearance may be because DOTs are usually not responsible for the crash reconstruction component of quick clearance. Instead, this responsibility often falls to other agencies, such as law enforcement or emergency responders. Additionally, the use of UAS-Lidar for TIM by transportation systems management and operations may result in UAS being housed outside of the DOT. For example, purchases for crash response or collapse surveys may place UAS ownership and use with agencies such as the Department of Homeland Security or highway safety authorities.
Other DOT Projects
The application of Lidar in other DOT projects demonstrates its versatility and adaptability in addressing various operational needs. In this case, Oregon utilizes Lidar sporadically for vertical clearance assessments, Wyoming DOT for monitoring bridges and tunnels, Wisconsin DOT for monitoring walls, New York DOT for managing sidewalks and curb ramps, Idaho for salt inventory, and Iowa to support roadway inventory. However, many state DOTs report minimal to no use of Lidar for “other” projects. This diverse application spectrum is further elaborated in the associated figures, which detail the specific uses and integration levels of Lidar technology within state transportation projects.
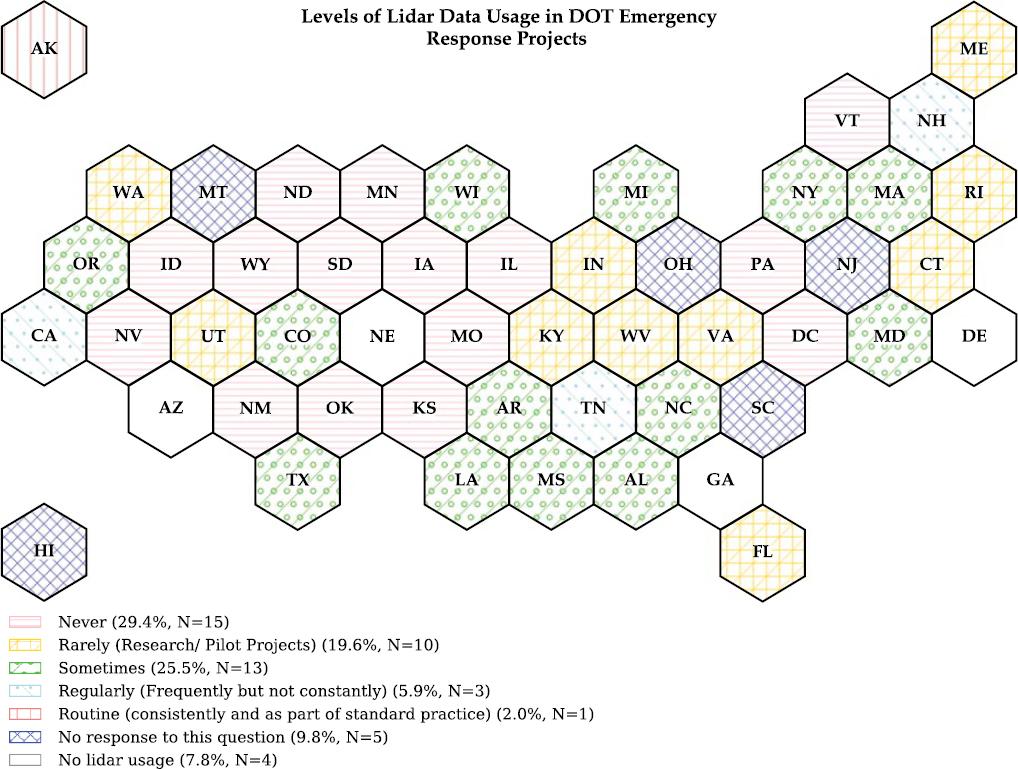
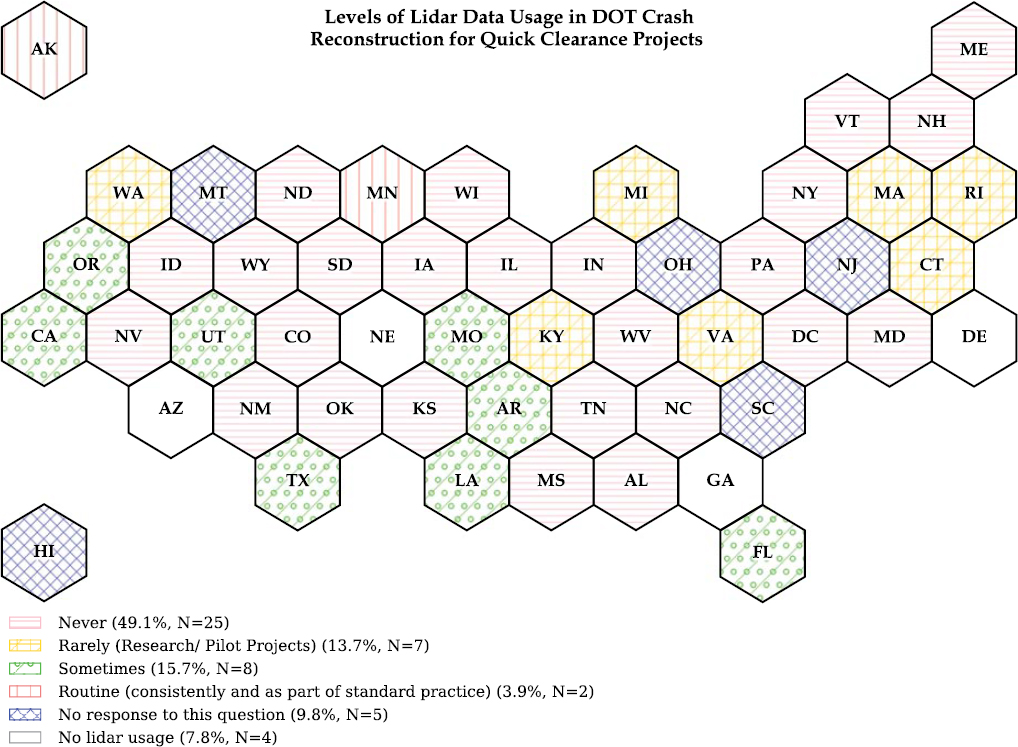
Table 9. Challenges associated with Lidar technology identified by state DOTs indicating Lidar usage (N = 47).
| Application | Lack of trust in Lidar data quality | Software compatibility | Difficulties in obtaining similar results to traditional workflows | Limited experience, training, and capabilities | Insufficient IT infrastructure (data storage, network latency, software tools, etc.) | Other methods provide higher ROI | Effort required to extract information from Lidar data | Lidar data needs to be supplemented with additional data sources to meet project or reporting requirements | Other | Not Sure |
|---|---|---|---|---|---|---|---|---|---|---|
| Roadway Projects | 12.8% | 21.3% | 14.9% | 42.6% | 40.4% | 14.9% | 42.6% | 44.7% | 0.0% | 0.0% |
| Operations, Maintenance, and Safety | 10.6% | 14.9% | 8.5% | 42.6% | 29.8% | 6.4% | 27.7% | 27.7% | 0.0% | 25.5% |
| Mapping | 12.8% | 12.8% | 12.8% | 44.7% | 44.7% | 8.5% | 44.7% | 38.3% | 0.0% | 10.6% |
| Asset Management | 8.5% | 19.1% | 12.8% | 38.3% | 34.0% | 6.4% | 36.2% | 27.7% | 0.0% | 25.5% |
| Emergency Response | 2.1% | 6.4% | 4.3% | 38.3% | 27.7% | 6.4% | 17.0% | 17.0% | 0.0% | 31.9% |
| Average | 9.6% | 15.2% | 10.4% | 41.7% | 36.1% | 8.7% | 33.9% | 31.7% | 0.0% | 19.1% |
| Standard Deviation | 4.5% | 6.0% | 3.9% | 2.4% | 7.3% | 3.8% | 11.6% | 10.9% | 0.0% | 13.3% |
Challenges Associated with Lidar Technology
The most substantial challenges identified include limited experience, training, and capabilities; insufficient IT infrastructure, the effort required to extract information, and the need to supplement Lidar data (Table 9). Notably, the respondents indicated these challenges for most, if not all, application categories. Across applications, few respondents indicated a lack of trust in data quality, software compatibility, difficulties in obtaining similar results to traditional workflows, or lower ROI compared with other methods. These indicate that Lidar technology has substantially matured over the last decade. However, the challenges associated with managing the data remain a substantial barrier and will be explored further in the next section.
Lidar Data Life-Cycle Management
Data Collection and Frequency
Lidar data collection among state DOTs showcases a spectrum of frequencies (Figure 18) based on diverse approaches to meet the varying needs of asset management. Notably, 13.7% of the state DOTs have implemented annual collection cycles, while Alabama and Wyoming (3.9%) report only one statewide collect has been completed. In contrast, 6 state DOTs (11.8%) report not collecting network-level Lidar data for asset management. Other state DOTs (21.6%) collect Lidar data less frequently or on a project-specific basis.
Delving into the specifics of “Other” responses regarding network-level Lidar data collection among state DOTs reveals diverse practices and pilot projects. For instance, Minnesota DOT is completing its second statewide collect, working toward an established frequency. Arkansas has
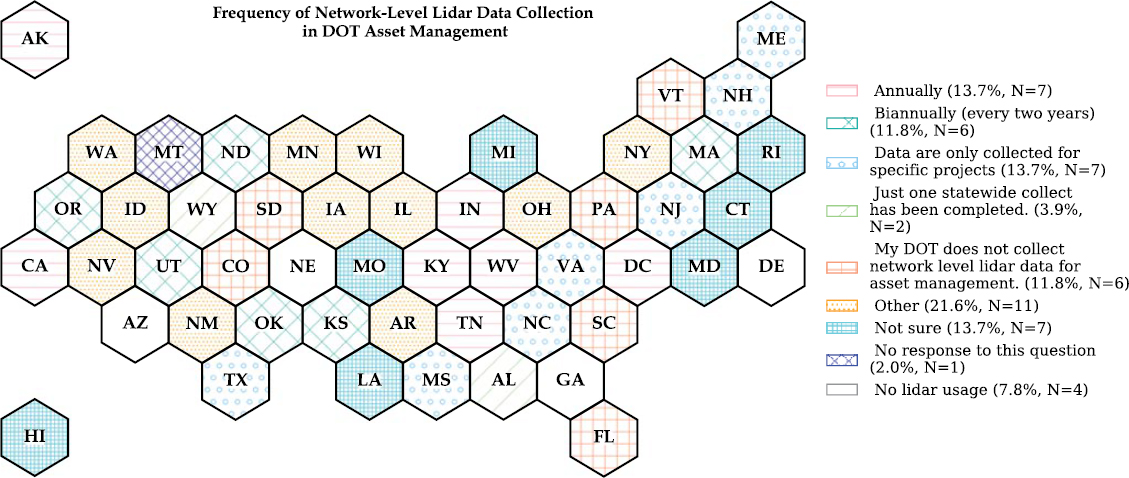
performed a pilot project, but not a statewide collect. Louisiana DOT collects data specifically for structural vertical clearances, while Illinois DOT collects uncontrolled road inventory data every 2 years for condition ratings and has limited use in planning and maintenance, along with collecting specific controlled roadway project data as needed. Additionally, New York DOT is just beginning to start using Lidar technology for network-level collection, and Wisconsin DOT has plans to do so in the near future. Idaho DOT collects network-level data every 3 years.
Data Storage and Retention Policies
The retention and storage policies for Lidar data across state DOTs vary significantly (Figure 19), driven by the data’s volume, sensitivity, and utility in ongoing projects. 35.3% of the state DOTs retain all historical Lidar data indefinitely, emphasizing its long-term value for various applications from planning to emergency management. Conversely, 21.6% of the state DOTs adopt more dynamic retention strategies, focusing on retaining specific datasets based on project needs where Lidar data retention is aligned with specific project requirements and regulatory mandates.
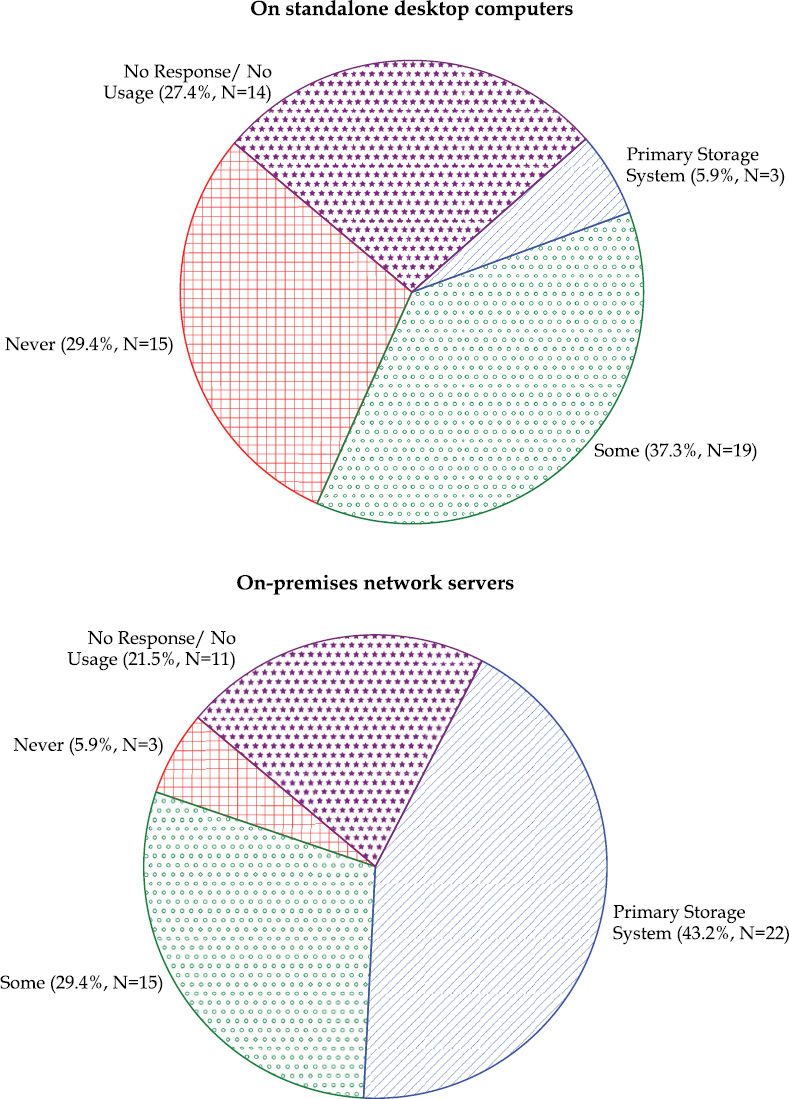
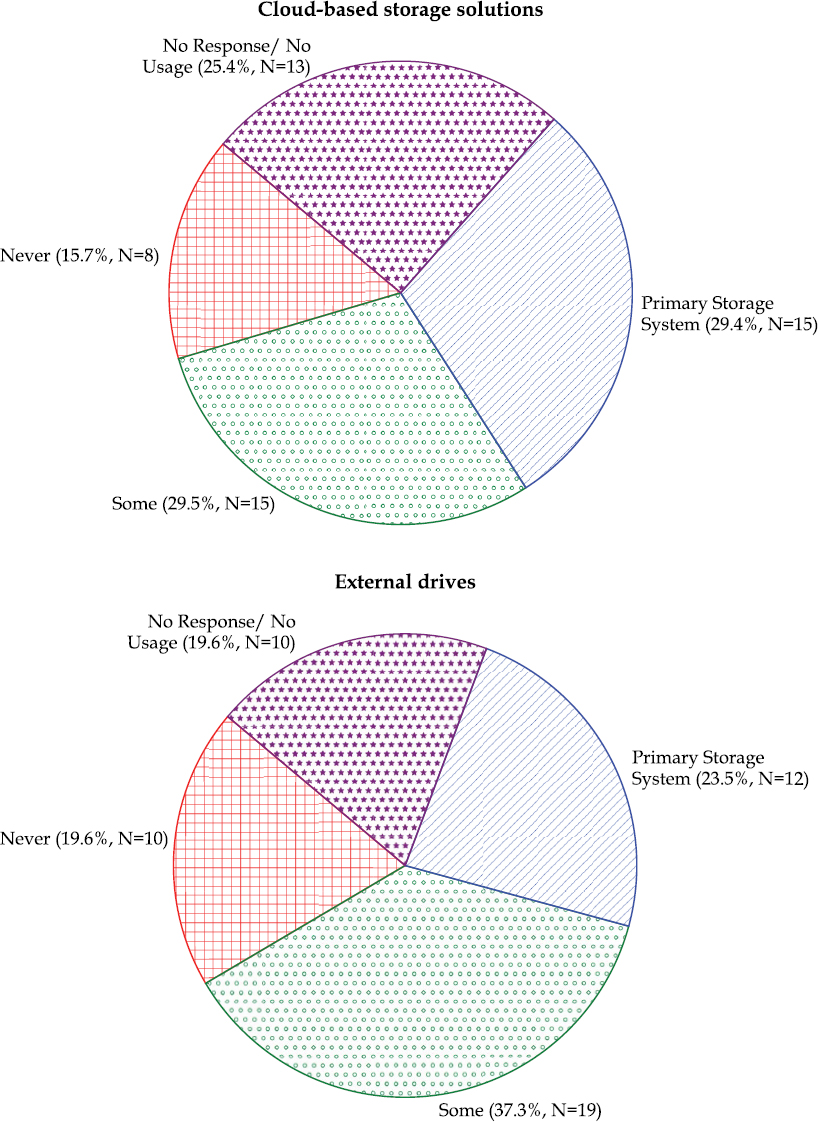
A substantial percentage of state DOTs (29.4%) never use standalone desktops for Lidar data storage. Only 5.9% consider it their primary storage system, reflecting its declining popularity amidst more secure and accessible options. Using on-premises network servers (43.2%) is the most relied-upon method for Lidar data storage among the options. This method combines relatively easier access within the organization with better control over data security than standalone systems.
Cloud storage is utilized significantly, with 29.4% of respondents identifying it as their primary method. This reflects a growing trust in cloud solutions for their scalability, remote accessibility, and cost-effectiveness, although 15.7% have not adopted cloud storage, possibly because of concerns over data security or regulatory compliance. External drives are used by a mixed percentage of respondents with 23.5% considering it their primary method. Idaho reported the Lidar data is hosted by consultants that collected the data.
Data Processing and Mining Practices
Approaches to Lidar Data Processing Workflows in DOTs
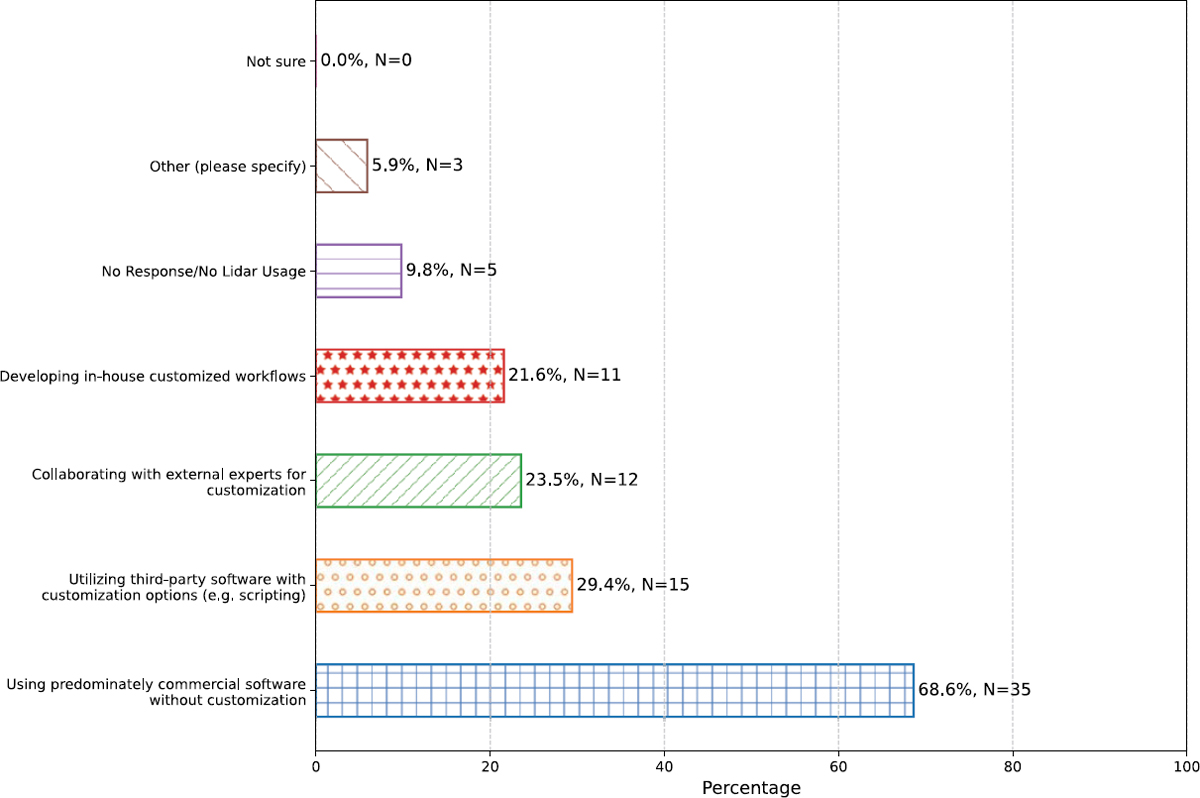
State DOTs exhibit diverse approaches to Lidar data processing workflows (Figure 20), with a blend of standard and customized methods tailored to their specific needs. Among these, using predominately commercial software without customization by far is the most common (68.6%) data processing approach state DOTs are using. Several state DOTs leverage a combination of commercial software, in-house customized workflows (21.6%), and third-party software with customization options (29.4%).
Enhancing Lidar Data Processing Efficiency: Strategies in DOTs
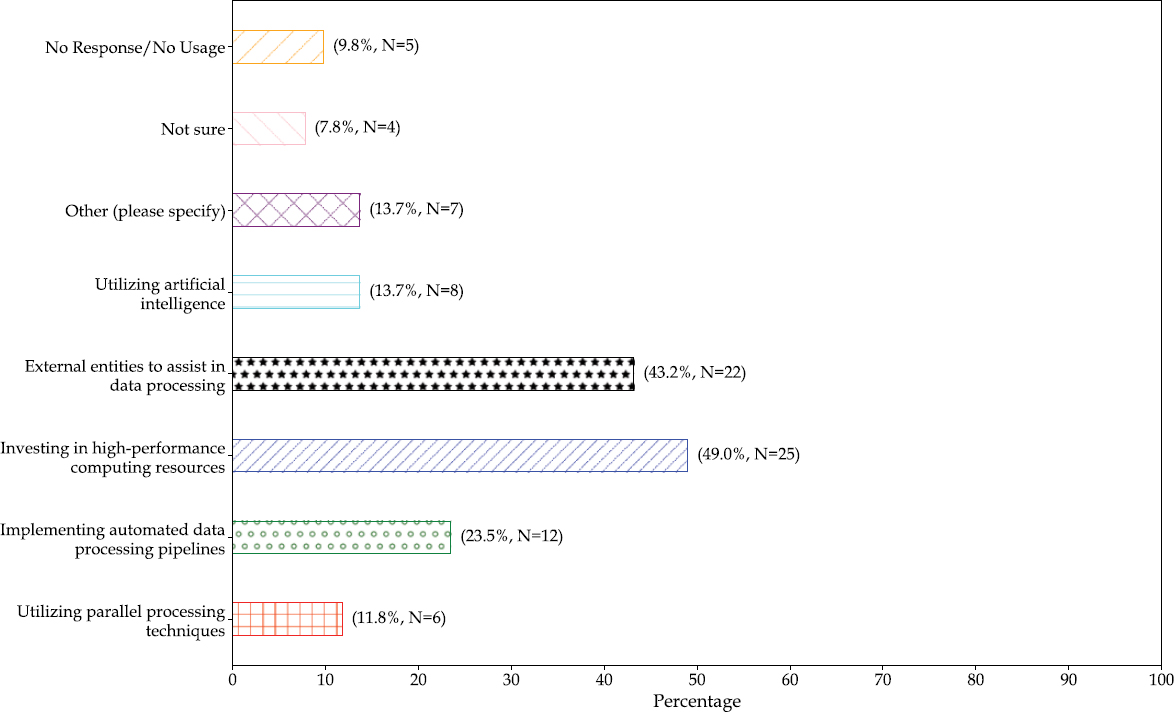
Efficiency in Lidar data processing is important for the timely and effective application of Lidar technology in transportation projects (Figure 21). Only 11.8% of respondents use parallel processing techniques, as indicated by 6 DOTs. Implementing automated data processing pipelines is more common, with 23.5% (11 DOTs) employing automation in their workflows. The most popular strategy is investing in powerful computing solutions, which is implemented by 49.0% (25 DOTs). A substantial 43.2% (21 DOTs) rely on external entities for data processing. This approach often involves outsourcing to specialized firms that can provide expertise and advanced technology, thereby alleviating the resource constraints within DOTs. The next section explores this approach in more detail. AI technologies are used by 13.7% (7 DOTs), highlighting a growing trend toward leveraging AI for automated feature extraction, pattern recognition, and decision-making support in Lidar data analysis. Another 13.7% (7 DOTs) reported using various other strategies not listed in the main options, reflecting a diversity of approaches tailored to specific operational or technological needs.
Governance and Management of Lidar Data
Data Management Practices
41.2% (21 DOTs) report strict access controls, which is the most common method employed (Figure 22). This high percentage indicates a strong emphasis on security, ensuring that only
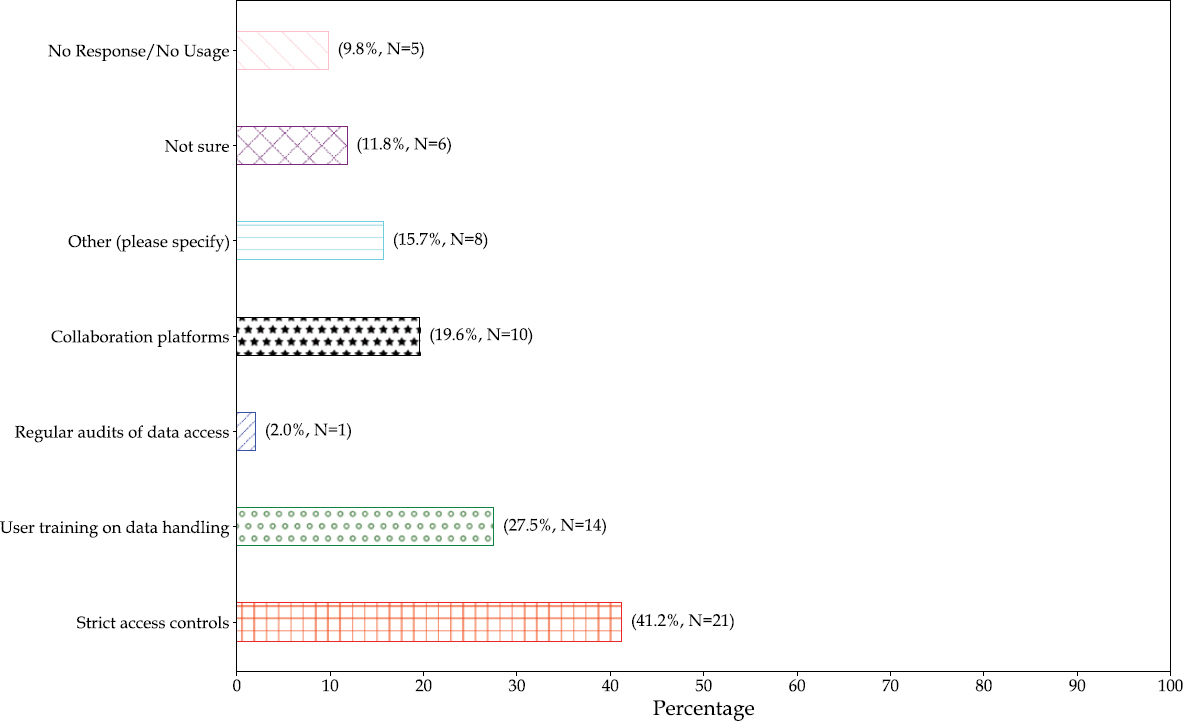
authorized personnel have access to Lidar data. Implemented by 27.5% (14 DOTs), the user training on data handling strategy highlights the importance of training staff in proper data management practices to prevent unauthorized access and data breaches. Only 2.0% (1 DOT) conduct regular audits of data access, indicating that it is not a widespread practice. Used by 19.6% (10 DOTs), collaboration platforms enable data sharing and collaboration within secure environments, enhancing productivity while maintaining control over data access. 15.7% (8 DOTs) indicated they implement other measures tailored to specific operational needs or security policies of the DOTs. 11.8% (6 DOTs) indicate uncertainty or lack of information about the practices in place, highlighting possible areas for improvement in data management strategies or awareness.
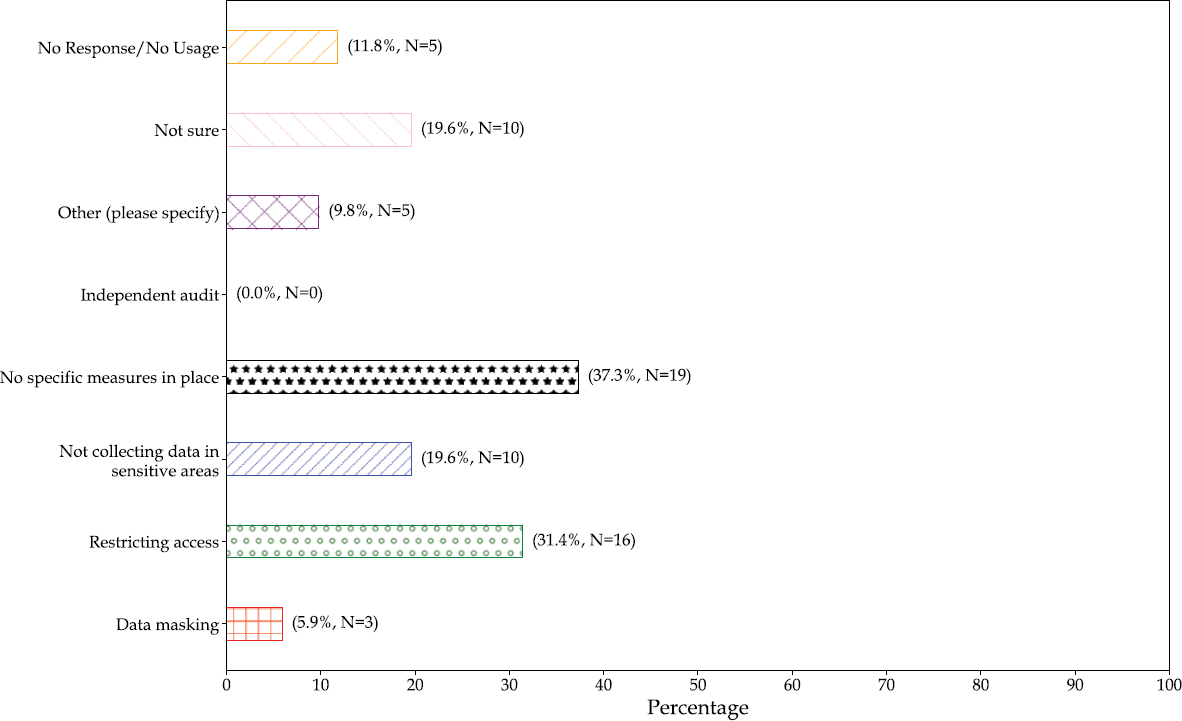
Governance Practices
Governance of Lidar data in DOTs focuses on addressing privacy concerns while enhancing data accessibility (Figure 23). Employed by 5.9% (3 DOTs), data masking is used to obscure specific data elements within stored data to protect privacy, which can be important for datasets that involve personal or other sensitive information. Restricting access is the most common approach, used by 31.4% (16 DOTs), indicating a significant emphasis on controlling access to Lidar data as a means to safeguard privacy. 19.6% of the state DOTs do not collect data in sensitive areas. Surprisingly, 37.3% (19 DOTs) reported having no specific measures to address privacy concerns. This could suggest a potential area for improvement in privacy protocols or a lack of regulatory requirements. Independent auditing is not utilized by any of the DOTs surveyed, suggesting that external reviews of privacy practices are either not deemed necessary or are integrated into other processes not specified here.
Data Accessibility
DOTs are exploring methods to simplify data sharing across the organization. 31.4% have developed user-friendly interfaces for data access or processing. For example, New York DOT will be sharing mobile Lidar data within the department using a free web viewer. Similarly, the asset management collection is accessible to Arkansas through a web viewer provided by their vendor. The vendor for Tennessee provides a Lidar surface layer as a base map for 360-degree imagery and also provides the option to download point cloud data from their server. 29.4% provide data in multiple formats. 27.5% indicated they conduct training and outreach. However, 41.1% indicated they currently do not have efforts in place (including the 7.8% who are not using Lidar). 9.8% were not sure.
Sharing/Utilizing Practices
Figure 24 provides a detailed breakdown of the frequency with which DOTs share and utilize Lidar data with internal divisions and external partners. A majority (56.9%) share Lidar data with local municipalities “rarely/upon request,” suggesting that while the data is accessible, it is not routinely utilized. It is important that the shared data is applicable and tailored to meet the specific needs of local municipalities to enhance its utilization. Planning departments have more frequent access, with 17.6% sharing “regularly” and 11.8% “routinely.” Environmental management sees a
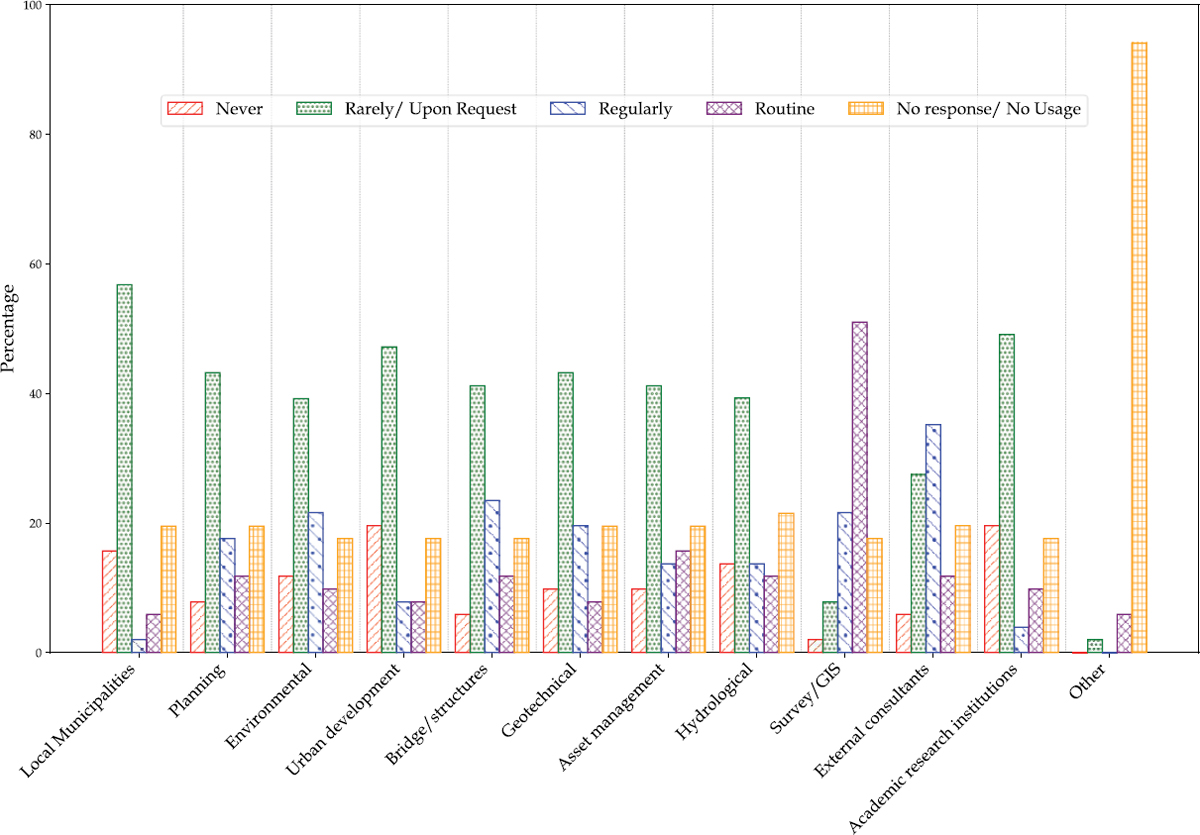
significant portion (31.4%) accessing Lidar data regularly or routinely, supporting its use in environmental assessments and monitoring. Urban development shows less frequent usage with 66.7% rarely or never using Lidar data and only 7.8% using it regularly and 7.8% using it routinely. This suggests a potential area for increased integration of Lidar data to enhance urban planning processes.
The bridge/structures and geotechnical departments show a similar pattern, with a good portion accessing data rarely or upon request, but also a notable percentage (23.5% for bridge/structures and 19.6% for geotechnical) using it regularly, highlighting the importance of Lidar in structural assessments. Lidar data usage in asset management is moderately distributed across never, rarely, and regularly, which suggests varied applications depending on specific asset management needs. Sharing Lidar data for hydrological purposes shows less routine usage (11.8%), possibly because of the specialized nature of hydrological applications requiring Lidar data. Survey/GIS departments show the highest routine use (51.0%) of Lidar data, underlining its importance where high accuracy and detailed data are required. External consultants see a considerable portion (35.2%) using Lidar data regularly. Academic institutions, however, have less engagement, with a high frequency of never using the data (19.6%).
Quality Assurance
This section outlines the QA measures employed by state DOTs to maintain high standards of Lidar data accuracy and integrity across different platforms.
Expected Accuracy Standards for Lidar Platforms
Based on Table 10, airborne Lidar technology, used for broad and detailed aerial surveys, shows a focus of state DOTs on centimeter (cm) to decimeter (dm) accuracy levels, with 37.3% of responses indicating dm-level precision. Helicopter-mounted Lidar, similar to airborne, largely aims for high precision, with 21.6% achieving cm-level accuracy. However, a significant proportion (41.2%) are not sure of the standards, reflecting possible variability in project requirements or available technology. Terrestrial Lidar systems demonstrate a higher preference for very fine accuracy, with 45.1% achieving cm precision. In mobile Lidar systems, most of the state DOTs show an emphasis on cm-level accuracy (64.7%).
State DOTs that are using UAS-Lidar are targeted for cm to dm accuracy (62.7% combined for cm and dm). Pocket Lidar devices, such as those integrated into smart devices, exhibit a lower
Table 10. Expected accuracies from different Lidar platforms.
| System | mm-level (~0.005 ft) | cm-level (~0.05 ft) | dm-level (~0.5 ft) | m-level (~5 ft) | Several meters (>10 ft) | Not Sure | No Response / No Usage |
|---|---|---|---|---|---|---|---|
| Airborne | 0.0% | 23.5% | 37.3% | 2.0% | 2.0% | 17.6% | 17.6% |
| Helicopter | 0.0% | 21.6% | 13.7% | 0.0% | 0.0% | 41.2% | 23.5% |
| Terrestrial (tripod) | 27.5% | 45.1% | 2.0% | 0.0% | 0.0% | 9.8% | 15.6% |
| Mobile (vehicle-mounted) | 2.0% | 64.7% | 2.0% | 2.0% | 0.0% | 13.7% | 15.6% |
| UAS-Mounted | 0.0% | 43.1% | 19.6% | 2.0% | 0.0% | 17.6% | 17.6% |
| Pocket Lidar (e.g., smart device) | 0.0% | 7.8% | 5.9% | 3.9% | 3.9% | 51.0% | 27.4% |
| Other | 0.0% | 0.0% | 2.0% | 0.0% | 0.0% | 11.8% | 86.2% |
confidence in high accuracy, with 51.0% of respondents unsure of the accuracy levels. Only Idaho DOT reported using “other” unspecified Lidar systems with a focus on dm-level accuracy for salt shed inventory, but a vast majority (86.2%) did not specify any usage, suggesting a limited role or emerging nature of these technologies within the DOTs.
Quality Assurance Strategies
Most DOTs (72%) using Lidar implement in-house validation protocols. Some utilize tools provided in manufacturers’ software (45%) and/or follow standards such as the ASPRS positional standards (50%). Third-party validations are less common (22%).
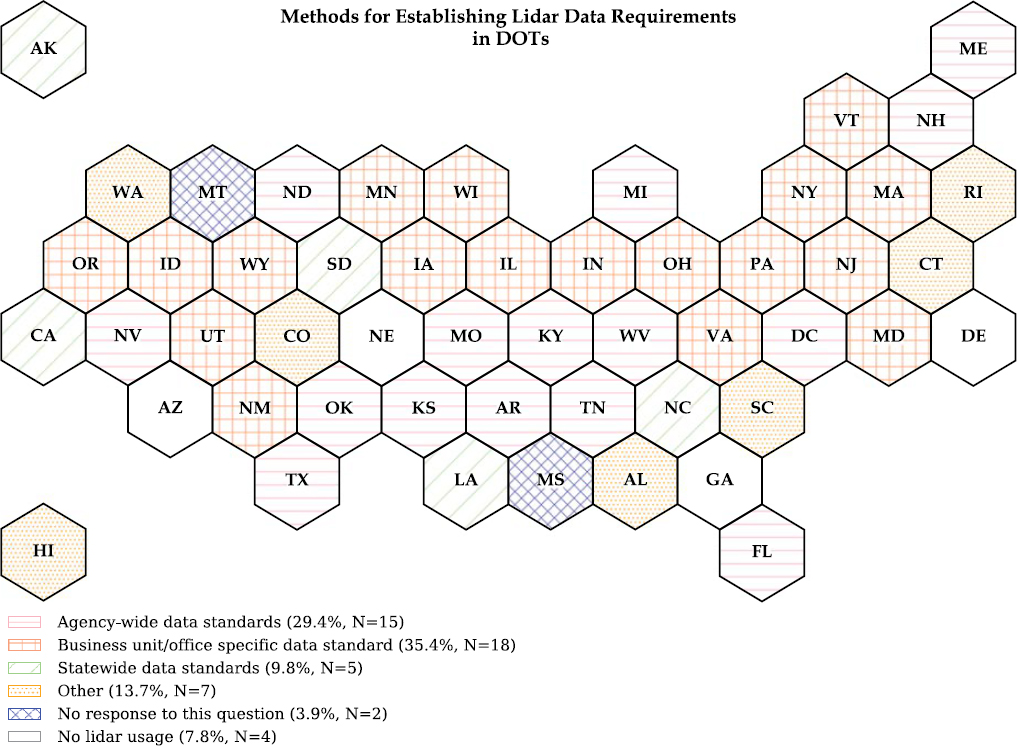
Establishing Lidar Data Requirements
Methods to establish Lidar data requirements (Figure 25) vary from statewide standards (9.8%) to DOT-wide standards (29.4%) to business-unit-specific guidelines (35.4%), reflecting the diverse applications of Lidar data within DOT operations.
Metadata
Ensuring the accuracy and accessibility of Lidar data involves automated documentation processes, standardized metadata templates, and periodic updates. The most common approaches indicated by DOTs to provide metadata include detailed reports (35.4%), documentation of data requirements and standards (31.4%), periodic manual updates (21.6%), and standardized metadata templates (19.6%);
15.7% indicated that they were not tracking metadata (this does not include the 7.8% of DOTs who are not using Lidar). North Carolina DOT relies on the LAS file header information to provide metadata. Tennessee and Rhode Island rely on their vendor to provide documentation and metadata. Washington DOT is exploring methods, with their network-level collection effort under way.
Standards, Policies, and Regulatory Framework
The regulatory environment is shaped by both state-specific and national standards, where applicable. This dual approach ensures that Lidar data not only meets local operational needs but also aligns with broader industry benchmarks, enhancing interoperability and consistency across different jurisdictions and projects.
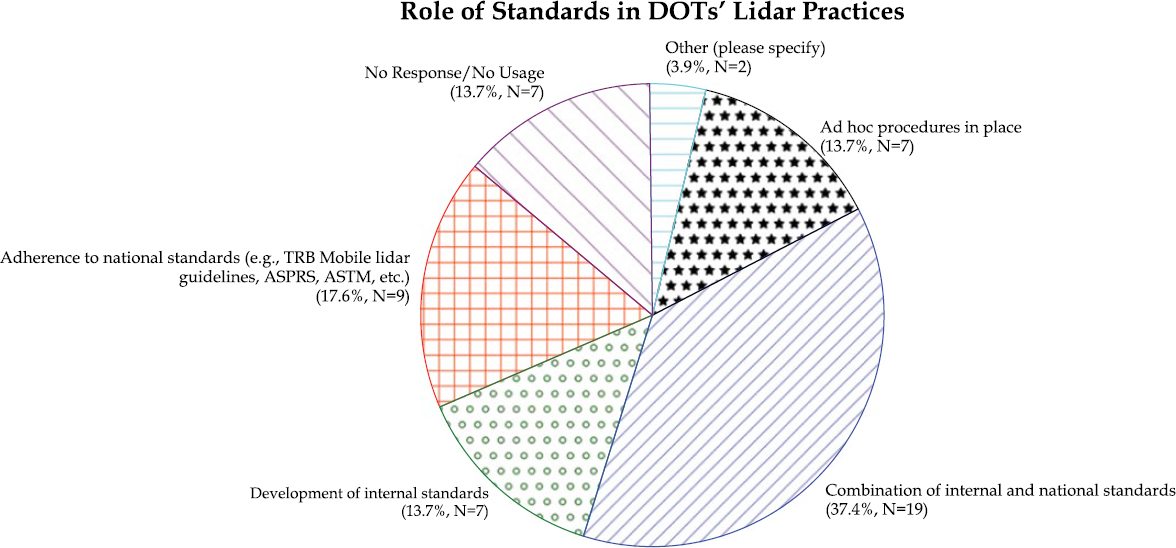
State DOTs employ various standards and policies to guide their Lidar data practices, ensuring accuracy, compliance, and efficient data management (Figure 26). About 17.6% of respondents follow national standards, such as those set by the TRB, the ASPRS, or the American Society for Testing and Materials (ASTM). Approximately 13.7% have developed internal standards. A few of these DOTs have shared their standards and documents with the research team (See Appendix B Question 2 for details).
The most common approach, used by 37.4%, is a hybrid model where DOTs integrate both national and internally developed standards. 13.7% indicated a more informal or situational approach to standards, which may vary by project or over time. A small fraction (3.9%) indicated they follow other specified standards, which were not detailed in the data provided.
Training
State DOTs are using different methods to keep pace with technological innovations in Lidar (Figure 27). Trade shows and national conferences (e.g., GeoWeek) are the most popular methods, with 52.9% (27 DOTs) participating in such events. These conferences serve as platforms for
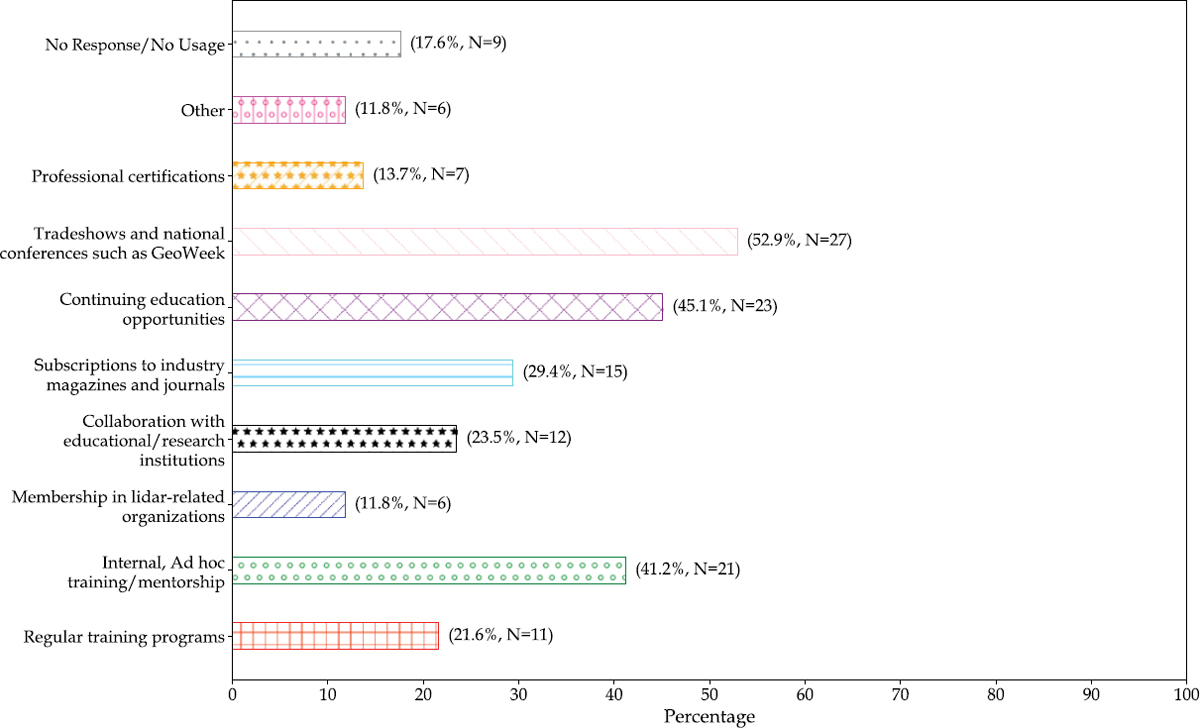
networking, learning about new research, and observing the latest technological trends firsthand. Adopted by 45.1% (23 DOTs), continuing education opportunities help professionals stay current with technological advancements and current workflows in the industry. 41.2% (21 DOTs) conduct in-house training sessions and mentorship programs that facilitate knowledge sharing and skills development within the organization. Subscriptions to industry magazines and journals were selected by 29.4% (15 DOTs) as another method to ensure that staff have access to the latest research, case studies, and industry news, supporting continuous learning and professional growth. 23.5% (12 DOTs) keep their personnel updated by collaboration with educational/research institutions. Also, regular training programs are used by 21.6% (11 DOTs) to systematically build and update the technical capabilities of their workforce. Professional certifications and membership in Lidar-related organizations are two other methods employed by 13.7% (7 DOTs). Another 11.8% (6 DOTs) reported using other methods to keep updated, indicating a tailored approach to learning and adaptation. Furthermore, self-studying and learning, collaboration with contractors and vendors, and involving business units were among the other methods reported by DOTs.
Future Directions
ROI Assessment
During the assessment of ROI by state DOTs from Lidar projects (Figure 28), the highest acknowledged advantages include safety improvements (70.6%) and time efficiency (68.6%), underscoring Lidar’s role in enhancing operational safety and reducing project timelines. Significant portions of respondents also noted cost savings (52.9%) and enhanced project outcomes (33.3%). However,
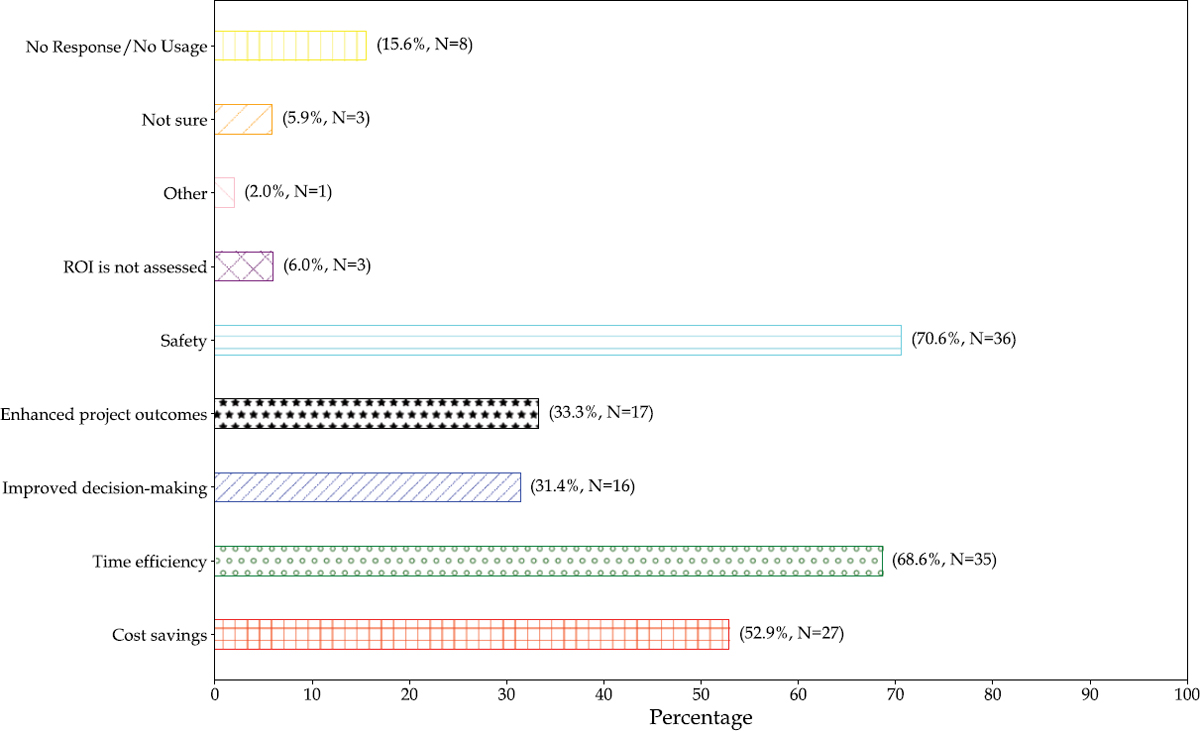
there is a noted presence of uncertainty or non-assessment in the ROI from these technologies, with 6% not assessing ROI at all and 15.6% not providing a response or not using Lidar.
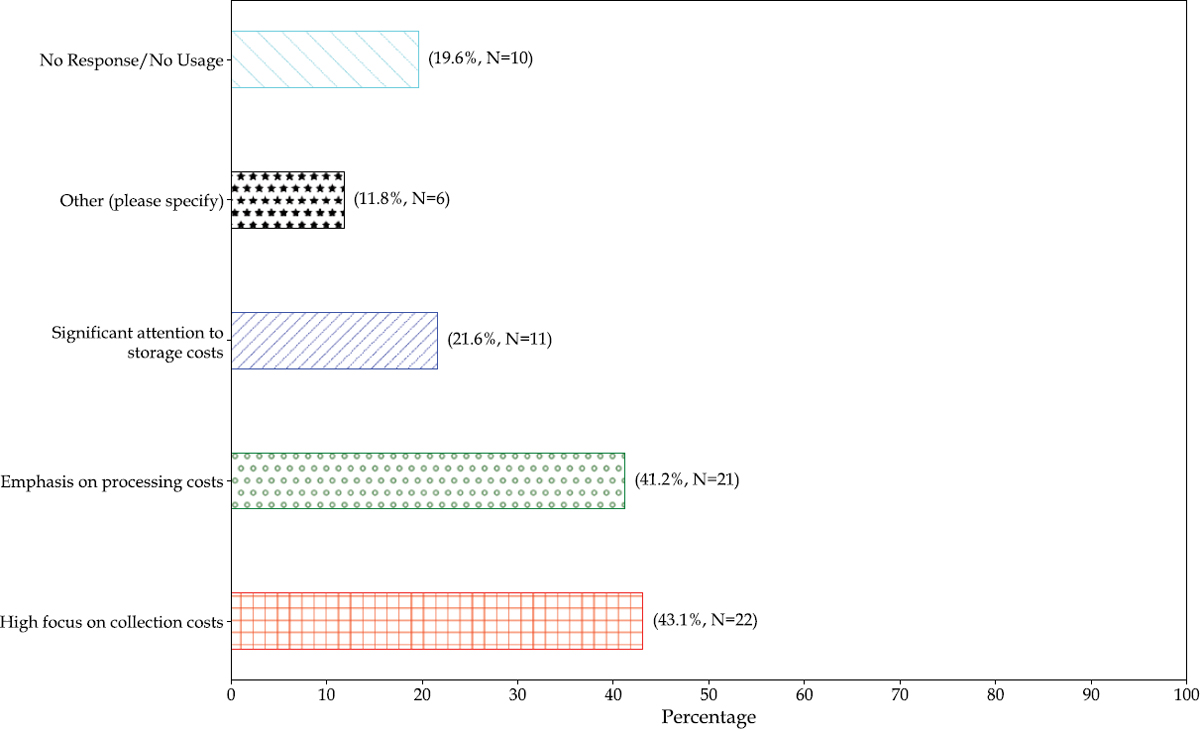
Cost Components
In reporting cost components (Figure 29), many state DOTs focus on the costs associated with data collection (43.1%), followed closely by data processing (41.2%). Fewer state DOTs place a significant focus on storage costs (21.6%), which may suggest a lower perceived burden or challenge in this area. Some respondents (11.8%) indicated other cost-related factors, but nearly one-fifth of the participants did not respond to this query, including those DOTs with “no Lidar usage” as this question was not applicable to them.
Level of ROI
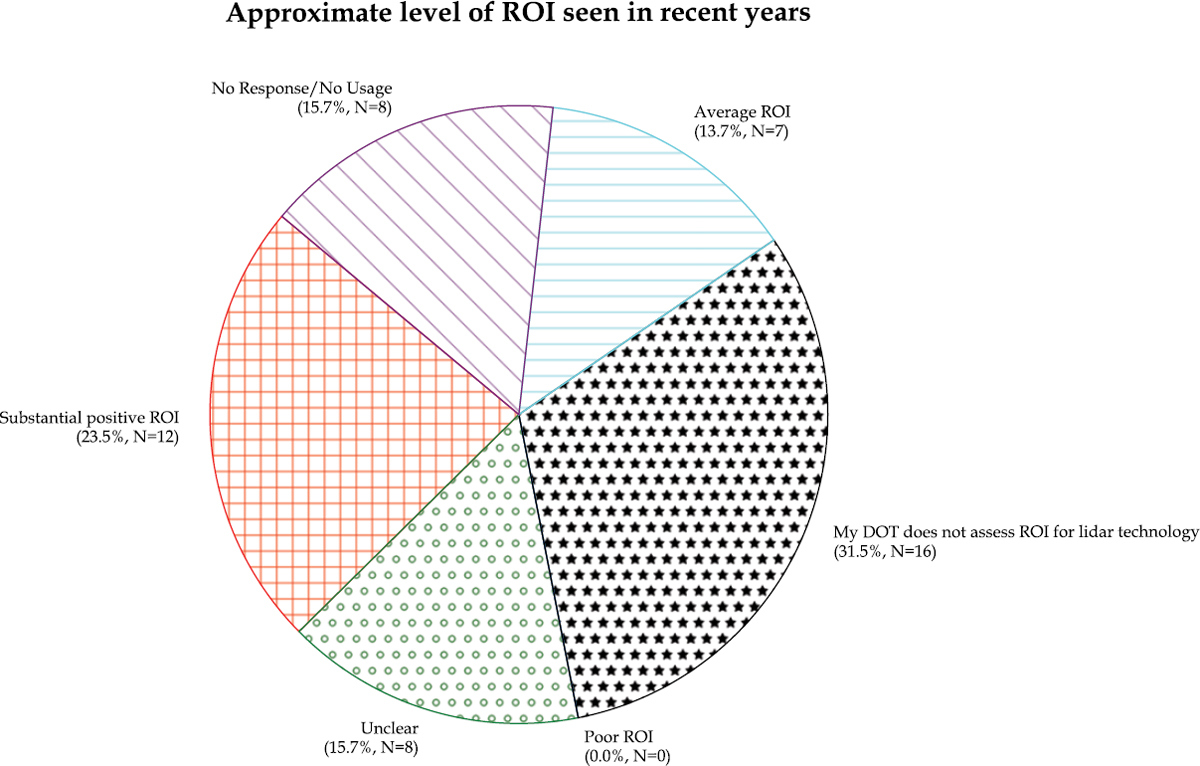
In assessing the ROI over recent years (Figure 30), a minority of state DOTs (23.5%) report seeing a substantial positive ROI from their Lidar investments. In contrast, a notable portion (31.5%) does not assess ROI at all, and another 15.7% are unsure of the ROI outcome, highlighting a gap in systematic evaluation. No respondents reported a poor ROI, indicating that they are likely seeing benefits to the technology and continuing to explore its usage.
The survey reveals a generally positive perception of the impact of Lidar technology within state DOT operations, particularly in improving safety and efficiency. Despite these benefits, there is a clear need for more standardized measures and regular assessments of ROI to fully understand
and maximize the investments in Lidar technology. The variability in ROI assessment practices suggests an opportunity for development in this area to ensure all state DOTs can quantify and optimize the benefits of their Lidar deployments effectively.
Summary
The nationwide survey has revealed many insights into the prolific state of Lidar technology adoption across U.S. state DOTs. While a significant number (49%) of state DOTs have embraced Lidar technology for over a decade and observed substantial benefits across diverse applications, others have only recently begun to explore its potential. This variation can be attributed to differences in technical expertise, budget constraints, and administrative approaches across state DOTs. Common challenges include the high initial costs of Lidar technology, the need for specialized training, and difficulties in integrating large volumes of Lidar data with existing systems. Nevertheless, despite these challenges, many DOTs indicated that they have achieved significant ROI with Lidar technology through advantages such as safety improvements (70.6%) and time efficiency (68.8%). Several DOTs are exploring automation and machine learning to improve data processing workflows. Survey responses also indicate that many DOTs prioritize robust QA/QC processes, effective data management, and secure storage systems. This situation highlights the need for a more unified approach to technology deployment, including increased investment in education, infrastructure, and policies tailored to overcome these barriers.


