Evaluating the Performance of Longitudinal Barriers on Curved, Superelevated Off-Ramps (2025)
Chapter: 5 Full-Scale Crash Testing
CHAPTER 5
Full-Scale Crash Testing
To validate that crash simulation efforts are valid representations of crashes, it is a common practice to conduct full-scale crash tests for selected configurations of a barrier for critical impact conditions. Four crash tests were undertaken in the project to validate the simulation results. Effective redirection of the vehicle, acceptable degrees of damage, and similar measured deformations and forces from these tests provided a strong indication of the validity of the crash simulation analyses. These crash tests involved vehicles impacting the barrier placed on a representative section of a curved, superelevated off-ramp. The tests involved impacts at 100 km/h with the 1100C and 2270P MASH test vehicles and at 80 km/h with mid-size and large sedans. The four tests conducted under this project for analyzing impacts with a typical CSOR are as follows:
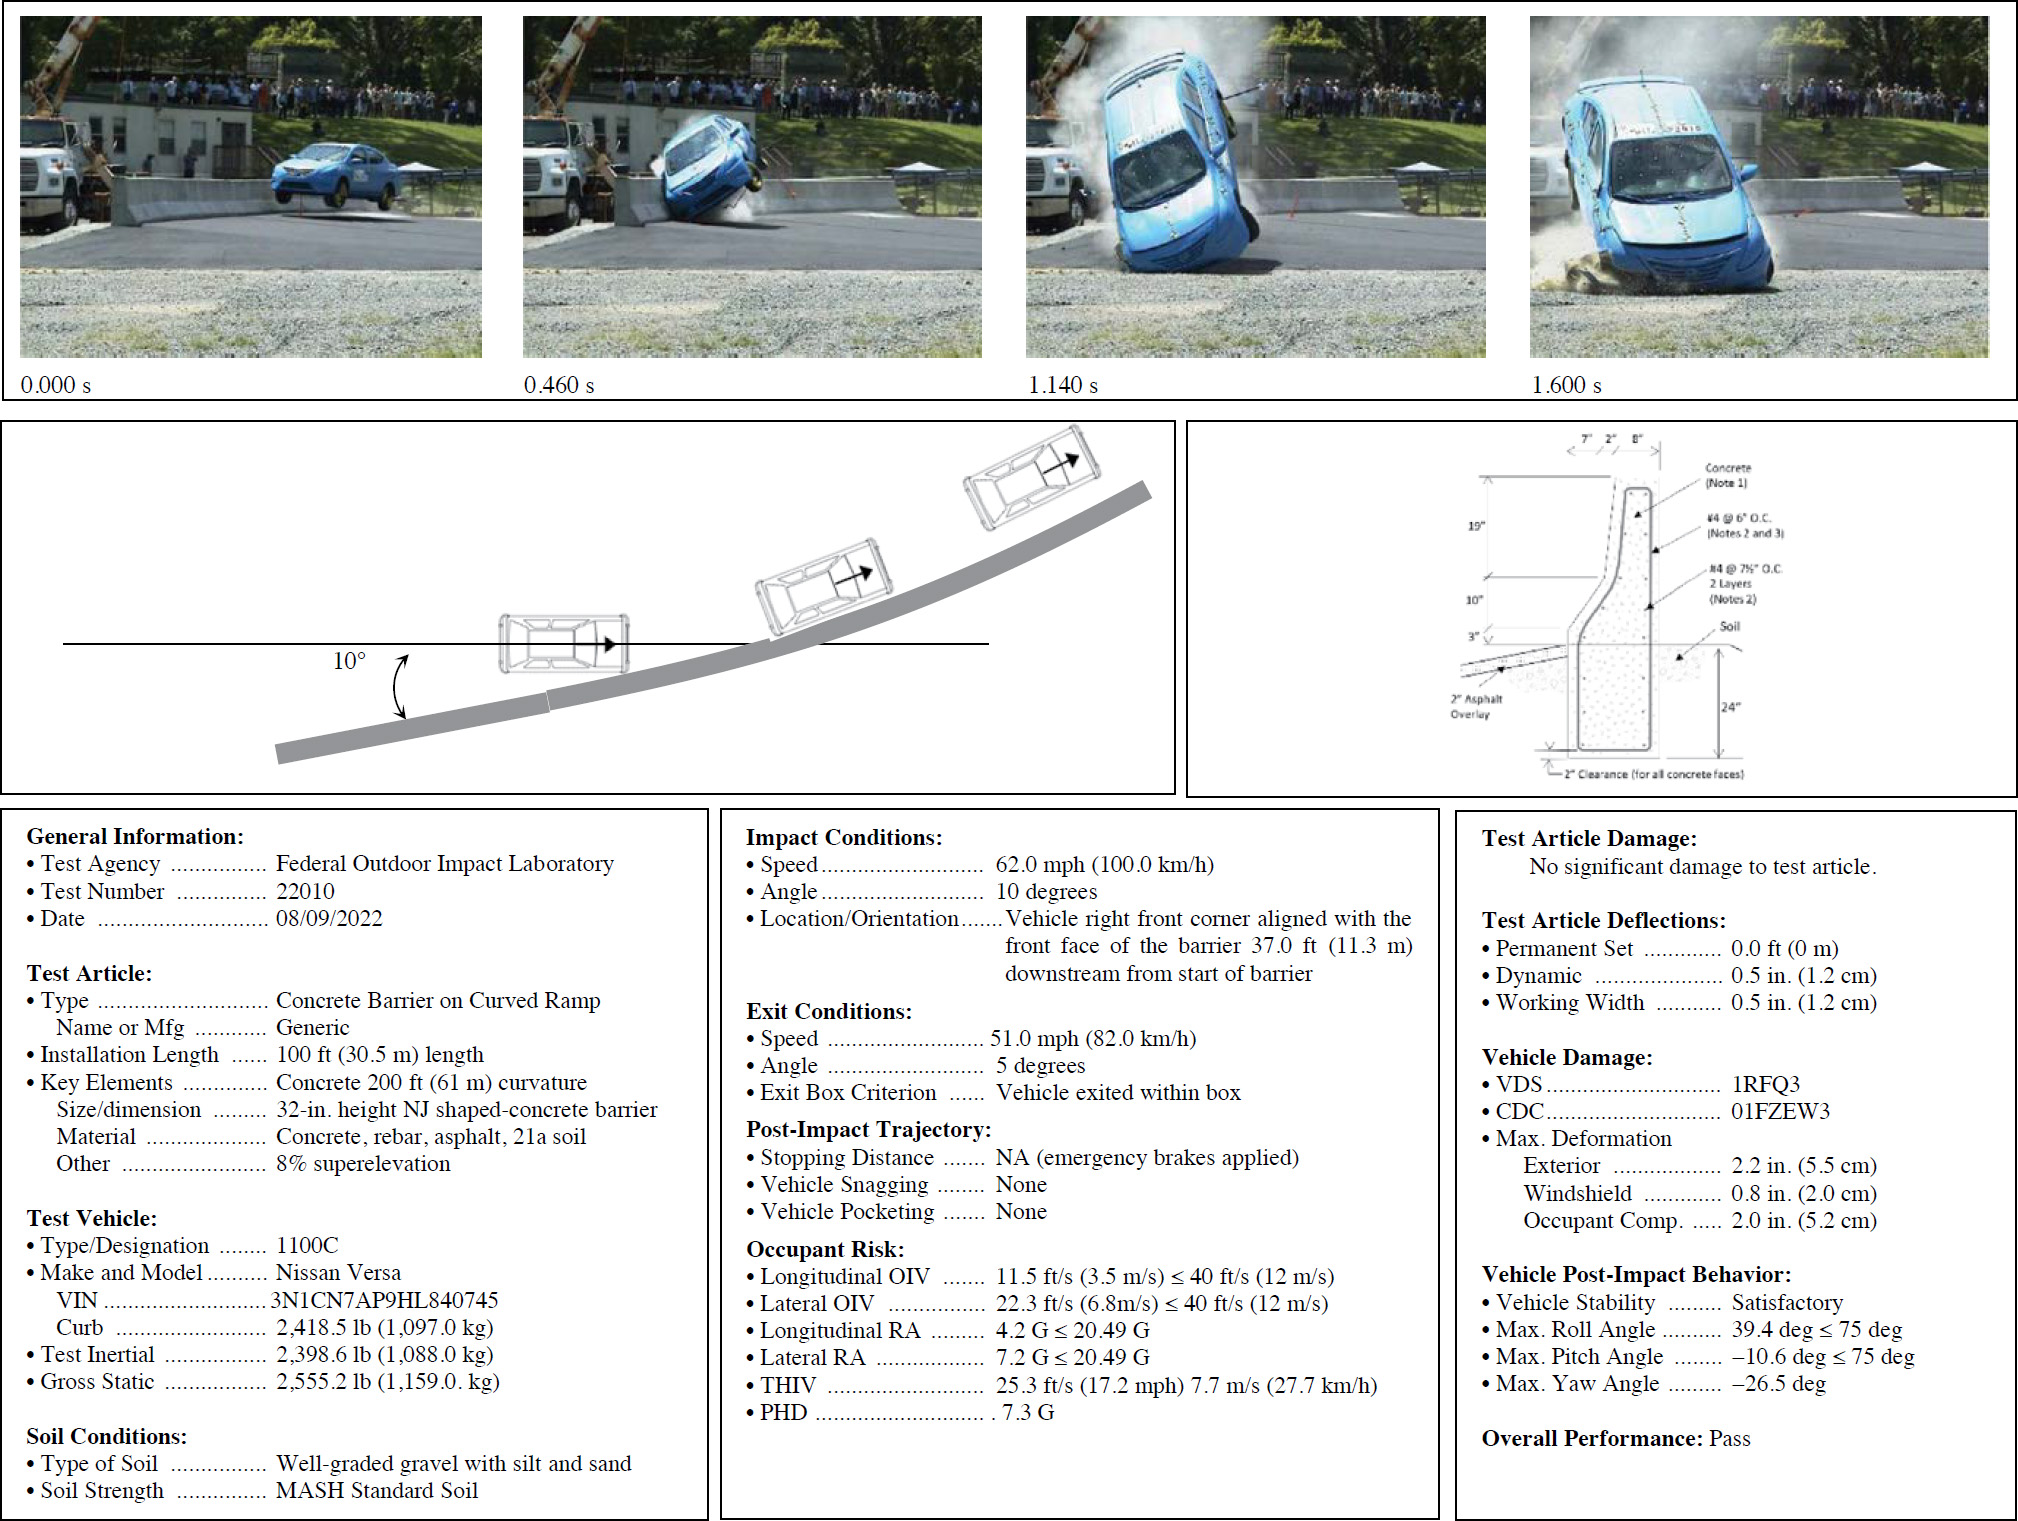
- Test 22010: Small (1100C) passenger vehicle at 100 km/h with a 10-degree angle
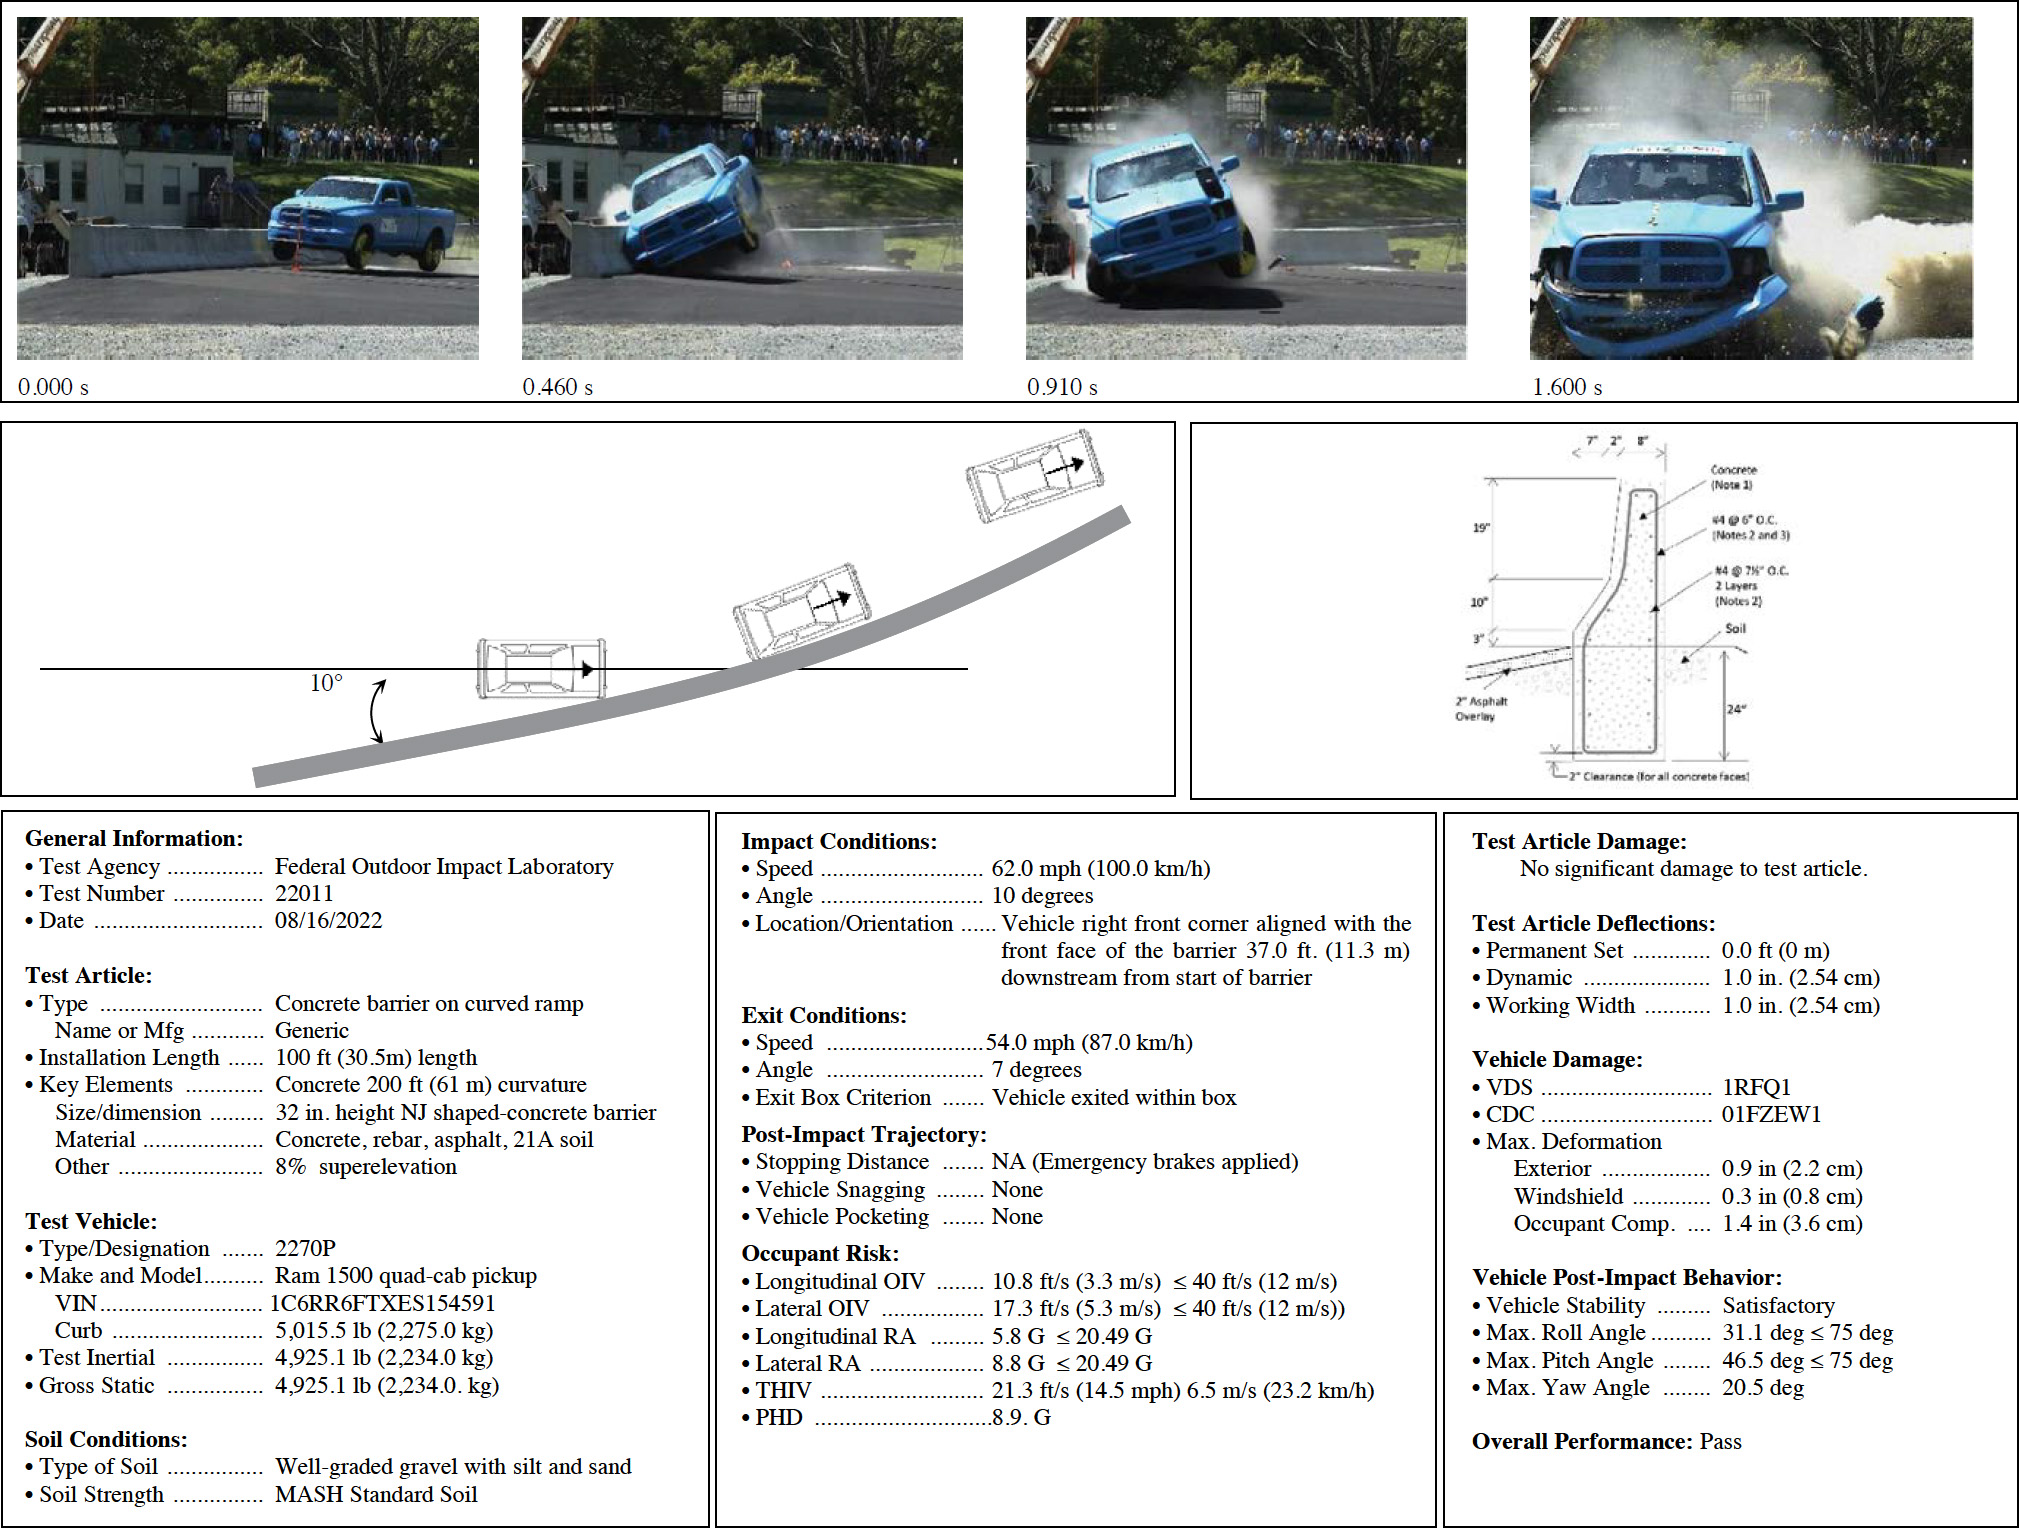
- Test 22011: Pickup (2270P) truck at 100 km/h with a 10-degree angle
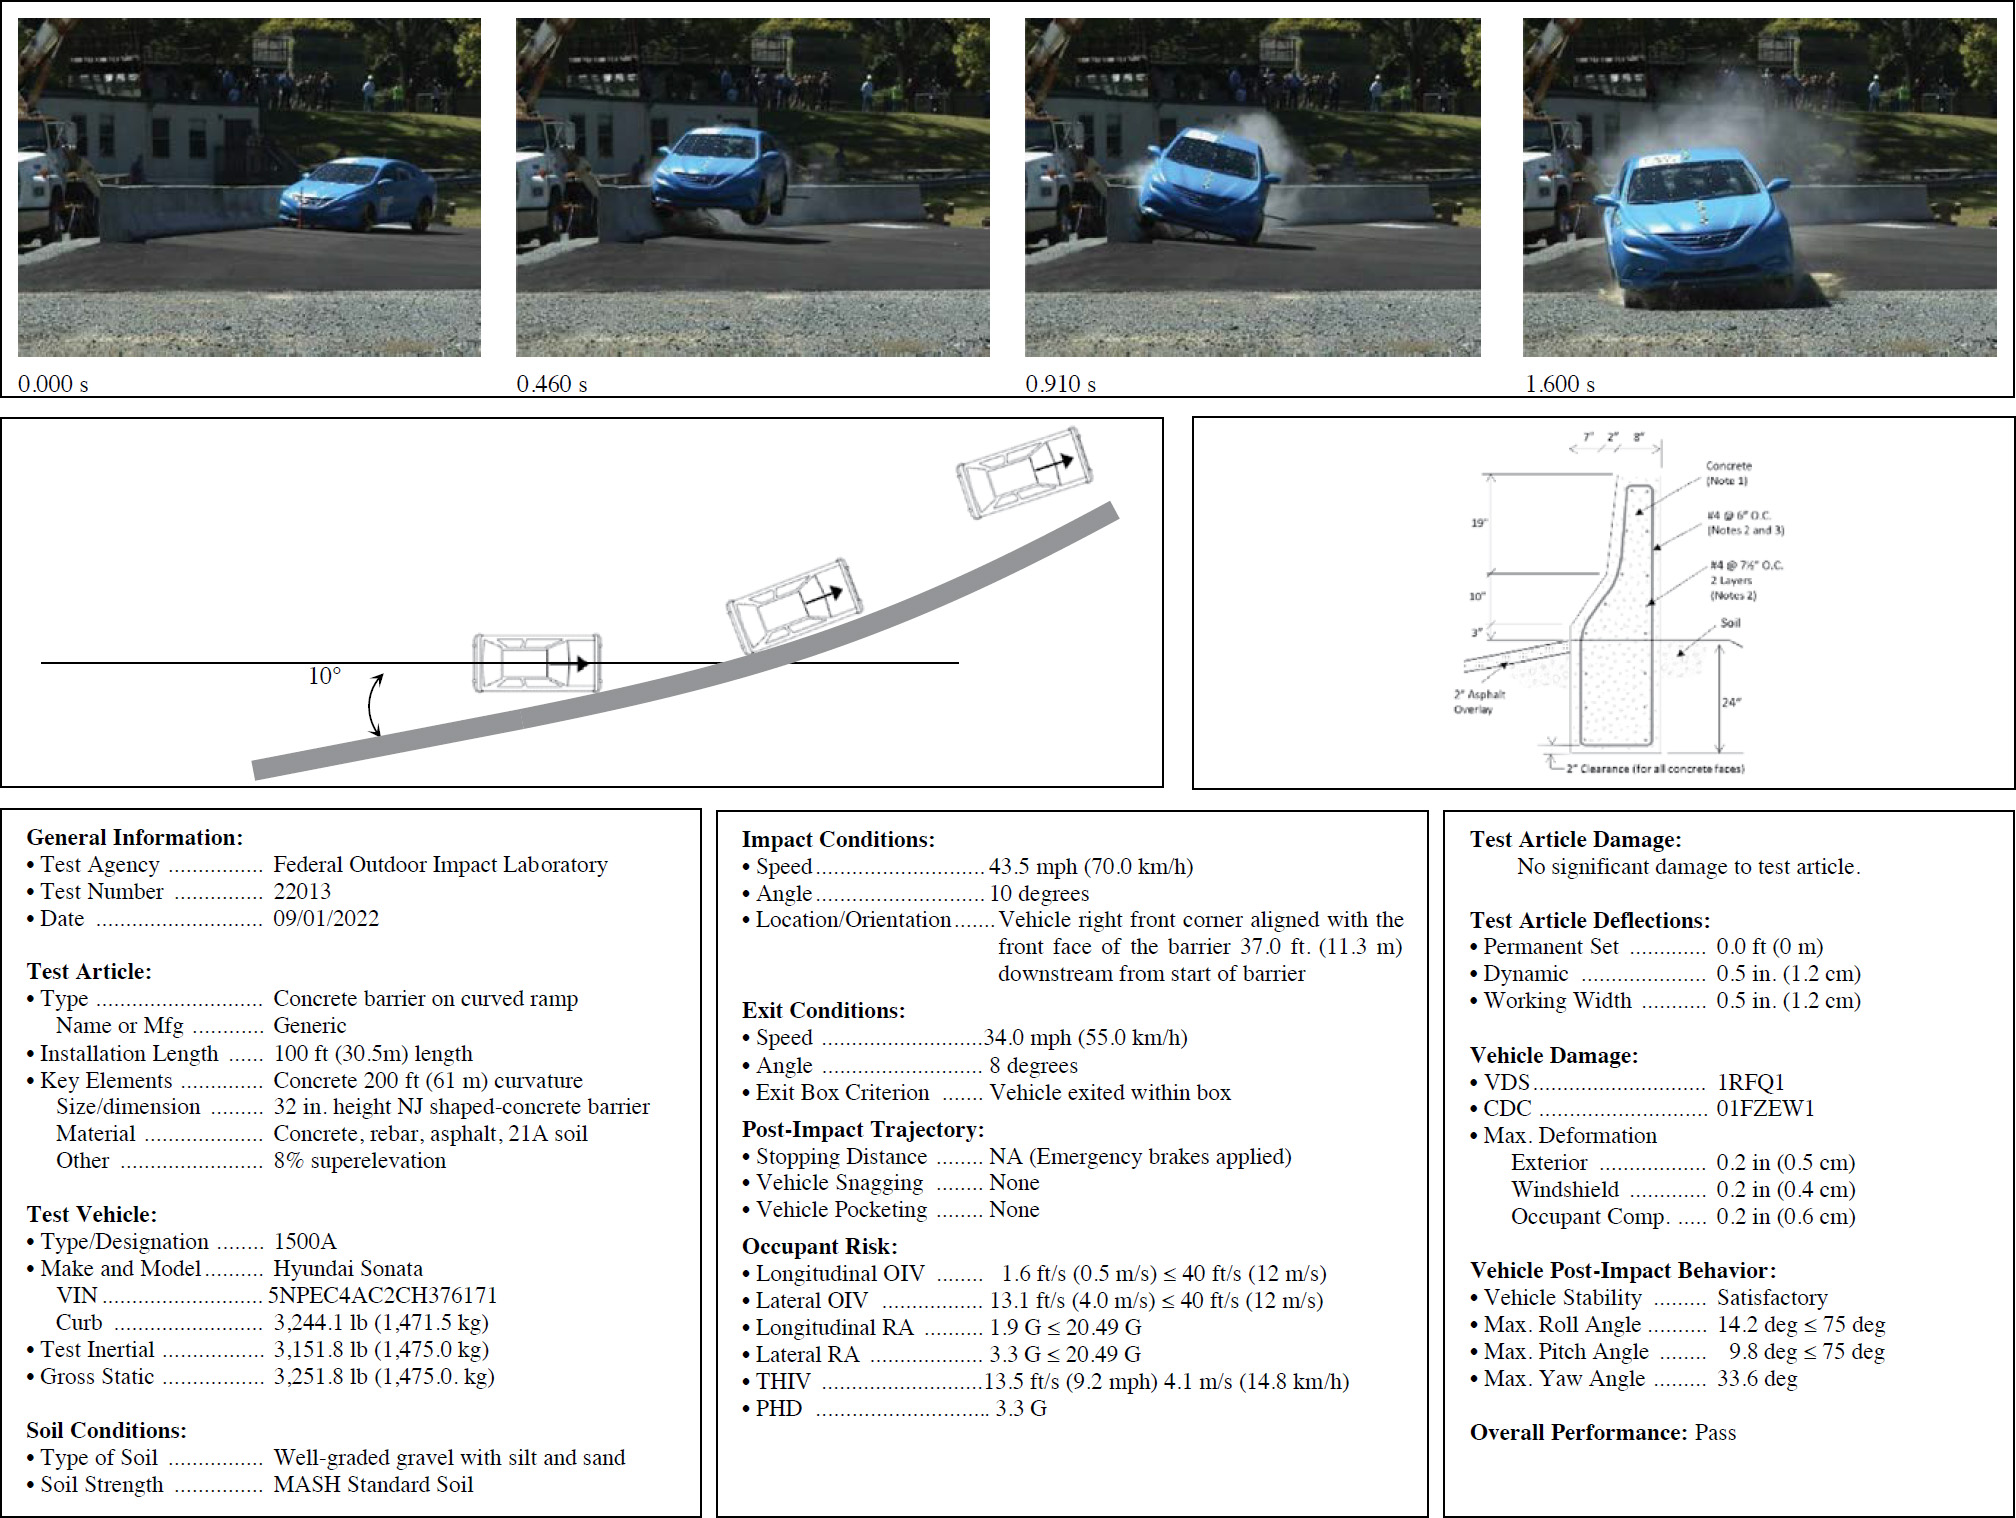
- Test 22013: Mid-size (1500A) passenger vehicle at 70 km/h with a 10-degree angle
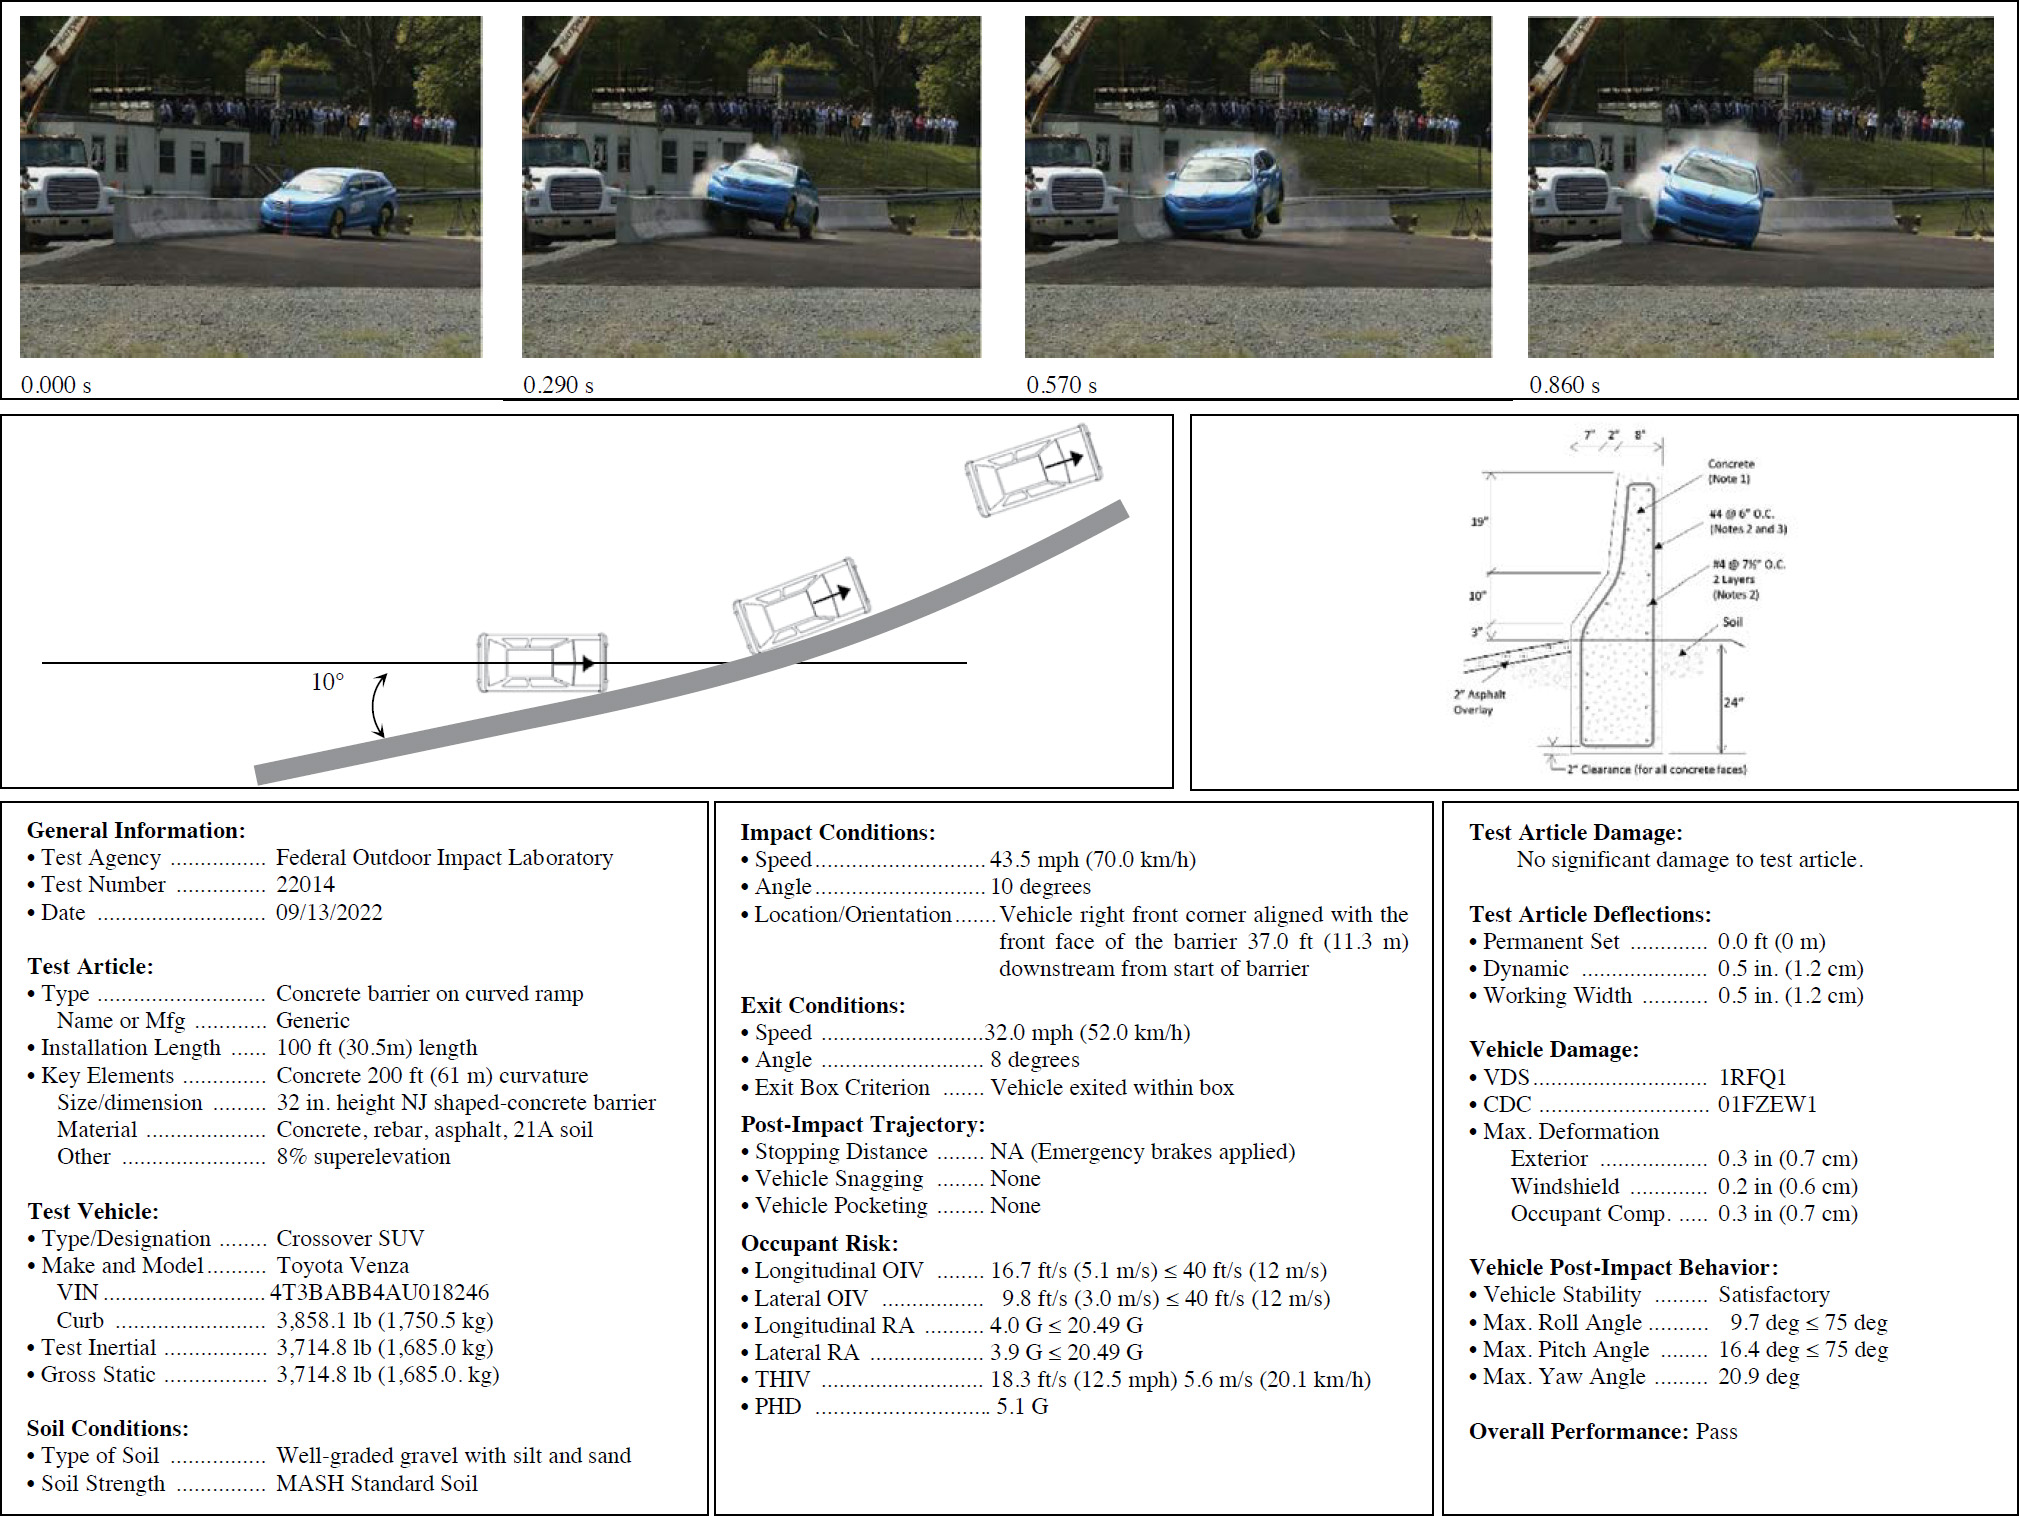
- Test 22014: Crossover SUV vehicle at 70 km/h with a 10-degree angle
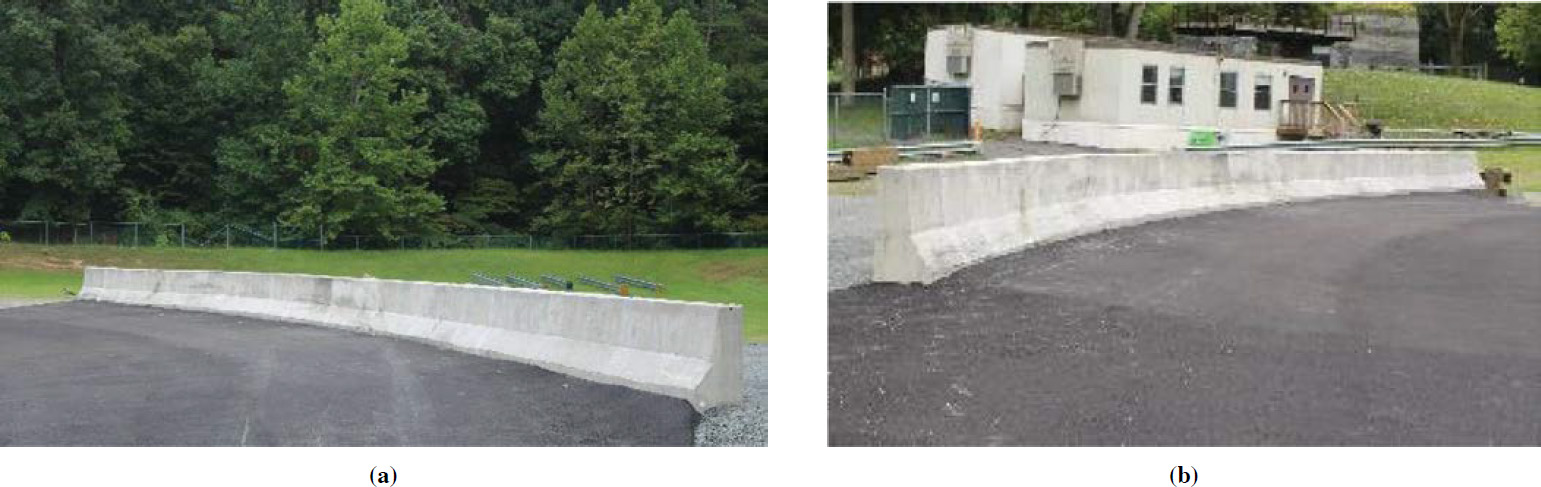
The research team selected the 32-in. concrete barrier installed on a 200-ft radius ramp, 8% superelevation, 0-ft shoulder width, and 8% shoulder angle, on a 0% grade for testing (Figure 34). Based on the computer simulations, this was judged one of the most critical barrier profiles. The same barrier was used for all four tests because of cost limitations. The impact angle was also the same: 10 degrees, for all four tests. The barrier was impacted at 100 km/h by the two TL3 MASH vehicles, 1100C and 2270P. The barrier underwent no damage during these impacts and was used in two additional tests to see the performance at lower speeds (70 km/h). The vehicles used in the last two tests were a mid-size sedan and a larger crossover SUV (Figure 35). Summaries of these tests are included in the next sections.
5.1 Test Article and Installation Details
The test installation consisted of a Jersey concrete barrier, approximately 100-ft long with a 200-ft radius curvature. Figure 36 shows the installation setup with the barrier cross section and the curved, superelevated ramp profile and details. The Jersey safety barrier was 32-in. (813 mm) tall, with an 8-in. (203 mm) top and a 17-in. (432 mm) base barrier. It was oriented such that its back face was parallel to true vertical. The barrier had a 3-in. vertical section at its base, a 10-in. lower sloped surface angled at 55 degrees from the road, and a 19-in. upper sloped surface angled at 84 degrees from the road. The break point of the two sloped surfaces was 13 in. above the pavement.
Figure 36 also depicts the system along the 200-ft radius curvature. The road was superelevated at 8%. This system was fabricated using standard roadside safety hardware elements and fabrication methods. The horizontal longitudinal reinforcement in the barrier was #4 rebars at
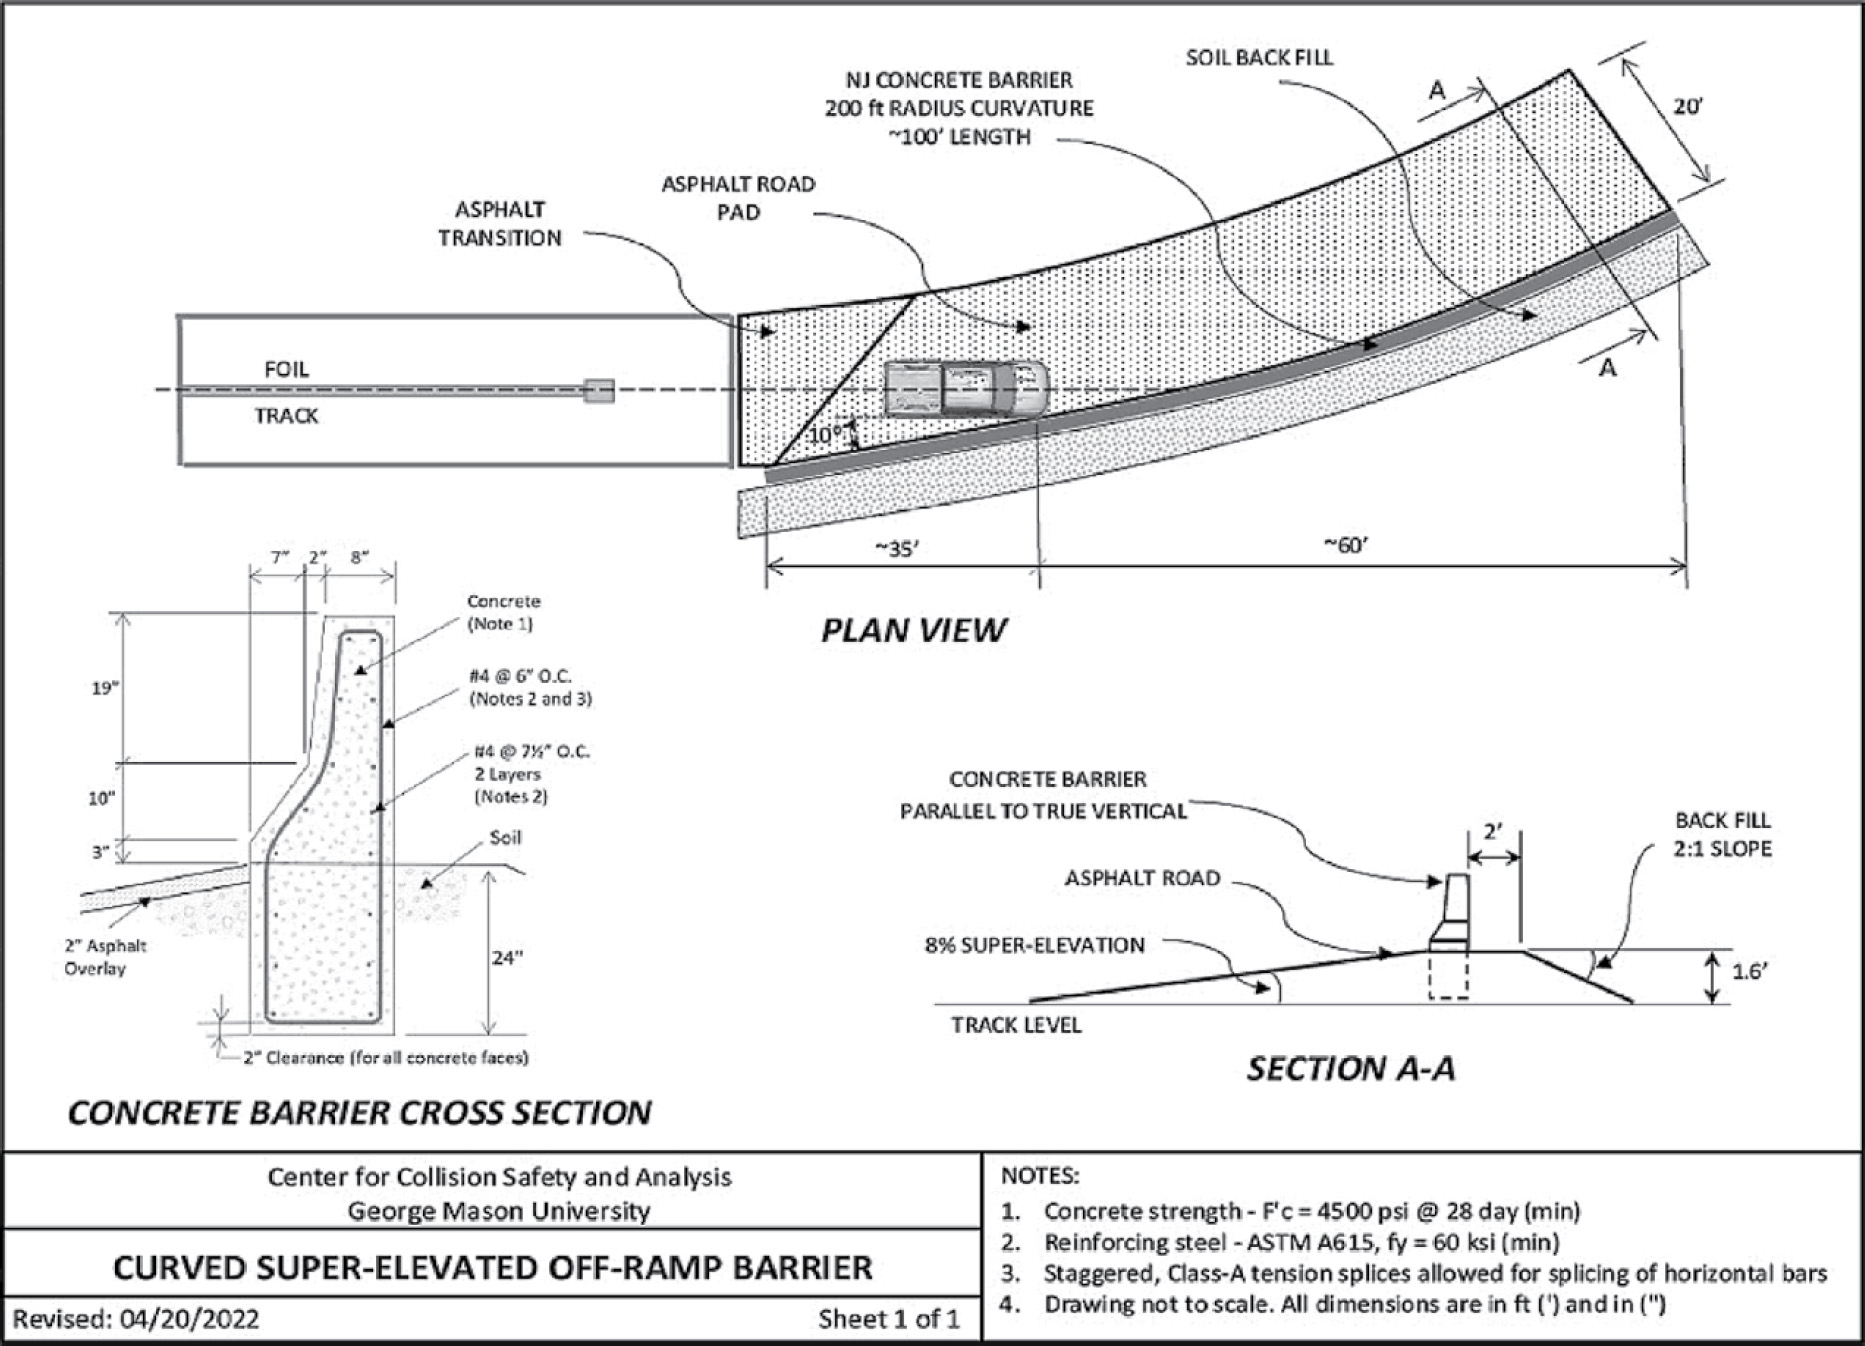
7½ in. on center and the vertical loop shape reinforcement was #4 rebars at 6 in. on center. All reinforcement steel bars were made of ASTM A615 with a 60 ksi minimum strength. A concrete mix with a 28-day minimum strength of 4,500 psi was used for the barrier. The materials and hardware elements delivered met the basic standards in accordance with suppliers or certifications on file at the FHWA Federal Outdoor Impact Lab (FOIL).
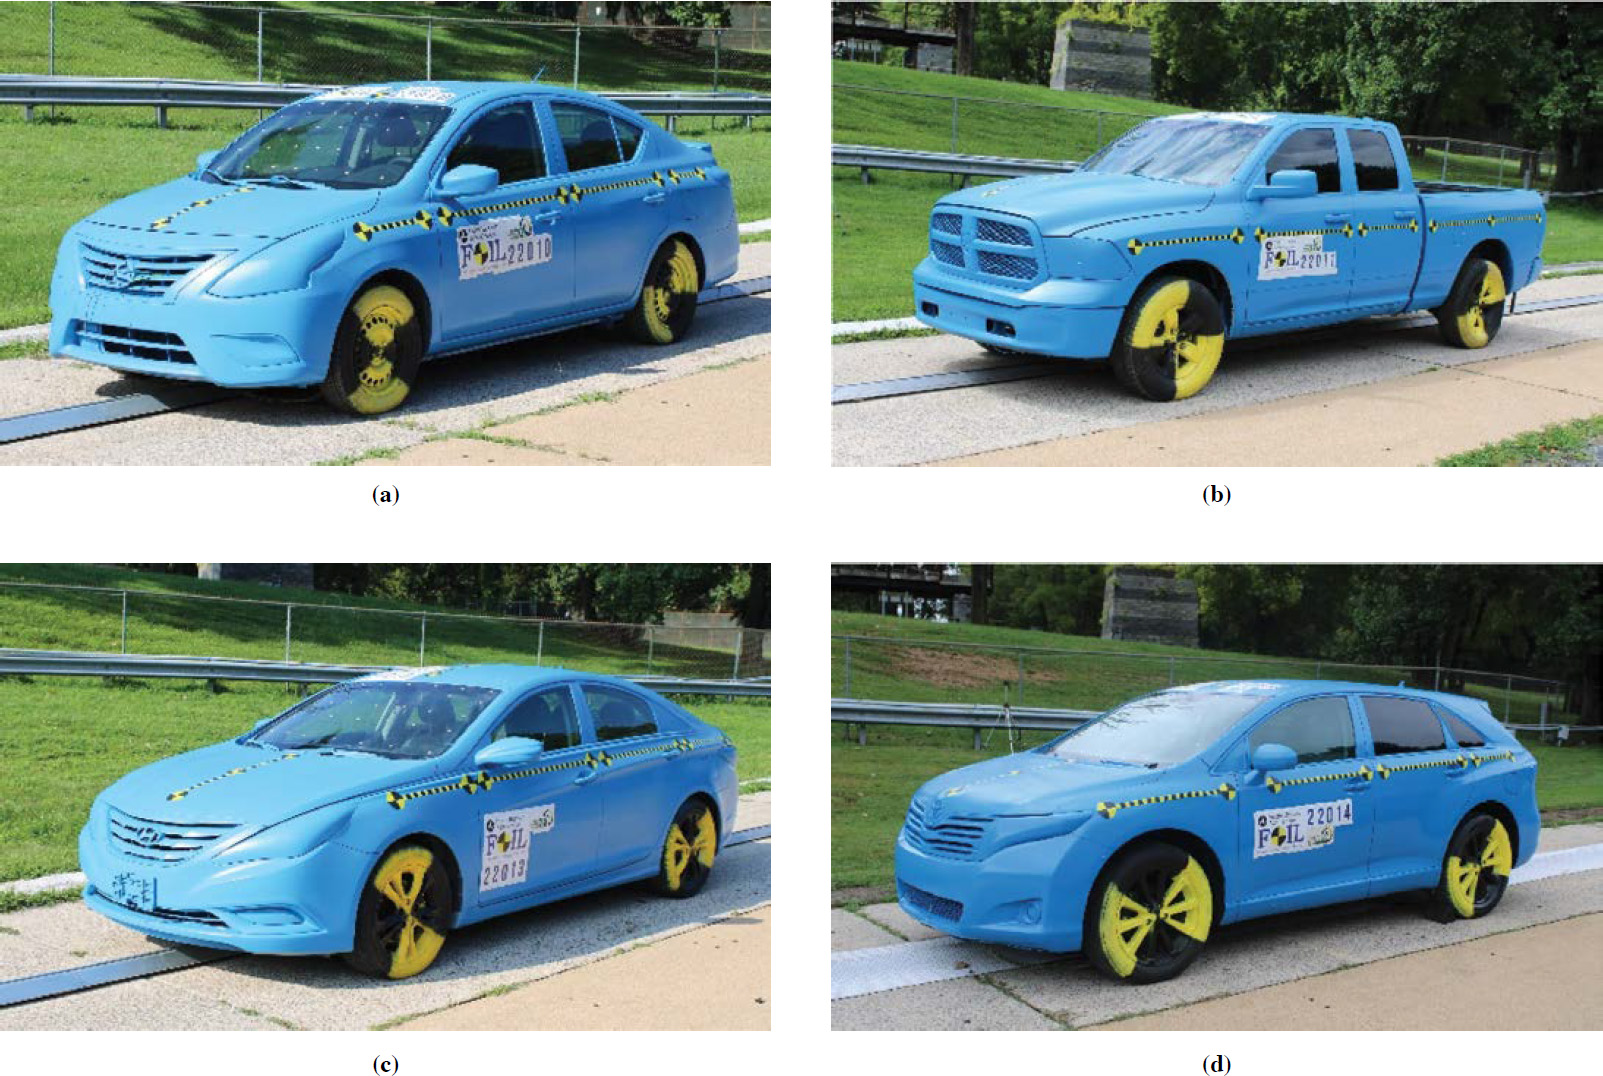
5.2 Test Vehicles
Figure 35 shows photos of the four vehicles used in the four tests. A 2017 Nissan Versa passenger car weighing 2,555.2 lbs was used for Test 22010, a 2014 Ram 1500 quad-cab pickup truck weighing 4,925.1 lbs for Test 22011, a 2012 Hyundai Sonata weighing 3,251.8 lbs for Test 22013, and a 2010 Toyota Venza weighing 3,714.8 lbs for Test 22014. Standard procedures were completed to prepare the vehicle for the test: drain fluids then take accurate measurements of the vehicle, weight, tires, and related features. Vehicles were painted blue to maximize the viewability of the impact outcomes in the multiple video cameras.
5.3 Test Summaries
Four full-scale crash tests were undertaken at FOIL to show that the actual crashes reflected in the simulation analyses represent such events. The conditions tested and rationale are summarized in Table 18. The FOIL team generated a detailed test report for each crash test conducted. These reports document all the pertinent data, descriptions, imagery, and associated evaluations. These four reports are provided in Appendices G through J. Additional details about test setup and the detailed digital and visual results of the tests are available from FOIL and George Mason University’s Center for Collision Safety and Analysis (CCSA). The data derived from the tests and comparisons with the simulation outputs provided a high level of confidence in the accuracy of the simulation analyses.
The tests were set up and performed in accordance with the recommended MASH procedures. High-speed cameras, accelerometers, rate transducers, and speed measuring devices were used to capture the vehicle and barrier responses during the impact. Eight high-speed cameras are typically used for full-scale crash tests. One camera is placed over the impact region to capture an overhead view. Seven additional cameras are placed at locations surrounding the impact region to capture left, right, front, rear, and isometric views of the crash event. Two tri-axial accelerometers were mounted at the vehicle center of gravity to measure the x-, y-, and z-accelerations of the vehicle. This data was used to compute the occupant ride-down acceleration and OIV. Additionally, two tri-axial rate transducers were used to measure the vehicle roll, pitch, and yaw. Contact switches were installed on the vehicle and the test article to synchronize time zero during the impact for the sensor data and high-speed movies.
Further details regarding each test and their respective outcomes are provided in the standard test summary pages presented in Figure 37 to Figure 40. The profile sheets present all the relevant setup and measured values from the tests that closely matched the simulation results. In all cases, the validation crash tests produced the expected outcomes, providing greater credibility to the various simulation efforts described in this chapter. Therefore, the research team was confident that these tests provided credibility to the simulations.
Table 18. Summary of full-scale crash tests.
| Test | Date | Test Purpose | MASH |
|---|---|---|---|
| 22010 | 08/09/22 | Hit CSOR w/small car @ 100 km/h, 10 degrees | Pass |
| 22011 | 08/16/22 | Hit CSOR w/pickup truck @ 100 km/h, 10 degrees | Pass |
| 22013 | 09/01/22 | Hit CSOR w/mid-size car @ 70 km/h, 10 degrees | Pass |
| 22014 | 09/13/22 | Hit CSOR w/crossover SUV@ 70 km/h, 10 degrees | Pass |
5.4 Conclusions
Four tests were conducted to ensure that the results of the simulated crashes were consistent with actual field performance. These tests were carefully selected to represent critical conditions and thereby enhance confidence in the simulation results. Results from these tests matched the simulation results, which reconfirmed the results of the numerical analyses and the matrix of simulations.


