Evaluating the Performance of Longitudinal Barriers on Curved, Superelevated Off-Ramps (2025)
Chapter: 4 Crash Simulation Analyses
CHAPTER 4
Crash Simulation Analyses
The second type of computer simulation used in this research involves finite element crash simulation techniques. In these efforts, specific barriers and vehicles are represented by “finite element” models that represent the basic parts of a barrier and an impacting vehicle. The models can be considered representations of every part in a vehicle or barrier as small three-dimensional cubes that reflect the shape, material, and position or connections to adjacent elements of each part. The geometry, size, shape, and material (and its properties), as well as the connection to the adjacent elements, are defined in building the model. The size of the elements is dictated by the level of detail desired and the available computational capabilities.
Finite element simulation involves tracking the effects of imposing forces on the “elements.” Repeating the process for small units of time allows each force and its effects to reflect the “state of the system” for each unit of time. The properties of the element’s material dictate whether that element moves, deforms, or fractures as a result of the force or forces. For each time increment in the simulation, tracking the movement and conditions of each element leads to a representation of a series of micro-changes that over multiple iterations reflect the crash outcome condition.
The accuracy of the representation of the crash outcomes is determined by the size (and number) of elements and the rigor in defining the object and characterizing its properties and how they react to the effects imposed. It requires “effective representation” (or “computation”) of these transitions over many small increments of time to reflect a representative crash outcome. Several decades of developing this process have achieved high degrees of correlation between an observed crash outcome and the “computer-generated” outcome.
The technologies used in finite element simulations follow the laws of physics, materials science, structural engineering, and the like, such that a post-impact assessment can reveal the efficacy of an item under a given “loading” condition. In the safety realm, this implies the condition of the barrier, the vehicle, and all occupants. Comparisons of simulated and actual crashes of vehicles into barriers have become accurate, and hence the tool has become widely used to analyze various safety performance aspects. It requires that “models” of objects be developed accurately, that users be knowledgeable about effective use of the software functions, and that a powerful computing capability be available. The effort to create models is significant, but the base models can be reused for many studies. Variations in features can be implemented by changing element properties (e.g., different steel or concrete properties). Although computing times for finite element simulations can take much longer than VDA simulations, transfer of models or alterations of properties can be readily used to consider design improvements. The computational intensity in finite element simulations does not, however, make it the best tool for incremental analyses of effects on vehicle paths, as with VDA.
4.1 Crash Simulation Analysis Requirements
Finite element crash computer simulation has advanced in the past 25 years and has proven effective in determining the outcome of vehicle-to-barrier impacts under various deployment scenarios. The aim of crash simulation analysis is to create performance envelopes for longitudinal barriers installed on CSORs. The first part of the project involved adapting, developing, and validating models for roadside hardware devices and vehicles, allowing for the evaluation of different highway safety treatments for specific CSOR conditions. The following section summarizes the efforts made to determine the relative effectiveness of various types of barriers for CSOR situations, given that the geometry and conditions of these situations can significantly affect the treatment’s effectiveness. The focus of this effort was to determine whether safety requirements would be met in these situations.
4.1.1 Roadside Barrier Models
The first step involved adapting the computer models of the roadside hardware devices from NCHRP Project 22-29A to address this project’s objectives. Several longitudinal barrier models have been developed over the years and validated through full-scale crash tests (e.g., modified G4(1S) guardrail, Thrie beam guardrail, MGS guardrail, portable and median concrete barriers with different shapes). Models developed and validated under the previous part of the project and the tools created to generate the barriers with various curvatures and slopes were updated in this part of the project for generating the CSOR models and conducting simulations. Figure 15 illustrates variations of one barrier model, the New Jersey concrete barrier, with different radii. Figure 16 shows W-beam, Thrie beam, and concrete longitudinal barrier models adapted to reflect the ramp curvature and evaluate the barriers’ performances under different impact conditions on CSORs.
4.1.2 Vehicle Models
To simulate the longitudinal barriers’ performance when placed on CSORs, digital models of the impacting objects (i.e., vehicles) are required to simulate impacts with models of the barriers. Although an array of vehicle models is available, the ones representing MASH test vehicles were the primary focus in this study. For the MASH Test Level 3 and 4 (TL3/TL4) impact conditions, the three test vehicles recommended are the 1100C passenger car, the 2270P pickup, and the 10000S single-unit truck (SUT). These models have been widely used for finite element analyses to evaluate the safety performance of roadside barriers (30–35). The simulations considered three typical vehicles for crash analyses, as shown in Table 10, representing TL3/TL4 standard vehicles.
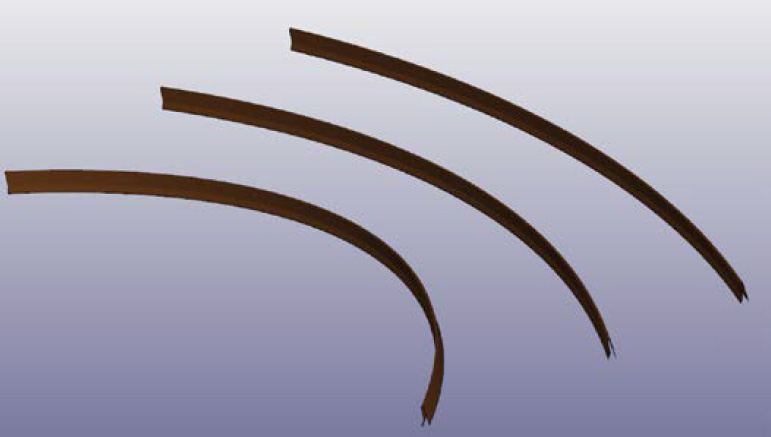
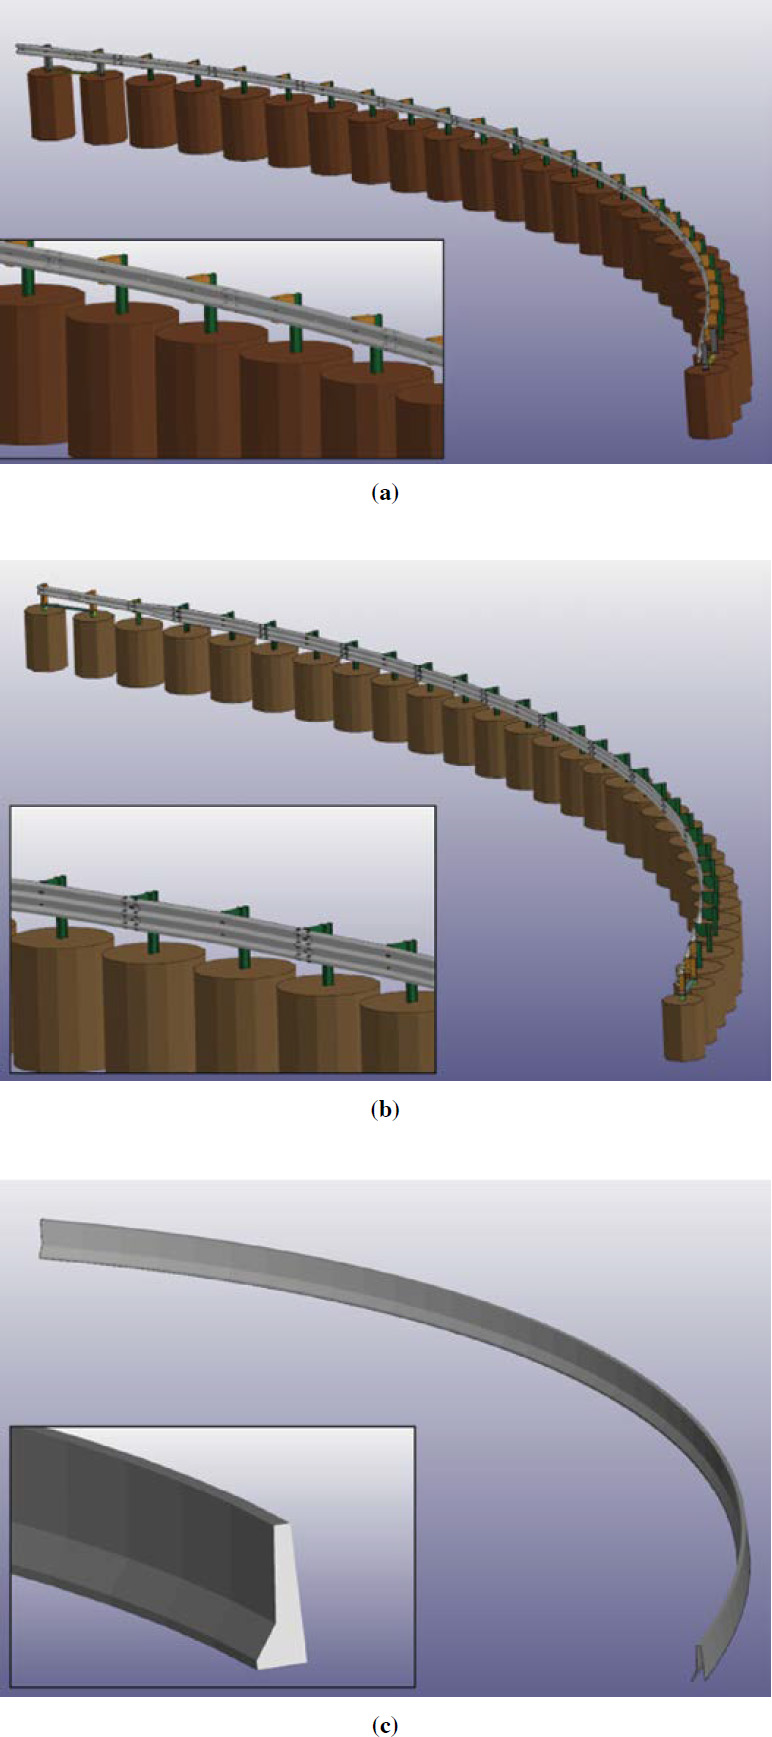
Table 10. Models representing MASH test vehicles.
| Description | Vehicle Image |
|---|---|
2010 Toyota Yaris
|
 |
2007 Chevrolet Silverado Pickup Truck
|
 |
10000S SUT Ford F800
|
 |
NOTE: CG = center of gravity.
4.1.3 Computer Model Validations
Model validation involves simulating a known crash test and comparing the results. A solid validation effort provides confidence that reasonable variations of the model to reflect other situations will yield representative results. For this effort, multiple validations for each barrier were selected for analysis. These validations made use of the best available crash test data that existed at the time of the analysis. Table 11 lists the crash tests used for the model validations.
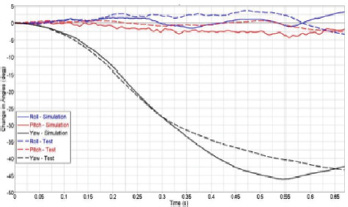
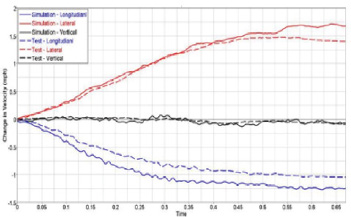
A rigorous verification and validation (V&V) effort was undertaken to provide confidence that the models for each of the three barriers are viable in replicating crashes into barriers on CSRSs. The results from the eight comparisons are summarized to provide an opportunity to review the viability or strengths of the validations based on the V&V results. A summary of the validation efforts is provided in Table 12, which includes the graphic of vehicle roll, pitch, and yaw angular rotations and the change in vehicle velocity along the x-, y-, and z-directions.
V&V analytic comparisons for all seven validation cases were also undertaken based on NCHRP Report 179: Evaluating Options in Statewide Transportation Planning/Programming Issues, Techniques, and Their Relationships (45), and Roadside Safety Verification and Validation Program (RSVVP) tables and phenomena importance ranking tables (PIRTs) were generated. Sample V&V results are included in the next sections. Full V&V reports for each of the seven cases selected are provided in Appendix C of NCHRP Research Report 894 (3).
Table 11. Full-scale crash tests used for validations.
| Barrier | Vehicle | Test | Date | Place | Evaluation | Ref. |
|---|---|---|---|---|---|---|
| NJ Shaped Concrete | 2002 Kia Rio | 2214NJ-1 | 5/28/04 | MwRSF | MASH | (36) |
| 2007 Silverado | 476460-1-4 | 1/10/09 | TTI | MASH | (37) | |
| G4(1S) | 1989 C2500 | 405421-1 | 11/16/95 | TTI | 350 | (38) |
| 2002 Dodge Ram | 2214WB-2 | 4/08/05 | MwRSF | MASH | (39) | |
| MGS | 2002 Kia Rio | 2214MG-3 | 11/08/04 | MwRSF | MASH | (40) |
| 1994 Geo Metro | NPG-1 | 6/29/01 | MwRSF | 350 | (41) | |
| 2002 Dodge Ram | 2214MG-2 | 8/20/01 | MwRSF | MASH | (42) | |
| Florida Jersey Concrete | 1995 Ford F800 | 421323-1 | 2/18/03 | TTI | 350 | (43) |
| Texas DOT 36-in. Concrete | 1995 Ford F800 | 469467-1-1 | 8/15/17 | TTI | MASH | (44) |
NOTE: MwRSF = Midwest Roadside Safety Facility; TTI = Texas A&M Transportation Institute.
Table 12. Summary of validation results for change in vehicle velocities and rotations.
| Test | Model Setup | Angular Rotations | Change in Velocity |
|---|---|---|---|
| MGS w/ Dodge Ram 2270P | 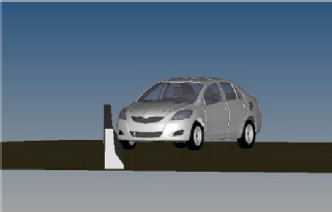 |
 |
 |
| MGS w/ Kia Rio 1100C | 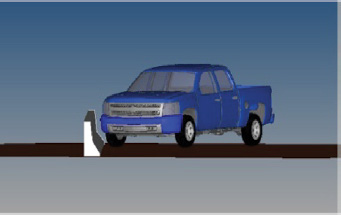 |
 |
 |
| MGS w/ Geo Metro 820C | 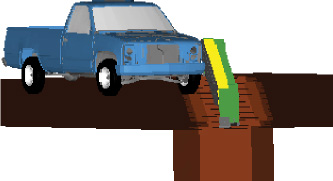 |
 |
 |
| G4(1S) w/ Dodge Ram 2270P | 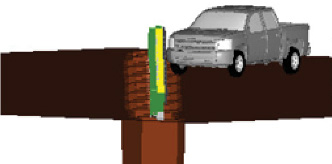 |
 |
 |
| G4(1S) w/ C2500 2000P | 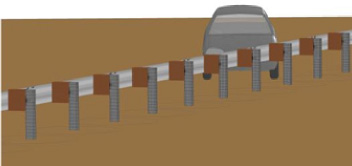 |
 |
 |
| NJ Concrete Barrier w/ Silverado 2270P | 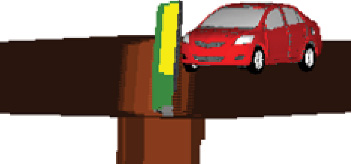 |
 |
 |
| NJ Concrete Barrier w/ Kia Rio 1100C | 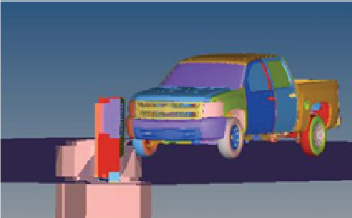 |
 |
 |
| Test | Model Setup | Angular Rotations | Change in Velocity |
|---|---|---|---|
| Texas DOT 36-in. Vertical Wall Concrete Barrier w/ F800 (10000S) | 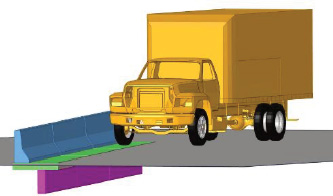 |
 |
 |
| Florida Jersey Bridge Rail Barrier w/F800 (8000S) | 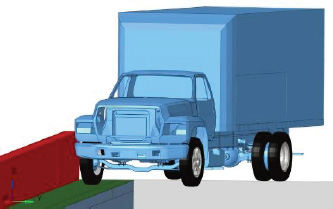 |
 |
 |
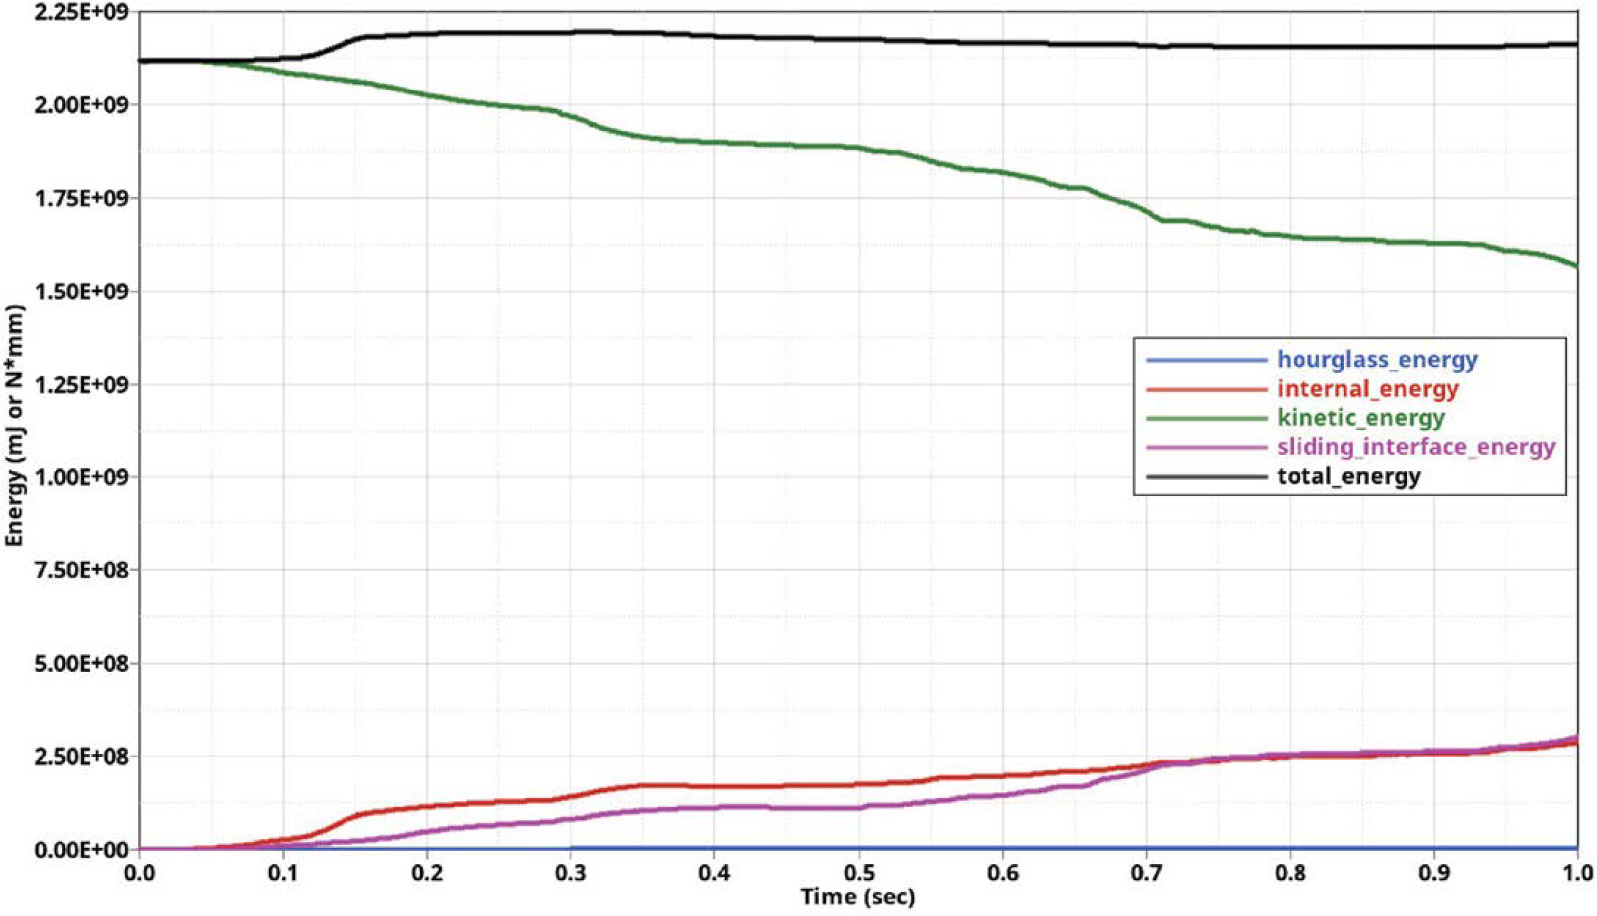
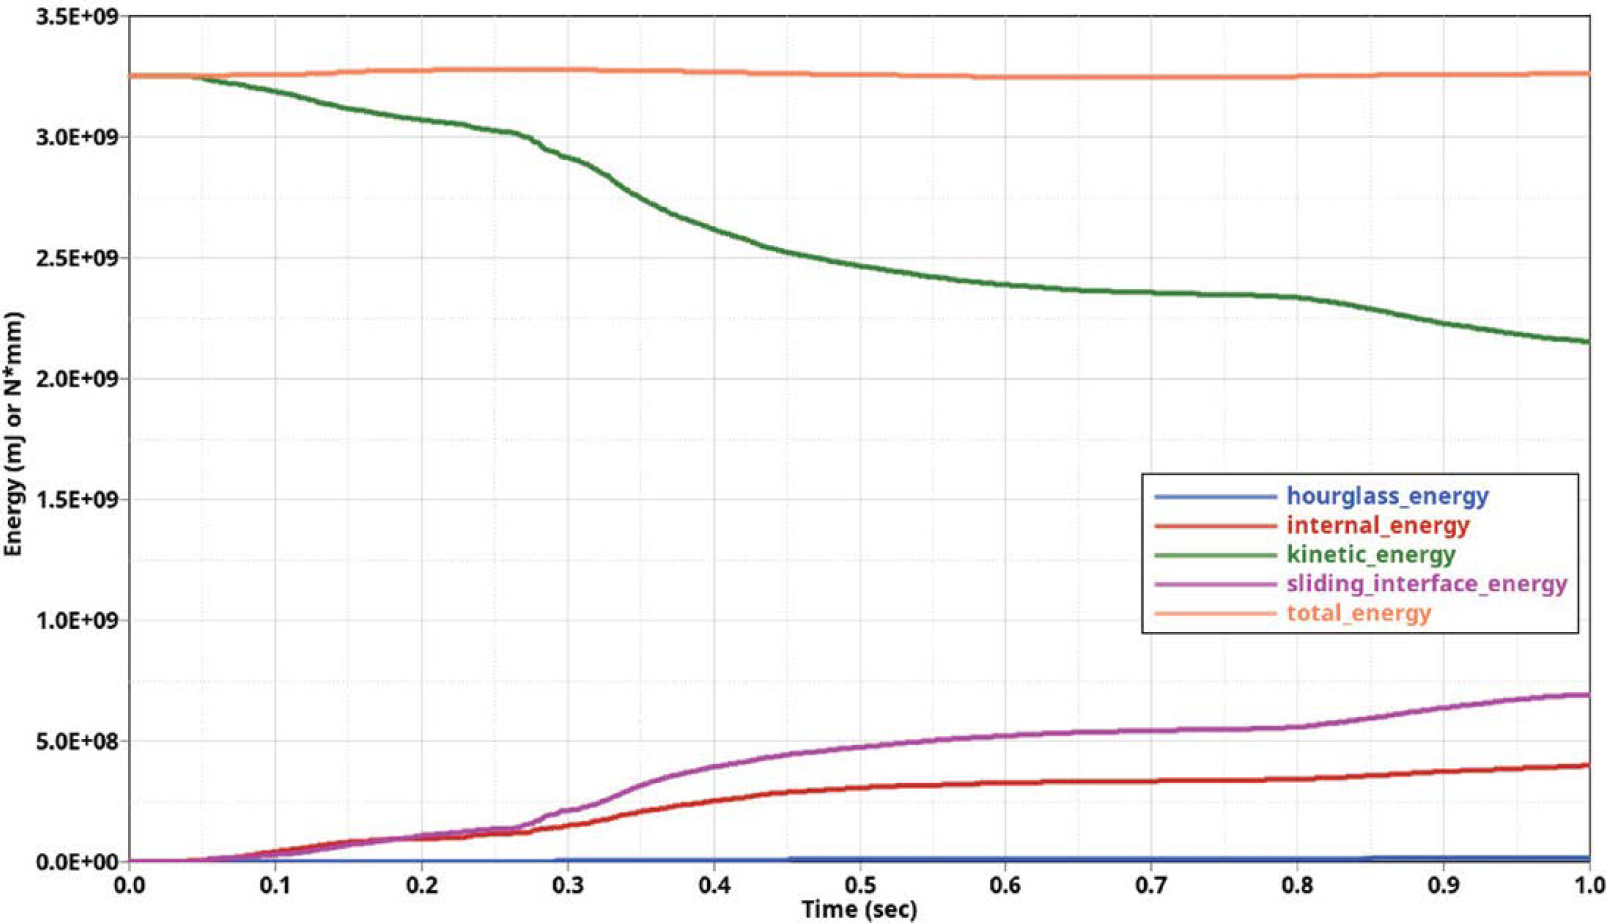
The validity of the models was assessed by analyzing the distribution of energy associated with the crash event. The laws of physics dictate that the total energy is balanced. Typically, an energy balance graph is generated to assess changes in kinetic, internal, sliding, hourglass, and total energy. All of the comparisons were characterized in the following manner:
- Relatively constant energy balances were noted, suggesting that there are no unusual characterizations in the structure of the model that would be an unrealistic sink (point of dissipation) of the energy.
- The kinetic energy associated with the motion of the vehicle dropped off as the velocity was decreased during the crash.
- Internal energy increased as components of the vehicle absorbed energy through deformation.
- Sliding energy, which is associated with the friction between the vehicle and barrier, increased as expected during the simulations.
All V&V criteria for energy balance were met. These aspects led to the conclusion that the model met the fundamental requirements for crash simulation.
The RSVVP procedure consists of applying statistical tests to determine how well the simulation curves compare with data collected from the test. Various means of comparing the data are shown in each comparison, including:
- Time history plot: The red line indicates the simulated data, and the blue line indicates the test data for the crash event. Each data point is a measure of the acceleration recorded.
- Plot of integrated time histories: Integrating the change of acceleration data allows the changes in velocity to be plotted. A general decrease in velocity is noted, as expected, although some deviation exists between the test and the simulation after the impact.
- MPC metrics: This statistical metric provides a measure of “goodness of fit” between the two curves. Three parameters are used for the evaluation: the magnitude (M), phase (P), and comprehensive (C, combined magnitude and phase). A value of less than 40 for M, P, and C is considered passing the criteria.
- ANOVA metrics: Analysis of variance is also used to compare the test and simulation curves’ “goodness of fit.” Two parameters are used for the comparison: the average residual between the curves and the standard deviation of the residuals. Values of less than 5% for the average residual and 35% for the standard deviation are considered to pass the criteria. In the NCHRP Research Report 894 example, the metric meets the criteria, and hence the boxes are labeled “pass” (3).
- Residual plots (time history, histogram, and cumulative): These plots show the residual (i.e., the difference between the two curves in different forms). In the first plot, time history, the residual is shown versus time. In the second, the residual is shown in a histogram format in which the percentage of the residual is plotted against the percentage of its occurrence. In the third plot, the cumulative sum of residuals is plotted.
The program allows various types of single-channel data to be analyzed. The common crash test and simulation metrics compared are:
- x-acceleration: change in acceleration in the original direction of travel of the vehicle.
- y-acceleration: change in acceleration in the lateral direction of travel of the vehicle.
- z-acceleration: change in acceleration in the vertical direction of travel of the vehicle.
- Yaw rate: rate of change in the original direction of travel of the vehicle.
- Roll rate: rate of change in the lateral direction of travel of the vehicle.
- Pitch rate: rate of change in the vertical direction of travel of the vehicle.
Because not all measurements have the same importance in the tests (e.g., in some tests, little roll, pitch, x-acceleration, etc., are observed), these low-magnitude channels could fail the evaluation metrics even if the simulation were valid. A multi-channel comparison, in which each channel is given a weighting factor based on magnitude, is incorporated into the validation process to address the issue. These weights are used to determine the importance of each channel in the overall comparison of the two sets of data (test and simulations).
In addition to the RSVVP evaluations, PIRTs based on NCHRP Report 179 V&V procedures (45) were created to compare other aspects of the impact, such as occupant risk numbers, barrier maximum deflections, and rotations. Full V&V reports in accordance with NCHRP Report 179 were generated for each validation case. These validation reports are included in Appendix C. Summaries from two of these validation cases, which were used for calibrating the SUT, are included in the following sections.
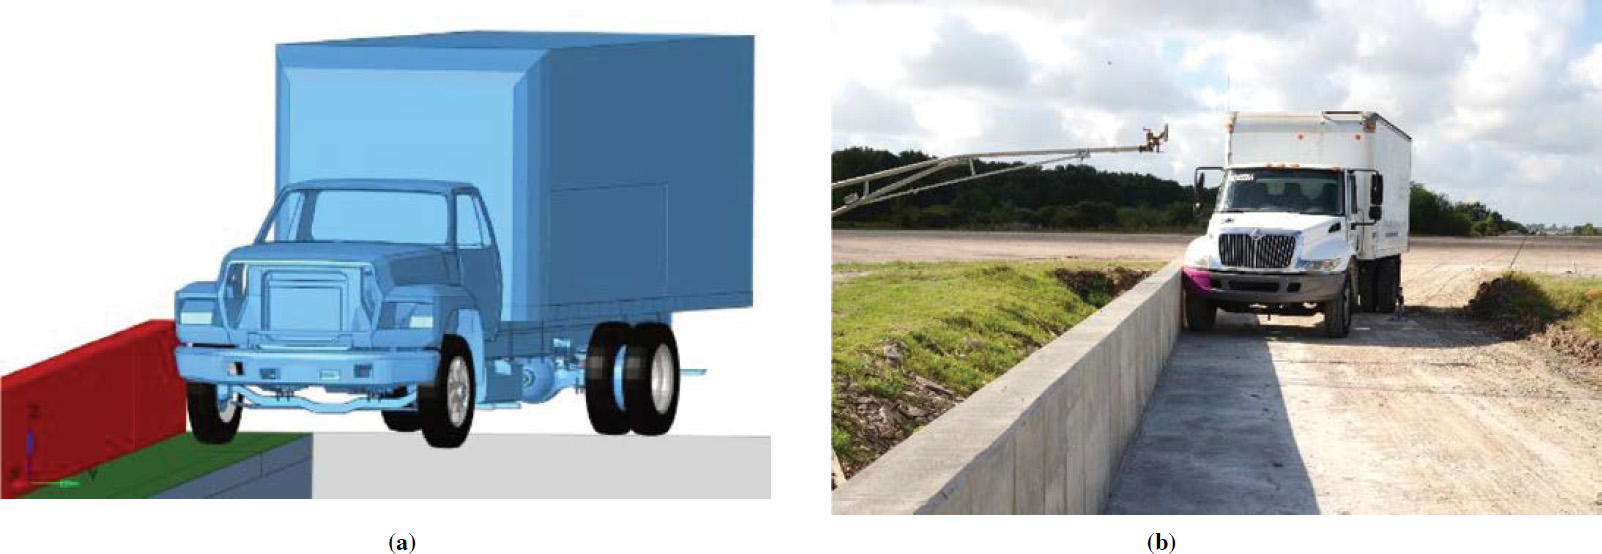
4.1.3.1 Validation for Florida Jersey Bridge Barrier Using NCHRP Report 350 TL 4-12
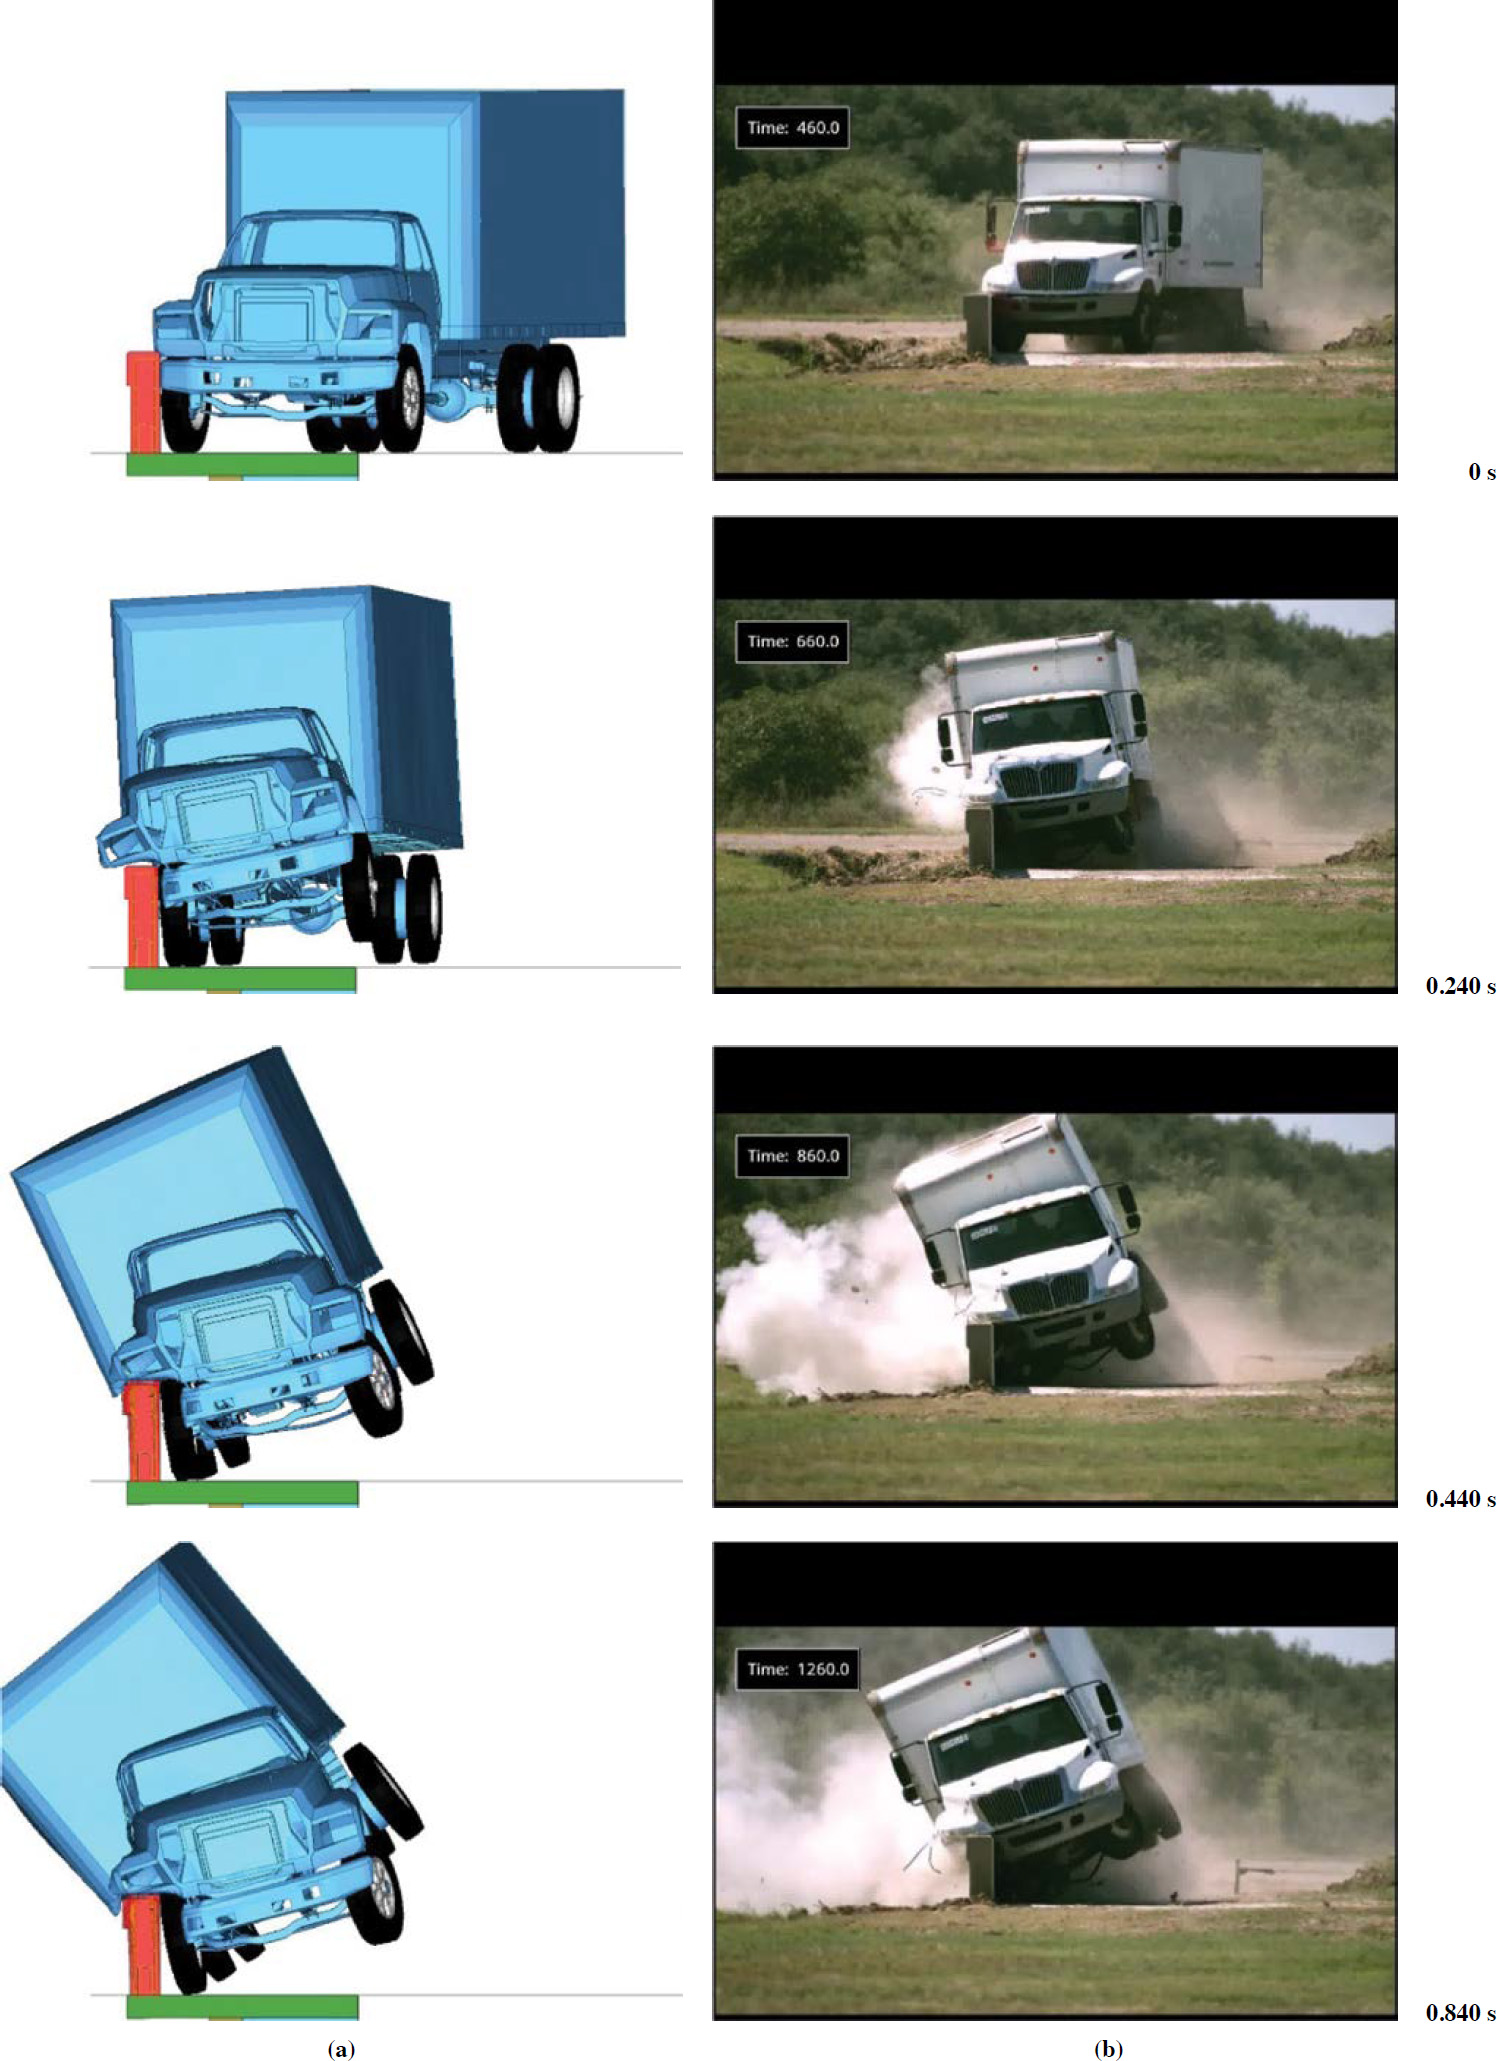
The first test used for SUT model validation is from NCHRP Report 350 (8), Test Level 4-12, conducted by the Texas A&M Transportation Institute (TTI). The barrier used is the FL-J-BR system. In this test (Test 421323-1), a GMC Sierra 7000 SUT (8000S) impacted the barrier at a 14.3-degree angle and a speed of 50.6 mph (43). The setup details for this test are noted in Figure 17. This test was simulated using the finite element model of the FL-J-BR barrier and a Ford F800 SUT (representing the 8000S single-unit truck test vehicle).
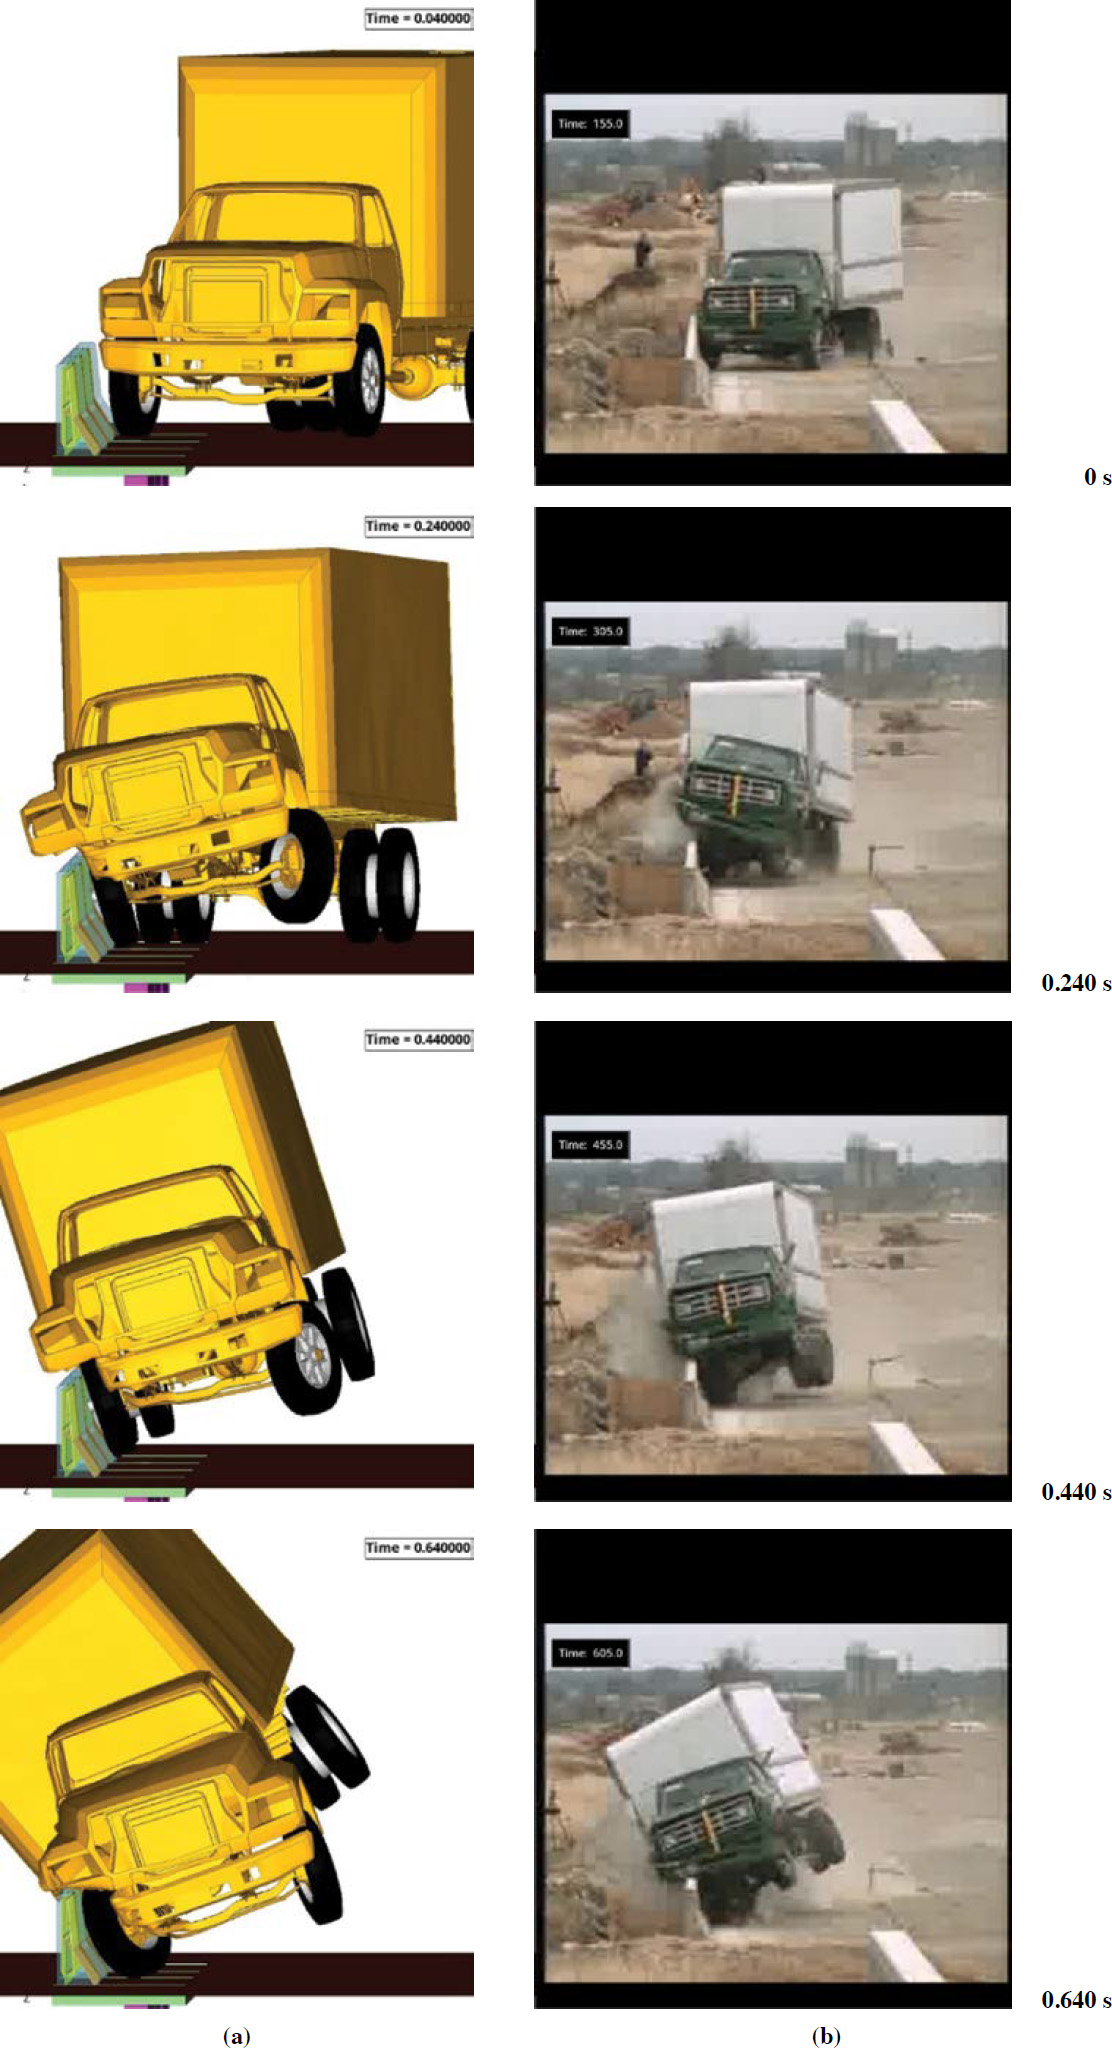
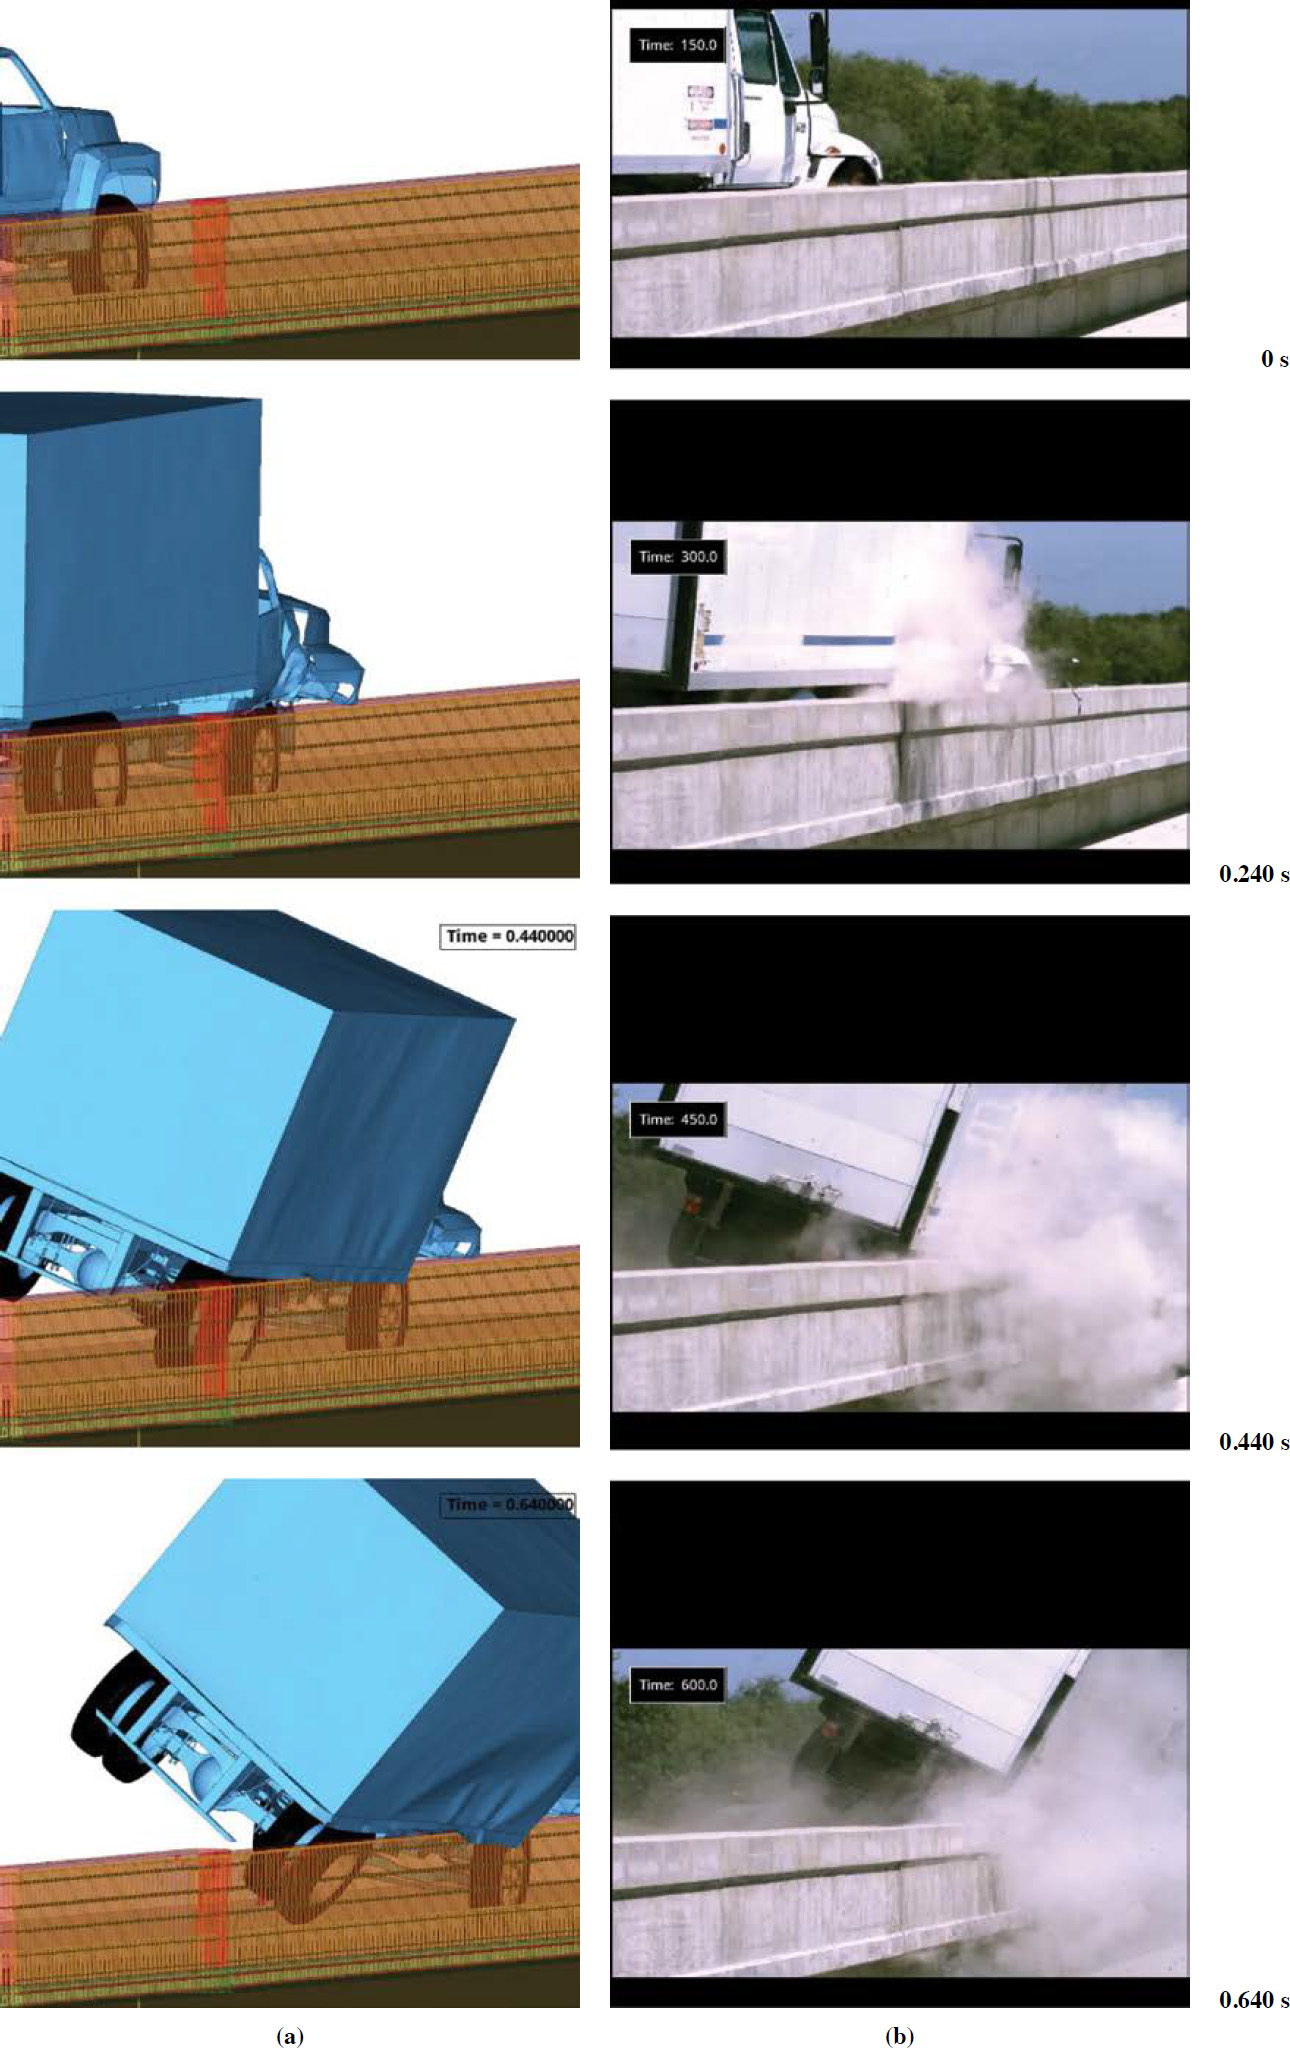
The sequential side-by-side views in Figure 18, Figure 19, and Figure 20 show that the SUT impacted the barrier and maintained contact as its velocity decreased and it was redirected. In the front view (Figure 18), it can be noted that vehicles behave similarly between the simulation and the crash test impact. Vehicle pitch and yaw are similar in the test and simulation, but the vehicle roll angles are slightly off in the simulation because the front axle in the model did not fail, as happened in the test. In the overhead view (Figure 20), the vehicle yaw is similar in both the test and the simulation. These are considered to reflect a good correlation between the test and the simulation of it.
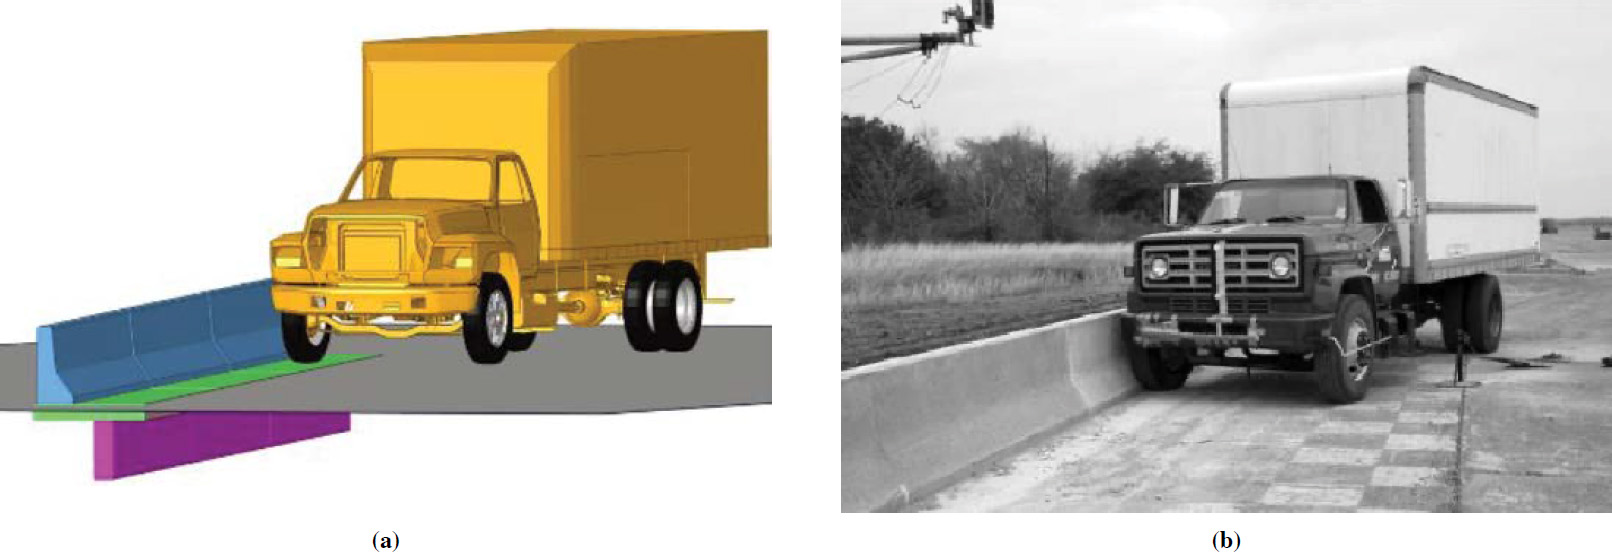
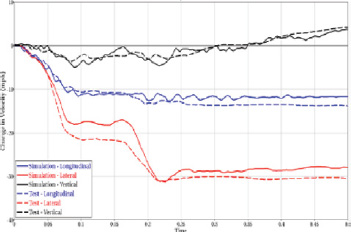
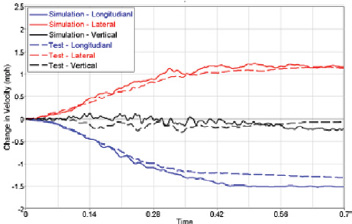
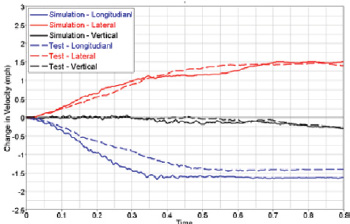
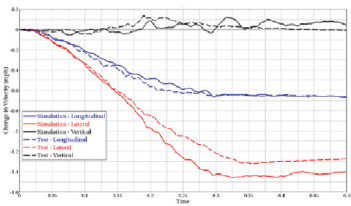
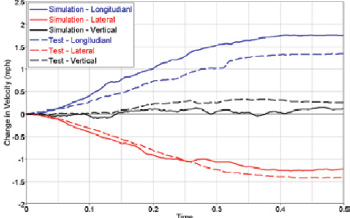
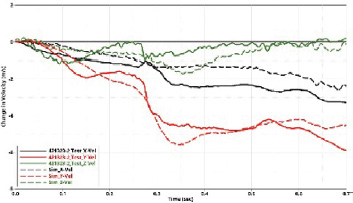
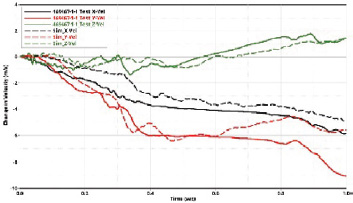
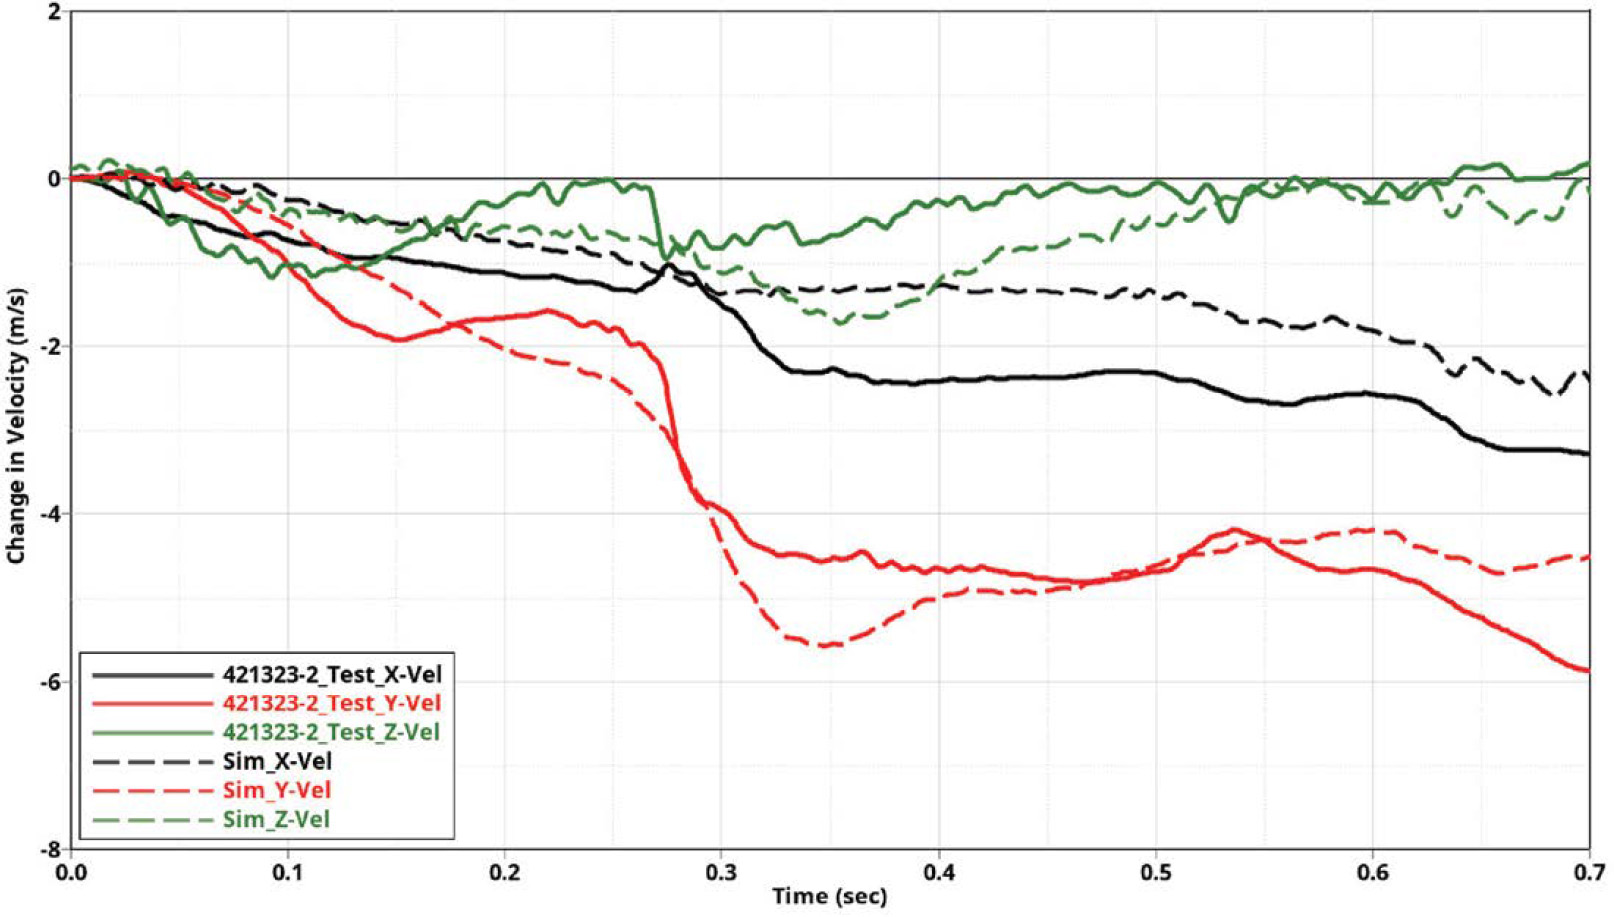
Figure 21 provides the energy balance diagram for the simulation. It depicts a balance of internal and sliding interface (contact) energy to offset the kinetic energy. The figure indicates no unusual effects, suggesting that the model functioned as expected in the simulation. A graphical comparison of the change in velocity of the SUT ballast center of gravity, as derived from the accelerometers installed on the truck, is provided in Figure 22. On the graph, the solid lines indicate the changes in velocity for the x-, y-, and z-axes from the crash tests. The corresponding velocities for the simulation are shown by the dashed lines. Little difference exists in the velocities for the x-, y- and z-axes, as noted by the similar tracks for each metric. These are considered to indicate good correlation between the test and simulation results because the movement of the vehicle at the center of gravity was effectively replicated by the computer model.
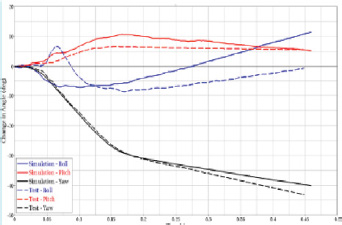
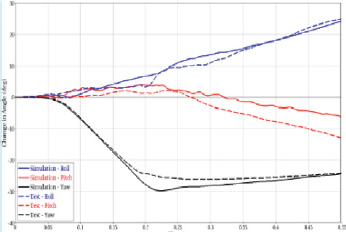
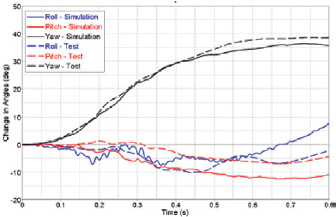
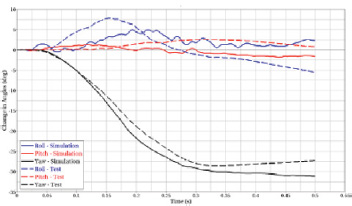
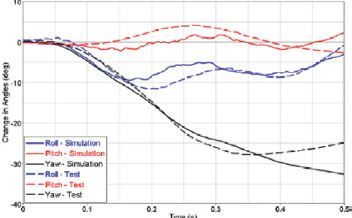
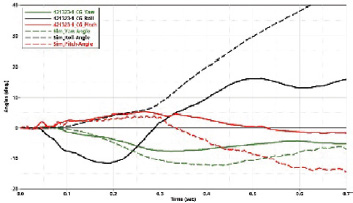
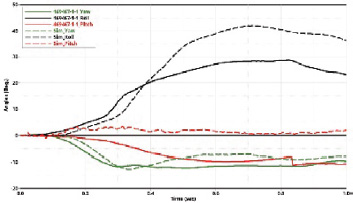
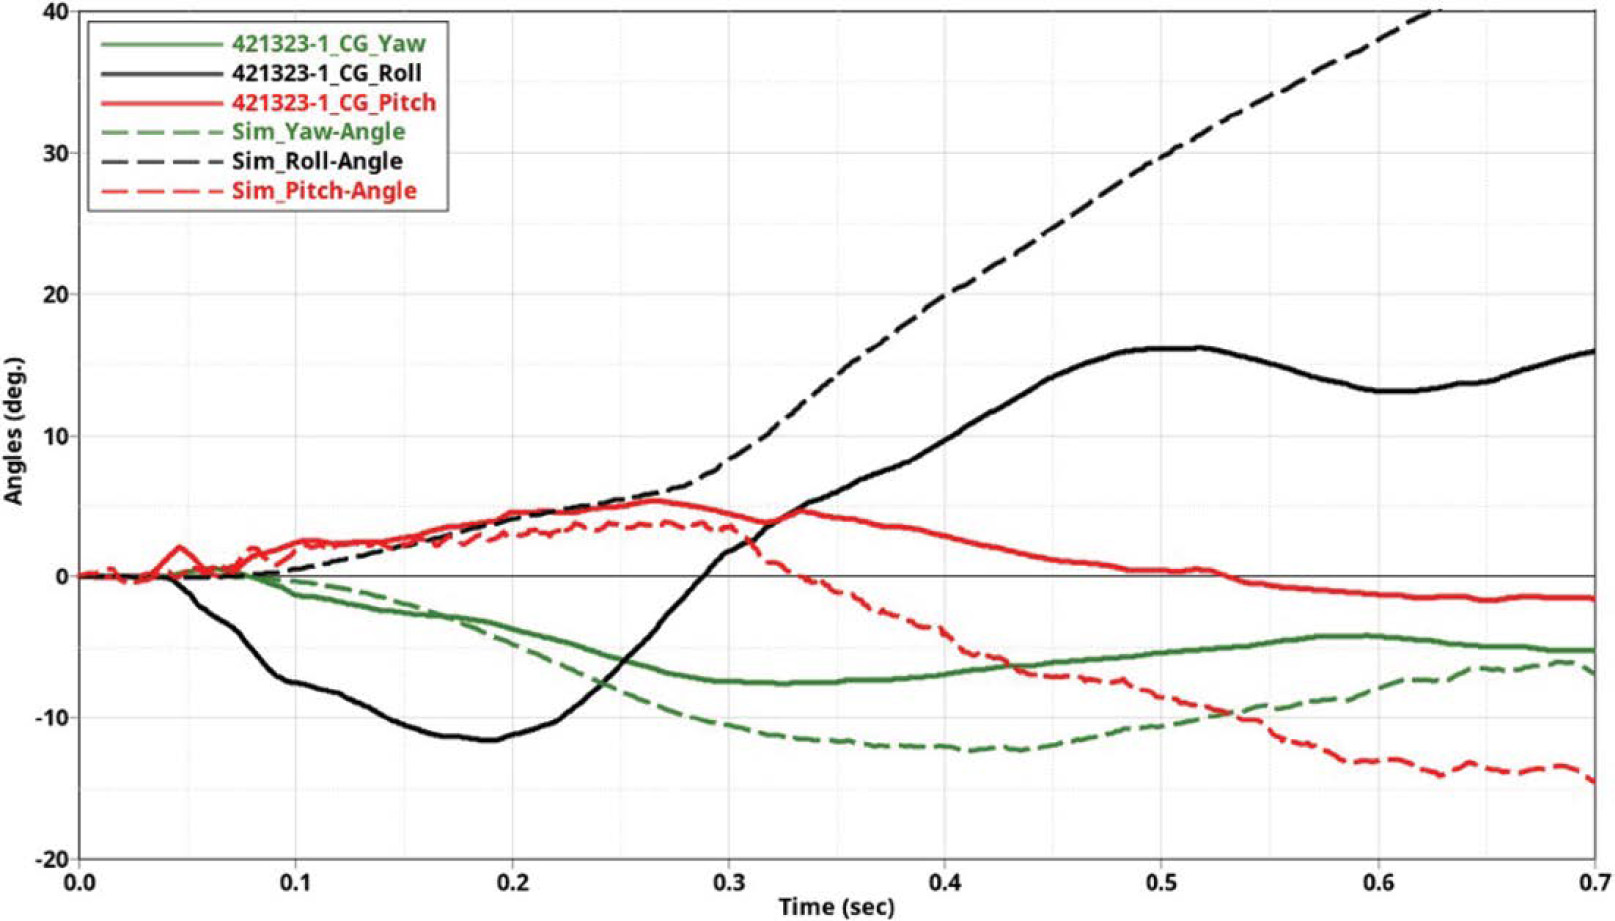
Figure 23 shows the changes in the roll, pitch, and yaw of the SUT between the test and the simulation. The plot indicates a close correlation of the pitch (red solid and dashed lines) and yaw (green solid and dashed lines). The roll (black solid and dashed lines) angles show some differences because the SUT front axle failed in the test. These results are considered to indicate good correlations between the test and the simulations using the finite element models.
V&V analytical comparisons of these results were undertaken based on NCHRP Report 179 (45). RSVVP tables and PIRTs were generated. The metrics derived from the RSVVP procedure are summarized in Figure 24 for multi-channel analyses. V&V comparisons and the full V&V report are provided in Appendix C. The overall results confirm that the simulation is considered validated based on the multiple listed comparison steps and the justifications included in the tables.
4.1.3.2 Validation for Texas DOT 36-in. Vertical Wall Barrier MASH TL 4-12
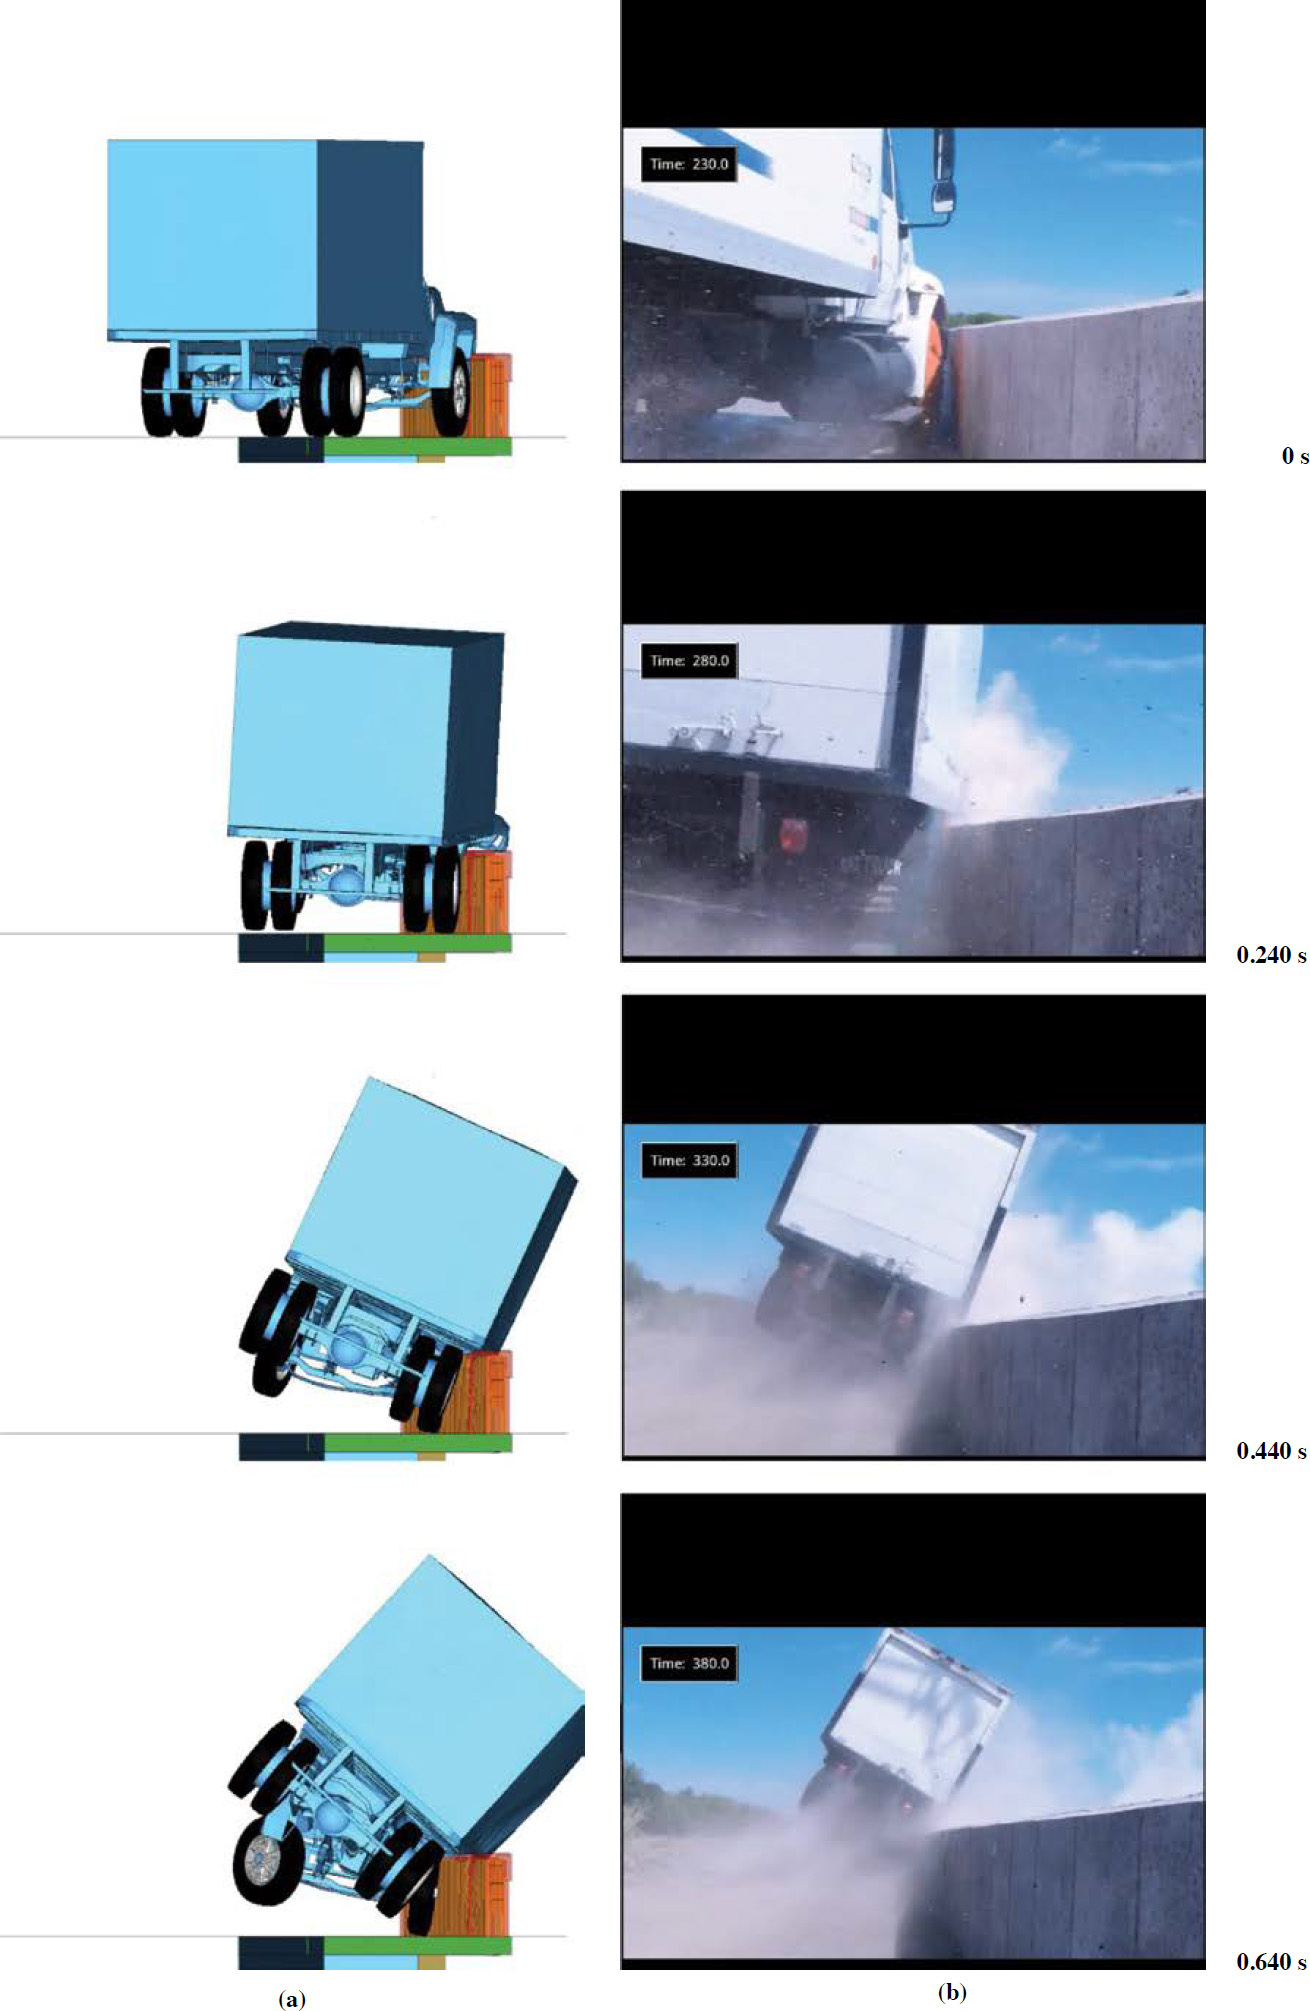
A MASH TL 4-12 was conducted by TTI to show that the Texas DOT 36-in. vertical wall barrier meets MASH requirements. In TTI Test 469467-1-1, an International 4200 SUT 10000S impacted the barrier at a 15-degree angle and a speed of 56 mph (44). The setup details for this test are noted in Figure 25. This test was simulated using the finite element model of the FL-J-BR barrier and a Ford F800 SUT (representing the 10000S test vehicle).
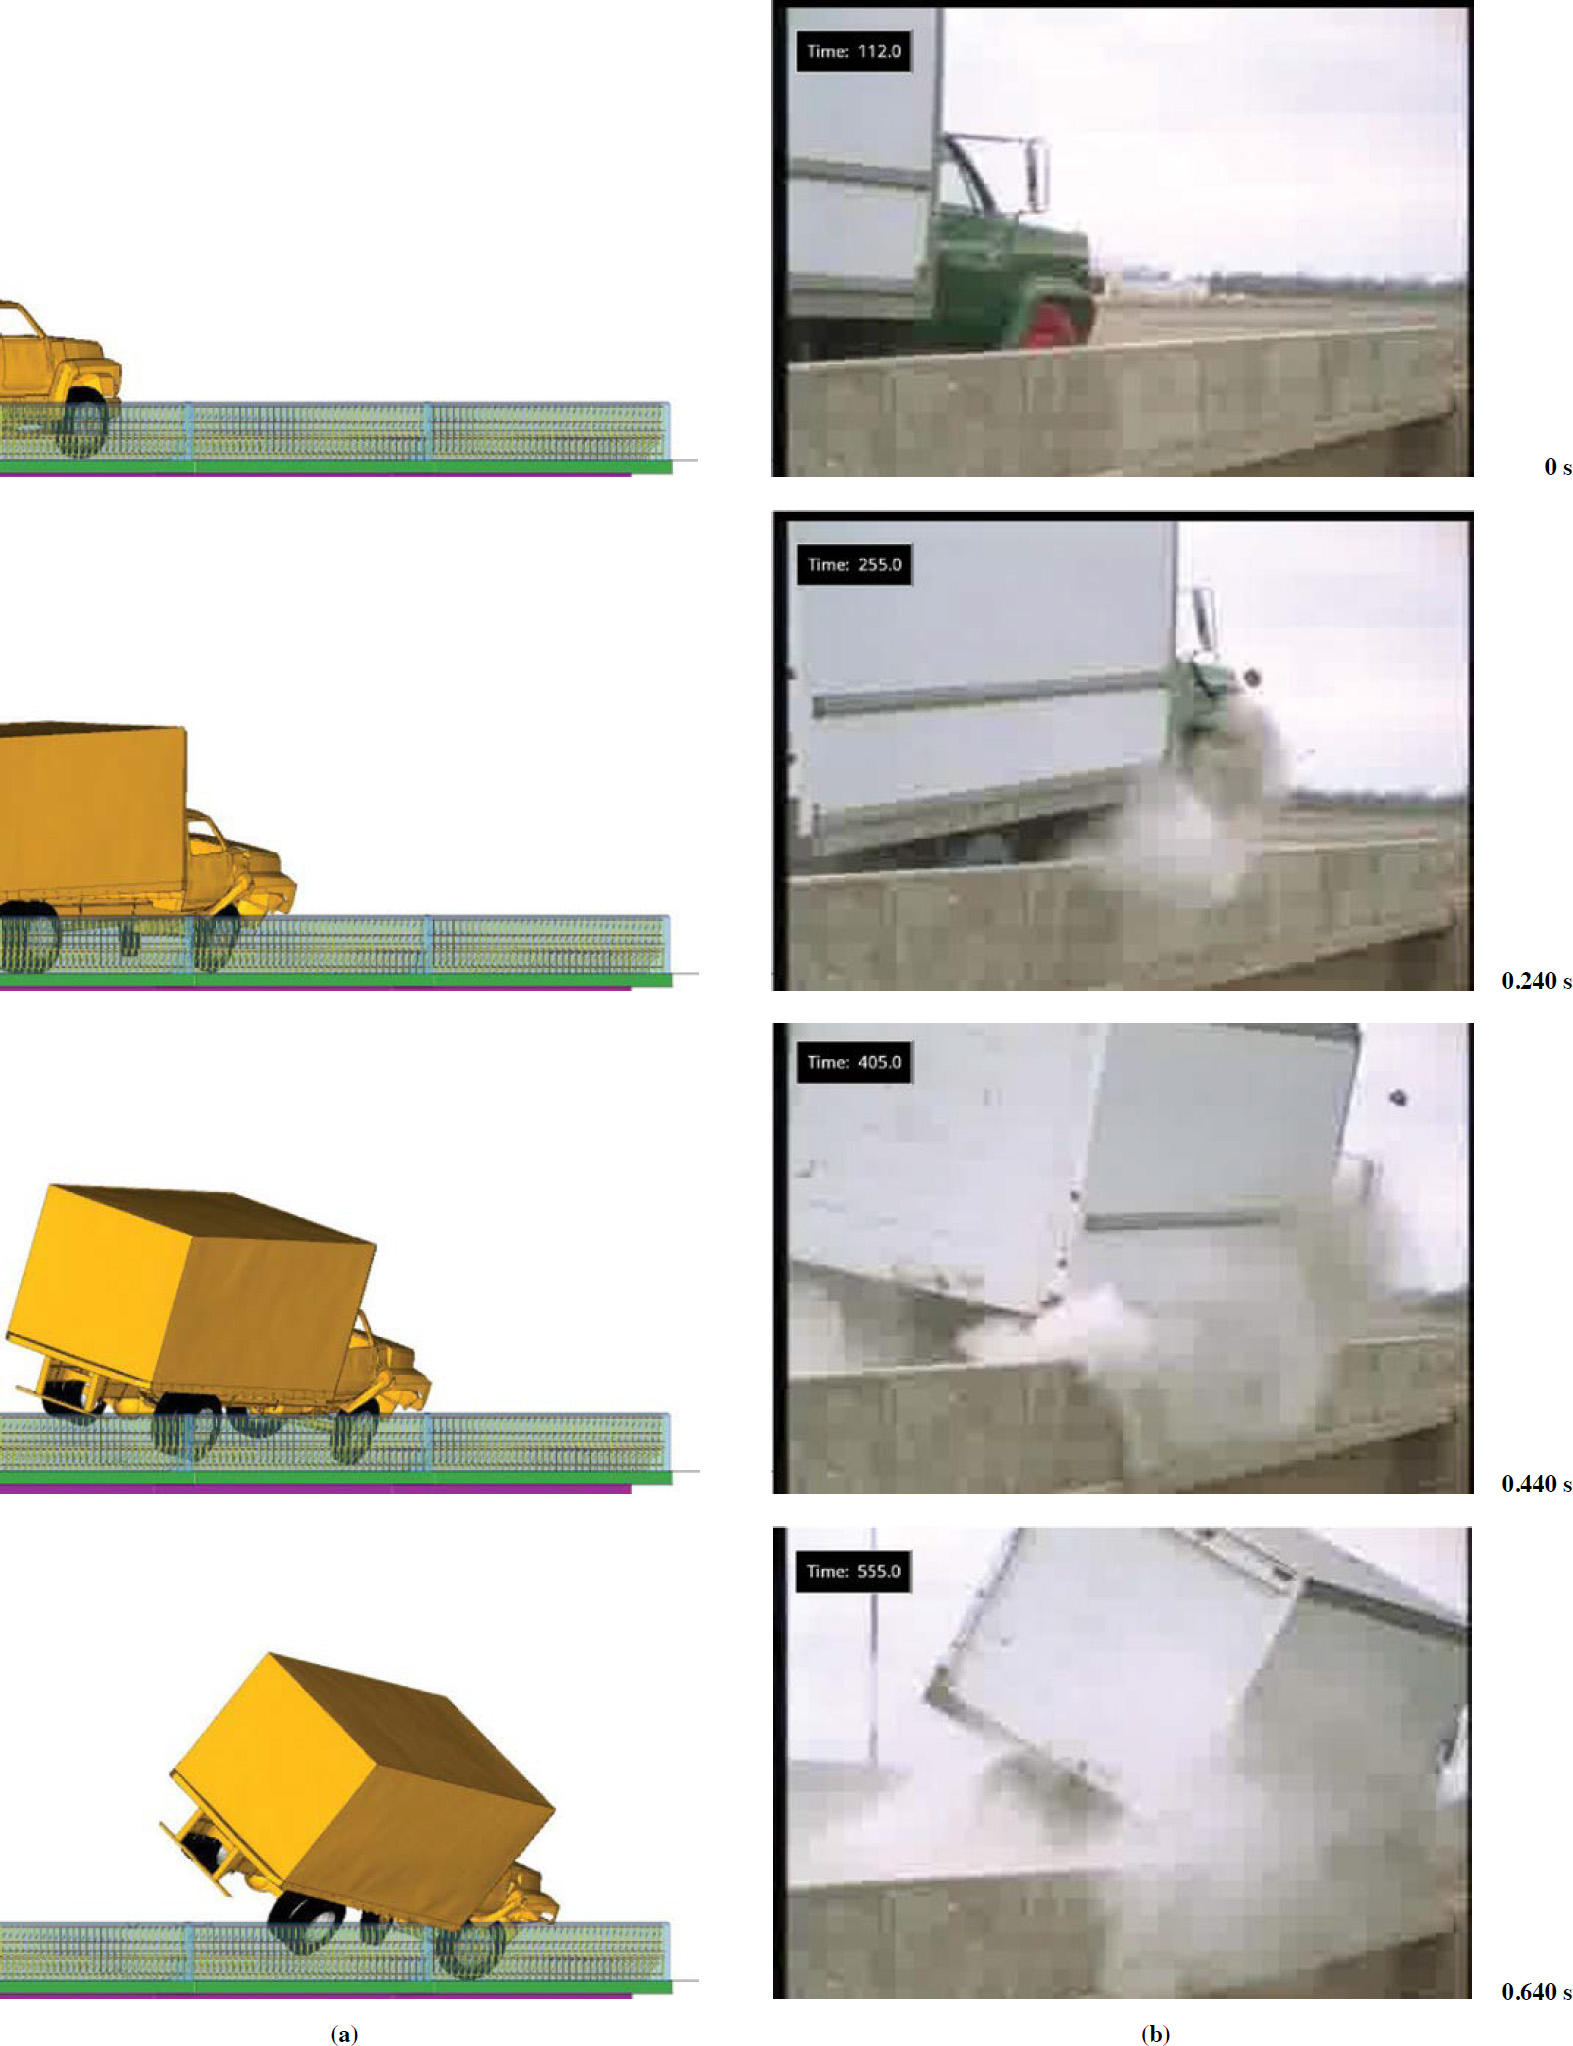
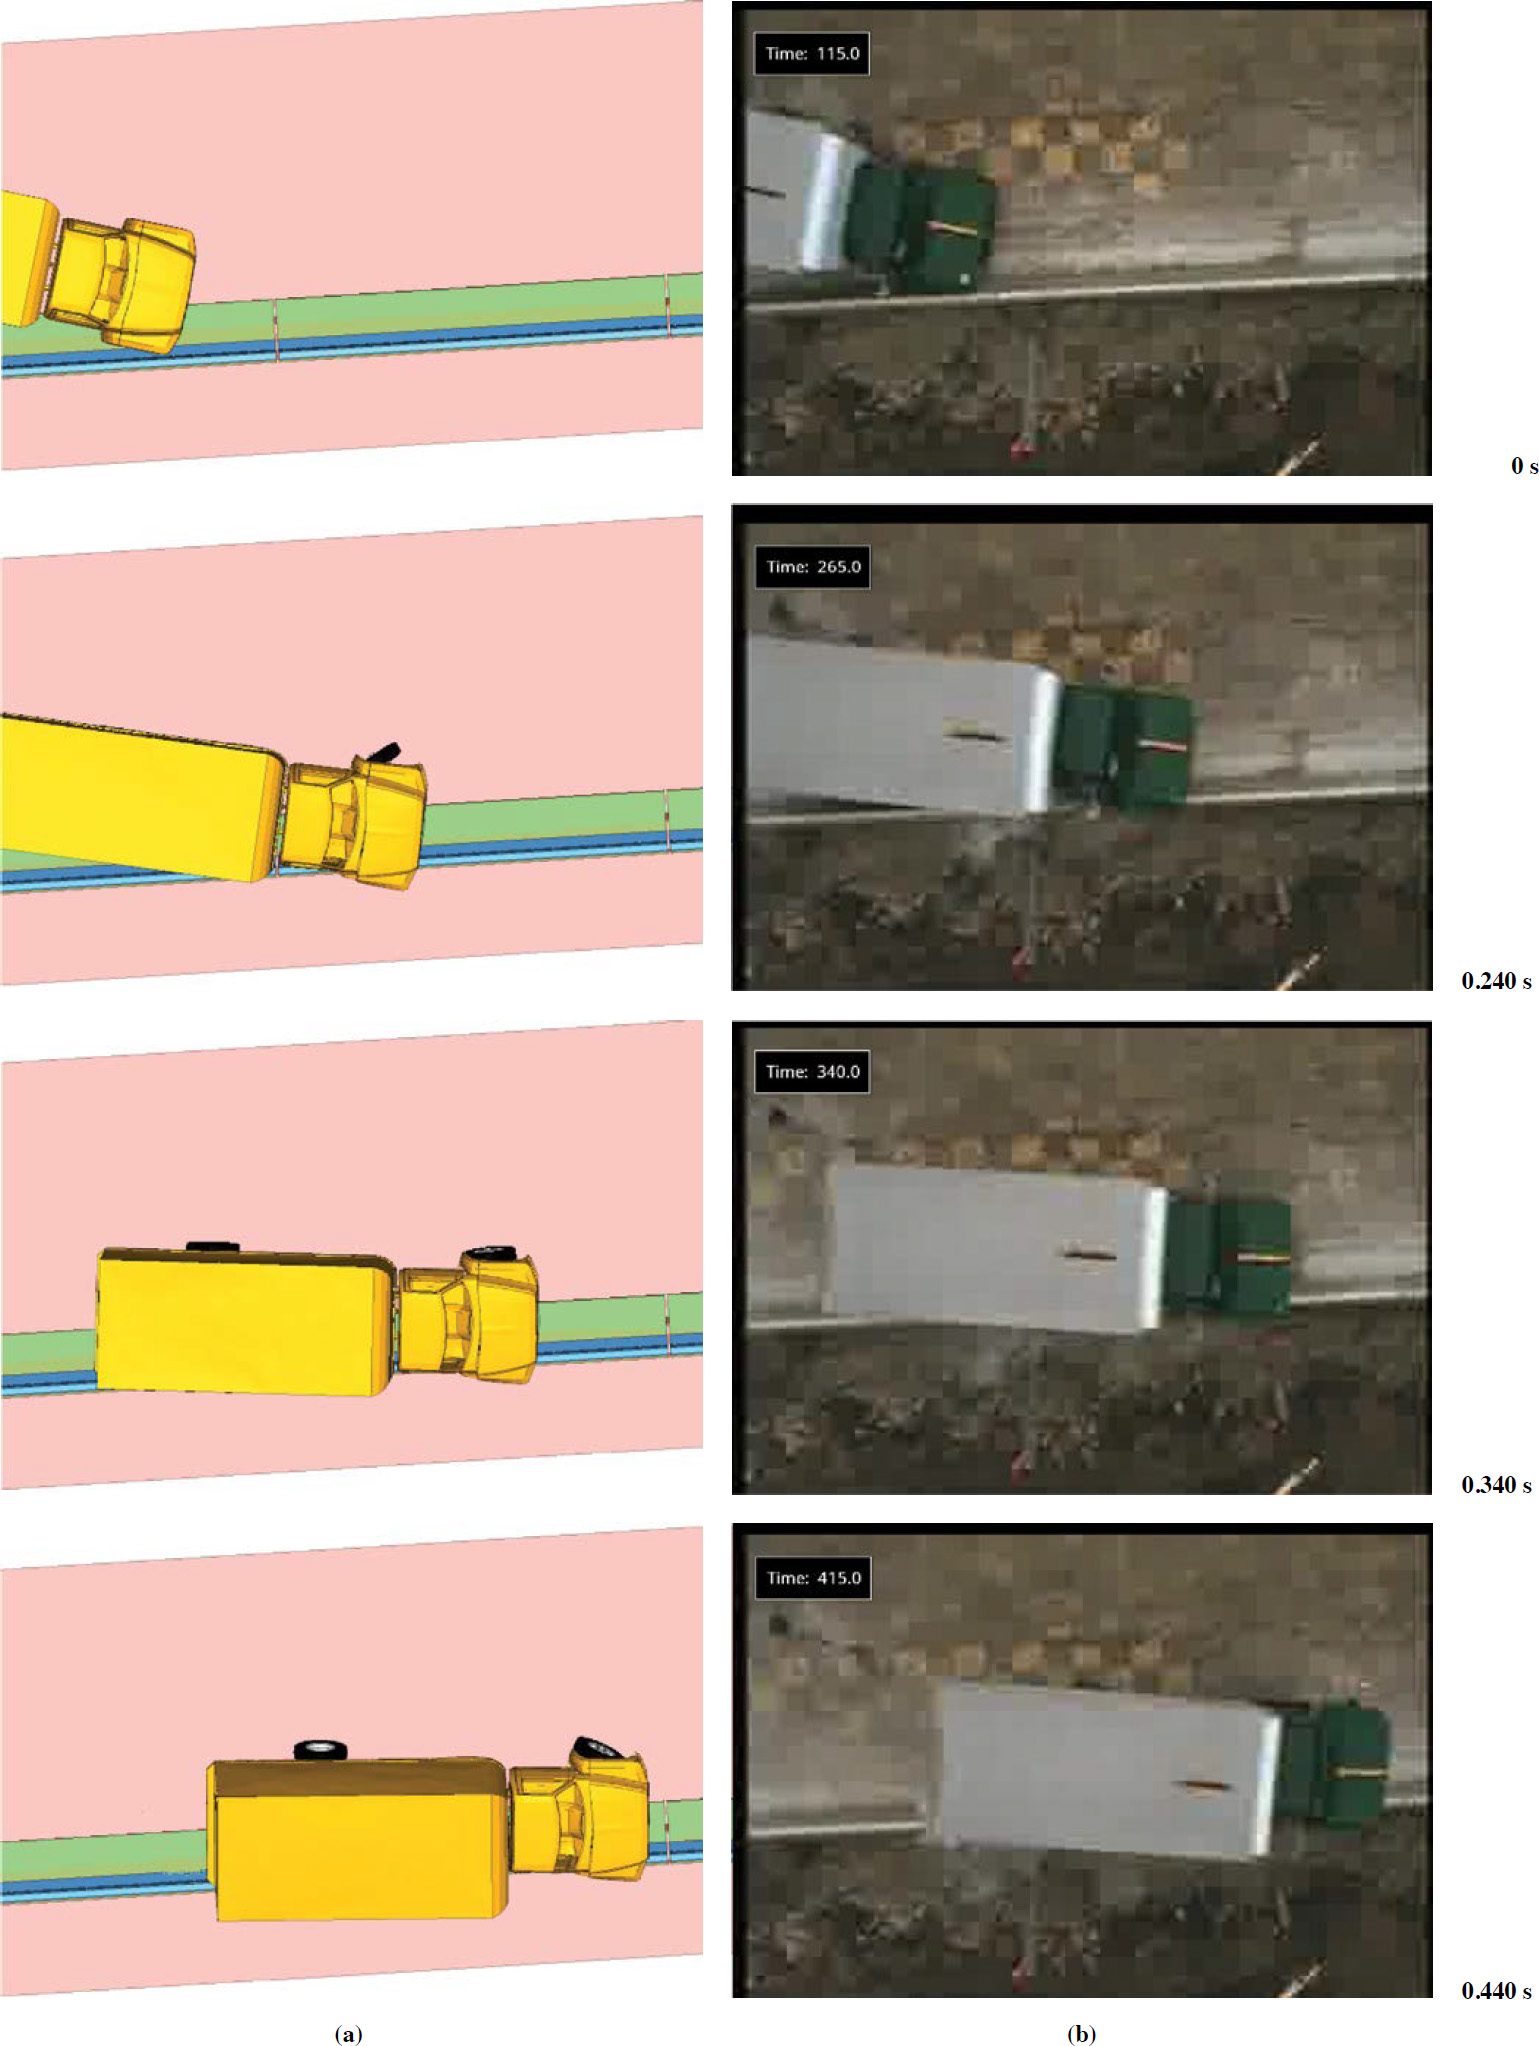

The sequential side-by-side views in Figure 26, Figure 27, and Figure 28 show that the SUT impacted the barrier and maintained contact as its velocity decreased and it was redirected. In the front view (Figure 26), the vehicles behave similarly between the simulation and the crash test impact. Similar vehicle pitch and yaw exists in the test and simulation, but the vehicle roll angles are slightly off because the vehicle in the model is older and from a different manufacturer than the one in the test. These views are considered to reflect a good correlation between the test and a simulation of it.
Figure 29 provides the energy balance diagram for the simulation. It depicts a balance of internal and sliding interface (contact) energy to offset the kinetic energy. There are no unusual effects, suggesting that the model functioned as expected in the simulation.
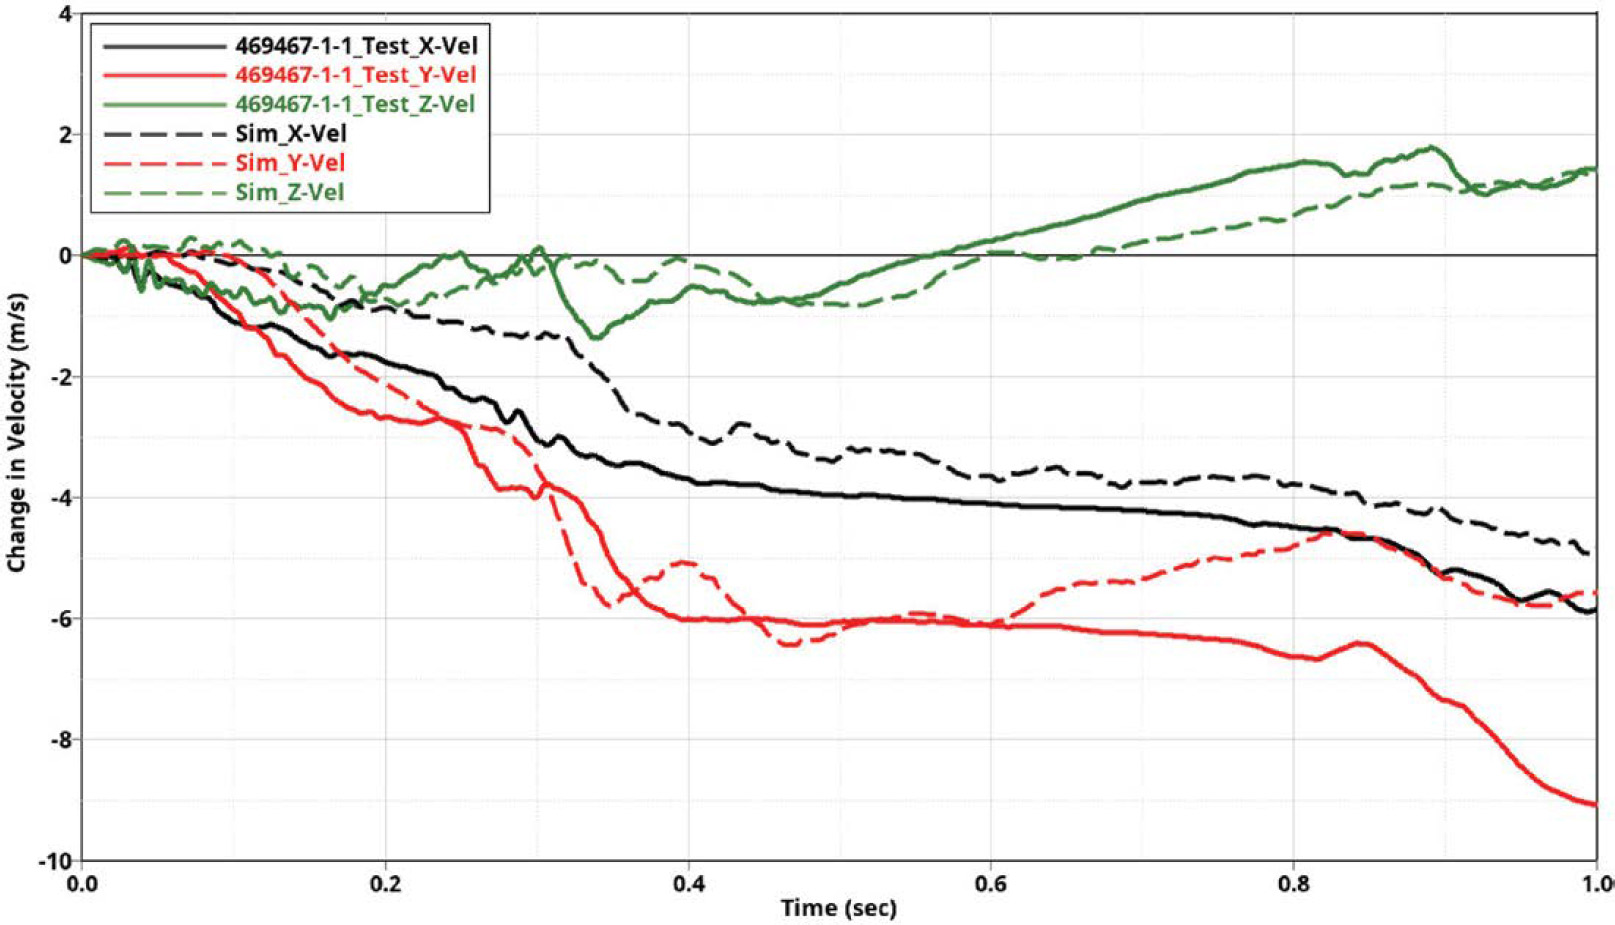
A graphical comparison of the change in velocity of the SUT ballast center of gravity, as derived from the accelerometers installed on the truck, is provided in Figure 30. On the graph, the solid lines indicate the changes in velocity for the x-, y-, and z-axes from the crash tests. The corresponding velocities for the simulation are shown by the dashed lines. Little difference exists in the velocities for the x-, y- and z-axes, as noted by the similar tracks for each metric. These tracks are considered to indicate good correlation between the test and the simulation results because the movement of the vehicle at the center of gravity was effectively replicated by the computer model.
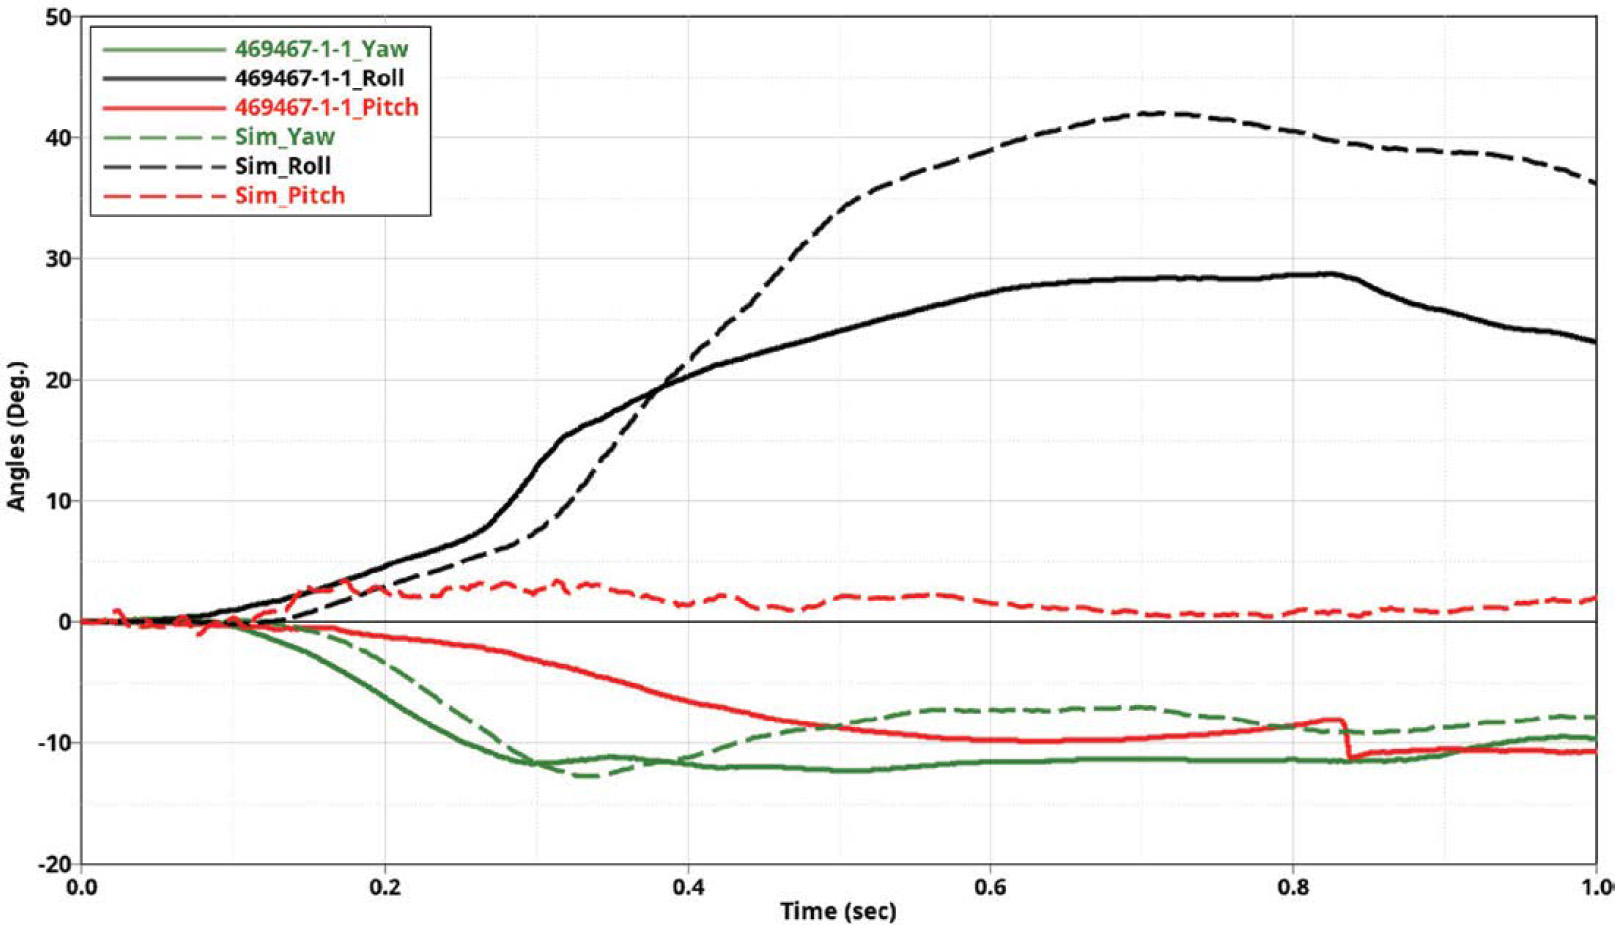
Figure 31 shows the changes in the roll, pitch, and yaw of the SUT between the test and the simulation. The plot indicates a close correlation of the pitch (red solid and dashed lines) and yaw (green solid and dashed lines). The roll (black solid and dashed lines) angles show some differences because SUTs in the test and the simulation are from different manufacturers. These results are considered to indicate good correlations between the test and the simulations using the finite element models.
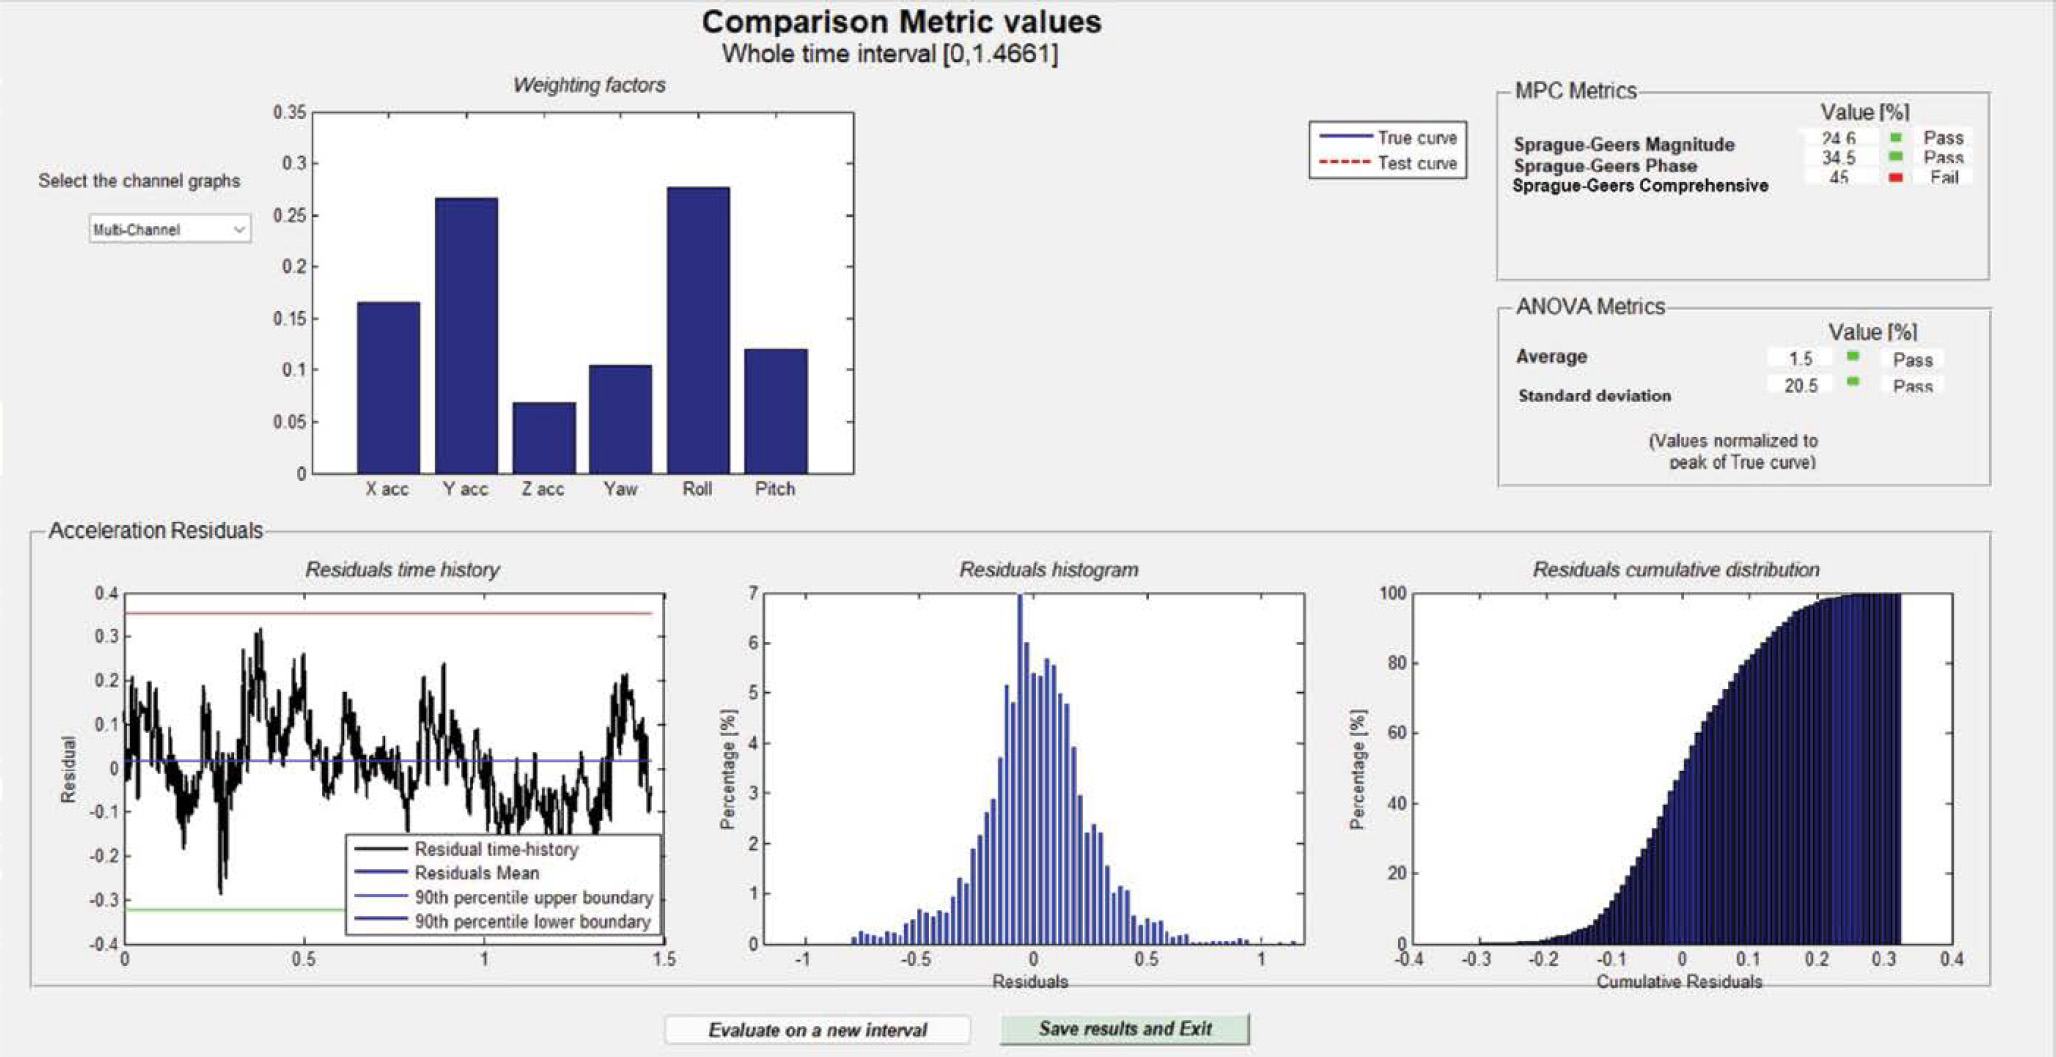
V&V analytical comparisons of these results were undertaken based on NCHRP Report 179 (45). RSVVP tables and PIRTs were generated. The metrics derived from the RSVVP procedure are summarized in Figure 32 for multi-channel analyses. V&V comparisons and the full V&V report are provided in Appendix C. The overall results confirm that the simulation is considered validated based on the multiple listed comparison steps and the justifications included in the tables.
4.2 Crash Simulation Analyses
As part of the research efforts, finite element computer simulations were used to assess the various aspects of safety performance for barriers installed on ramps under different impact conditions and various road curvatures and superelevations. A set of impacting vehicle types was selected for the analyses (e.g., the basic TL3 MASH vehicles with the addition of the TL4 SUT). Similarly, off-ramp geometries, barrier types, and other factors were defined for the matrix of the simulations. The LS-DYNA program (46, 47) was used to carry out the finite element simulations. The simulations generated various metrics that established performance envelopes to assess barrier effectiveness under different conditions and develop understanding of the vehicle response to off-the-road impacts. Critical cases were identified for full-scale crash testing to verify and validate these simulation results. The resulting performance envelopes provided a basis for the development of enhanced guidelines for barrier treatments on CSORs.
4.2.1 Factors Considered
Based on the findings from the literature review and the state DOT survey, parameters believed to affect the safety performance of longitudinal barriers when placed on ramps have been identified. The parameters and their associated ranges were finalized with the review panel. Some parameters included in the analyses and their variations and ranges were:
- Barrier type
- Concrete barriers
- New Jersey 32-in. and 42-in. height
- Steel guardrails
- MGS design with 31-in. top-of-rail height
- Thrie beam with 34-in. top-of-rail height
- Concrete barriers
- Vehicle type
- 1100C small car (Toyota Yaris)
- 2270P pickup truck (Chevrolet Silverado)
- 10000S SUT (Ford F800)
- Superelevation/curvature
- 4% and 8% ramp cross slope
- 150-ft and 200-ft curve (ramp) radius
- Shoulder width and slope
- 4-ft and 12-ft widths
- 0% and 8% (angle relative to road)
- Impact conditions
- Impact angle: 5, 10, 15, 20, and 25 degrees
- Impact speed: 80, 100, and 120 km/h
- Other variations
- Ramp grade: 0 and −6% (downward)
- Vertical orientation (parallel to true vertical)
4.2.2 Performance Metrics
The simulated crashworthiness performance of the longitudinal barriers was evaluated in accordance with the criteria presented in MASH (5). The MASH acceptance criteria focus on the effectiveness of the barrier to “safely” redirect the vehicle, as well as the rate of ride-down accelerations that affect the occupants. For evaluations of TL3 impacts on longitudinal barriers
with the 1100C small car and the 2270P pickup truck, the evaluations are based on the following three factors and MASH acceptance criteria (5):
Structural adequacy
A. Test article should contain and redirect the vehicle or bring the vehicle to a controlled stop; the vehicle should not penetrate, underride, or override the installation, although controlled lateral deflection of the test article is acceptable.
Occupant risk
D. Detached elements, fragments, or other debris from the test article should not penetrate or show potential for penetrating the occupant compartment, or present an undue hazard to other traffic, pedestrians, or personnel in a work zone. Deformation of, or intrusions into, the occupant compartment should not exceed limits set forth in Section 5.3 and Appendix E of MASH.
F. The vehicle should remain upright during and after collision. The maximum roll and pitch angles are not to exceed 75 degrees.
H. Occupant impact velocities should satisfy the following: longitudinal and lateral occupant impact velocity of 30 ft/s (preferred), 40 ft/s (maximum).
I. Occupant ride-down accelerations should satisfy the following: longitudinal and lateral occupant ride-down accelerations should be less than 15.0 G (the preferred gravitational constant) to 20.49 G (maximum).
Vehicle trajectory
The vehicle shall exit the barrier within the exit box.
For the TL4 impact with the 10000S vehicle, the evaluations are based on the following MASH criteria (5):
Structural adequacy
A. Test article should contain and redirect the vehicle or bring the vehicle to a controlled stop; the vehicle should not penetrate, underride, or override the installation, although controlled lateral deflection of the test article is acceptable.
Occupant risk
D. Detached elements, fragments, or other debris from the test article should not penetrate or show potential for penetrating the occupant compartment, or present an undue hazard to other traffic, pedestrians, or personnel in a work zone. Deformation of, or intrusions into, the occupant compartment should not exceed limits set forth in Section 5.3 and Appendix E of MASH.
G. It is preferable, although not essential, that the vehicle remain upright during and after collision.
To assess the barrier performance, the results from each simulation were carefully evaluated using the aforementioned criteria. The evaluations were then summarized in a concise and easy-to-read tabular format. These tables were used to establish the performance of the selected barriers under various impact conditions. This information is important for developing guidelines and making informed decisions regarding barrier selection and placement.
4.3 Computer Simulation Analysis for CSORs
The approach used in the finite element simulation analyses was similar to one used in NCHRP Project 22-29A. Simulation runs were made to assess the effectiveness of three common barriers in different roadway situations. The simulation analyses considered MASH impacts with the small car (1100C) and the large pickup truck (2270P). Each simulation reflected a specific CSOR
design. The features of the CSOR included the radius of the curved ramp, its superelevation and grade, the width of the shoulder, and its angle relative to the highway lanes. These factors defined the surface a vehicle would traverse before impacting a barrier. The vehicle speed and angle were also varied in the analyses.
For each simulation, a comprehensive summary of results in tabular form was generated. A sample of the summary results is shown in Table 13, which depicts the behavior of the vehicle and all pertinent MASH metrics and evaluations. The upper portion of the table indicates the basic barrier features and impact conditions, while the image provides a visual representation of the vehicle’s position at various points in the 2-s crash event. The lower portion of the table summarizes the MASH crashworthiness evaluation metrics for the simulated conditions. The yaw, pitch, and roll of the vehicle were computed and compared with the acceptable levels specified in national standards to determine whether the impact met the pass or fail criteria for maximum effects (5).
The position of the vehicle relative to the barrier is a critical aspect, as it influences the manner in which the vehicle will be restrained and the rates of deceleration that impose forces on the driver or occupant. The simulation tools generate metrics to determine the safe levels of these forces resulting from an impact. Criteria that reflect a consensus on what “safe” is are computed based on the physics of the simulated crash. The sequential views reflect tendencies to roll or pitch excessively, or to override or penetrate the barrier. These are determined computationally but generally with a high degree of realism.
The simulation tool was set to undertake the analysis incrementally across a set range of factors. Analysis summaries were generated for more than 500 cases to consider the effectiveness of the various barrier types, including:
- 32-in. and 42-in. New Jersey shaped-concrete barrier (Appendix D—405 cases)
- 31-in. W-beam barrier (MGS) (Appendix E—50 cases)
- 34-in. Thrie beam barrier (Appendix F—50 cases)
These summary tables are included in Appendices D through F as listed. These cases were further summarized in one table: Table 15 includes summary of results for the concrete barrier, considering all MASH criteria in the barrier performance evaluation. Table 16 includes the same cases for the concrete barrier but considers only rollover in the barrier performance evaluations. Based on the overall simulation results, a tabular summary was compiled of vehicle-to-barrier interfaces (and redirection) where effectiveness was unlikely.
The guidelines are reflected in Table 15 and Table 16. The shortest radii curves are the most problematic, so for radii of 150 and 200 ft for varying superelevations (4% and 8%) and impact angles (5, 10, 15, 20, and 25 degrees), a column was provided in each matrix. A row was provided in each table for 1100C and 2270P vehicles. Rows were added for vehicle grades of 0% and −6%. Rows were also added for shoulder angles of 0% and 8%. Finally, rows were added for impact speeds of 80, 100, and 120 km/h. This formed a matrix of cells that reflect common variations of conditions. In Table 15, cells indicated by simulation to pass were shaded green and marked with a “P” for “pass.” The cells where the MASH criteria were not met were shaded red, indicating that they would not meet the full set of MASH criteria. Similarly, in Table 16, the same stratifications was created to consider only cases in which the MASH rollover criteria would not likely be met.
Similar analyses were performed to assess the barrier performance at the TL4 impacts with the MASH SUT model. A sample of the summary results is shown in Table 14. Similar to the cases for the TL3 impacts, the upper portion of the table indicates the basic barrier features and impact conditions, while the image provides a visual representation of the vehicle’s position at various points in the 2-s crash event. The lower portion of the table summarizes the MASH
Table 13. Sample summary of simulation results with pickup truck.
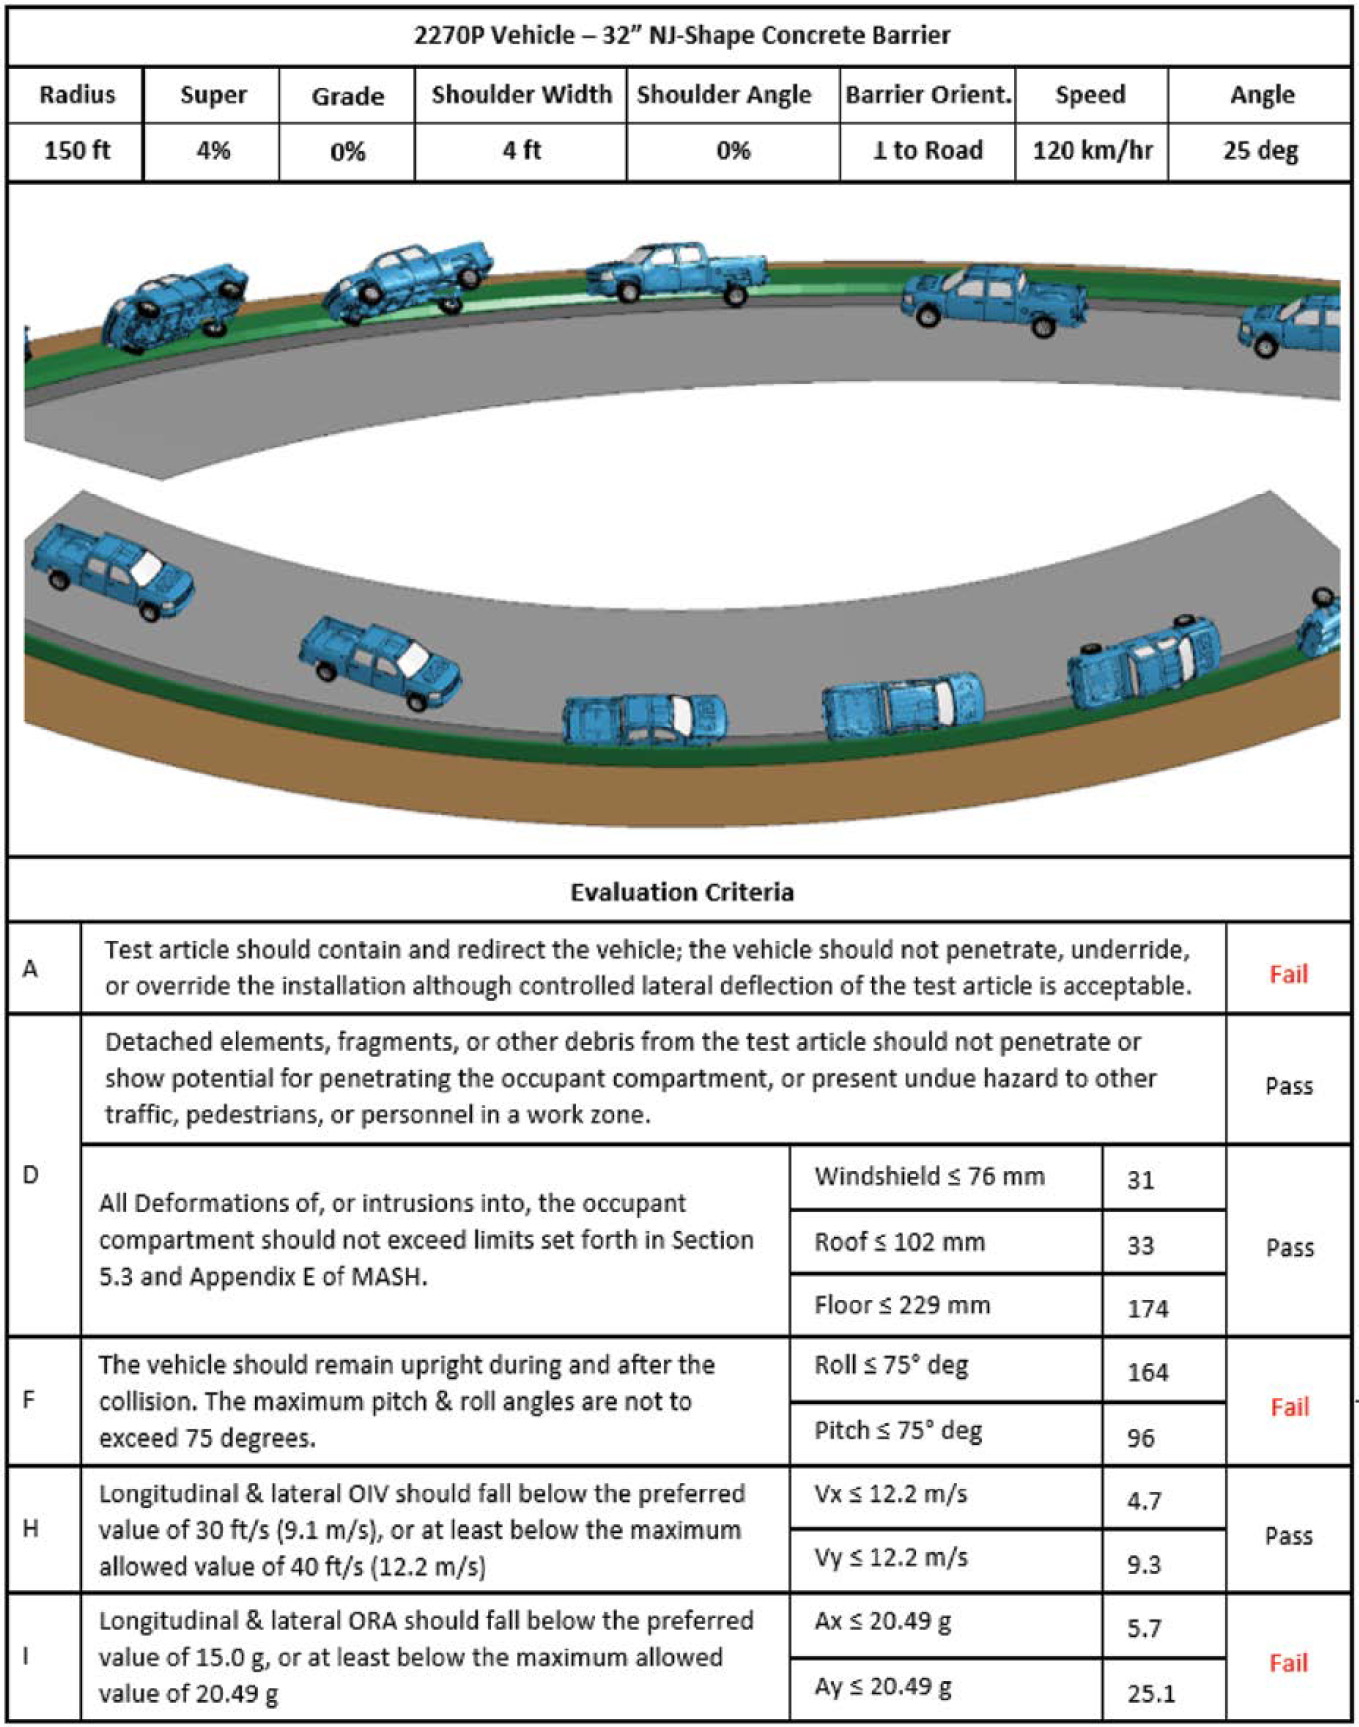
Table 14. Sample summary of simulation results with SUT.

NOTE: * = This evaluation criterion is preferable and not required to pass to meet MASH.
Table 15. Summary of results for concrete barrier considering all MASH criteria.
| Road Curvature | 150 ft (45 m) | 200 ft (61 m) | ||||||||||||||||||||||
|---|---|---|---|---|---|---|---|---|---|---|---|---|---|---|---|---|---|---|---|---|---|---|---|---|
| Road Superelevation | 4% | 8% | 4% | 8% | ||||||||||||||||||||
| Impact Angle (degrees) | 5 | 10 | 15 | 20 | 25 | 5 | 10 | 15 | 20 | 25 | 5 | 10 | 15 | 20 | 25 | 5 | 10 | 15 | 20 | 25 | ||||
| Vehicle | Vertical Grade | Shoulder Angle | Impact Speed | |||||||||||||||||||||
| 1100C | 0% | 0% | 80 km/h | P | P | P | P | P | P | P | P | P | P | P | P | P | P | P | P | P | P | P | P | |
| 100 km/h | F | P | P | P | P | P | P | P | P | P | P | P | P | P | P | P | P | P | P | P | ||||
| 120 km/h | F | F | F | F | P | F | F | P | P | P | F | F | F | F | P | F | F | P | F | F | ||||
| 8% | 80 km/h | P | P | P | P | P | P | P | P | P | P | P | P | P | P | P | P | P | P | P | P | |||
| 100 km/h | P | P | P | P | P | P | P | P | P | P | P | P | P | P | P | P | P | P | P | P | ||||
| 120 km/h | F | F | P | P | P | F | F | P | P | P | F | F | F | P | P | F | F | P | P | P | ||||
| −6% | 0% | 80 km/h | P | P | P | P | P | P | P | P | P | P | P | P | P | P | P | P | P | P | P | P | ||
| 100 km/h | P | P | P | P | P | P | P | P | P | P | P | P | P | P | P | P | P | P | P | P | ||||
| 120 km/h | F | F | F | F | P | F | F | P | P | P | F | F | F | P | P | F | F | P | P | P | ||||
| 8% | 80 km/h | P | P | P | P | P | P | P | P | P | P | P | P | P | P | P | P | P | P | P | P | |||
| 100 km/h | P | P | P | P | P | P | P | P | P | P | P | P | P | P | P | P | P | P | P | P | ||||
| 120 km/h | F | F | P | P | P | F | F | P | P | P | F | F | F | P | P | F | F | F | P | P | ||||
| 2270P | 0% | 0% | 80 km/h | P | P | P | P | P | P | P | P | P | P | P | P | P | P | P | P | P | P | P | P | |
| 100 km/h | P | F | F | F | F | F | F | F | F | F | P | F | F | F | F | P | F | F | F | F | ||||
| 120 km/h | F | F | F | F | F | F | F | F | F | F | F | F | F | F | F | F | F | F | F | F | ||||
| 8% | 80 km/h | P | P | P | P | P | P | P | P | P | P | P | P | P | P | P | P | P | P | P | P | |||
| 100 km/h | P | P | F | F | F | P | P | F | F | F | P | F | F | F | F | F | F | F | F | F | ||||
| 120 km/h | F | F | F | F | F | F | F | F | F | F | F | F | F | F | F | F | F | F | F | F | ||||
| −6% | 0% | 80 km/h | P | P | P | P | P | P | P | P | P | P | P | P | P | P | P | P | P | P | P | P | ||
| 100 km/h | P | F | F | F | F | P | F | F | F | F | P | F | F | F | F | P | F | F | F | F | ||||
| 120 km/h | F | F | F | F | F | F | F | F | F | F | F | F | F | F | F | F | F | F | F | F | ||||
| 8% | 80 km/h | P | P | P | P | P | P | P | P | P | P | P | P | P | P | P | P | P | P | P | P | |||
| 100 km/h | P | P | F | F | F | P | P | F | F | F | P | F | F | F | F | P | P | F | F | F | ||||
| 120 km/h | F | F | F | F | F | F | F | F | F | F | F | F | F | F | F | F | F | F | F | F | ||||
F Not Meeting MASH P Meeting MASH
Table 16. Summary of results for concrete barrier considering only rollover.
| Road Curvature | 150 ft (45 m) | 200 ft (61 m) | ||||||||||||||||||||||
|---|---|---|---|---|---|---|---|---|---|---|---|---|---|---|---|---|---|---|---|---|---|---|---|---|
| Road Super Elevation | 4% | 8% | 4% | 8% | ||||||||||||||||||||
| Impact Angle (degrees) | 5 | 10 | 15 | 20 | 25 | 5 | 10 | 15 | 20 | 25 | 5 | 10 | 15 | 20 | 25 | 5 | 10 | 15 | 20 | 25 | ||||
| Vehicle | Vertical Grade | Shoulder Angle | Impact Speed | |||||||||||||||||||||
| 1100C | 0% | 0% | 80 km/h | N | N | N | N | N | N | N | N | N | N | N | N | N | N | N | N | N | N | N | N | |
| 100 km/h | N | N | N | N | N | N | N | N | N | N | N | N | N | N | N | N | N | N | N | N | ||||
| 120 km/h | N | N | N | N | N | N | N | N | N | N | N | N | N | N | N | N | N | N | N | N | ||||
| 8% | 80 km/h | N | N | N | N | N | N | N | N | N | N | N | N | N | N | N | N | N | N | N | N | |||
| 100 km/h | N | N | N | N | N | N | N | N | N | N | N | N | N | N | N | N | N | N | N | N | ||||
| 120 km/h | N | N | N | N | N | N | N | N | N | N | N | N | N | N | N | N | N | N | N | N | ||||
| −6% | 0% | 80 km/h | N | N | N | N | N | N | N | N | N | N | N | N | N | N | N | N | N | N | N | N | ||
| 100 km/h | N | N | N | N | N | N | N | N | N | N | N | N | N | N | N | N | N | N | N | N | ||||
| 120 km/h | N | N | N | N | N | N | N | N | N | N | N | N | N | N | N | N | N | N | N | N | ||||
| 8% | 80 km/h | N | N | N | N | N | N | N | N | N | N | N | N | N | N | N | N | N | N | N | N | |||
| 100 km/h | N | N | N | N | N | N | N | N | N | N | N | N | N | N | N | N | N | N | N | N | ||||
| 120 km/h | N | N | N | N | N | N | N | N | N | N | N | N | N | N | N | N | N | N | N | N | ||||
| 2270P | 0% | 0% | 80 km/h | N | N | N | N | N | N | N | N | N | N | N | N | N | N | N | N | N | N | N | N | |
| 100 km/h | N | N | N | N | N | N | N | N | N | N | N | N | N | N | N | N | N | N | N | N | ||||
| 120 km/h | R | R | R | R | R | R | R | R | R | R | R | R | N | N | N | R | R | R | R | R | ||||
| 8% | 80 km/h | N | N | N | N | N | N | N | N | N | N | N | N | N | N | N | N | N | N | N | N | |||
| 100 km/h | N | N | N | N | N | N | N | N | N | N | N | N | N | N | N | N | N | N | N | N | ||||
| 120 km/h | N | N | N | N | N | R | R | R | N | N | N | N | N | N | N | R | F | F | F | F | ||||
| −6% | 0% | 80 km/h | N | N | N | N | N | N | N | N | N | N | N | N | N | N | N | N | N | N | N | N | ||
| 100 km/h | N | N | N | N | N | N | N | N | N | N | N | N | N | N | N | N | N | N | N | N | ||||
| 120 km/h | R | R | R | R | R | R | R | R | R | R | R | R | R | R | R | R | R | N | N | N | ||||
| 8% | 80 km/h | N | N | N | N | N | N | N | N | N | N | N | N | N | N | N | N | N | N | N | N | |||
| 100 km/h | N | N | N | N | N | N | N | N | N | N | N | N | N | N | N | N | N | N | N | N | ||||
| 120 km/h | N | N | N | N | N | R | R | R | R | N | N | N | N | N | N | R | N | N | N | N | ||||
R Override/Rollover N No Override/Rollover
crashworthiness evaluation metrics for the simulated conditions. MASH criteria A, D, and G are the only applicable criteria and the ones used for the evaluation to determine whether the barrier is classified as pass or fail (5).
The analyses of the SUT impact evaluations initially focused on a 32-in. height New Jersey concrete system, and later a 42-in. height system was analyzed. Table 17 shows the summary of the results from simulations with these two systems. Summary tables from the individual cases are included in Appendix D. As expected, the simulations show that the 32-in. height system does not meet the MASH criteria at the recommended 90 km/h impact speed and 15-degree impact angle. The simulations also revealed that, at that speed, the system would not meet the evaluation criteria even at the lowest 5-degree impact angle analyzed. Simulations at lower speeds, 50 and 70 km/h, showed that the 32-in. height system would meet criteria for cases at only 50 km/h and impact angles of only 5 and 10 degrees.
Because the simulations indicated poor performance of the 32-in. height system, additional simulations were carried out with a 42-in. height system. The 42-in. height system was found to have better performance, meeting the MASH criteria for the 50 km/h cases at all simulated angles (5 to 25 degrees). However, the simulations still showed that the 42-in. height system did not meet MASH criteria at the 70 and 90 km/h speeds. Notably, the simulations highlighted that the impact speed and angle significantly influenced the system’s performance, whereas other parameters such as road profile and shoulder configuration had negligible effects, as evident in Table 17.
Several observations can be deduced from the 1100C and 2270P simulation results:
- The simulations show that impacts of the 2270P vehicle (pickup truck) are more critical than those of the 1100C (small car). The lower halves of Table 15 and Table 16 (which include the pickup truck cases) have more red cells (not passing) than the upper half.
- It can be observed from the individual summary tables (included in Appendix D) that nearly all the 1100C cases that did not meet MASH were attributable to excess in occupant impact velocity (OIV). None of these cases led to vehicle rollover.
- Similarly, the majority of the 2270P cases that did not meet MASH were attributable to high occupant ride-down accelerations (ORA). Several of these cases, specifically at the 120 km/h speed, led to rollover.
- Comparing the different impact angle results, Table 15 shows that some cases with the 1100C vehicle fail the MASH criteria at lower impact angles, while similar cases with higher impact angles meet the MASH criteria. This indicates that lower angles are more critical for the 1100C vehicle. When examining the individual cases, the simulations predict higher OIV (the critical metric for the small car cases) with lower impact angles. The simulations, however, did not show a significant increase of the vehicle climbing over the barrier at lower impact angles.
- The opposite observation can be made for the 2270C vehicle: higher impact angles are more critical. The table shows cases failing the MASH criteria at higher impact angles, while similar cases at lower impact angles meet MASH. The individual simulations show that the ORA (the critical metric for the pickup truck cases) is higher for higher impact angles.
- At different speeds, the simulations show, the barrier would meet the MASH criteria at 80 km/h, would have marginal performance with several cases not meeting the MASH criteria at 100 km/h, and would in almost all cases not meet MASH at 120 km/h. The 120 km/h is especially critical for the 2270P vehicle, with most of the cases not meeting MASH.
- Regarding the effects of shoulder angle, the simulations show that cases with an 8% shoulder angle are less critical than 0% shoulder angle cases (where the shoulder is parallel to the road).
- For cases with different road superelevations, the results show some increase in severity at lower superelevations. Fewer cases fail with an 8% superelevation than with a 4% superelevation.
- The simulation results indicate that impacts with sharper curvature (with the 150-ft radius) are more critical for rollover than the 200-ft radius cases. More cases fail with the 150-ft radius barrier than with the 200-ft radius barrier.
- When examining the effects of grade, simulations show almost no difference between the 0% grade cases and the −6% (down) grade cases. This was noted for all road and shoulder profiles and for all speeds and angles. Lack of difference could be attributed to the speed when the vehicle comes into contact with the barrier being similar for the 0% and −6% grade cases. The downgrade does not increase the speed from the vehicles’ initial position to the initial impact with the barrier.
Table 17. Summary of results for concrete barrier with SUT.
| Road Curvature | 150 ft (45 m) | 200 ft (61 m) | ||||||||||||||||||||||
|---|---|---|---|---|---|---|---|---|---|---|---|---|---|---|---|---|---|---|---|---|---|---|---|---|
| Road Super Elevation | 4% | 8% | 4% | 8% | ||||||||||||||||||||
| Impact Angle (degrees) | 5 | 10 | 15 | 20 | 25 | 5 | 10 | 15 | 20 | 25 | 5 | 10 | 15 | 20 | 25 | 5 | 10 | 15 | 20 | 25 | ||||
| Barrier Height | Vertical Grade | Shoulder Angle | Impact Speed | |||||||||||||||||||||
| 35 in. | 0% | 0% | 50 km/h | P | P | F | F | F | P | P | F | F | F | P | P | F | F | F | P | P | F | F | F | |
| 70 km/h | F | F | F | F | F | F | F | F | F | F | F | F | F | F | F | F | F | F | F | F | ||||
| 90 km/h | F | F | F | F | F | F | F | F | F | F | F | F | F | F | F | F | F | F | F | F | ||||
| 8% | 50 km/h | P | P | F | F | F | P | P | F | F | F | P | P | F | F | F | P | P | F | F | F | |||
| 70 km/h | F | F | F | F | F | F | F | F | F | F | F | F | F | F | F | F | F | F | F | F | ||||
| 90 km/h | F | F | F | F | F | F | F | F | F | F | F | F | F | F | F | F | F | F | F | F | ||||
| −6% | 0% | 50 km/h | P | P | F | F | F | P | P | F | F | F | P | P | F | F | F | P | P | F | F | F | ||
| 70 km/h | F | F | F | F | F | F | F | F | F | F | F | F | F | F | F | F | F | F | F | F | ||||
| 90 km/h | F | F | F | F | F | F | F | F | F | F | F | F | F | F | F | F | F | F | F | F | ||||
| 8% | 50 km/h | P | P | F | F | F | P | P | F | F | F | P | P | F | F | F | P | P | F | F | F | |||
| 70 km/h | F | F | F | F | F | F | F | F | F | F | F | F | F | F | F | F | F | F | F | F | ||||
| 90 km/h | F | F | F | F | F | F | F | F | F | F | F | F | F | F | F | F | F | F | F | F | ||||
| 42 in. | 0% | 0% | 50 km/h | P | P | P | P | P | P | P | P | P | P | P | P | P | P | P | P | P | P | P | P | |
| 70 km/h | F | F | F | F | F | F | F | F | F | F | F | F | F | F | F | F | F | F | F | F | ||||
| 90 km/h | F | F | F | F | F | F | F | F | F | F | F | F | F | F | F | F | F | F | F | F | ||||
| 8% | 50 km/h | P | P | P | P | P | P | P | P | P | P | P | P | P | P | P | P | P | P | P | P | |||
| 70 km/h | F | F | F | F | F | F | F | F | F | F | F | F | F | F | F | F | F | F | F | F | ||||
| 90 km/h | F | F | F | F | F | F | F | F | F | F | F | F | F | F | F | F | F | F | F | F | ||||
| −6% | 0% | 50 km/h | P | P | P | P | P | P | P | P | P | P | P | P | P | P | P | P | P | P | P | P | ||
| 70 km/h | F | F | F | F | F | F | F | F | F | F | F | F | F | F | F | F | F | F | F | F | ||||
| 90 km/h | F | F | F | F | F | F | F | F | F | F | F | F | F | F | F | F | F | F | F | F | ||||
| 8% | 50 km/h | P | P | P | P | P | P | P | P | P | P | P | P | P | P | P | P | P | P | P | P | |||
| 70 km/h | F | F | F | F | F | F | F | F | F | F | F | F | F | F | F | F | F | F | F | F | ||||
| 90 km/h | F | F | F | F | F | F | F | F | F | F | F | F | F | F | F | F | F | F | F | F | ||||
F Not Meeting MASH P Meeting MASH
The research team conducted simulation analyses on two semi-flexible barriers: the 31-in. W-beam and the 34-in. Thrie beam guardrails. The simulations were performed for TL3 impacts using the 1100C and 2207P vehicles. The results demonstrated that both semi-flexible barriers successfully met the MASH criteria for the majority of the analyzed cases. If summary tables, akin to Table 15 and Table 16, were generated for these barriers, they would predominantly show green cells, with only a few red cells. Individual summary tables for the 31-in. W-beam and 34-in. Thrie beam guardrails are included in Appendix E and Appendix F, respectively. These summaries indicate that the majority of cases meet the MASH requirements. However, it is essential to acknowledge the complexities involved in simulating and predicting rail rupture in these simulations. To validate these results, further investigations and testing should be conducted.
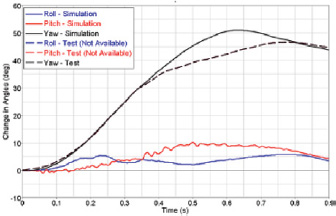
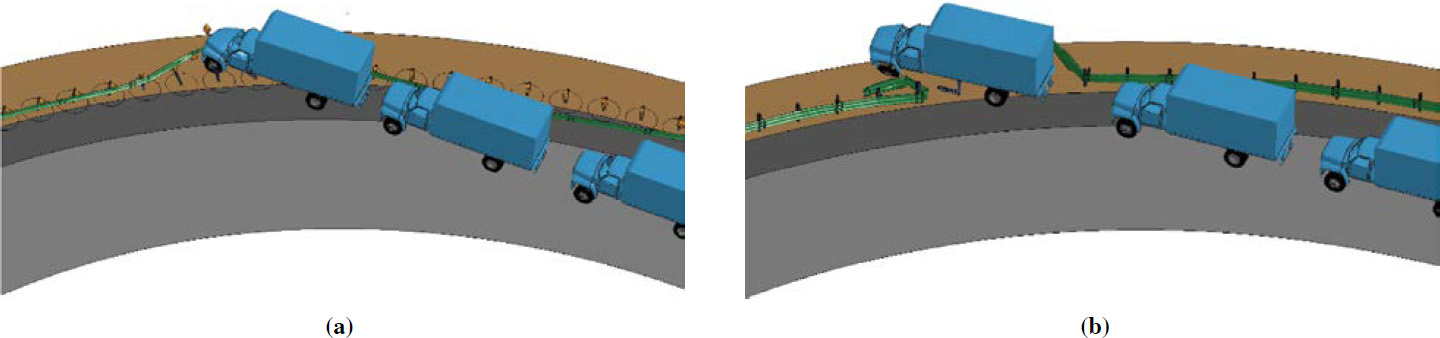
Simulations using the SUT vehicle impacting the 31-in. W-beam and 34-in. Thrie beam semi-flexible barriers at the TL4 impacts, on the other hand, show that almost all cases failed to meet the MASH criteria. Even at lower impact speeds (50 and 70 km/h) and lower angles (5 and 10 degrees), the simulation showed potential for the vehicle overriding the barrier. Sample results are included in Figure 33. If summary tables analogous to Table 15 and Table 16 were generated for the SUT impacts for the W-beam and Thrie beam barriers, they would have all red cells.
4.4 Applicability of Results to Practice
The results from this project provide useful insights to state DOTs and roadside hardware safety researchers about the performance of barriers used in conditions other than those for which they are typically tested. The results lessen the gap of knowledge about the safety performance of longitudinal barriers placed on curved, superelevated ramp sections. Specific recommendations for the design, selection, and installation of longitudinal barriers on CSORs are offered. This will allow individual agencies to update their standards and practices. This can also be expected to motivate the development of innovative barriers if needs are identified. Furthermore, the results are useful in determining whether new crashworthiness evaluation criteria need to be formulated to test barriers installed on ramps.
The primary intended audience for the results of this project is DOTs, as the recommendations will be useful to individuals and agencies responsible for designing, installing, and maintaining safety hardware. The nature of the recommendations may motivate them to implement
changes to guidelines and practices related to roadside barriers, particularly, but not limited to, road design and safety management practices. Other groups will be affected, including state and consultant personnel responsible for roadway design and the provision or maintenance of safety features.
The information in Tables 4–9 is useful in understanding the position of the front edge of a vehicle crossing roadside terrain. For the “best” conditions, it provides an index of the “window” or “capture zone” for an errant vehicle, considering that many difficult-to-control factors are present. The firmness of the soil, the surface vegetation (cut or uncut), and the moisture content of the soil may become important relative to having either a firm (or even slippery) surface or mud. The tables, however, define the window for catching the vehicle’s front bumper. The data recognizes the vertical influences that project a vehicle upward when a curb is hit, for example.
Similarly, Table 15 to Table 17 summarize the results from the simulation analyses in a way that allows information to be readily used by agencies in making highway and barrier design decisions. These cases were simulated across ranges of situational factors in an attempt to determine whether the barriers were effective across a range of conditions. The cases generated were selected to provide a wide cross section of scenarios while focusing on the factors influencing the pass/fail metrics.


