Planning for Future Electric Vehicle Growth at Airports (2024)
Chapter: 3 Estimating EV Adoption, Charging Need, and EV Load
Chapter 3. Estimating EV Adoption, Charging Need, and EV Load
Airport planners need simple methods to predict future EV charging needs and load. Accurate estimation helps right-size infrastructure investments, which leads to efficient use of budget and physical space. This chapter describes methodologies airport planners can use to estimate EV charging needs and load, focusing on light-duty passenger vehicles and employee vehicles.
How can airport planners estimate the future number of passenger and employee EVs?
For airport-owned vehicles, future EV adoption is relatively easy to predict because vehicle procurement is controlled by the airport. For non-airport owned vehicles, such as privately owned LDV, airport staff must estimate the number of future EVs to plan for increased charging needs and load. A comprehensive review of EV prediction methods by Gnann et al. in 2018 describes several potential approaches to approximating EV growth.45 A common approach uses an “S-curve” function that starts flat, curves upward, then asymptotes at a saturation level (Figure 26). Most new technologies follow this same basic shape.46 The callout box below provides an example of how to construct an S-curve using a logistic function.
Figure 26. Example of S-Shaped Adoption Curve
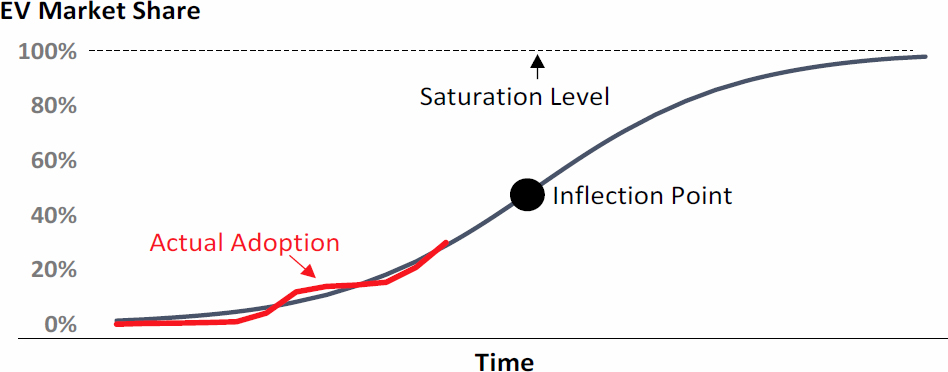
Source: Consultant Team
S-curve models are particularly useful if there are already EV sales data available for a region so that early years of the curve can be fit to the data. Simple S-curve models also have drawbacks, including the need to assume (rather than calculate) the peak of sales and the ultimate market potential.
More sophisticated approaches to forecasting EV growth attempt to mimic the decision-making of individuals or groups, while accounting for interactions and feedback. The most common models for EV adoption include discrete choice and agent-based models. However, for airport applications, these models may require too much time and too many resources to efficiently forecast EV growth for multiple airport use cases.
Example Equation: S-Curve (Logistic Curve)
The equation below results in an S-shaped curve that mimics EV adoption shares.
where:
EV Share in Year i (Si): Percentage of vehicles that are EVs in year i. This is the value of adoption.
Maximum EV Share (L): Maximum percentage of vehicles that are EVs (e.g., in 2050).
Steepness of Curve (k): Slope of the adoption curve. High k values result in faster ramp up.
Crossover Point (x0): Calendar year S-curve reaches its inflection point.
Year of Analysis (xi): Calendar year for estimate (e.g., 2026).
To calculate the EV share in 2026, replace the subscript “i” with 2026. Assume values of 1.0 for L, 0.3 for k, and 2028 for x0. The equation predicts an EV share of 35.4% in 2028.
How can airport planners estimate the optimal number of chargers?
Typically, the next step after calculating future EV adoption is to estimate the number of EVSE ports needed to support the EVs. These calculations are both an art and science. Most planners use simple ratios such as EVs per charger or percentage of parking that is EV-capable to approximate the right number of chargers.
In general, fleet vehicles use a ratio of one port per vehicle.47 This ratio minimizes the risk of vehicle downtime because each vehicle is guaranteed a place to charge at all times. Yet, there are some exceptions. Airport personnel interviewed for the preparation of this guide stated that electric GSE ports can be shared and recommended using a ratio of between three and four ports per gate. Transit buses and shuttlebuses often have a mix of high and low power chargers with ratios of EVs to chargers of less than 1.0 because of their relatively high daily mileage.48
For passenger and employee vehicle charging, the ratio of vehicles to chargers depends on a variety of factors, including the dwell time of vehicles, the distance to the airport from population centers, and the airport’s interest in providing an additional amenity to airport users. The 2021 International Energy Conservation Code (IECC) requires new commercial developments with two or more parking spaces to include at least two EV-ready spaces, and developments with 26 or more parking spaces would be required to also make 20% of all spaces EV-capable, which is defined as having electrical panel capacity and space to support a branch circuit to each parking space. One airport staff member interviewed for this guide said 10% of parking spots in passenger lots were EV-capable, and that the airport was simply installing chargers in those spots as demand materialized. In that way, the airport is right sizing the chargers over time. The City of Boston has perhaps the most aggressive EV charging requirements. In 2019, the City of Boston announced that 25% of parking spaces in new off-street parking areas downtown must be equipped with EV chargers, and the remaining 75% are required to be EV-capable.
How do regulatory drivers influence EV adoption?
In certain states, EV adoption is largely influenced by the regulatory environment. The key regulatory drivers of EV adoption for airport use cases are shown in Table 6. California has by far the most stringent regulations.
Table 6. Key Regulatory Drivers of EV Adoption, by Use Case
| Regulatory Driver of EV Adoption | Ground Support Equipment | Passenger & Employee Parking | Electric Aircraft | Non-Airport-Owned Airside Vehicles | Airport Fleet Vehicles | For-Hire Vehicles | Bus & Shuttlebus | Rental Cars |
|---|---|---|---|---|---|---|---|---|
| Advanced Clean Cars II. Requires automakers in certain states to deliver an increasing percentage of cars that are electric. CA, CO, NY, WA, OR, VT, MA, RI, NJ, MD | ✓ | ✓ | ✓ | ✓ | ||||
| Advanced Clean Trucks. Requires vehicle manufacturers to deliver increasing percentages of MDHDs that are electric within the state. CA, CO, MD, MA, NM, NJ, NY, OR, VT, WA, | ✓ | ✓ | ✓ | |||||
| Advanced Clean Fleets. Requires fleet operators (businesses and government) to purchase an increasing percentage of MDHDs that are electric. Only in California. | ✓ | ✓ | ✓ | |||||
| Innovative Clean Transit. Requires all public transit agencies to transition to a 100% zero-emission bus fleet for new vehicles by 2029. Only in California. | ✓ | |||||||
| In-Use Off-Road Diesel-Fueled Fleets Regulation. Requires the phase-out use of the oldest and highest polluting off-road diesel vehicles and encourages the adoption of zero-emission technology. Only in California. | ✓ | |||||||
| California Airport Shuttle Regulation. Requires airport shuttle operators to transition to 100% ZEV technologies beginning in 2027 and through 2035.49 Only in California. | ✓ | |||||||
| Clean Miles Standard. Regulation to require electrification of ride-hailing companies starting in 2023 with annual targets requiring zero grams of CO2 greenhouse gas emissions and 90% of passenger miles traveled to be fully electric by 2030.50 Only in California. | ✓ |
How can airport planners estimate electrical load from EV charging?
Calculating expected load from EVs entails estimating the cumulative load shape across all chargers. A precise load curve is difficult to create because vehicles typically begin and end charging at different times throughout the day in an unscheduled manner. In addition, for a given charger, the power used varies through a charging session (typically highest at the beginning and lowest at the end) and depends on the beginning state-of-charge of the battery. Ideally, rather than creating a hypothetical load curve, airport planners would observe charging load over a given period (e.g., six months) to get a sense of when and where drivers are charging.
An approximate load can be calculated by multiplying the number of vehicles that are charging at a given facility at a specific time by an average power level at which they are charging. This guide does not provide rules of thumb to make this calculation. The callout box provides an example calculation for maximum potential load from EVs.
Example Calculation: Maximum EV Load
A back-of-the-envelope calculation of maximum potential EV load is a useful first step. This calculation is not intended for design or engineering purposes but provides an upper bound that can be refined.
There are several potential methods for calculating EV load, and no method is the best. As an example, suppose there are 5,000 passenger vehicles parked in the long-term parking lot on the airport’s busiest day of the year. Also, assume the following:
- By 2040, all light-duty passenger vehicles are electric.
- The number of vehicles parked at the airport will grow by 5% per year between 2025 and 2040.
- 10% of the vehicles need a charge when they arrive at the airport.
- 50% of the vehicles need to charge during the peak period.
- All vehicles use a Level 2 charger with an average power output of 10 kW.
Under these assumptions, the vehicle population would be 5,000. Growing at 5% per year means the population in 2040 is 5,000 * (1.05) ^15, or 10,400 vehicles. The anticipated EV load in 2040 would be 10,400 vehicles * 10 kW * 10% * 50%, or 5.2 MW.


