Active Traffic Management Strategies: A Planning and Evaluation Guide (2024)
Chapter: 5 ATM Performance and Data

CHAPTER 5
ATM Performance and Data

Chapter Highlights and Objectives
This chapter highlights the links between benefits, performance metrics, and data. Specific elements that are covered in this chapter include
- Performance measurement principles, goals, and objectives,
- Performance measurement process,
- Primary and supporting performance measures,
- Understanding data needs, and
- Regular reporting and public engagement efforts.
Active traffic management (ATM) strategies are implemented to achieve specific and measurable improvements in roadway conditions. Overall, the goals of ATM strategies include
- Increasing vehicle and person throughput,
- Improving travel-time reliability,
- Improving safety,
- Reducing the number of stopped vehicles and queue lengths,
- Reducing speed differentials between adjacent lanes,
- Quickly optimizing performance through automation, and
- Managing facilities to delay the onset of congestion.
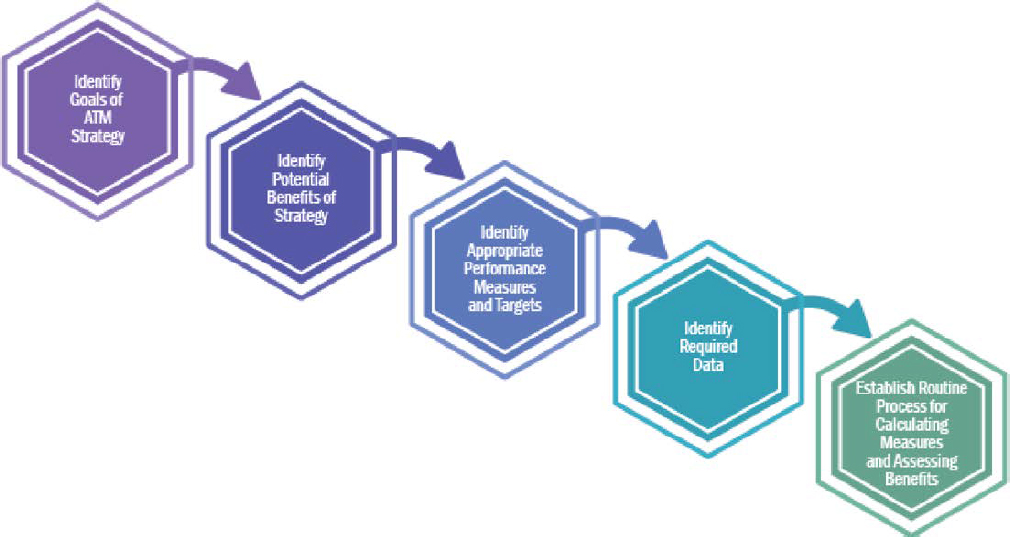
The overall process of determining whether goals are being met is identified by Lomax et al. (2013). The identification of specific strategy goals leads to defining expected benefits, performance measures to be calculated, data collection needs, and the ongoing and systematic process to collect and evaluate measures and benefits. Figure 5-1 shows the methodology to identify and evaluate strategy goals.
Basic Principles, Goals, and Objectives for ATM Performance

Developing a set of performance measures requires a complete understanding of the systems and operating strategies to be analyzed, the travel expectations of the customers, and the possible effects of the strategies. The measures are desirably the same as or closely related to those used in project forecasting and selection processes. Chapter 2 provides an overview of the typical ATM operational strategies, and Appendix B provides more detail.
Each ATM strategy is implemented to solve a particular problem—and therefore comes with expectations of benefits. Table 1-3 in Chapter 1 provides a listing of potential benefits (both primary and secondary) for multimodal ATM strategies. The key to ascertaining if the desired
benefits are being realized is the use of performance measures. Since benefits typically become apparent as trends over time, they therefore require that performance measures also be calculated over time. The calculation needs for the performance measures then translate directly back to data collection and archiving needs.

For example, one of the primary potential benefits of adaptive ramp metering is reduced ramp delay as freeway demands subside (refer to Table 1-3). For this benefit, performance measures would likely be needed for ramp demand, ramp delay, and freeway demand. A data collection and archiving process would have to collect volumes on both the ramp and freeway at discrete and recurring time intervals as well as the per-vehicle delay or wait time on the ramp from the ramp metering system.
In any implementation of an ATM strategy, data are a foundational need. Collecting the foundational data over time allows for the calculation of performance measures that can directly answer whether the anticipated benefits are being realized. Data fuels understanding, decision-making, and refinement. Most ATM strategies have the capability to collect data routinely or continuously. Data are collected, analyzed, and leveraged to gain insights, optimize processes, and drive growth. Two essential aspects of data utilization are real-time and historical data, each playing a distinct role in understanding and shaping our world.
Real-time data refer to information that is generated and processed nearly instantaneously as events occur. It is characterized by its timeliness and relevance to the present moment. Real-time data sources can include sensors, social media feeds, transaction records, and more. These data are often dynamic (constantly updating) and reflect the current situation on the roadway. Real-time data are particularly valuable in scenarios that require immediate action, such as switching from one response plan to another or detecting anomalies in complex systems.
On the other hand, historical data encompass information collected and recorded over a period of time in the past. Historical data can include archived real-time data, derivative data from analyses, deployment logs, and other structured or unstructured sources. Historical data allow for the examination of trends, patterns, and correlations that have occurred over time, again enabling insights but this time into long-term performance, forecasting, and decision-making. By analyzing historical data, organizations can identify recurring patterns to improve future operational efficiency.
Performance metrics are closely tied to data because they rely on data inputs to measure and evaluate the performance of systems and agency decisions. The availability, accuracy, and quality of data significantly impact the effectiveness and reliability of performance metrics. In general, the relationship between data and performance metrics can be summarized across five key points:
- Measurement and quantification: Performance metrics are used to quantify and measure various aspects of performance.
- Data collection and tracking: To calculate performance metrics, relevant data need to be collected and tracked over time. Inadequate or incomplete data can lead to misleading or inaccurate performance assessments.
- Benchmarking and comparison: Performance metrics often involve benchmarking and comparing current performance against historical data. Historical data provide a baseline for assessing improvements or declines in performance over time.
- Analysis and interpretation: Data analysis plays a crucial role in deriving insights from performance metrics. By analyzing the data underlying the metrics, patterns, trends, correlations, and root causes can be identified.
- Continuous monitoring and feedback: Performance metrics are not static; they require ongoing monitoring and feedback loops. Data are continually collected and analyzed to track performance in real time and provide feedback for adjustments and improvements.
Ideally, ATM performance measures are a product of operational monitoring. Daily ATM project operating decisions include such elements as price, volume, ramp metering rates, and traffic speed, just to name a few. Detailed data about these decisions are required to monitor and actively operate the freeway, street transit line, or route. In addition to reporting minute-to-minute changes, the data can also be archived, and periodic reports can be generated daily, monthly, and annually to understand trends and historical changes. Reports about the system performance and customer satisfaction, then, are merely an extension of the regular operating decisions. Other relevant observations include the following:
- Real-time monitoring and historical performance reporting draw from the same data and also desirably include many of the same measures. However, the measures should be calculated for such quantities as vehicles, people, and freight—each with different operating characteristics and expectations.
- Monitoring, measurement, and reporting systems require an archive of agency activity reports and events from computer-aided dispatch systems, incident management programs, and personnel deployment from all agencies involved in operations.
- Longer-term evaluation reports and B/C analyses also draw upon the real-time monitoring data.
- Many of the performance measures can be calculated for an individual mode and combined into a multimodal value. Both sets of values are required—some operational decisions concern a mode, road, or transit route, while other decisions relate to improving the service that travelers experience on the entire transportation network.
- Assessment of performance measures requires developing performance target values. While some measures and targets may be the product of legislative or regulatory mandates, it is
- also useful to select measures and targets that provide information beyond the reporting requirements.
The ultimate data and performance measurement goal is for ATM project planning, design, operations, performance reporting, and evaluation to be a seamless process that provides the needed information with relatively little extra data collection or analysis.
Performance Measurement Principles
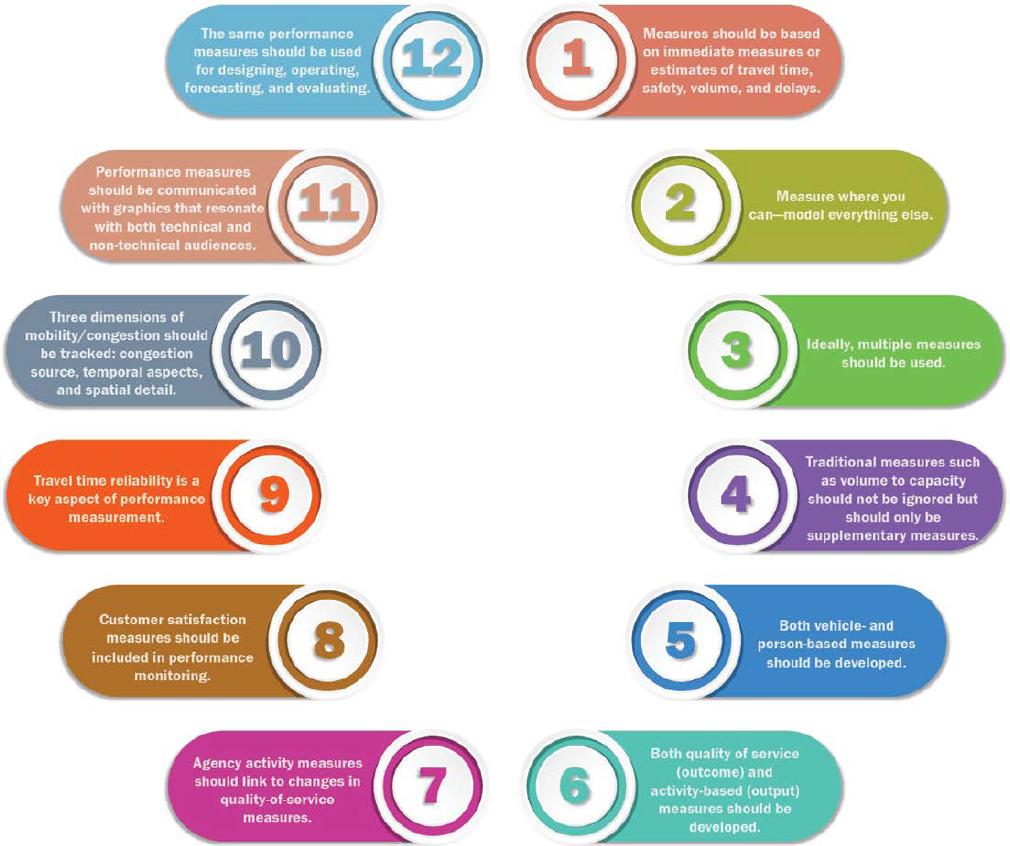
While each strategy will have its own benefits and therefore measures by which effectiveness can be determined, a robust performance measurement process is needed. Figure 5-2 identifies the 12 principles of the performance measurement development process from the Guide to Effective Freeway Performance Measurement (Margiotta et al. 2006).
Performance Measurement Process
The following steps provide an outline of key elements and decision points for transforming the typical planning process into one that is directly useful for ATM projects and programs.
Step 1. Identify the Vision, Goals, and Expected Benefits
As stated previously, the goals and anticipated benefits for ATM projects should be the start of the performance measure selection process. Goals and benefits may be in the project development documents, long-range transportation plan, public surveys, website feedback, media coverage, or election campaigns. The project or program objectives should be based on the likely effects and expressed in terms that are relatively easy to understand and technically accurate.
Since ATM projects frequently influence the adjacent street system, other modes, and even the need to physically travel at all—encouraging traffic to use the streets or drawing traffic away from the streets—the goals and objectives should include surrounding streets, bus routes, rail lines, or other potentially affected transportation elements. Active transportation and demand management is a broader concept that includes ATM and ADM (e.g., dynamic ride-sharing, on-demand transit, dynamic pricing, and predictive traveler information) and APM (e.g., dynamically priced parking, dynamic parking reservations, dynamic wayfinding, and dynamic parking capacity). The effect of any of these improvements as part of an ATM program should also be identified and tracked. Performance measures will be required to identify the type, scale, and effect of the ATM projects and programs. Having a complete understanding of where those programs are headed will make the set of measures more robust.
Step 2. Identify the Uses and Audiences
The right set of performance measures includes factors that illustrate the ATM project or program elements and their likely effects as well as the ways that the information will be used and the potential audiences. There may be some measures that are used for many purposes and some that are only used for one or two purposes. Many measures—across a range of time scales and geographies—can be created from the same dataset. For example, a set of measures that can explain ATM project effects to commuters, decision-makers, freight shippers, and operations desk staff may have the same data elements but very different terminology, detail levels, and latency (i.e., recent time) requirements.
The funding source may also play a role in which ATM performance measures are used. For example, air quality and emissions measures are very important if Congestion Mitigation and Air Quality Program funds are being used or if the project is in a nonattainment area. Projects funded by voter-approved measures or as part of legislative priorities may have specific measures attached to the expectations. ATM projects that are the first of their kind in a region typically require more data collection and earlier and more intensive reporting across a wider range of subjects, than the fourth or fifth similar project.
This is also where public engagement can help. Establishing and building relationships with many public, business, and decision-maker audiences will help an agency build support for programs and projects as well as reinforce the accountability and transparency crucial for the successful operation of innovative projects. A checklist of successful public engagement activities (Lomax et al. 2013) that can be applied to ATM projects includes the following attributes:
- Meet them where they are: Successful public engagement activities provide information to stakeholders in times and places and use technologies that are convenient to the participants.
- Provide early and often contact: An open, transparent, and interactive public participation process reduces the number and complexity of surprises for the public and project developers.
- Enlist and continually expand community-based networks of opinion shapers: These include both elected and nonelected leaders who can assist in educating various community segments. Manufacturers and freight-hauling businesses can also be important audiences for some transportation programs and ATM projects.
- Ensure meaningful interaction: Reflecting and documenting the input and opinions of those whose lives are affected by worsening travel and safety conditions builds trust.
- Ensure sufficient funding: Public engagement efforts need to be thorough, and two-way audience communication should be a part of the project development process; these efforts involve a different set of skills and people but are best funded with the same diligence as project design and operation efforts.
Step 3. Develop a Set of Performance Measures, Data Collection Elements, and Analysis Procedures
Travel time or speed and travel volume measures will form the core of an ATM evaluation program. Person-movement measures are the most easily translated measures across a wide range of applications, but vehicle measures will also be needed for assessments of capacity utilization and price-setting decisions. The measures will need to accommodate the time scales relevant to the analysis; for example, current travel time or speed is needed for dynamic lane configurations or signal operations and dynamic message sign and website displays, whereas variation in travel time from day to day is needed for service reliability evaluations. User experience measures such as travel time will also be converted to cumulative measures for economic and societal-effect analyses. Safety and other measures will be required to evaluate other important performance aspects, and activity measures such as incident response times will also be useful.
Once the measures are determined, decisions can be made about how much data are directly collected and how much should be modeled or sampled. Since most ATM projects and programs will, by definition, be operational in nature, much of the necessary data will be available. The difficult elements are not usually volume or ridership counts or traffic speed data but rather the supporting information that might not be seen as immediately useful. Incident information is typically seen as secondary to the actual response and clearance of the incident. Storage and retrieval of that information are not routine parts of many operations. Yet the day-to-day operations adjustments, program evaluations, and current operation and future expansion justifications rely on this sort of information.
Step 4. Identify the Performance Targets

ATM project performance targets usually relate to safety, congestion, and reliability performance goals. Targets should be set for the outcome performance measures such as travel time and travel-time reliability. There should also be output or agency activity targets that can be used to grade specific staff or elements of the project operations. These might include targets for the average response and clearance time for freeway vehicle crashes and targets for how frequently longer-duration incidents occur.
Some ATM projects have thresholds or operating target speeds mandated to provide clarity to the public and operating agency personnel. A typical operating standard is phrased as something like “operate at 45 miles per hour for 90 percent of the weekday peak periods.” Such operating standards or targets are important for measuring performance, guiding agency operations personnel in adjusting the price or metering rate and monitoring in real time. In general, performance measure targets are best when they are specific, measurable, achievable, relevant, and timely.
The low-volume speed (sometimes also called free-flow speed) should also be incorporated into the calculations to provide a measure of the total effect of congestion on travelers. Measures of unacceptable delay (the extra travel time experienced when speeds are below the target) and total delay (a comparison of operating speeds to low-volume speeds) are both necessary to operate and evaluate the project. Low-volume speed-based delay is a measure of the total negative effect, while the unacceptable delay quantifies the problem that should be addressed.
Target speeds or acceptable speeds are not a purely technical measure; they are often a legislatively determined value, a negotiated decision, or a public accountability exercise. The low-volume or free-flow speed is also not purely a technical matter; other analyses have used either the 85th percentile speed that occurs under low-volume conditions or the speed limit. This may miss some extra travel time, but as a practical measure, vehicles traveling at relatively high speeds are not contributing much delay.
Target setting is partly the result of performance expectations and partly an art. Some examples are noted as follows, but there are no agreed-upon target values or even approaches to target setting.
- Most targets can be improved with experience. Communicating that most targets will be reviewed as operations continue is important.
- Some of the performance targets will be mandated by agency goals or factors that were determined during project-planning discussions. Ensuring that public engagement processes talk about expectations and possible outcomes from the ATM project(s) is an important element of target setting.
- Peak-period travel speeds can be improved, but the biggest improvements are typically on the front end of the peak period when congestion onset can be delayed. A target time of day for speeds to fall into the congested range could be useful.
- Reliability targets have been set for managed lane projects; this could be adapted for dynamic speed limit, lane and shoulder use, and ramp metering and signal projects. Reducing the day-to-day variation in conditions is a central tenet of ATM. Unlike regular traffic congestion that is dictated in many corridors by the growth in jobs and homes, reliability measures are more within the control of operating agencies.
- Slowing the growth of congestion, or in some corridors reducing congestion, is a policy goal and a response from the public to the question “What should the project goal be?” The growth in jobs and homes referenced in the previous point makes this difficult to achieve and difficult for transportation agencies to control. The target may need to be expressed as “congestion will grow no more than 1 percent faster than the population.”
Measures related to equity may also be important. The overall goal of equity is to provide fairness and equal access to mobility and accessibility in order to meet the needs of all community members. Access to jobs and other transportation statistics may be relevant and identified in the output from travel models or other estimation processes. As an example, the Minnesota DOT recently incorporated equity perspectives into existing performance metric categories by examining multimodal access, inclusion, and representation in workforce recruitment and retention and compliance with Americans with Disabilities Act provisions. These measures may be further broken down by demographics such as race, gender, and community location to provide very granular insights into equity issues.
Step 5. Pre-evaluate the Projects, Programs, and Policies
Before the ATM projects begin operation, it is useful to revisit the selected measures, required data, and analytical procedures and compare them to the possible ATM projects and programs that may be evaluated. Are the analytical system and data collection comprehensive enough?
Are the appropriate freight and passenger movement concerns included? Are the data collection elements and assignments sustainable? Are the results reasonable, and do they follow previous results? Or are any differences explainable? Is the effort to produce them replicable? Will the various audiences find the information timely and relevant? Producing mock reports across a range of time levels—from real time to annual—and having them reviewed by technical users, such as system operators, the public, and executive and legislative decision-makers and their staffs, ensure that the measures, data collection, and reporting efforts are oriented to the needs of the stakeholders.
Step 6. Ongoing Performance Measurement
Using the data and measures to identify problems in real time is the focus of system operators and operations systems. Deciding which systems to deploy at what levels, when, involving which vehicle types, on which roadways or modes, and at what locations constitute the basic operating decisions that must be powered with the measures and data. The same data and measures can be used to produce regular reports and analyze possible solutions.
The data systems and measures also evolve as the audiences and decision-makers become more sophisticated. The amount and type of experience with ATM projects, the operating and information needs, and the public response alter the kinds of questions that are asked of the data and measures. This should not be seen as a failure of the initial performance measures but rather a natural process. Any results should be subjected to the proper amount of reasonableness checks, both from a technical perspective and from the more subjective “how are we doing?” side.
The analyses will also evolve as more data become available; for example, trend analysis is a more significant part of a 5-year-old program than one that is beginning. However, to whatever extent possible, the “before” condition and trend should be documented. This can be difficult because the ATM project usually includes the installation of extensive monitoring equipment and/or programs. Many effectiveness questions can be answered with a robust “before” data collection program, even if it relies on more agency activity measures than the ultimate operating system does.
Choosing Performance Measures
ATM projects are more operationally intensive, and for that reason, performance measures are a more familiar component for agencies. Most of the ATM performance measures or the data needed to prepare them are tracked and used for daily operations. Using these data and measures for planning and evaluating ATM projects, therefore, is a matter of matching local interests, needs, decisions, and understanding for each situation. The performance measure element that is not traditional is the importance of connecting with crash records, incident management information, weather statistics, and special event data. Typical ATM customer expectations are for high-speed, reliable service.
The data and measures used for the daily operations of ATM projects can also be used for planning and evaluating those projects.
The data and measures can be used to match an ATM strategy to local interests, needs, decisions, and understanding for each situation.
Some primary measures described in this section might be a secondary measure in some regions, but working through each measure and considering its usefulness in describing ATM projects are appropriate. There are relatively few data items needed to power these measures, but the level of aggregation—both in geography and in time—can vary depending on the use and situation. Projects involving trucks or freight travel improvements might require additional information, such as truck speed or collision statistics (as differentiated from all vehicles), truck origin/destination (OD) patterns, commodities carried, etc., and
may be important components of an ATM project. Freight analyses may also include different levels of priority for these types of measures. For example, travel-time reliability is often cited as a greater priority for truckers than average travel times.
Common Performance Measures
Overall, performance measures can be grouped or categorized into several main categories, including:
- Average condition measures: The average (or current) performance of the facility is the basis for most communication and evaluation related to ATM strategies. A variety of measures can be used (Table 5-1); in different contexts, the measures are all useful for every ATM strategy, but they are not all necessary.
- Travel-time reliability measures: It is particularly important for ATM projects to track the daily variation in travel conditions on the managed facility and the corridor. The effect of
Table 5-1. Average condition performance measures.
| Performance Measurea | Description | Units |
|---|---|---|
| Travel Time | The average time consumed by vehicles or people traversing a fixed distance of freeway, street, or transit route. | Minutes |
| Travel-Time Index |
The ratio of the actual travel rate to the ideal travel rate.b |
None; minimum value = 1.00 |
| Total Delay, Vehicles | The excess travel time used on a trip, facility, or road segment beyond what would occur under low-volume conditions; could also be calculated for types of vehicles (e.g., trucks). | Vehicle-hours |
| Total Delay, Persons | The excess travel time used on a trip, facility, or road segment beyond what would occur under low-volume conditions. | Person-hours |
| Delay per Vehicle | The total delay divided by the number of vehicles using the road; could also be calculated for types of vehicles (e.g., trucks). | Minutes per vehicle |
| Customer Satisfaction | Responses to a survey of travelers; divide into user/nonuser groups; survey various time periods. | Levels of satisfaction |
| Congested Travel | The percent of vehicle-miles traveled (VMT) with average sectionc speeds less than some target speed (e.g., 50 mph). | Percent |
| Congested Time | The percent of day with average sectionc speeds less than some target speed (e.g., 50 mph). | Percent |
aMeasures should be calculated for the facility (or facilities) as a whole (e.g., the entire roadway cross section and the regular and managed lanes) as well as for the different vehicle or person travel streams (e.g., truck or transit vehicles separately from private vehicles).
bThe travel rate is the inverse of speed, measured in minutes per mile. The ideal travel rate is the rate that occurs at the free-flow speed of a facility or a fixed value set for all facilities that is meant to indicate ideal conditions or unconstrained flow.
cA “section” is a length of road that represents a relatively homogeneous trip by users. Logical break points are major freeway interchanges or between cross-regional arterial streets and destinations (e.g., a central business district).
SOURCE: Adapted from Lomax et al. 2013.
Table 5-2. Travel time reliability performance measures.
| Performance Measure | Description | Units |
|---|---|---|
| Planning Time Index (Traveler Information) |
The 95th percentile travel-time index (the 95th percentile travel time for a sectiona divided by the free-flow travel-time). |
None; minimum value = 1.00 |
| Planning Time Index (Agency Activity) |
The 80th percentile travel-time index (the 80th percentile travel time for a sectiona divided by the free-flow travel time). |
None; minimum value = 1.00 |
| Operating Speed Reliability | The percent of the operating time with speeds above some threshold (e.g., 45 mph). | Percent |
aA “section” is a length of road that represents a relatively homogeneous trip by users. Logical break points are major freeway interchanges or between cross-regional arterial streets and destinations (e.g., a central business district).
SOURCE: Adapted from Lomax et al. 2013.
- ATM strategies will typically be felt in the reduction in travel-time variation rather than in the elimination of congestion in the corridor. These measures (Table 5-2) are not generally used for real-time applications. The measures can be calculated for either road or transit segments or for OD pairs.
- Throughput congestion measures: The goal of many ATM projects is to increase the number of people and vehicles that can use the corridor in a given time period. The greater efficiency gained by operating the facilities allows more travelers to be accommodated; the measures in Table 5-3 illustrate these effects.
- Safety measures: Reducing crashes and fatalities is the number-one priority of most ATM projects and is among the most frequently collected performance measures. Table 5-4 illustrates the primary measures that should be tracked for ATM projects of all kinds.
- Incident condition measures: Incident performance measures (Table 5-5) are a standard reporting scheme for virtually any agency but can illuminate the effectiveness of an ATM strategy when examined within the spatial or temporal aspects of that implementation.
Table 5-3. Throughput congestion performance measures.
| Performance Measure | Description | Units |
|---|---|---|
| Throughput, Vehicles | The number of vehicles traversing a road past a point. | Vehicles per unit time |
| Throughput, Persons | The number of persons traversing a road past a point. | Persons per unit time |
| VMT | The product of the number of vehicles traveling over a length of road multiplied by the length of the road; collected by vehicle type (e.g., trucks or cars) and vehicle occupancy, where applicable (e.g., carpools and transit vehicles). | Vehicle-miles |
| Bottlenecks (or Potential Bottlenecks)a | The number and description of bottleneck areas; likely cause, if known, and time of occurrence. | Number |
aBottleneck types are described in the HCM and typically include on- and off-ramp merge and weave areas, left exits, freeway-to-freeway interchanges, narrow shoulders, and substandard horizontal curves.
SOURCE: Adapted from Lomax et al. 2013.
Table 5-4. Safety performance measures.
| Performance Measure | Description | Units |
|---|---|---|
| Total Crashes | Crashes as defined by the state (i.e., those for which a police accident report form is generated). | Number |
| Injury and Fatal Crashes | Crashes as defined by the state (i.e., those for which a police accident report form is generated), where at least one injury or fatality occurred. | Number |
| Overall Crash Rate | The total crashes divided by VMT for the time period considered; also calculated by vehicle type. | Number per 100 million vehicle-miles |
| Injury and Fatality Crash Rate | The total injury and fatal crashes divided by VMT for the time period considered. | Number per 100 million vehicle-miles |
| Secondary Crashes | A police-reported crash that occurs in the presence of an earlier crash. | Number |
SOURCE: Adapted from Lomax et al. 2013.
Table 5-5. Incident condition performance measures.
| Performance Measure | Description | Units |
|---|---|---|
| Number of Incidents by Type and Extent of Blockage | Type: (a) crash, (b) vehicle breakdown, (c) spill, and (d) other. Blockage: the actual number of lanes or shoulders blocked. | Number |
| Incident Clearance Time | The time elapsed from the notification of an incident to when the last responder has left the incident scene. | Minutes (median) |
| Roadway Clearance Time | The time between the first recordable awareness of the incident by a responsible agency and the confirmation that all lanes are available for traffic flow. | Minutes (median) |
| Lane-Hours Lost due to Incidents | The number of whole or partial road lanes blocked by the incident and its responders multiplied by the number of hours the lanes are blocked. | Lane-hours |
| First Responder Response Time | The time difference between when the incident was first verified by an agency and the on-scene arrival of the first responder. | Minutes |
| Service Patrol Assists | The number of responses (and type) for crashes and incidents. | Number |
| Clearance Time | The time difference between when the first responder arrives on the scene and the blockage of a travel lane is removed. | Minutes |
| On-Scene Time | The time difference between when the first responder arrives and the last responder leaves an incident scene; may also be computed for individual responders. | Minutes |
| Service Patrol Vehicles in Operation per Shift | The fleet size and number of road-miles each patrol unit is responsible for (or average road-miles patrolled). The road-miles of the network and those covered by ATM strategies are also useful for understanding context. | Number and miles |
SOURCE: Adapted from Lomax et al. 2013.
Table 5-6. Work zone, weather, and event performance measures.
| Performance Measurea | Description | Units |
|---|---|---|
| Average Work Zone Delay | The extra travel time during work zone activities (compared to operation without a work zone). | Vehicle- or person-hours |
| Average Work Zone Duration by Type of Activity | The elapsed time that work zone activities are in effect. | Hours |
| Lane-Hours Lost due to Work Zones | The number of whole or partial lanes blocked by the work zone multiplied by the length of time for the work zone. | Lane-hours |
| Pavement and Bridge Condition | Condition measures that quantify potential problems affecting the ATM project operation or performance. | Varies |
| Percent of Hours Influenced by Weather | Weather influence means the measurable precipitation (e.g., more than 0.01 inch of rain) during rain or fog, or snow/ice cover on the roadway. | Percent of hours of year |
| Extent of Highways Affected by Snow, Ice, Rain, or Fog | The roadway centerline mileage under the influence of uncleared snow or ice multiplied by the length of time of the influence. | Centerline-mile-hours |
| Special Events | Some measure of the effect and timing of large events that contribute to very different operating environments affecting either demand or capacity. | Number and attendance; location; type; timing of peak-travel loadings |
| Toll Rate or Usage Fee | The toll schedule or tolls charged on managed lanes. | Dollars |
| Carpool Eligibility | Carpools that are allowed to use the managed lane (the volume of carpools noted in Table 5-3). | Number of people |
| Signal Timing Plans | Signal phasing and priority timings (needed continuously for adaptive signals). | Seconds for each phase with offsets and timings |
aThere are other operational efficiency measures in asset management information and performance measurement systems.
SOURCE: Adapted from Lomax et al. 2013.
- Work zone, weather, and event measures: Agency activities related to work zones, weather, and other special events can have an impact on ATM strategies. Examining the performance of representative measures (Table 5-6) can help explain variations in other measures such as travel-time reliability.
Arterial Performance Measures
While many performance measures for ATM implementations on freeways (such as travel time) can also be applied to an arterial application, there are some significant differences. Arterial performance measures related to intersection operations can be a major indicator of strategy effectiveness. Measures related to transit, pedestrians, and bicycles can also lend significant insight into efficiency and strategy implications to different user groups. The following list identifies several types of performance measures with direct application to arterials.
- Arterial travel time.
- Arterial delay.
- Arterial congestion.
- Capacity utilization.
- Times in different level of service (LOS).
- Bicycle volumes.
- Pedestrian actuations.
- Bicycle and pedestrian actuation delay.
- Vehicle volumes and classifications.
- Vehicle delay (per vehicle and total).
- Emissions.
- Transit throughput.
- Transit delay.
Understanding Data Needs
Once suitable performance measures and targets are identified, the next step in collecting data to accurately assess the benefits of any ATM strategy is the actual calculation of the measures. This can require substantial amounts of data.
The basic steps for collecting performance measurement data include:
- Getting consensus.
- Obtaining data from the original collection system.
- Performing analysis.
- Collecting related data to understand system performance.
Performance measurement for ATM is about compiling accurate and timely data. Referring to Chapter 4 where suitability was discussed, the same data should be used throughout the entire process of formulating, implementing, operating, and assessing ATM strategies. The data therefore need the granularity to support minute-to-minute operating decisions and year-to-year comparisons. Performance measures—whether supported by direct data collection or by estimation processes—must support the key decisions and reports. Data might be collected for specific regular purposes, for special studies, or from other sources; in any combination, all of these sources can provide the basis for a performance measurement program. Any of these sources can also be collected by a range of groups—groups internal to the performance measuring unit, others within the same organization, or other agencies. The vast majority of agencies are quite familiar with collecting data from numerous sources and processing the data to calculate performance measures. What may be different with ATM strategies, however, is the scale at which different data types are applicable.
Figure 5-3 illustrates the relationship between the scale of data collection and the various types of data. As an example, volume is a known performance measure or component of performance measures for numerous ATM strategies. Volume information is therefore required at several different scales beyond knowing the total volume, such as on a per-event basis, by vehicle class, along a segment of roadway, within a facility or corridor, or a defined OD pair. Similarly, weather information, which can be used to explain or substantiate other performance measures for ATM strategies, may need to be collected on a per-event basis as well as at the segment, corridor/ facility, or regional level. By comparison, data types such as geometry and infrastructure have no relationship to vehicles and are therefore only applicable to the scale of a segment, facility, corridor, or region.
In general, the process of performance measurement can be simplified to four basic steps:
- Get consensus, or at least general agreement, on the performance measures and reporting elements.
- Obtain the data from the original data collection system.
- Perform several analysis steps to get from raw data to the desired performance measures.
- Collect the “whys.” Data such as toll rate, eligible carpool level, and incident management activities are required to understand the resulting system performance.

A key feature of Figure 5-3 is that it illustrates not only the raw data from Step 2 but also the “why” data (e.g., weather) in Step 4. Crash information may be a primary data source for some ATM strategies but may also be part of the “why” data for others.
Other Aspects of Data to Support Performance Measures
Both the need for and the availability of substantial amounts of data have increased dramatically in recent years. What once was perhaps a relatively simple exercise of counting the vehicles on a roadway is now a more complex endeavor requiring sophistical equipment, time, and expertise and comes with cost. The cost involved is not only to collect data but to clean it, utilize it, store it, protect it, document its use, and more.
Data Sources
In the modern world of data, agencies do not have to collect all data themselves. Hundreds of third-party vendors are available from which agencies can purchase all types of data—sometimes at substantial cost savings over collecting it internally to the agency. However, the nuances of those data must be understood. Some third-party data sources rely primarily on telematics data from vehicles that transmit information back to the original equipment manufacturers. These systems are only on newer vehicles and not all vehicle classes. As an example, utilizing speed data from a third party may only include vehicles newer than 2015 and may not include commercial freight. The absence of a more holistic view of all vehicles on the roadway might skew
performance measures in some applications. On the other hand, if these speed data are only needed as a sample of the roadway operations, it may be fine for most uses. However, fleet and commercial freight vehicles should be an inquiry point for third-party data sources to understand if and how different vehicle classes are represented.
Data Quality and Integrity
To ensure that data are viable, trustworthy, and useful, quality control measures are needed to verify the accuracy, completeness, and consistency of the collected data. These processes might include removing duplicates, correcting errors, and standardizing formats. Data should be collected or purchased for a long enough period to account for variations in traffic due to events, seasons, and other factors. In particular with purchased data, substantial accompanying data must be utilized to place the vehicle data points on the right roadway with all the appropriate spatial and temporal information.
Data Usage and Dissemination
Many ATM strategies are implemented in partnerships with multiple agencies. In these situations, data sharing is not only inevitable but likely required to support the assessment needs. With third-party data, the lead agency must ensure compliance with any licensing or copyright restrictions. Agencies might need to ensure that data sharing and use agreements articulate exactly what uses are appropriate and how potentially personal information shall be protected. Agencies might also need to construct or implement data governance policies to ensure that data are respected and treated appropriately.
Data Security and Privacy
While data security and privacy concerns have always existed, ever-increasing attention is given to those requirements. Data such as the GPS coordinates of a particular vehicle or the same information along the entire trip path are commonplace. That means that nefarious use of the data could provide information to isolate individuals and their activities. Legal and regulatory requirements are in place in many locations to ensure that this type of information is indeed kept private—and when used, the information must be anonymized and aggregated. Security protocols to access controls and encryption are now commonplace needs, as are descriptive use requirements stipulating exactly how data can and will be used. This is especially true of purchased data because many third-party vendors stipulate specific usage time frames and specific applications.
Data Storage, Organization, Retention, and Archiving
An obvious follow-on from security and privacy needs is the mechanism by which data will be stored, organized, retained, and archived. The use of cloud storage is commonplace and allows for solutions that are inherently scalable in the volume and variety of data. Cloud solutions also allow for far easier transference of information between applications and personnel. That ease, however, brings potential security risks. Systems should be monitored for access and restricted to those that need the information, and in particular, raw data traceable to a particular vehicle should be highly restricted. In a similar vein, data should not be kept forever. While derivative data such as aggregate speeds may have a significant shelf life in the context of performance measures for ATM strategies, raw data that detail the speed, location, and other characteristics of a given vehicle or trip should not have a significant shelf life.
Regular Reporting and Public Engagement Efforts
While there are many keys to success for ATM strategies, public acceptance is certainly high on the list of needs. In general, communicating to the public about what to expect from an implementation and what has actually transpired revolves around performance measures. While some performance measures may be highly technical, the information conveyed to the public should communicate status and results without confusing technical details. The thought process of “less is more” is often applicable in these situations. Agencies should always present a fair and accurate assessment of any strategy, but using countless charts, tables, and figures will likely lead to confusion and take away from public support.
Audiences that include the public or an agency not involved in the day-to-day operations of ATM need an overview and the bottom line. Generally, the numbers that make up the bottom line are not as important. When communicating with such an audience, one recommended approach is as follows:
- What is the message? Identify the reason for communication.
- What is the area of concern? Identify it as a roadway, a corridor, the region, a particular location, etc.
- What is being measured? Keep it simple—speeds, travel times, accident rates, etc.
- How is performance being measured? Provide a brief description of the performance measure and its purpose.
- Where did the data come from? Identify the data sources used and an overview of any necessary manipulations.
- What are the results? Strive for clear, effective, concise information.
- What do the results mean for the audience? Make it personal—relate this information to their lives.
- What are the next steps? Identify the options or future actions.
This approach is not intended to imply that audiences are incapable of understanding the details associated with the performance measurements but merely says that conveying clear and direct information that gets to the point invites understanding and respect.
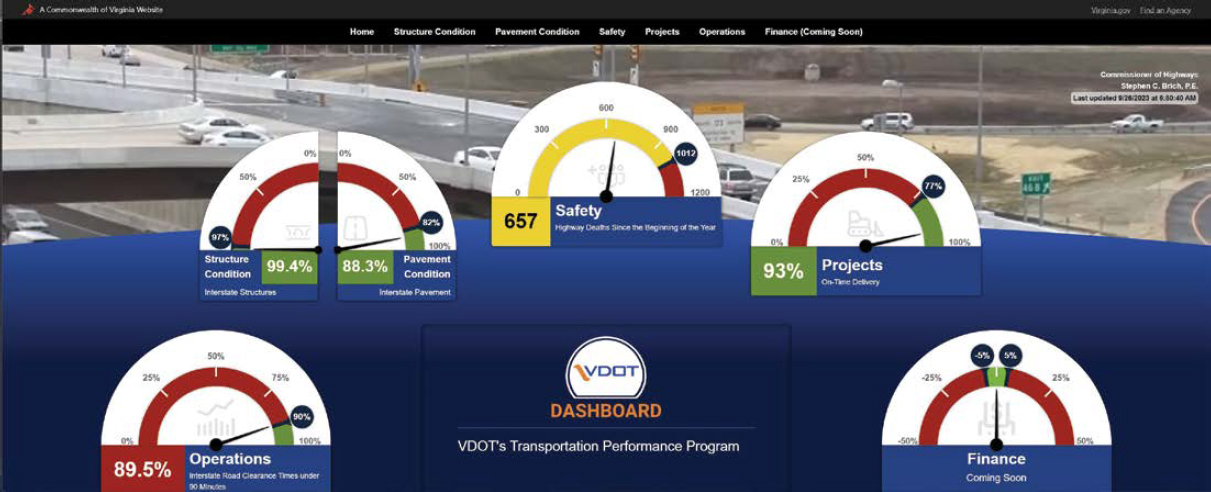
One aspect of performance measure reporting that has gained popularity is the use of dashboards. Dashboards can provide insight into specific elements of operations, such as ATM. One of the more well-known dashboards, which was developed by the Virginia DOT, is illustrated in Figure 5-4. While not specific to ATM, the website is an excellent example of providing clear and concise visual representations for various aspects of performance across the system. Similar dashboards for ATM implementations could be developed by implementing agencies and not only provide real-time operational feedback but also serve as a resource to external audiences to understand the strategy and its implementation.
Final Remarks
ATM strategies are implemented to achieve specific and measurable goals. The mechanism by which success can be evaluated is the use of performance measures. While many strategies can be supported by well-known and typical measures such as speeds, volumes, and delays, other measures of success may be more specialized such as travel-time reliability, throughput on a particular facility, reduction in a type of crash, and more.
These measures require upfront planning to determine the measures most applicable to the strategy and implementation. As identified in Chapter 4, ideally, the data and measures used for assessing the feasibility of an ATM strategy are the same for operating and assessing the success.
These measures often require substantial amounts and types of data. Multiple data sources and types may be combined to create appropriate measures. Often, additional descriptive data may be necessary such as weather conditions or information pertaining to specific events. The adequate and accurate collection and usage of data is encouraged to ensure that strategies are fairly and routinely evaluated for their effectiveness.
As a final consideration, any implementation agency has the general public and the driving population as its primary customers. That means it is necessary to report success or failure to the customer base as accurate and reliable evaluations of the implementation. While numerous technical performance measures may be necessary for in-agency evaluation and refinement, the general public will likely embrace more holistic information that answers the question whether the strategy is a success and what, if any, changes are needed to make it better.
Chapter 5 References
Lomax, T., P. Lasley, D. Ellis, and B. Stockton. (2013). Establishing Mobility Investment Priorities under TxDOT Rider 42: Public Engagement Activities Update. Texas A&M Transportation Institute.
Margiotta, R, T. Lomax, M. Hallenbeck, S. Turner, A. Skabardonis, C. Ferrell, and B. Eisele (2006). NCHRP Web-Only Document 97: Guide to Effective Freeway Performance Measurement. Transportation Research Board, Washington, DC.


