Sex and Gender Identification and Implications for Disability Evaluation (2024)
Chapter: 9 Childhood Growth Failure
9
Childhood Growth Failure
During infancy, childhood, and adolescence,1 growth (increases in length or height and weight) represents the outcome of ongoing interactions among nutritional, genetic, hormonal, and environmental factors (Thompson, 2021). Linear growth velocities are programmed such that normal growth velocity is high during infancy, slows during the juvenile years, and increases with puberty. Even short-term interruptions during these critical growth periods may have long-term impact. Given recognition of subsequent growth impairment and, in some cases, impaired cognitive performance among infants with early growth failure, early identification and intervention are essential (Boddy et al., 2000; Cooke et al., 2023). Understanding of youth2 growth trajectory is often limited when only a single measurement of height and weight is available, and documenting changes in height and/or weight over time is fundamental to clinical decision making. Growth is typically assessed by measuring increases (or the lack thereof) in three common measures: (1) length or height, (2) weight, and (3) head circumference. Other measurements may be obtained in specialty settings, including, for example, mid–upper arm circumference (Tang et al., 2021; WHO, 2009).
___________________
1 The American Academy of Pediatrics defines “infancy” as the first 11 months of life, “childhood” as years 1–10, and “adolescence” as years 11–21 (Hagan et al., 2017).
2 For the purposes of this chapter, when the committee uses the term “youth,” it applies to childhood and adolescent age ranges.
Many pediatric illnesses, particularly chronic disorders, can result in growth failure. For example, many youth with chronic kidney disease are at risk for developing growth failure because damaged kidneys may be unable to perform functions necessary to regulate nutrients from food that are necessary for growth and may not effectively help the body metabolize growth hormones (NIDDK, 2022). In addition, some youth with chronic kidney disease may not feel hungry or may not have the energy to eat. For these reasons, growth failure due to any chronic renal disease has its own disability Listing under 106.08.
Growth failure may be due to many different chronic conditions, and the Social Security Administration’s (SSA’s) disability Listings include criteria for growth failure within several disease categories, as outlined in Box 9-1. SSA currently considers a child applicant to meet criteria for growth failure based on low weight-for-length (for young children from birth to attainment of age 2 years) or low body mass index (BMI) (for older children age 2 years to attainment of age 18), with additional criteria as displayed in Box 9-1.
Factors contributing to growth failure include inadequate caloric intake, mechanical feeding issues, insufficient gastrointestinal absorption of nutrients, chromosomal disorders, hormone deficiencies, and increased metabolic needs (due, e.g., to chronic inflammation or infection). Some or all of these factors may be present in certain illnesses (Kyle, 2015). Insufficient weight gain, regardless of etiology, may ultimately impair linear growth velocity (also known as “height velocity”).
While the etiology for growth failure and needed treatments vary for specific chronic conditions, SSA’s measure for determining whether a child applicant meets criteria for growth failure is currently the same across conditions:
- “For children from birth to attainment of age two, [Listings] use the pediatric weight-for-length table corresponding to the child’s gender”
- “For children age two through attainment of age eighteen, [Listings] use the body mass index (BMI)-for-age table corresponding to the child’s gender”3
As suggested by SSA’s language, both weight-for-length and BMI-for-age (calculated as weight divided by height-squared) measures have sex-specific criteria (although, notably, the term “gender” rather than “sex” is used in the SSA criteria, the implications of which are discussed in further detail later in this chapter). Hence it is important to consider how best to use these measures for childhood disability applicants who are transgender or gender
___________________
3 Listing of Impairments 100.05, 103.06, 104.02, 105.08, 106.08, and 114.11(I) [emphasis added].
BOX 9-1
SSA Childhood Disability Listings Related to Growth Failure
Childhood Listings
100.05 Failure to thrive in children from birth to attainment of age 3*
103.06 Growth failure due to any chronic respiratory disorder
104.02 Chronic heart failure
105.08 Growth failure due to any digestive disorder
106.08 Growth failure due to any chronic renal disease
114.11(I) Human immunodeficiency virus (HIV) infection; Immune suppression and growth failure
Growth Failure Measurements
Growth failure as required in 1 or 2:
- For children from birth to attainment of age 2, three weight-for-length measurements that are: (a) within a consecutive 12-month period; and (b) at least 60 days apart; and (c) less than the third percentile on the appropriate weight-for-length Table I or II under 105.08B1
OR
- For children age 2 to attainment of age 18, three BMI-for-age measurements that are: (a) within a consecutive 12-month period; and (b) at least 60 days apart; and (c) less than the third percentile on the appropriate BMI-for-age Table III or IV under 105.08B2.
__________________
* For Listing 100.05, “Failure to thrive in children from birth to attainment of age 3,” the body mass index (BMI) chart is used for children age 2 years to attainment of age 3 (rather than age 18 years as is used in the other growth failure Listings). Otherwise, the criterion for this Listing is the same as for all other childhood growth failure Listings.
diverse (TGD) or have variations in sex traits (VSTs). For this reason, SSA included these conditions for consideration by this committee. Regardless of gender identity or biological sex (XX or XY), sole reliance on weight-for-length and BMI-for-age may miss cases of growth failure. For example, a child with a chronic illness who has both low weight and short stature might have a normal BMI, resulting in a lost opportunity for beneficial therapeutic intervention(s).
This chapter examines the pediatric weight-for-length and BMI-for-age tables, considers the flaws in these measures, examines the impact of gender-affirming hormone therapy on measurements of body composition, reviews the use of weight-for-length and BMI-for-age in disability criteria
for pediatric populations, and describes other measures of body composition that may be appropriate for TGD populations and populations with VSTs.
NORMAL DIVERSITY IN BODY COMPOSITION
Normal linear growth follows a predictable pattern. Growth charts display this pattern as percentile trajectory curves showing the distribution of selected body measurements over time as children age. Normal growth typically follows a specific trajectory within the normative range (3rd–97th percentile). Figure 9-1 charts normal growth velocity from age 2 to 18. Growth velocity is most rapid during fetal life with an approximate length increase of 25 cm during the first year of life. Growth slows to 10–15 cm per year during the second year of life. From 4 years of age until the onset of puberty, linear growth velocity is approximately 5 cm per year. Growth velocity increases again during puberty.
Accurately interpreting growth parameters requires accurate measurements, and, particularly early in life, even small errors in measurement (e.g., by 1 or several centimeters) can result in large changes in the calculated percentile for age. Thus, obtaining multiple measurements over time is extremely helpful because those that are outliers may represent measurement errors that should not be considered in an assessment of growth. However, crossing two percentile lines (e.g., because of a sudden weight loss or failure to grow in height) is often concerning and deserving of closer scrutiny. Whereas crossing length centiles is concerning after 2 years of age, it is important to be cognizant that infants may cross length centiles as they transition from their prenatal to their postnatal linear growth trajectories (Jorge et al., 2021).
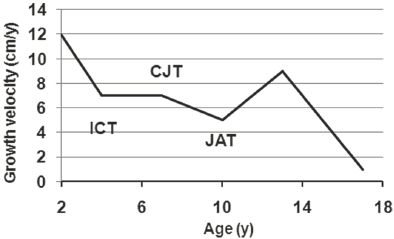
NOTE: CJT = childhood–juvenility transition; ICT = infancy–childhood transition; JAT = juvenility–adolescence transition.
SOURCE: Hochberg, 2011. CC BY 4.0.
MEASUREMENTS OF GROWTH IN PEDIATRIC POPULATIONS
As part of routine health care, infants, young children, and adolescents are weighed and their length or height and head circumference are measured to assess growth. Deviations from standardized curves may indicate acute or chronic health issues needing additional evaluation to identify disorders associated with growth failure or impairment.
Although accuracy in such measurements is essential, height measurements are particularly prone to error due to technical issues. Height should be measured with a wall-mounted stadiometer with the patient positioned erect and with the lower margins of the orbits and the upper margins of the ear canals lying in the same horizontal plane. Hair ornaments that might affect height measurement should be removed. Flip-up floppy arms found on weighing scales are often inaccurate because of inconsistency in both the patient’s posture and the angle of the horizontal bar. For infants, recumbent length is measured using a recumbent length board. Two people are required for accurate length measurement—one holding the infant’s head and the other keeping the knees straight. When height cannot be measured accurately with a wall-mounted stadiometer, such as when measuring a nonambulatory person, measurement of arm span can approximate height. To assess for disproportionate short stature, such as a skeletal dysplasia, the ratio of sitting height to standing height can be helpful. However, age-, sex-, and population-specific reference data are needed to interpret these measurements (Hawkes et al., 2020).
Infants and children less than 2 years old should be weighed naked or with a clean diaper. Children more than 2 years old should be weighed with light clothing and no shoes. For those in whom accurate weight cannot readily be determined, measurement of mid–upper arm circumference can approximate nutritional status.
The Centers for Disease Control and Prevention (CDC) publishes five gender-specific anthropometric indices (measures combining weight, stature, length, or head circumference with age or length/stature) that are commonly used to assess size and growth in children (see Table 9-1).
Two of these assessments are currently used for assessing children at risk for growth failure: (1) weight-for-length and (2) BMI-for-age. The following sections describe these two measures and their utility in assessing growth for pediatric populations with chronic health needs.
Weight-for-Length Charts
CDC (2010) and the American Academy of Pediatrics (AAP, 2022) recommend that infants and children under 2 years of age be tracked using the weight-for-length growth standard charts published by the World
TABLE 9-1 Centers for Disease Control and Prevention: Clinical Growth Charts
| Clinical Growth Chart | Age Ranges |
|---|---|
| BMI-for-age “is an anthropometric index of weight and height combined with age. BMI-for-age is used to classify children and adolescents as underweight, overweight, or at risk of overweight.” |
|
| Stature/length-for-age “describes linear growth relative to age. Stature- or length-for-age is used to define shortness or tallness.” |
|
| Weight-for-age “reflects body weight relative to age and is influenced by recent changes in health or nutritional status. It is not used to classify infants, children and adolescents as under or overweight. However, it is important in early infancy for monitoring weight and helping explain changes in weight-for-length and BMI-for-age in older children.” |
|
| Weight-for-length/stature “reflects body weight relative to length and requires no knowledge of age. It is an indicator to classify infants and young children as overweight and underweight.” |
|
| Head circumference-for-age “is critical during infancy and can be charted up to 36 months of age. Head circumference measurements reflect brain size.” |
|
a The weight-for-stature charts are included as an option for assessing children primarily between 2 and 5 years of age as pediatric health care providers make the transition to the BMI-for-age chart.
NOTE: BMI = body mass index.
Health Organization (WHO). Using these charts involves measuring a child’s weight and length and plotting them appropriately on the designated growth chart according to the child’s clinician-identified sex. Weight-for-length is considered an appropriate way to track growth and development in early infancy. It also serves as a way to ascertain atypical growth, which could be an indicator of a larger health concern (AAP, 2022).
WHO’s weight-for-length growth charts can offer clinicians a way to diagnose failure to thrive for children under age 2 years. Failure to thrive—also termed “weight faltering” or “growth failure”—is not a disease itself but a description of a growth pattern for children characterized by very low weight for age or height (Homan, 2016). Although there is no consensus on the definition of “failure to thrive,” the term is often used to describe young children who fall below the 5th percentile for sex and age as measured by WHO’s weight-for-length charts (Homan, 2016; Yoo et al., 2013). For the purposes of SSA’s disability criteria, children under age 2
must be below the 3rd percentile for weight to qualify for disability, in addition to meeting other criteria described under each listing.
Weight-for-length has limitations as a growth measure. It is likely a poor approximation of adiposity (or body fat), especially in preterm infants (Nagel et al., 2021), and may not account for the normal variability in growth observed in infancy. Research shows that infant growth percentiles may decline during the first year of life. Tracking weight and length growth over time is essential to distinguish infants with clinically significant “faltering growth” from healthy infants with fluctuating growth velocities (Bennett et al., 2014).
BMI-for-Age Chart
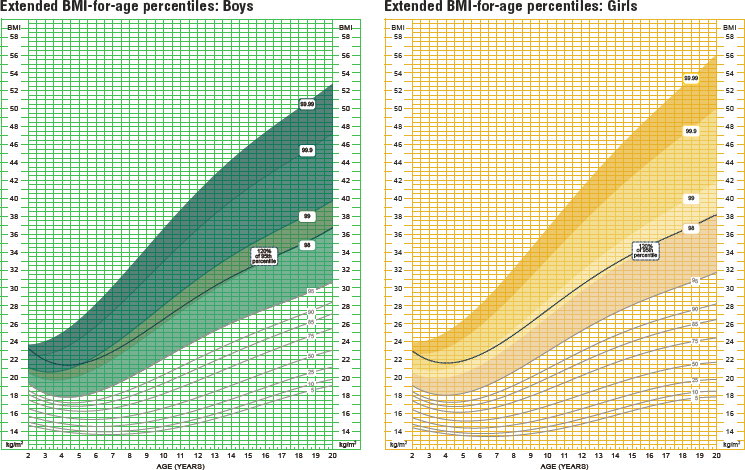
CDC and AAP recommend that children and adolescents aged 2–20 years be tracked using the BMI growth reference charts published by CDC. Separate charts are available for boys and girls. BMI-for-age growth charts serve as a reference for monitoring growth and development among children and can be used as a screening tool to identify children who may be under- or overweight. BMI is calculated by dividing weight in kilograms by height in meters squared (BMI = weight [kg]/height [m]2). Hence, BMI is easy to calculate and is considered appropriate for assessing weight in relation to stature in children and adolescents over age 2 years (CDC, 2022b; Hampl et al., 2023). For pediatric populations between 2 and 20 years old, given that body fat changes with age and may vary with sex, BMI measurements are compared with those of other youth of the same sex and similar age.4 Figure 9-2 displays the BMI-for-age charts for boys and girls aged 2–20 years, published by CDC.
Despite its common use as an indicator of general health and a proxy for obesity in epidemiological studies, BMI’s usefulness is limited. Historically, BMI is attributed to calculations performed by Adolphe Quetelet, who conducted a cross-sectional study of newborns and children based on height and weight in 1831–1832 (Jelliffe and Jelliffe, 1979). In an effort to account mathematically for differences in body build, the current BMI formula was adopted based on the concept that the body, particularly the trunk, could be considered a three-dimensional volume or mass. Thus, BMI is currently considered to reflect body composition as a measure of body adiposity. However, BMI is not a direct measure of body fat and does not distinguish between fat mass and fat-free mass (Vehrs et al., 2022); it simply assesses weight relative to height (Nevill et al., 2021; Nuttall, 2015). The increase in BMI typically seen in boys, especially with puberty, can be attributed to
___________________
4 BMI is calculated the same way for adults and children, but the results are interpreted differently. For adults over age 20, BMI classifications no longer depend on age or sex (CDC, 2022b).
SOURCE: National Health Examination Survey and National Health and Nutrition Examination Survey. Developed by: National Center for Health Statistics in collaboration with National Center for Chronic Disease Prevention and Health Promotion, 2022.
an increase in fat-free mass, whereas girls typically show an increase in fat mass. High muscle mass, such as is seen in professional athletes, for example, can result in an elevated BMI even in the relative absence of adiposity.
At the same time, however, BMI measurements parallel measurements obtained by direct measures of body fat (such as underwater weighing and dual-energy X-ray absorptiometry), and for this reason can be considered a proxy for underlying adiposity (Hampl et al., 2023). Research fails to demonstrate that BMI is better at detecting under- and overweight youth as compared with weight-for-length measurements (Mei et al., 2002). Unlike other methods of body fat measurement that may require special equipment, BMI is a simple, inexpensive, and noninvasive tool. Thus, despite its limitations, advantages of using BMI include that it can easily be calculated and tracked into adulthood (Hampl et al., 2023; Simmonds et al., 2015).
On the other hand, although BMI is deeply integrated into clinical care and health systems, several flaws become apparent when it is used as a sole metric for evaluating an individual’s health. In adults, there is a relatively poor correlation between percent body fat mass and BMI (Romero-Corral et al., 2008). Furthermore, BMI does not ascertain body fat distribution; does not, as noted above, differentiate between lean and fat body mass (a person can have a high BMI but still have a very low fat mass and vice versa); and
does not provide insight into the origins of a person’s weight status (Bray, 2023; Calcaterra, 2019; Flegal et al., 2009; Wellens et al., 1996). Calculation of BMI also depends on accurate height and weight measurements. These same limitations, found when using BMI in children and adolescents, may impact whether BMI can serve as an appropriate indicator of chronic disease status (Javed et al., 2015; Weber et al., 2013). For example, studies examining the utility of BMI for youth with asthma note that it paints an incomplete picture, as it does not examine adiposity indicators associated with asthma, asthma severity or control, atopy, and other factors relevant for lung function (den Dekker et al., 2016; Forno et al., 2014).
Additionally, an individual with a chronic disease and growth failure may have short stature and low weight and yet have a BMI that lies above the 3rd percentile. Indeed, BMI-for-age may not be a reliable indicator at the extremes of weight, as the accuracy of the predictive value of BMI declines in very lean and very overweight adolescents (Horlick, 2001). CDC BMI-for-age growth charts include percentiles between the 3rd and 97th, but may not give reliable percentage curves above the 97th or below the 3rd percentile (CDC, 2022a; Kuczmarski et al., 2002).
Finally, the BMI charts are based on the growth and development patterns of Caucasian youth. Therefore, BMI may under- or overdetect excess adiposity in youth with different genetic backgrounds (AMA, 2023a; Wagner and Heyward, 2000; WHO Expert Consultation, 2004).
For these reasons, in 2023 the American Medical Association (AMA, 2023a,b) adopted a new policy to recognize the significant limitations associated with the widespread use of BMI in clinical settings due to its inability to account for differing genetic factors.
Growth Measurement for Youth with Special Health Care Needs
Despite their limitations, the male and female WHO weight-for-length growth standards and CDC BMI-for-age growth standards published and updated by CDC and WHO continue to be used to assess growth in many populations. However, when youth have conditions that are known to interfere with growth, such as Turner syndrome or trisomy 21, more specific growth references may be available that better define growth patterns unique to these subpopulations when used along with guidelines for evaluating growth in youth with special health care needs (HRSA, 2014; Tang et al., 2021).5
Turner syndrome is a sex chromosome aneuploidy, a type of VST, due to loss or structural rearrangement of the second X chromosome.
___________________
5 Children with Down syndrome (DS) often have lower birthweights and grow more slowly compared with children without DS, and growth charts specific to children with DS can help providers monitor growth and assess how well a child with DS is developing relative to peers with DS (CDC, 2022b; Zemel et al., 2015).
This condition, which affects 1 in 2,000–2,500 female liveborn infants, is associated with short stature, congenital heart disease, renal malformations, developmental delay, delayed puberty, and infertility, with potential implications for SSA disability determinations (Isojima and Yokoya, 2023). Comparing childhood growth against a well-defined reference population of people with Turner syndrome can help providers better assess individual growth for patients with this condition and aid in decision making about initiating growth hormone treatment (Isojima and Yokoya, 2023; Lyon et al., 1985; Turner Syndrome Society of the United States, n.d.). Although growth charts developed for specific pediatric populations have some limitations (e.g., old data, limited sample sizes, inconsistent measurement techniques used with initial data), they may offer better assessment of growth and inform appropriate intervention strategies for youth with special health care needs (HRSA, 2014).
On the other hand, specific growth charts do not exist for every condition—or indeed, for most conditions. Published growth charts for BMI-for-age assume that a patient’s growth will be similar to that of typically developing (healthy) American youth, and do not account for atypical body and muscle development or physical challenges in measuring height (e.g., inability to stand, contractures, scoliosis, lack of head and trunk control) (HRSA, 2014; Polfuss et al., 2021). Studies examining youth with spina bifida, cerebral palsy, skeletal dysplasias, and muscular dystrophy raise concerns about the reliability of BMI as a measure for chronic conditions that are associated with atypical growth patterns or that impact bone and muscle development (Duran et al., 2019; Polfuss et al., 2021; Rempel, 2015; Whitney et al., 2019).
Because BMI is not an indicator of body composition and does not differentiate between lean mass and fat body mass, it may not adequately examine the important markers of malnutrition that impact chronic disease outcomes in patients of underweight status (Calcaterra, 2019; Nuttall, 2015). Best practices call for providers to offer continuous nutritional assessment and use BMI measurement along with additional methods of body growth (e.g., arm span and body composition assessments) (Calcaterra et al., 2019; Polfuss et al., 2021).
GROWTH MEASUREMENT IN TRANSGENDER AND GENDER DIVERSE YOUTH AND YOUTH WITH VARIATIONS IN SEX TRAITS
For providers measuring BMI-for-age in TGD youth or youth with VSTs, it is not always clear which chart—male or female—is the most appropriate to use. Pediatric BMI charts differ for males and females, and the female BMI chart has a wider span, including more extremes of weight (Kidd et al., 2019; Kuczmarski et al., 2002). Measuring TGD patients or patients with VSTs using
the incorrect gendered BMI chart can place these patients in the wrong BMI percentiles, which can impact care and treatment recommendations (Kidd et al., 2019) and may impact ability to qualify for disability under SSA’s listings. However, providers often lack adequate training regarding whether to use growth charts corresponding to sex recorded at birth or to gender identity.
Part of the challenge in selecting an appropriate BMI reference sex is that medical records may contain incorrect information (e.g., incorrect sex recorded in the patient chart) or lack documentation that would provide a complete picture of patient characteristics (e.g., failure to ask about gender identity or VSTs as separate from sex recorded at birth). Chapter 3 of this report describes these challenges in greater detail, but they are worth mentioning again here, as the realities of medical record data collection can impact interpretation of BMI for TGD youth and youth with VSTs. Moreover, even when medical records contain a complete and accurate record of patient sex and gender characteristics, such that providers are aware they are assessing a TGD patient or patient with a VST, providers may lack familiarity in caring for these patients and may not know how or when TGD or VST lived experience impacts patient care and clinical decision making. For these many reasons, selecting the appropriate BMI growth chart in these populations is challenging.
This section presents literature on how gender-affirming hormone therapy (GAHT) impacts youth body composition and how GAHT may impact BMI measurement and provider decision making.
Before proceeding, it should be noted that the literature does not contain research on the impact of GAHT on weight-for-length, as this measurement is intended for children aged 36 months (and is not used in SSA’s disability determinations for children aged 2 and older), and GAHT is not provided to this age group. While providers assessing body composition in infants and very young children may face similar barriers to clinical decision making (e.g., medical records may record sex improperly), in general this measurement of growth and development is not impacted by decisions around gender-affirming care. For this reason, this section on the impact of GAHT on body composition does not address the weight-for-length measurement.
Impact of GAHT on Adolescent Body Composition
Given that BMI is calculated using the patient’s weight and height, it is important to consider how GAHT may impact youth weight and body fat distribution, and height.6
___________________
6 As described in Chapter 5, GAHT is not used until puberty. This section describes the impact of GAHT on youth only during and after puberty. For prepubescent children, hormone therapy, surgeries, and other gender-affirming treatment options are not appropriate, but psychosocial interventions may be beneficial.
Weight/Body Fat Distribution
Various studies of adult TGD populations have suggested exogenous sex hormones can lead to alterations in body composition, with testosterone administration resulting in more masculine body fat distribution (an increase in lean mass and a decrease in body fat percentage), and estrogen administration causing a more feminine body fat distribution (a decrease in lean mass and an increase in total body fat and fat accumulation) (Katznelson et al., 1996; Klaver et al., 2018; Van Caenegem et al., 2015).7 However, body composition changes vary during hormone therapy; some people receiving GAHT will see no measurable change (van Velzen et al., 2020). Studies on the impact of GAHT on TGD youth are limited but show that body fat distribution shifts toward that of the affirmed sex, similar to what has been observed in the adult population (Boogers et al., 2023; Klaver et al., 2018). However, for TGD youth who receive these treatments, body composition is affected not only by GAHT but also by puberty-delaying medications—when individuals receive, for example, gonadotropin-releasing hormone (GnRH) agonists (e.g., leuprolide). Studies on body composition in TGD youth reveal an increase in fat percentage among both transgender boys and transgender girls during GnRH agonist treatment (Klaver et al., 2018; Nokoff et al., 2021; Schagen et al., 2016). The timing of GAHT and pubertal onset may also influence weight, as body composition trends among TGD youth who initiate pubertal delay differ between early and late pubertal starters (although these trends tend to level off after about 3 years) (Boogers et al., 2023).
Height
Very limited published literature provides guidance on how best to predict the impact on GnRH agonist treatment and GAHT during puberty on linear growth (height). Two recent studies found that TGD youth—both transgender males and transgender females—show a decrease in growth velocity when they begin receiving GnRH agonist treatment to pause puberty, followed by an increase during administration of GAHT (Boogers et al., 2022; Willemsen et al., 2023).
The large variation in treatment doses, protocols, and administration methods confound the generalization of the limited studies on GAHT and body composition. In addition, variable patient adherence may also influence outcome data. Available data regarding the pace of changes in body composition during GAHT are quite limited and likely affected by specific treatment protocols. Furthermore, because most available studies
___________________
7 Appendix C explores differences in body composition among adult TGD populations in greater depth.
do not compare body mass changes in TGD youth relative to cisgender peers, these studies are difficult to interpret, as rapid growth in adolescence causes changes to body composition regardless of whether puberty-delaying medication or GAHT is received. It should also be noted that TGD populations may differ in body composition from cisgender peers at baseline even without receiving GAHT, which further complicates interpretation of the impact of GAHT on body composition (Ceolin et al., 2024; Van Caenegem et al., 2015).
Impact of GAHT on BMI Measurement
GnRH agonist treatment associated with pubertal delay and GAHT may alter weight, height, and other aspects of body composition. Hence, TGD youth who receive these treatments may experience a change in their BMI measurement. Available data on BMI trends in TGD youth are sparse, and the extent to which pubertal delay or GAHT in adolescence impacts BMI is unclear (Jarin et al., 2017; Olson et al., 2015; Sequeira et al., 2017). One retrospective study compared 42 transgender males (aged 14–21) with BMI-matched cisgender females, finding a significant increase in BMI for the transgender males after the initiation of testosterone therapy (Valentine et al., 2021). The transgender group had an increase in BMI of +3.29 percentiles from baseline through final follow-up (average length of time: 10.8 months), compared with a decrease of 1.77 percentiles for the cisgender group. A study by Klaver and colleagues (2020) similarly shows an increase in BMI (+2.3 kg/m2; 95% confidence interval [CI] 1.7–2.9 kg/m2) for 121 transgender males aged 15–22 receiving GAHT, while findings by Boogers and colleagues (2023) show a smaller increase in BMI among a cohort of 235 transgender males aged 18 years or younger (+1.0 kg/m2; 95% CI 0.5–1.5 kg/m2), remaining stable thereafter. Other studies report that transgender males see an increase in BMI after initiation of testosterone treatment but have not found these effects to be sustained over time.
For adolescent transgender females who receive estradiol, two studies found an increase in BMI: one study examining a cohort of 71 transgender females aged 15–22 found a significant increase in BMI (+3.0 kg/m2; 95% CI 1.6–4.4 kg/m2); the other found a smaller increase in BMI (+1.7 kg/m2; 95% CI 1.0–2.3 kg/m2) among 111 transgender girls aged 18 or younger (Klaver et al., 2020; Boogers et al., 2023). However, other studies have found no significant change in BMI among adolescent transgender females receiving GAHT.
The mixed reports on BMI among TGD youth echo similarly mixed results found in assessing BMI for adults receiving GAHT. Additional studies are needed to better understand the role of GAHT in BMI measurement for transgender youth.
While this area is insufficiently studied, providers need to consider TGD care experience when interpreting BMI. The literature calls on providers to recognize the importance of “prior patient history, pubertal stage, and any gender-affirming pharmacological interventions that may alter height/weight” when selecting the optimal BMI chart for TGD youth (Kidd et al., 2019, p. 299). While pubertal delay and GAHT administration may impact adolescent body composition, each patient may be different, and plotting changes over time is likely to be more useful than interpreting a single measurement.
Dual Calculations
As discussed previously in this report, dual calculations of BMI (trending the patient using both male and female charts) may aid in clinical decision making for some TGD patients (Kidd et al., 2019), as studies have found that TGD youth receiving GAHT (either testosterone or estradiol) show body composition values that fall between BMI-matched cisgender males and cisgender females (Bomberg et al., 2023). A dual calculation approach may also help providers navigate the use of gendered growth charts for some patients with VSTs.
Provider Decision Making for BMI Interpretation
Commonly, and potentially inaccurately, clinicians use the sex recorded in the medical record (whether or not recorded accurately) as the basis for BMI interpretation when using CDC growth reference charts. Some providers may take into account individual patient history related to gender-affirming care when measuring BMI, but without guidelines in place, providers may have to make difficult or arbitrary judgments about which chart is most appropriate for a given patient at a given time. Depending on which growth chart providers choose, they may diagnose growth failure when it does not exist or fail to diagnose it when it does—both outcomes impacting eligibility for SSA disability benefits.
Kidd and colleagues (2019) propose that providers consider dual calculations of BMI (trending the patient using both male and female charts) for all TGD youth to help “navigate the inherent limitations of using gendered growth charts” (p. 299). Kidd and colleagues (2019) state that dual calculations are most critical for individuals at the extremes of BMI. Bomberg and colleagues (2023) propose that sex-nonspecific growth charts and BMI curves be used for TGD youth. In their research on 39,119 youth, the authors developed new growth charts that “age smooth differences in pubertal timing between sexes to determine how youth are growing as ‘children’ versus ‘girls or boys’” (see Figure 9-3; Bomberg et al., 2023, p. 1).
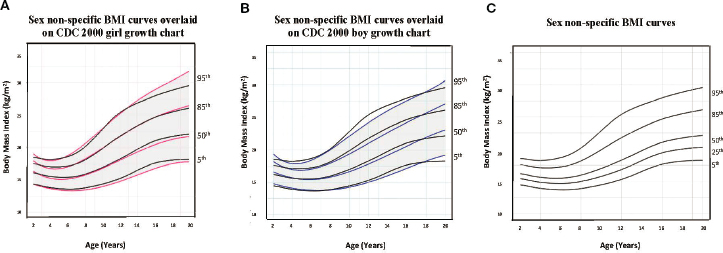
NOTE: Bomberg and colleagues (2023) provide the following explanation of the above figure: “(A) shows our age-adjusted sex non-specific BMI curves overlaid on the CDC 2000 girl age- and sex-adjusted BMI curves, highlighting the 5th, 50th, 85th, and 95th percentiles. (B) shows our age-adjusted sex non-specific BMI curves overlaid on the CDC 2000 boy age- and sex-adjusted weight curve, highlighting the 3rd, 50th, 85th, and 95th percentiles. (C) shows our age-adjusted sex non-specific BMI growth curves. Here, we highlight the 5th (underweight), 25th, 50th, 85th (overweight), and 95th (obesity) percentiles given their clinical utility.” (p. 4)
SOURCE: Bomberg et al., 2023. Originally published by Frontiers. CC BY 4.0 DEED.
The committee found no research to indicate the extent to which the approaches proposed by Kidd and colleagues (2019) or Bomberg and colleagues (2023) are used among providers. In the committee’s opinion, however, these approaches are not common and not yet validated.
Given considerable challenges involved in selecting the appropriate BMI reference chart for certain adolescent TGD patients and patients with VSTs, BMI may be a particularly unreliable measure for these populations. Coupling this reality with the fact that BMI is considered to be an unreliable indicator for underweight children below the 3rd percentile (and thus for identifying growth failure using SSA’s criteria), BMI is likely to be particularly inaccurate in diagnosing growth failure in youth who undergo pubertal delay and/or receive GAHT.
GROWTH FAILURE AND SSA DISABILITY DETERMINATION
The various SSA growth failure categories listed in Box 9-1 all use the weight-for-length table (for children from birth to attainment of age 2 years) and the BMI-for-age table (for children age 2 years to attainment of age 18). As in other areas of the disability Listings, weight-for-length and
BMI-for-age measurements are just one component of the medical evidence accepted to demonstrate growth failure and disability. For example, for growth failure related to immune suppression (under 114.11[I]), the childhood applicant must also submit a CD4 count—the result of a laboratory test that measures the number of CD4 T cells and serves as an indicator of the effectiveness of the antiretroviral treatment. Likewise, for growth failure due to any chronic respiratory disorder (103.06), the childhood applicant must also submit medical evidence of hypoxemia (low levels of oxygen in the blood).
Still, BMI-for-age measurements are a key component of meeting disability criteria for children and adolescents over age 2 years. For TGD applicants and applicants with VSTs, if their health care provider has not selected the appropriate CDC growth chart to assess BMI-for-age, the BMI percentile recorded in the patients’ medical records may not indicate their health status accurately, impacting their ability to qualify for disability benefits.
Given the many challenges described in this chapter, SSA might consider certain adjustments to its growth failure disability Listings to ensure that adjudicators have the appropriate tools for accurately assessing growth failure for TGD populations or populations with VSTs. The next sections review considerations for SSA with respect to terminology related to both the weight-for-length and BMI-for-age tables published under Listing 105.08B (SSA, n.d.-a). Most important, this section describes alternative measures for assessing growth failure and disability in TGD youth and youth with VSTs.
Terminology in SSA Criteria
For each of the listings in Box 9-1, SSA evaluates growth failure using either the weight-for-length table or BMI-for-age table provided under Listing 105.08B (SSA, n.d.-a). As is standard in growth charts used across pediatrics, weight-for-length and BMI-for-age tables use sex recorded at birth as the appropriate reference sex, meaning that a provider must compare weight-for-length or BMI-for-age against a male or female growth chart (CDC, 2022b). However, SSA’s disability criteria use the term “gender” in reference to these growth measurements: “[W]e evaluate a child’s growth failure by using the appropriate table for age and gender” [emphasis added] (SSA, n.d.-a). This language may incorrectly indicate that it is “gender identity” that is determinative when interpreting weight-for-length and BMI-for-age in Listings related to childhood growth failure.
The committee notes that BMI is also used as a measure of weight loss under the adult Listings to document weight loss related to digestive
disorders (5.08); kidney disease (6.05B4); and HIV infection (14.11G).8 While SSA follows clinical guidelines by not tying BMI to sex-specific criteria, SSA again uses the term “gender” here (SSA, n.d.-b). The conflation of these terms throughout disability evaluation criteria can lead to confusion for both applicants and adjudicators. SSA might consider updating this language to reflect current guidelines, differentiating sex recorded at birth from gender identity as defined in Chapter 2.
Growth Failure under SSA Criteria: Relevant Measures of Growth for Children Aged 2–18
Other than BMI-for-age, the various SSA Listings for which evidence of growth failure is required include no other available measurements of body composition. However, best practices call for providers to use BMI measurement along with additional methods of body composition assessment because of concerns about the utility of BMI as a sole indicator of appropriate weight and health. In 2023, AMA (2023a,b) adopted a new policy to support using BMI in conjunction with other valid measures, stating that additional appropriate body composition measures may include measurements of visceral fat, body adiposity index, body composition, relative fat mass, waist circumference, and genetic/metabolic factors.
Linear Growth Velocity
Chronic disease can result in a slowing of the normal rate of linear growth (i.e., attainment of height) in children and adolescents of all ages. As discussed previously, this rate of growth is referred to as linear growth velocity (or height velocity) and is equal to the difference in two length or height measurements taken at different points in time (at least 3–6 months apart), divided by the time between those two measurements in years. Appropriate linear growth indicates integrity of the hypothalamic-pituitary-growth axis, nutritional sufficiency, and a safe socioeconomic environment. Linear growth deceleration provides an indicator of potential nutritional inadequacy, deleterious genetic variants, hormone deficiencies, and/or chronic disease (Benjamin-Chung et al., 2023; De Sanctis et al., 2021). Linear growth velocity is therefore considered the single most relevant assessment of child health, especially from 2 years of age through achievement of adult height. According to Thompson (2021), “linear growth is considered the ‘best overall indicator of child well-being’” (p. 2).
___________________
8 This chapter does not examine adult Listings for BMI, as SSA’s disability Listings make clear, under 5.00F2, that “calculation and interpretation of the BMI are independent of gender in adults” (SSD, n.d.-b).
A practical rule is that at any age, linear growth velocity of less than 4 centimeters per year is diagnostic of growth failure. What constitutes a normal linear growth velocity varies based on a child’s age (e.g., children aged 1–4 years typically grow ~10–15 cm/year, but children and adolescents typically grow only ~5 cm/year before their pubertal growth spurt). Therefore, the most accurate approach is to plot growth on a height velocity chart. Notably, these charts are sex based, and thus careful consideration of sex and gender identity is essential in selecting the correct chart, as discussed earlier in this chapter. A height velocity below the 10th percentile for age and sex indicates growth failure. As with percentage weight loss, described below, the ideal time frame for assessing height velocity differs from SSA’s usual windows of at least 60 days to under 12 months. The two or more measurements that go into calculating an individual’s height velocity should be obtained at least 3–6 months apart (60 days would be insufficient), and often might be obtained beyond the 12-month maximum required under the SSA disability criteria, outlined in Box 9-1.
Percentage Weight Loss
Percentage weight loss is a measure used to identify malnutrition, a key risk factor for growth failure in the setting of chronic disease. When individuals with chronic medical conditions are unable to meet their nutritional needs, they can experience severe, clinically significant weight loss that may not necessarily result in a BMI low enough to qualify an individual for disability. In these cases, if two or more weight measurements are available, youth aged 2 years and older whose weight decreases by 10 percent or more of their usual body weight meet criteria for “severe” malnutrition. Such weight loss occurring in the setting of an already low BMI (i.e., <50th percentile for sex and age) in an individual with a chronic medical condition would be highly concerning, even if it does not lead to a BMI below the 3rd percentile. Documenting percentage weight loss can therefore be useful for assessing health for youth at risk of growth failure and could be worth including in SSA’s disability criteria.
Other Measures
For pediatric populations at risk of poor nutritional status because of chronic disease and disability, other appropriate assessments of body composition include dual-energy X-ray absorptiometry, doubly labeled water, and bioelectrical impedance analysis (BIA) (Calcaterra et al., 2019; Pelizzo et al., 2017; Whitney et al., 2019). Such technology is not readily available in all settings but may be used in specialty settings. For example, BIA offers an accurate and reproducible method for assessing body composition.
Unlike BMI, BIA provides detailed information about the individual components of body composition, including the amount of body fat, muscle mass, and body water. Some literature suggests that BIA can provide a fast, simple, and low-cost alternative to BMI and that it may provide more accurate measurement of body composition for youth with chronic illness. However, no guidelines, normative ranges, or best practices have been clearly established for its use (Calcaterra et al, 2019).
These alternative measures deserve further study in youth with TGD or VST lived experience—particularly those who have received puberty-delaying medications or received GAHT—and can supplement BMI as commonly used clinical indicators of growth failure when SSA makes a disability determination.
Regardless of how body parameters are assessed, the medical literature points to the requirement for multiple assessments of growth and body composition. Multiple longitudinal measurements for ascertaining physical health are more accurate than single cross-sectional measurements in youth with chronic diseases, ultimately resulting in better decision making and selection of treatment options (Calcaterra et al., 2019).
SUMMARY OF KEY POINTS
This chapter has presented literature and guidelines that call for use of alternative measures of body composition along with BMI or instead of BMI, given concerns about the utility and accuracy of BMI-for-age as the sole measurement. BMI-for-age may be an especially poor measure for identifying growth failure, as it is not considered a reliable indicator for youth below the 3rd percentile of weight. In addition, because BMI does not differentiate between lean and fat body mass, it may not adequately account for the important elements of body composition that matter for youth who are experiencing growth failure related to underlying chronic disease.
BMI can be particularly inaccurate in identifying growth failure in youth receiving GAHT.9 In this population, linear growth velocity may be a better indicator of growth failure. Percentage weight loss—a common measure for identifying malnutrition, a key risk factor for growth failure in the setting of chronic disease—is another useful metric for assessing health for children at risk of growth failure, and it may be worth including in SSA’s
___________________
9 Where people with VSTs take GAHT, the approaches described here may be appropriate; however, research is limited on the impact of GAHT in populations with VSTs. The committee notes that people with VSTs take hormone therapy for a multitude of reasons beyond gender-affirming care and care is extremely individualized; the impact of various hormone therapies on sex-specific measurements is unknown.
disability criteria. SSA may better serve pediatric populations by including these alternative measures in the 105.08B criteria and across various childhood growth failure Listings, as these measures may provide for more accurate assessment of not only TGD youth but all pediatric populations that apply for disability benefits.
However, as discussed previously, BMI-for-age is a common measure of childhood growth and is readily obtained in clinical settings. For this reason, it will continue to be present in medical records submitted to SSA. This chapter has presented the available literature on the impact of pubertal delay and GAHT on body composition and BMI measurement. While more research is needed in this area, the evidence available indicates that pubertal delay and GAHT matter for measuring body composition such that it is important for providers to take these experiences into account when interpreting BMI. It may be appropriate for providers to calculate BMI using both male and female charts (“dual calculations”) to aid in clinical decision making for their patients, and SSA should be aware that it may receive medical records for TGD youth containing measurements of BMI using both charts. SSA may also receive BMI calculations from both charts if providers are mistaken or lack training and guidance on which chart to use.
It is the consensus of the committee, based on its clinical expertise and professional judgment, that in cases where the medical record contains BMI measurements from both charts, SSA would best serve TGD applicants and applicants with VSTs by using the lower percentile BMI value to determine disability. Given what remains unknown about how GAHT impacts body composition and the lack of guidance available for how BMI should be interpreted for TGD youth and youth with VSTs, such an approach would ensure fairness for youth with TGD or VST lived experience who have not had access to providers trained to interpret their results thoroughly and thoughtfully and with consideration of their individual patient history.
REFERENCES
AAP (American Academy of Pediatrics). 2022. WHO growth charts for infants 0-24 months. https://www.aap.org/en/patient-care/newborn-and-infant-nutrition/newborn-and-infant-nutrition-assessment-tools/term-infant-growth-tools/ (accessed April 2, 2024).
AMA (American Medical Association). 2023a. Report 07 of the council on science and public health (A-23). Chicago, IL. https://www.ama-assn.org/system/files/a23-csaph07.pdf (accessed March 9, 2024).
AMA. 2023b. AMA adopts new policy clarifying role of BMI as a measure in medicine. https://www.ama-assn.org/press-center/press-releases/ama-adopts-new-policy-clarifying-role-bmi-measure-medicine#:~:text=Jun%2014%2C%202023&text=The%20report%20also%20outlined%20the,genders%2C%20and%20age%2Dspan (accessed July 15, 2023).
Benjamin-Chung, J., A. Mertens, J. M. Colford, A. E. Hubbard, M. J. van der Laan, J. Coyle, O. Sofrygin, W. Cai, A. Nguyen, N. N. Pokpongkiat, S. Djajadi, A. Seth, W. Jilek, E. Jung, E. O. Chung, S. Rosete, N. Hejazi, I. Malenica, H. Li, R. Hafen, V. Subramoney, J. Häggström, T. Norman, K. H. Brown, P. Christian, B. F. Arnold, S. Abbeddou, L. S. Adair, T. Ahmed, A. Ali, H. Ali, P. Ashorn, R. Bahl, M. L. Barreto, F. Begín, P. O. Bessong, M. K. Bhan, N. Bhandari, S. K. Bhargava, Z. A. Bhutta, R. E. Black, L. Bodhidatta, D. Carba, I. Gonzalez Casanova, W. Checkley, J. E. Crabtree, K. G. Dewey, C. P. Duggan, C. H. D. Fall, A. S. G. Faruque, W. W. Fawzi, J. Q. da Silva Filho, R. H. Gilman, R. L. Guerrant, R. Haque, S. Y. Hess, E. R. Houpt, J. H. Humphrey, N. T. Iqbal, E. Y. Jimenez, J. John, S. M. John, G. Kang, M. Kosek, M. S. Kramer, A. Labrique, N. R. Lee, A. Â. M. Lima, M. Mahfuz, T. C. Mahopo, K. Maleta, D. S. Manandhar, K. P. Manji, R. Martorell, S. Mazumder, E. Mduma, V. R. Mohan, S. E. Moore, I. Mostafa, R. Ntozini, M. E. Nyathi, M. P. Olortegui, W. A. Petri, P. S. Premkumar, A. M. Prentice, N. Rahman, H. S. Sachdev, K. Sadiq, R. Sarkar, N. M. Saville, S. Shaikh, B. P. Shrestha, S. K. Shrestha, A. M. Soares, B. Sonko, A. D. Stein, E. Svensen, S. Syed, F. Umrani, H. D. Ward, K. P. West, L. S. F. Wu, S. Yang, P. P. Yori, and The Ki Child Growth Consortium. 2023. Early-childhood linear growth faltering in low- and middle-income countries. Nature 621(7979): 550–557.
Bennett, W. E., Jr., K. S. Hendrix, R. T. Thompson, A. E. Carroll, and S. M. Downs. 2014. The natural history of weight percentile changes in the first year of life. JAMA Pediatrics 168(7):681–682.
Boddy, J., D. Skuse, and B. Andrews. 2000. The developmental sequelae of nonorganic failure to thrive. Journal of Child Psychology and Psychiatry 41(8):1003–1014.
Bomberg, E. M., B. S., Miller, O. Y., Addo, A. D., Rogol, M. M., Jaber, and K. Sarafoglou. 2023. Sex non-specific growth charts and potential clinical implications in the care of transgender youth. Frontiers in Endocrinology 14:1227886.
Boogers, L. S., C. M. Wiepjes, D. T. Klink, I. Hellinga, A. S. P. van Trotsenburg, M. den Heijer, and S. E. Hannema. 2022. Transgender girls grow tall: Adult height is unaffected by GnRH analogue and estradiol treatment. Journal of Clinical Endocrinology & Metabolism 107(9):e3805–e3815.
Boogers, L. S., S. J. P. Reijtenbag, C. M. Wiepjes, A. S. P. van Trotsenburg, M. den Heijer, and S. E. Hannema. 2023. Time course of body composition changes in transgender adolescents during puberty suppression and sex hormone treatment. Journal of Clinical Endocrinology & Metabolism 109(8):e1593–e1601.
Bray, G. 2023. Beyond BMI. Nutrients 15(10):2254.
Calcaterra, V. P. 2019. BMI is a poor predictor of nutritional status in disabled children: What is the most recommended method for body composition assessment in this pediatric population? Frontiers in Pediatrics 226.
Calcaterra, V., H. Cena, M. Manuelli, L. Sacchi, V. Girgenti, C. Larizza, C., and G. Pelizzo. 2019. Body hydration assessment using bioelectrical impedance vector analysis in neurologically impaired children. European Journal of Clinical Nutrition 73(12): 1649–1652.
CDC (Centers for Disease Control and Prevention). 2010. WHO growth standards are recommended for use in the U.S. For infants and children 0 to 2 years of age. https://www.cdc.gov/growthcharts/who_charts.htm#print (accessed April 2, 2024).
CDC. 2017. Clinical growth charts. https://www.cdc.gov/growthcharts/clinical_charts.htm (accessed April, 2024).
CDC. 2022a. Adult BMI calculator. Division of Nutrition, Physical Activity, and Obesity, National Center for Chronic Disease Prevention and Health Promotion. https://www.cdc.gov/healthyweight/assessing/bmi/adult_bmi/english_bmi_calculator/bmi_calculator.html (accessed March 13, 2024).
CDC. 2022b. Clinical growth charts. National Center for Health Statistics. https://www.cdc.gov/growthcharts/clinical_charts.htm (accessed March 9, 2024).
Ceolin, C., A. Scala, M. Dall’Agnol, C. Ziliotto, A. Delbarba, P. Facondo, A. Citron, B. Vescovi, S. Pasqualini, S. Giannini, V. Camozzi, C. Cappelli, A. Bertocco, M. De Rui, A. Coin, G. Sergi, A. Ferlin, A. Garolla, and Gender Incongruence Interdisciplinary Group. 2024. Bone health and body composition in transgender adults before gender-affirming hormonal therapy: Data from the comet study. Journal of Endocrinological Investigation 47(2):401–410.
Cooke, R., O. Goulet, K. Huysentruyt, K. Joosten, A. V. Khadilkar, M. Mao, R. Meyer, A. M. Prentice, and A. Singhal. 2023. Catch-up growth in infants and young children with faltering growth: Expert opinion to guide general clinicians. Journal of Pediatric Gastroenterology and Nutrition 77(1):7–15.
De Sanctis, V., A. Soliman, N. Alaaraj, S. Ahmed, F. Alyafei, and N. Hamed. 2021. Early and long-term consequences of nutritional stunting: From childhood to adulthood. Acta Biomedica: Atenai Parmensis 92(1):e2021168.
den Dekker, H., K. Ros, J. de Jongste, I. Reiss, V. Jaddoe, and L. Duijts. 2016. Body fat mass distribution and interrupter resistance, fractional exhaled nitric oxide and asthma at school-age. Journal of Allergy and Clinical Immunology 139(3):810–818.
Duran, I., K. Martakis, M. Rehberg, O. Semler, and E. Schoenau. 2019. Anthropometric measurements to identify undernutrition in children with cerebral palsy. Developmental Medicine and Child Neurology 61:1168–1174.
Flegal, K. M., J. A. Shepherd, A. Looker, B. Graubard, L. Borrud, C. Ogden, T. Harris, J. Everhart, and N. Schenker. 2009. Comparisons of percentage body fat, body mass index, waist circumference, and waist-stature ratio in adults. American Journal of Clinical Nutrition 89(2):500–508.
Forno, E., E. Acosta-Perez, J. Brehm, Y. Han, M. Alvarez, A. Colon-Semidey, G. Canino, and J. Celedón. 2014. Obesity and adiposity indicators, asthma, and atopy in Puerto Rican children. Journal of Allergy and Clinical Immunology 133(5):1308–1314.
Hagan, J. F., J. S. Shaw, and P. M. Duncan (eds). 2017. Bright futures: Guidelines for health supervision of infants, children, and adolescents. Elk Grove Village, IL: American Academy of Pediatrics.
Hampl, S., S. Hassink, A. Skinner, S. Armstrong, S. Barlow, C. Bolling, K. Avila Edwards, I. Eneli, R. Hamre, M. Joseph, D. Lunsford, E. Mendonca, M. Michalsky, N. Mirza, E. Ochoa, M. Sharifi, A. Staiano, A. Weedn, S. Flinn, J. Lindros, and K. Okechukwu. 2023. Clinical practice guideline for the evaluation and treatment of children and adolescents with obesity. Pediatrics 151(2):e2022060640.
Hawkes, C. P., S. Mostoufi-Moab, S. E. McCormack, A. Grimberg, and B. S. Zemel. 2020. Sitting height to standing height ratio reference charts for children in the United States. Journal of Pediatrics 226:221–227.e15.
Hochberg, Z. 2011. Developmental plasticity in child growth and maturation. Frontiers in Endocrinology 2.
Homan, G. J. 2016. Failure to thrive: A practical guide. American Family Physician 94(4):295–299.
Horlick, M. 2001. Body mass index in childhood—measuring a moving target. Journal of Clinical Endocrinology and Metabolism 86:4059–4060.
HRSA (Health Resources and Services Administration). 2014. CDC growth charts for children with special health care needs. North Bethesda, MD. https://depts.washington.edu/growth/cshcn/text/page1a.htm (accessed March 9, 2024).
Isojima, T., and S. Yokoya. 2023. Growth in girls with Turner syndrome. Frontiers in Endocrinology 13.
Jarin, J., E. Pine-Twaddell, G. Trotman, J. Stevens, K. A. Conard, E. Tefera, and V. Gomez-Lobo. 2017. Cross-sex hormones and metabolic parameters in adolescents with gender dysphoria. Pediatrics 139(5).
Javed, A., M. Jumean, M. Murad, D. Okorodudu, S. Kumar, V. Somers, O. Sochor, and F. Lopez-Jimenez. 2015. Diagnostic performance of body mass index to identify obesity as defined by body adiposity in children and adolescents: A systematic review and metaanalysis. Pediatric Obesity 10(3):234–244.
Jelliffe, D. B., and E. F. Jelliffe. 1979. Underappreciated pioneers Quételet: Man and index. American Journal of Clinical Nutrition 32(12):2519–2521.
Jorge, A. A. L., A. Grimberg, M. T. Dattani, and J. Baron. 2021. Disorders of human growth. In Sperling pediatric endocrinology, 5th ed., edited by M. A. Sperling, J. A. Majzoub, R. K. Menon, and C. A. Stratakis. Amsterdam, Netherlands: Elsevier.
Katznelson, L., J. S. Finkelstein, D. A. Schoenfeld, D. I. Rosenthal, E. J. Anderson, and A. Klibanski. 1996. Increase in bone density and lean body mass during testosterone administration in men with acquired hypogonadism. Journal of Clinical Endocrinology & Metabolism 81(12):4358–4365.
Kidd, K. S., G. Sequeira, C. Dhar, G. montano, S. Feldman Witchel, and D. Rofey. 2019. Gendered body mass index percentile charts and transgender youth: Making the case to change charts. Transgender Health 4(1):297–299.
Klaver, M., R. de Mutsert, C. M. Wiepjes, J. Twisk, M. den Heijer, J. Rotteveel, and D. Klink. 2018. Early hormonal treatment affects body composition and body shape in young transgender adolescents. Journal of Sexual Medicine 15:251–260.
Klaver, M., R. de Mutsert, M. van der Loos, C. M. Wiepjes, J. W. R. Twisk, M. den Heijer, J. Rotteveel, and D. T. Klink. 2020. Hormonal treatment and cardiovascular risk profile in transgender adolescents. Pediatrics 145(3).
Kuczmarski, R. J., C. L. Ogden, S. S. Guo, L. M. Grummer-Strawn, K. M. Flegal, Z. Mei, R. Wei, L. Curtin, A. Roche, and C. Johnson. 2002. 2000 CDC growth charts for the United States: Methods and development. Vital Health Statistics 11:1–190.
Kyle, U. S.-B. 2015. Growth failure and nutrition considerations in chronic childhood wasting diseases. Nutrition in Clinical Practice 30(2):227–238.
Lyon, A. J., M. A. Preece, and D. B. Grant. 1985. Growth curve for girls with Turner syndrome. Archives of Disease in Childhood 60:932–935.
Mei, Z., L. M. Grummer-Strawn, A. Pietrobelli, A. Goulding, M. I. Goran, and W. H. Dietz. 2002. Validity of body mass index compared with other body-composition screening indexes for the assessment of body fatness in children and adolescents. American Journal of Clinical Nutrition 75(6):978–985.
Nagel, E., C. Desjardins, C. Earthman, S. Ramel, and E. Demerath. 2021. Weight for length measures may not accurately reflect adiposity in preterm infants born appropriate for gestational age during hospitalisation or after discharge from the neonatal intensive care unit. Pediatric Obesity 16(5):e12744.
NCHS (National Center for Health Statistics). 2022. Evaluation of alternative body mass index (BMI) metrics to monitor weight status in children and adolescents with extremely high BMI using CDC BMI-for-age growth charts: Data evaluation and methods research. Vital and Health Statistics 2(197). https://www.cdc.gov/nchs/data/series/sr_02/sr02-197.pdf (accessed March 9, 2024).
Nevill, A. M., C. P. Reuter, C. Brand, A. R. Gaya, J. Mota, J. D. P. Renner, and M. J. Duncan. 2021. BMI fails to reflect the developmental changes in body fatness between boys and girls during adolescence. International Journal of Environmental Research and Public Health 18(15):7833.
NIDDK (National Institute of Diabetes and Digestive and Kidney Diseases). 2022. Growth failure in children with chronic kidney disease. https://www.niddk.nih.gov/health-information/kidney-disease/children/helping-child-adapt-life-chronic-kidney-disease/growth-failure-chronic-kidney-disease (accessed March 9, 2024).
Nokoff, N. J., S. L. Scarbro, K. L. Moreau, P. Zeitler, K. Nadeau, D. Reirden, E. Juarez-Colunga, and M. Kelsey. 2021. Body composition and markers of cardiometabolic health in transgender youth on gonadotropin-releasing hormone agonists. Transgender Health 6(2):111–119.
Nuttall, F. 2015. Body mass index: Obesity, BMI, and health: A critical review. Nutrition Today 50:117–128.
Olson, J., S. Schrager, M. Belzer, L. Simons, and L. Clark. 2015. Baseline physiologic and psychosocial characteristics of transgender youth seeking care for gender dysphoria. Journal of Adolescent Health 57:374–380.
Pelizzo, G., V. Calcaterra, V. Carlini, M. Fusillo, M. Manuelli, C. Klersy, N. Pasqua, E. Luka, R. Albertini, M. De Amici, and H. Cena. 2017. Nutritional status and metabolic profile in neurologically impaired pediatric surgical patients. Journal of Pediatric Endocrinology and Metabolism 30:289–300.
Polfuss, M., B. Forseth, D. Schoeller, C. Huang, A. Moosreiner, P. Papanek, K. Sawin, K. Zvara, and L. Bandini. 2021. Accuracy of body mass index in categorizing weight status in children with intellectual and developmental disabilities. Journal of Pediatric Rehabilitation Medicine 14(4):621–629.
Rempel, G. 2015. The importance of good nutrition in children with cerebral palsy. Physical Medicine and Rehabilitation Clinics of North America 26(1):39–56.
Romero-Corral, A., V. K. Sommers, J. Sierra-Johnson, R. Thomas, M. Collazo-Clavell, J. Korinek, T. G. Allison, J. A. Batsis, F. Sert-Kuniyoshi, and F. Lopez-Jimenez. 2008. Accuracy of body mass index in diagnosing obesity in the adult general population. International Journal of Obesity 32(6):959–966.
Schagen, S. E., P. T. Cohen-Kettenis, H. A. Delemarre-van de Waal, and S. E. Hannema. 2016. Efficacy and safety of gonadotropin-releasing hormone agonist treatment to suppress puberty in gender dysphoric adolescents. Journal of Sexual Medicine 13(7):1125–1132.
Sequeira, G., E. Miller, H. McCauley, and K. Eckstrand. 2017. Impact of gender expression on disordered eating, body dissatisfaction and BMI in a cohort of transgender youth. Journal of Adolescent Health 60:S87.
Simmonds, M., J. Burch, A. Llewellyn, C. Griffiths, H. Yang, C. Owen, S. Duffy, and N. Woolacott. 2015. The use of measures of obesity in childhood for predicting obesity and the development of obesity-related diseases in adulthood: A systematic review and meta-analysis. Health Technology Assessment 19(43):1–336.
SSA (Social Security Administration). n.d.-a. 105.08 Growth failure due to any digestive disorder. Baltimore, MD. https://www.ssa.gov/disability/professionals/bluebook/105.00-Digestive-Childhood.htm#105_08B (accessed March 9, 2024).
SSA. n.d.-b. 5.00F How do we evaluate weight loss due to any digestive disorder under 5.08? Baltimore, MD. https://www.ssa.gov/disability/professionals/bluebook/5.00-DigestiveAdult.htm#5_00 (accessed March 9, 2024).
Tang, M. N., S. Adolphe, S. R. Rogers, and D. A. Frank. 2021. Failure to thrive or growth faltering: Medical, developmental/behavioral, nutritional, and social dimensions. Pediatrics in Review 42(11):590–603.
Thompson, A. L. 2021. What is normal, healthy growth? Global health, human biology, and parental perspectives. American Journal of Human Biology 33(5).
Turner Syndrome Society of the United States. n.d. Physical health: Growth. Houston, TX. https://www.turnersyndrome.org/growth (accessed March 9, 2024).
Valentine, A., N. Nokoff, A. Bonny, G. Chelvakumar, J. Indyk, S. Leibowitz, and L. Nahata. 2021. Cardiometabolic parameters among transgender adolescent males on testosterone therapy and body mass index-matched cisgender females. Transgender Health 6(6):369–373.
Van Caenegem, E., K. Wierckx, Y. Taes, T. Schreiner, S. Vandewalle, K. Toye, B. Lapauw, J.-M. Kaufman, and G. T’Sjoen. 2015. Body composition, bone turnover, and bone mass in trans men during testosterone treatment: 1-year follow-up data from a prospective case-controlled study (ENIGI). European Journal of Endocrinology 172(2):163–171.
van Velzen, D. M., N. M. Nota, S. Simsek, E. B. Conemans, G. T’Sjoen, and M. den Heijer. 2020. Variation in sensitivity and rate of change in body composition: steps toward individualizing transgender care. European Journal of Endocrinology 183(5):529–536.
Vehrs, P. R., G. W. Fellingham, A. McAferty, and L. Kelsey. 2022. Trends in BMI percentile and body fat percentage in children 12 to 17 years of age. Children (Basel, Switzerland) 9(5):744.
Wagner, D. R., and V. H. Heyward. 2000. Measures of body composition in black and whites: A comparative review. American Journal of Clinical Nutrition 71:1392–1402.
Weber, D., R. Moore, M. Leonard, and B. Zemel. 2013. Fat and lean BMI reference curves in children and adolescents and their utility in identifying excess adiposity compared with BMI and percentage body fat. American Journal of Clinical Nutrition 98(1):49–56.
Wellens, R. I., A. Roche, H. Khamis, A. Jackson, M. Pollock, and R. Siervogel. 1996. Relationships between the body mass index and body composition. Obesity Research 4(1):35–44.
Whitney, D., F. Miller, R. Pohlig, and C. Modlesky. 2019. BMI does not capture the high fat mass index and low fat-free mass index in children with cerebral palsy and proposed statistical models that improve this accuracy. International Journal of Obesity 43:82–90.
WHO (World Health Organization). 2009. WHO child growth standards: Growth velocity based on weight, length and head circumference: Methods and development. Geneva, Switzerland. https://www.who.int/publications/i/item/9789241547635 (accessed March 9, 2024).
WHO Expert Consultation. 2004. Appropriate body-mass index for Asian populations and its implications for policy and intervention strategies. The Lancet 363(9403):157–163.
Willemsen, L. A., L. S. Boogers, C. M. Wiepjes, D. T. Klink, A. S. P. van Trotsenburg, M. den Heijer, and S. E. Hannema. 2023. Just as tall on testosterone: A neutral to positive effect on adult height of GnRHa and testosterone in trans boys. Journal of Clinical Endocrinology and Metabolism 108(2):414–421.
Yoo, S. D., E. H. Hwang, Y. J. Lee, and J. H. Park. 2013. Clinical characteristics of failure to thrive in infant and toddler: Organic vs. nonorganic. Pediatric Gastroenterology, Hepatology & Nutrition 16(4):261–268.
Zemel, B. S., M. Pipan, V. A. Stallings, W. Hall, K. Schadt, D. S. Freedman, and P. Thorpe. 2015. Growth charts for children with Down syndrome in the United States. Pediatrics 136(5):e1204–e1211.
This page intentionally left blank.


