Increasing the Utility of Wastewater-based Disease Surveillance for Public Health Action: A Phase 2 Report (2024)
Chapter: 4 Data Analysis, Integration, and Interpretation for Endemic Pathogens
4
Data Analysis, Integration, and Interpretation for Endemic Pathogens
The National Wastewater Surveillance System (NWSS) currently collects weekly or semiweekly sampling data from over 1300 sites on SARSCoV-2 viral levels, and some sites have recently expanded to collect other pathogens such as respiratory syncytial virus (RSV), influenza, norovirus, and Mpox. This system generates massive data with multiple sources of variability that challenge interpretation both within a single site and when trying to compare sites across a region or the nation. In addition to the inherent variability associated with wastewater system flows, different sampling and analysis processes and differences in the wastewater systems themselves (as discussed in Chapters 2 and 3) complicate comparison across sites. Amidst the many sources of variability, local, state, tribal, and national public health agencies work to discern trends and identify outbreaks to enhance knowledge and understanding and support public health action (see Figure 4-1). In this chapter, the committee reviews current strategies for data normalization, statistical and modeling methods, visualization tools, data integration, analytics, and disease forecasting and discusses challenges and opportunities for the next 5–8-year time frame. Recommendations for data sharing, which is central to support improvements in data reliability, comparability, and forecasting, are also presented.
DATA NORMALIZATION METHODS
Results from wastewater surveillance should accurately and precisely reflect what is happening with disease in the community so that the resulting data are interpretable and actionable. For example, if data accurately and

SOURCE: Soloviev, 2016. https://creativecommons.org/licenses/by-nc-nd/4.0/.
precisely reflect disease burden in the community, then an uptick in measured wastewater concentrations can be interpreted as a rise in prevalence in the community. Furthermore, data that accurately and precisely reflect community disease burden facilitate the comparison of wastewater data between communities. For example, if neighboring counties exhibit different levels in their wastewater, local and state public health officials could interpret this as different levels of prevalence between the two communities.
As with any molecular measurements made from samples collected from the environment, inaccuracy, imprecision, and variability observed in the data stem from multiple sources, ranging from phenomena at the molecular level as the measurements are being analyzed to phenomena at the full wastewater system level, as discussed in Chapters 2 and 3. For example, at the molecular level, inaccuracies and variabilities might come from the efficiency and reproducibility of the nucleic acid extraction methods at recovering all of the target of interest. At the full system scale, variabilities could originate from wastewater being temporarily diluted during storm events.1 Both of these examples can result in the observed absolute
___________________
1 Combined sewer systems are designed to collect both rainwater and sanitary sewerage, which causes dilution from precipitation events. In separate sewer systems, which are more common, drainage from precipitation is designed to be collected via a distinct piping network, but there can still be significant infiltration and inflow, particularly in older systems, thereby allowing dilution of the wastewater (Lanning and Peterson, 2012).
abundances and trends not accurately reflecting the pathogen’s prevalence in the community. Understanding and, when possible, correcting for these inaccuracies, imprecisions, and variabilities can improve data quality and interpretation.
Early in the COVID-19 pandemic, wastewater surveillance teams recognized the challenges that arise in measuring molecular targets in wastewater and ensuring the comparability of data produced from samples collected at different times and locations (Kumblathan et al., 2021). Indeed, comparing SARS-CoV-2 wastewater data across studies was complicated by the different sampling and measurement techniques as well as variable sewershed characteristics (Maere et al., 2022). Groups therefore sought approaches to address the imprecision, inaccuracies, and variabilities inherent in the measurements.
Normalization is a process of adjusting the measured wastewater concentrations to account for some of the underlying variables that impact inter- and intra-sewershed comparisons. Multiple normalization approaches have been applied to address different attributes. One common approach is using a factor that incorporates daily wastewater inflow rates. Theoretically, this approach addresses some of the variations observed within a single sewershed over time due to changes in wastewater input such as stormwater infiltration or irregular industrial inflows. Among the potential issues with this approach is that it requires wastewater treatment plants to share their daily flow data so that the analyzing laboratories can normalize their measurements. Although flow rates are routinely measured at larger wastewater treatment plants, the transfer of data can take time and, in some instances, even delay the posting or submitting of the wastewater surveillance data to larger reporting systems such as NWSS. Physio-chemical markers, such as electrical conductivity, have also been proposed to account for dilution effects (Langeveld et al., 2023; Wilde et al., 2022). Sewershed population is another normalizing factor that aims to address differences between sewersheds. Population values are typically reported as a constant (i.e., the residents of the sewershed) and do not address changing populations or people traveling into and out of the sewershed during the week and on weekends.
Other common normalizing approaches focus on the quantity of human excrement in the wastewater sample. These have included biological targets, such as human fecal indicator organisms, as well as chemical targets, such as ammonium, caffeine, paraxanthine, creatinine, and 5-hydroxyindoleace-tic acid (Rainey et al., 2023). Of these, the fecal indicator viruses, including pepper mild mottle virus (PMMoV) and crAssphage [Carjivirus communis]like viruses, are the most widely applied. Because these targets are ubiquitous in human fecal matter, they theoretically address temporal variability in a sewershed’s wastewater fecal strength as well as inter-sewershed variability. Assuming that the recovery of the viral biomarkers through the
sample preprocessing (e.g., polyethylene glycol precipitation) and nucleic acid extractions are reflective of the viruses targeted for wastewater-based epidemiology, using the biomarker targets also addresses variability in the recovery of viral nucleic acids from the wastewater samples.
There is presently no consensus with respect to which normalization factor performs best (Rainey et al., 2023). For relatively constant populations, the NWSS program currently recommends that viral concentration data from liquid samples be normalized by daily wastewater flow to account for changes in wastewater concentrations and to reduce variability in viral wastewater concentrations over time. For comparison across locations, NWSS recommends flow and population normalization to yield data in units of viral gene copies per person contributing to the sewershed per day. Finally, for solid samples, sites where flow rate data are not available, and populations that change substantially over time due to commuting, tourism, or other movement, the Centers for Disease Control and Prevention (CDC) suggests that it may be important to normalize with biological targets for human fecal normalization (CDC, 2023f). CDC advises that wastewater concentration data that have not been normalized may not yield meaningful differences in levels or direction and therefore cannot be compared across NWSS sites (CDC, 2023e).
A number of studies have assessed the value of normalization factors, with mixed results. To do this, researchers often look at correlations between clinical cases and wastewater concentrations that have or have not been normalized. For example, Wolfe et al. (2021) demonstrated that normalizing SARS-CoV-2 in primary sludge by concentrations of PMMoV RNA in solids was an effective approach when attempting to compare incidence of new laboratory-confirmed COVID-19 cases across wastewater treatment plant sites. Ai et al. (2021), however, found that normalizing influent SARS-CoV-2 measurements by PMMoV or crAssphage (Carjivirus communis) did not improve correlations. The mixed results on normalization are likely largely attributable to distinctive aspects of the methods applied and the specific samples. Indeed, a notable challenge in using molecular or chemical measurements to normalize some cases is that normalizing may actually increase the overall error and variability in the values.
The effectiveness of normalization will be impacted by the scale of the system being monitored. Shedding studies of normalizing agents PMMoV and CrAssphage demonstrate the wide range of shedding quantities among individuals (Arts et al., 2023). As a result, normalizing at small scales (e.g., less than 10,000) likely increases variability in the pathogen measurement (see Figure 4-2).
More studies are needed to understand the value of applying both viral and bacterial biomarkers as normalizing factors for the surveillance of different targets across a range of sewershed sizes, concentrations, and

SOURCE: Committee.
concentration/extraction methodologies. It is possible that one normalizing approach may work best for one pathogen/method/sewershed size, and another normalizing approach will work best for another pathogen/method/sewershed size. Candidate bacteria or viruses that are common to the human microbiome will have inherent biological variability within the sewershed population over time, and each may behave differently during transport due to differential partitioning to sediments and decay as they move through the system. For biomarkers associated with diet, different consumption rates between populations may complicate the comparisons of normalized values between sewersheds. Analyzing multiple constituents may initially be useful for understanding the sources of variability and could lead to development of a normalizing approach that considers multiple constituents.
The committee concluded that additional research using the large available data sets collected through the NWSS is needed to compare normalization methods across data from a range of different types of sites. Until coordinated and consistent normalization approaches are fully realized, non-normalized data should always be made available in NWSS for additional disease trend analysis.
VISUALIZATION AND DATA ANALYSIS TOOLS FOR INTEGRATION AND INTERPRETATION
The following section discusses the current state of data analysis and visualization tools for the NWSS, current challenges, and opportunities to better advance these systems to meet public health decision making. Both public-facing dashboards and analytical tools for public health agencies to assess trends and improve data integration are discussed. The committee recognizes that other data visualization platforms exist for subsets of the NWSS data (e.g., WastewaterSCAN,2 Biobot Analytics3), but this section focuses on the NWSS as the largest data analysis and visualization platform in the United States that includes these other data.
Public-Facing Data Analysis and Visualization Tools
Jurisdiction-Level Tools
Currently, many states and localities that provide data to the NWSS have their own public-facing dashboard for data analysis and visualization. These dashboards were developed by state and local public health agencies
___________________
2 See https://data.wastewaterscan.org/.
3 See https://biobot.io/data/.
during the pandemic, at a time when CDC visualization tools were still developing, to meet their specific data visualization needs and the needs of the public and local decision makers outside the public health agency. As a result, the many independently developed state and local wastewater surveillance dashboards differ in how the magnitude, current trend direction, and time series of the virus are shown. These differences make aggregation or comparison across jurisdictions problematic and make it unclear to jurisdictions that are new to wastewater surveillance which method would best convey their information.
For example, with respect to COVID-19 wastewater surveillance, North Carolina, Virginia, and Wisconsin chose to represent and display the magnitude of viral load differently, making comparisons difficult (see Figure 4-3). Not only do the visual presentations vary, but descriptions of viral load levels are not easily comparable: Virginia and Wisconsin use words like “high” and “low,” while North Carolina uses percentile ranges like “80-100%.” North Carolina and Virginia do not state the exact time frame for their past samples, while Wisconsin’s “past samples” are from the past 6 months.
Similarly, state and local dashboards differ in how trends of viral load are determined and conveyed, creating the same difficulties in comparing trends in viral loads geographically. Figure 4-4 illustrates such variation using the examples of Indiana, Utah, and Houston. All three dashboards use words like “increasing” and “decreasing” to describe the trend, but Houston includes four different rates of increase or decrease. The time frames represented in the data visualization also differ across the plots.
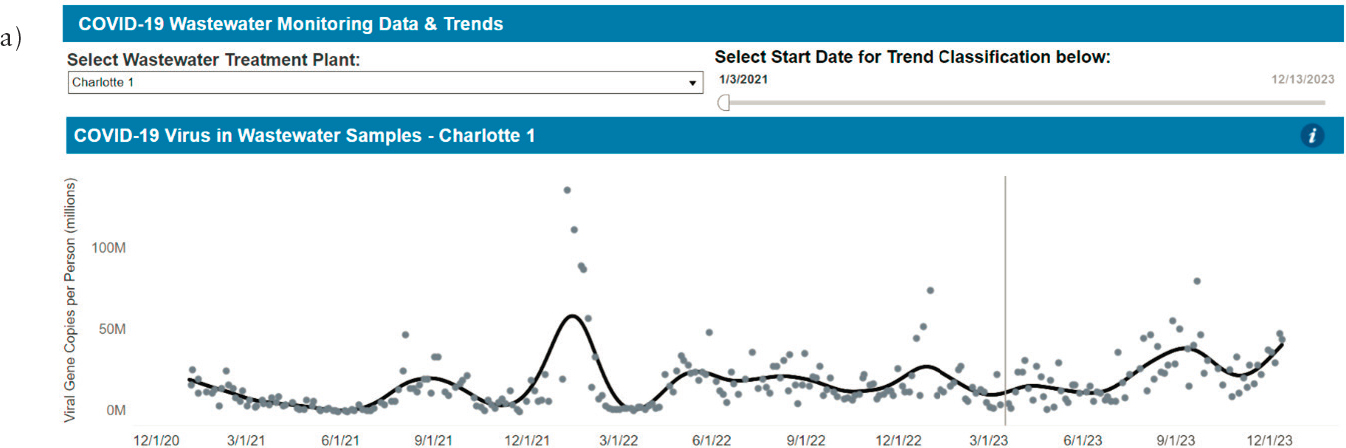
Finally, there are differences in how dashboards convey the viral load time series, again creating difficulty in comparisons and interpretations between areas. As shown in Figure 4-5, for example, the dashboards for New York, North Carolina, and Indiana differ in the extent to which individual sample data are emphasized over interpolations and the concentration presented (i.e., gene copies per person, gene copies per mL, and gene copies per human fecal marker PMMoV). For all three dashboard choices—virus intensity level, viral trends, and concentration versus time—differences in data presentation make comparisons more challenging.
A tool permitting the user to select their preference for data presentation to be displayed in one or more standard formats would allow for more options for interpretation and enable comparison between areas. Options for displaying the data in these three ways in a standard simple plug-and-play type of visualization and data analysis tool that jurisdictions can easily adopt would reduce the burden placed on public health agencies to develop and maintain individual dashboards. In a survey conducted by the Colorado and Houston NWSS Centers of Excellence, small public health agencies that serve fewer than one million people and public health agencies with less


SOURCES: (a) https://covid19.ncdhhs.gov/dashboard/wastewater-monitoring; (b) https://www.vdh.virginia.gov/coronavirus/see-the-numbers/covid-19-data-insights/sars-cov-2-in-wastewater/; (c) https://www.dhs.wisconsin.gov/covid-19/wastewater.htm.

SOURCES: (a) https://www.coronavirus.in.gov/indiana-covid-19-dashboard-and-map/wastewater-dashboard/; (b) https://avrpublic.dhhs.utah.gov/uwss/; (c) https://covidwwtp.spatialstudieslab.org/.
SOURCES: (a) https://covid19.ncdhhs.gov/dashboard/wastewater-monitoring; (b) https://coronavirus.health.ny.gov/covid-19-wastewater-surveillance; (c) https://www.coronavirus.in.gov/indiana-covid-19-dashboard-and-map/wastewater-dashboard/.

experience ranked developing a wastewater dashboard as the most important training need (R. Schneider, Houston Health Department and K. Weisbeck, Colorado Department of Health, personal communication, 2024).
NWSS Data Analysis and Visualization Tools: COVID Data Tracker
CDC launched its own centralized data visualization of NWSS data on the COVID Data Tracker website in February 2022, targeted to the general public (Johnson, 2022). Until the NWSS data visualization tools were expanded in late 2023, the CDC dashboard (see Figure 4-6) primarily focused on a national map showing relative virus levels that were color-coded based on comparison to historical data at that site. Viewers could also see percentage change in the last 15 days (currently still available and based on a minimum of two data points). Due to a perceived risk of identifying particular sites, the NWSS dashboard currently only includes data from wastewater treatment plants serving over 3,000 people, and exact locations are not provided. Instead, each data point is plotted at the center of the ZIP code in which the wastewater treatment plant resides. This provides an easy-to-understand map of local areas of concern, but CDC acknowledges that the current viral-level data are not comparable across sites. The noncomparability arises from a wide range of factors, including that individual sites have been collecting data over different time periods. CDC notes on the website that the data history for sites that started reporting data after December 1, 2021, “is not long enough to reflect the same surges as the other sites.”
Several notable enhancements have been recently added to the NWSS dashboard, including an additional dashboard for Mpox, SARS-CoV-2 variant data by site, and presentation of a new metric of viral activity (described in more detail below). A separate dashboard has been developed to summarize Mpox detection results over the last 4 weeks (see Figure 4-7). Users can adjust the view to get more information on states or individual sites; all data are plotted by ZIP code, to protect privacy.
Information on the temporal and spatial distribution of SARS-CoV-2 variants is now provided on a single webpage that presents data from nationally representative clinical samples from the National SARS-CoV-2 Genomic Surveillance System, clinical samples from arriving passengers at several major international airports via the Traveler-based SARS-CoV-2 Genomic Surveillance Program, and site-level wastewater surveillance.4 The predominant variant is displayed graphically for each wastewater surveillance site based on the week selected by the user (see Figure 4-8a),
___________________
4 See https://covid.cdc.gov/covid-data-tracker/#variant-summary.
and individual states can be selected to see how the relative abundance of variants has changed in that state over time (see Figure 4-8b). A separate page displays changes over time in the relative proportions of SARS-CoV-2 variants as national averages from wastewater data,5 although the site notes that, because the sampling sites are not equally distributed across the nation, the data should not be considered a true national representation.
In addition to the map-based display of SARS-CoV-2 virus levels (Figure 4-4), the NWSS now displays a metric denoted the wastewater viral activity level (WVAL), which represents an aggregate of wastewater concentration data.6 The NWSS provides weekly updates of national-, regional-, and state-level estimates of viral activity and trends over time (see Figure 4-9).7 State-level data can be displayed graphically or in map form (Figure 4-10).
The WVAL metric was developed in an attempt to put different measures of viral levels into a common metric to improve national-, regional-, and state-level understanding of viral trends over time. A metric such as the WVAL would be very useful to track the virus at multiple scales. However, there are substantial weaknesses in the current WVAL metric and its use to track viral activity in time. The NWSS outlines four steps to calculate the WVAL, as described in Box 4-1. In the first step, data are adjusted via normalization based on data provided for each site. A weakness of this step is that data are carried through and aggregated, regardless of differences in normalization methods even though there is currently no scientific understanding of the differences in uncertainty introduced between the two normalization methods. Without adjustment for these differences, the WVAL metric will be influenced by the uncertainty and percentage of sites normalized differently. Further research is needed to correctly account for the uncertainty introduced when combining data normalized differently and whether normalization is beneficial to the assessment of disease burden across multiple locations.
In the second step, “for each combination of site, data submitter, PCR target, laboratory methods, and normalization method,” a baseline is calculated. A weakness of the second step is that whenever any of these factors changes, the baseline is reset. When sites have less than 12 months of data, the baseline risks missing annual temporal patterns. For example, a 3-month baseline that includes peak RSV levels would not be useful to pick up a peak that occurs in the next 6 months because it would not appear high. Once the baseline is 12 months long, this systematic baseline selection weakness may not be as much of a concern, but research should be conducted to inform the decision whether to require a minimum of 12
___________________
5 See https://www.cdc.gov/nwss/rv/COVID19-variants.html.
6 See https://covid.cdc.gov/covid-data-tracker/#wastewater-surveillance.
7 See https://www.cdc.gov/nwss/rv/COVID19-nationaltrend.html.

SOURCE: https://covid.cdc.gov/covid-data-tracker/#wastewater-surveillance.

SOURCE: https://www.cdc.gov/nwss/wastewater-surveillance/mpox-data.html (accessed February 27, 2024).
months of baseline data for the WVAL metric. Additionally, no mention is made of whether (or how) nondetections are used in the computation of the baseline or the standard deviation. The use of the standard deviation over a nonparametric measure of spread (e.g., the interquartile range divided by 4) requires consideration of the nondetection values, but the method for calculating the standard deviation is not discussed.
In the third step of the WVAL, a WVAL for each sample from a site is calculated and then the mean WVAL for a week is calculated for the site. A weakness of the third step is again around the eventual aggregation of values with different levels of uncertainty. The use of the weekly averaged values allows for sites that have only one value to be aggregated alongside averages from sites with multiple weekly values, the latter of which will be smoother. Consideration should be given to using a fixed number of samples from each site each week for comparison to the standard deviation. Also, not all sites or measurements from a given site are used (e.g., if a site is measured by WastewaterSCAN as well as by local jurisdictions), and it is not always clear to localities which sites are represented by the WVAL metric or why.
Overall, there are two additional weaknesses of the WVAL four-step approach (see Box 4-1). First, the standard deviation is used to put all the site data, which are collected in different ways and normalized by different means, on the same scale so that they can be aggregated and compared. The problem is that the variation in the magnitudes of standard deviations due to the disease burden in a community is not reflected. For example, a site with a highly variable viral load due to fluctuating disease burden will have a large standard deviation in its WVAL calculation, and a second site with very little virus (i.e., near the detection limit) would have a relatively constant viral load with a very small standard deviation in its WVAL calculation. The weekly concentration at each site could end up being the same number of standard deviations away from the baseline, resulting in the same WVAL, although the first site clearly has more virus and merits different responses. Thus, the use of the WVAL to make statements about the overall viral load across the United States triggered by an increase in standard deviation could be misleading. Second, the aggregation does not account for the unequal distribution of sites across the nation, region, or state. For example, because over 50 percent of the WVAL data for Texas are generated in Houston, the state’s viral load will most likely be from Houston, although it is presented as a figure for the entire state (see Figure 4-10).
Presenting a global metric is important to enable comparisons across sites, but additional work is needed to address existing limitations and improve the scientific basis for the calculations. As NWSS continues to refine the WVAL, it should also stay abreast of other efforts, such as by WastewaterSCAN (see Box 4-2), to develop similar aggregation and comparison

SOURCE: https://covid.cdc.gov/covid-data-tracker/#variant-summary (accessed February 27, 2024).


SOURCE: https://www.cdc.gov/nwss/rv/COVID19-nationaltrend.html (accessed February 27, 2024).

SOURCE: https://www.cdc.gov/nwss/rv/COVID19-currentlevels.html (accessed February 27, 2024).
metrics and their comparative successes and limitations. A large-scale analysis of the most successful wastewater surveillance metrics could evaluate the extent to which these metrics are concordant or discordant when fed the same data, and which metrics are most predictive or correlated with clinical data (e.g., hospitalizations). More extensive research is needed to compare a wide range of alternative approaches to spatial aggregation (using different pathogens, time periods, and methods), to explore how different methods and models can be used to generate consistent aggregate statistics.
Looking Ahead
Advancing trend analyses.
Currently, public-facing dashboards in the NWSS do not evaluate or label the trend in loads (e.g., increasing, decreasing) or provide forecasts, and individual jurisdictions employ different
BOX 4-1
Calculating the Wastewater Viral Activity Level
-
Data Normalization:
- The type of data normalization used is based on the data that are submitted by the site.
- If both flow-population and microbial normalization values are available, flow-population normalization is used.
- After normalization, all concentration data is log transformed.
- The type of data normalization used is based on the data that are submitted by the site.
-
Baseline Calculation:
- For each combination of site, data submitter, PCR target, lab methods, and normalization method, a baseline is established. The “baseline” is the 10th percentile of the log-transformed and normalized concentration data within a specific time frame.
- For site and method combinations (as listed above) with over 6 months of data, baselines are re-calculated every six calendar months (January 1 and July 1) using the past 12 months of data.
- For sites and method combinations with less than six months of data, baselines are computed weekly until reaching six months, after which they remain unchanged until the next January 1 or July 1, at which time baselines are recalculated.
- The standard deviation for each site and method combination is calculated using the same time frame as the baseline.
- For each combination of site, data submitter, PCR target, lab methods, and normalization method, a baseline is established. The “baseline” is the 10th percentile of the log-transformed and normalized concentration data within a specific time frame.
-
Wastewater Viral Activity Level Calculation:
- The number of standard deviations that each log-transformed concentration value deviates from the baseline (positive if above, negative if below) is calculated.
- This value (x) is then converted back to a linear scale (by calculating ex) to form the Wastewater Viral Activity Level for the site and method combination.
- The Wastewater Viral Activity Levels from a site are averaged by week for all figures.
-
Aggregation for National, Regional, and State Levels:
- We calculate the median Wastewater Viral Activity Levels among sites at national, regional, and state levels, excluding data from site/method combinations with less than 6 weeks of data.
Data Inclusion Criteria: New NWSS wastewater sampling sites, or sites with a substantial change in laboratory methods are included in national, regional, state, or territorial median values once there are at least 6 weeks of samples reported for that location. States or territories without sufficient data to estimate the wastewater viral activity level for the previous week are indicated as “Insufficient Data.”
SOURCE: https://www.cdc.gov/nwss/about-data.html#data-method.
BOX 4-2
WastewaterSCAN Aggregation Metric
WastewaterSCAN also provides a national dashboard with aggregation metrics at the county, state, regional, and national levels. In the SCAN case, aggregated trend lines and levels are calculated using the trimmed smoothed average PMMoV-normalized concentration for each site, multiplied by the catchment area population, and then divided by the overall region population, to yield a weighted average of normalized concentration over n plants within a region:
Nondetections are set to approximately half of the limit of detection for the purposes of this calculation. Regional and national trend lines and levels are calculated in a similar fashion, but with states as the averaged unit rather than individual treatment plants. Levels for these aggregated regions are set using tertiles of the historical distribution over the past 365 days to reflect a low/medium/high range for each pathogen target and region.
An advantage of SCAN in the calculation of aggregated trends and levels is that the SCAN data use the same measurement and normalization approaches for all of their samples, which facilitates ease of comparison. However, this approach has its limitations as well. Using the past 365 days to generate the historical distribution means that the low/medium/high level ranges may potentially change day to day, which can hinder easy or consistent interpretability and potentially make the same concentration at a given site imply a different level depending on when it occurs. Either a longer time window to smooth across multiple years, or a fixed level update schedule (e.g., annually or every n years) might improve interpretability. Additionally, while using percentile ranks/tertiles is straightforward and interpretable as low/medium/high, different sites may have different histories as far as the level of outbreak/transmission they have experienced, potentially leading to artificially condensed level ranges if a given site simply has not experienced as extensive of an epidemic as another.
SOURCE: https://data.wastewaterscan.org/about/ (accessed July 6, 2024).
statistical methods to analyze trends.8 Moving forward it is important to develop statistical strategies that separate the signal or trend of disease burden as measured by wastewater from the inherent sampling and measurement variation associated with each sample. To develop these tools for application at a national scale, research is needed to understand which techniques work best overall and the implications of factors that vary by jurisdiction (e.g., sampling frequency, population coverage, percent of nondetections). As a simple example, rolling averages are most commonly used currently to evaluate a basic visual trend, but these may not be the most appropriate smoothing method for wastewater data; further research to evaluate which trend methods best balance simplicity and flexibility for wastewater data would be a strong first step. The most appropriate statistical methods may vary based upon the wastewater target. For example, in scenarios where there are very high frequencies of nondetections (as will likely be more common as the targets are expanded beyond SARS-CoV-2), methods that are better at handling censored data will need to be employed, and within this subset, these methods may differ depending upon the rarity of detects. The uncertainty around the trend line should accompany the graph and incorporate temporal dependencies of the data.
To accomplish this research, available wastewater surveillance data across the nation will need to be analyzed using a range of statistical trend and forecasting methods. Researchers need access to all the historical wastewater data including detection limits, sampling method and frequency, treatment plant population coverage, and laboratory analytical methods. In this analysis, it is also important to incorporate the inherent sampling and laboratory variability for each location sample.
Advancing a common platform for the public.
A common platform providing analytics that assess trend, define the viral load, and explain the inference in language that is understandable to the lay public would be a more effective communication tool than maintaining distinctive dashboards for each jurisdiction, and would also reduce burden on local health agencies. The greater standardization in presentation that a centralized platform would bring would also improve interpretation and comparability across jurisdictions, facilitate aggregation, and promote communication across stakeholders. However, care needs to be taken in the extent and method of
___________________
8 For example, Wisconsin uses a linear regression over the past five measurements with a relaxed significance test (p < 0.3), Illinois uses a locally weighted scatterplot smoothing method, North Carolina uses a spline, and Missouri uses an exponentially weighted moving average. Of these examples, only Illinois provides confidence intervals around the trendline. SOURCES: https://www.dhs.wisconsin.gov/covid-19/wastewater.htm, https://iwss.uillinois.edu/wastewatertreatment-plants/, https://iwss.uillinois.edu/, https://covid19.ncdhhs.gov/dashboard/wastewater-monitoring, and https://storymaps.arcgis.com/stories/f7f5492486114da6b5d6fdc07f81aacf.
aggregation so that the interpretation is scientifically correct. For example, in Houston, the 39 wastewater treatment plants represent a total population of 2.2 million people but plants vary in size, covering a range of 600 to over 550,000 people. Pooled analyses that do not use weighting to account for this variation in representation may generate misleading information.
Through the pandemic, some members of the public and the press became educated on what wastewater surveillance was and what it meant to them, often through multiple interactions between health departments and the media. With the advent of a common visualization tool with consistent reporting, the burden of interpretation can be met by CDC or the Centers of Excellence, as needed.
The dashboard’s public-facing language should also be made available in languages other than English to promote equity of access to information. Currently, no dashboards are available in other languages, although Colorado does have a Spanish version of its dashboard FAQ file. This results in some notable exclusions of non-English-speaking populations from the benefits of publicly shared wastewater data. For example, the dashboard in Houston, Texas, is English only, although about 15 percent of households in the City of Houston have limited English proficiency.
Tools for Public Health Agencies
DCIPHER
The NWSS currently offers data analysis and visualization tools within the Data Collation and Integration for Public Health Event Response (DCIPHER) platform. DCIPHER “is a cloud-based data integration and management platform for use across CDC, in the Emergency Operations Center, by other federal partners, and by state, local, tribal, and territorial public health jurisdictions to collate, link, manage, analyze, visualize, and share public health, outbreak, and event response data” (HHS, 2020). Analytical laboratories upload their results and associated metadata to DCIPHER, and the platform includes data quality checks and alerts. DCIPHER also includes resources for NWSS jurisdictions, including guidance documents, training materials, and points of contact to promote peer-to-peer collaboration. The content of DCIPHER is not publicly available, and only the jurisdiction that submits data to DCIPHER can download those data.
Within DCIPHER, Contour—a program developed by a third party—provides a method to join data sets and explore trends, percentiles, and other graphics in a point-and-click format. The types of analyses available in Contour are useful (e.g., flow-population normalized trend with interpretation of sustained decrease, decrease, plateau, increase, and sustained increase; percent change; proportion detected; comparisons of percentages
in a region). However, some individual jurisdictions are currently employing statistical analyses not available as plug-and-play tools in Contour (e.g., Figure 4-5), and CDC is currently working to develop additional tools (H. Reese, CDC, personal communication, 2023). Jurisdictions can write code (termed “paths”) to replicate the analyses from week to week, although this requires training for those unfamiliar with coding. Although the NWSS provides training videos to help users with Contour, large public health agencies still ranked trainings centered around analyzing data for trends as their most important training need (R. Schneider, Houston Health Department and K. Weisbeck, Colorado Department of Health, personal communication, 2024). In general, a tool developed in a more versatile broadly applied language (e.g., R) instead of niche software would make training more efficient.
In addition, there are sometimes errors in the analysis and interpretation in DCIPHER’s NWSS and Improved Dashboard; or if there are underlying statistical reasons for these interpretations, they are not explained to the user. For example, Figure 4-11 displays the analysis for a small site in Texas (Laredo), with a spline fit showing a peak in late August and an interpretation that the data are plateaued (yellow bar) from the end of July to September. The graph and the interpretation are inconsistent, and no explanation is provided. Similarly, the interpretation for a large facility in Houston indicates that the flow-population normalized trend is a sustained decrease from the middle of April 2022 to the middle of April 2023 while the spline fit shows two distinct peaks during that period (see Figure 4-12). As a third example, flow is not reported for some sites but Contour provides flow-normalized trends.
In general, problems with data interpretation and the steep learning curve have led to concerns using DCIPHER/Contour for data analysis, and large jurisdictions and public health authorities generally continue to use their own analytical tools, which limits their capacity to understand their data in a broader context. Currently, Contour is best suited for exploring data in different ways using simple methods, but not in-depth analyses. Additionally, Contour is not appropriate for those that are not familiar with analysis of wastewater surveillance data due to its sometimes inconsistent interpretations (as shown in Figures 4-11 and 4-12).
Advancing Statistical Tools in Collaboration with Local or State Jurisdictions
Ultimately, local, state, and national public health agencies need data analysis tools that are reliable, easy to use, and able to accommodate the specific characteristics and analysis needs of individual jurisdictions. The committee recognizes that there are many constraints on the use of

SOURCE: NWSS and Improved Dashboard (accessed December 26, 2023).

SOURCE: NWSS and Improved Dashboard (accessed December 26, 2023).
DCIPHER, which has applications far beyond wastewater surveillance data, including data security requirements that may make code revisions cumbersome and limit those who are allowed to access DCIPHER.
Until CDC develops easy-to-use analytical tools that meet the needs of local and state jurisdictions, code sharing would help jurisdictions that are just starting their wastewater surveillance program advance their data analytics at a faster rate. CDC could use DCIPHER for centralized data storage and access, with standardized metadata, and use those data to populate the public-facing dashboards. Jurisdictions could easily download the interoperable data for additional analyses with shared, open-access code.
Currently, some large and sophisticated public health agencies are advancing tools to assess and forecast trends. These jurisdictions could work collaboratively with CDC, other federal agencies, and the Centers of Excellence to build on the existing understanding of the best methods to statistically interpret wastewater data. To advance such an effort, code and data sharing in a publicly accessible location (e.g., GitHub) would be valuable for researchers and jurisdictions. A common language (or two) for analysis should also be selected. Previous NWSS meetings suggest this would be R, although a formal survey should be conducted. The NWSS Centers of Excellence can assist with training and building out the dashboards so that areas without this specific expertise are provided the needed support. During this interim period, each jurisdiction would be the owner of their own sample code and data. Code and data sharing has not yet taken place in a meaningful way in the NWSS community. Houston has created a Github with two repositories,9 and some states, like New York,10 have made their wastewater data but not their code publicly available.
Improving Tools for Clinical Data Integration
As noted in the committee’s Phase 1 report (NASEM, 2023), rigorous interpretation of wastewater surveillance requires integration with clinical data, where available and reliable. A visualization tool that automatically displays cases from reportable disease systems and/or syndromic systems, along with immunization rates within and around the jurisdiction for easy comparison with wastewater viral loads across time for each specific target, would be useful. When a wastewater target is not detected and no cases are detected, the surveillance provides a level of reassurance. When a wastewater target is detected before clinical cases are found, the public health team can initiate the wastewater response action plan as needed. When clinical cases are detected in the sewershed prior to detection in wastewater, the
___________________
9 See https://github.com/hou-wastewater-epi-org.
10 See https://coronavirus.health.ny.gov/covid-19-wastewater-surveillance.
wastewater team may need to evaluate the sampling and analysis strategy relative to the overall goals, and determine whether additional refinements of the sampling strategy, re-analysis of prior samples, or lower detection limits are needed. Constant comparisons between wastewater and clinical data may identify potential problems in one approach or the other. Advancements in machine learning could provide more comprehensive understanding of public health dynamics and improve public health responses.
The committee recognizes that integration of wastewater data with clinical data systems, such as emergency department syndromic surveillance systems, reportable diseases systems, and vaccine tracking systems, is a major challenge because the clinical data systems themselves are not integrated. It should also be noted that clinical data can be disparate, incomplete, and not representative for many important diseases. However, improved and integrated data systems would support more informed rapid response to infectious disease outbreaks.
Emergency department syndromic surveillance data.
Emergency department (ED) syndromic surveillance systems provide constant monitoring of trends in counts of individuals with severe illness by syndrome (e.g., respiratory, gastrointestinal illness) visiting EDs or urgent care centers based on symptoms, chief complaints, and discharge diagnosis. These data are anonymized, including only the patient age and ZIP code. Like wastewater surveillance viral load information, the ED syndromic data are used to provide a measure of illness by geographic unit. Stable trends provide reassurance when an impact has not occurred while increases provide notice of early warning of an outbreak. This surveillance is timelier than the reportable disease system, which requires laboratory test results. Also, because syndromes are more flexible and generally defined, syndromic surveillance is better poised to pick up emerging outbreaks (Hughes et al., 2020).
The evolution of the development and use of wastewater surveillance data in public health is similar to that which occurred in ED syndromic surveillance in that the national system was built upon pre-existing local systems that were then expanded (Hughes et al., 2020). Similar obstacles need to be overcome in cross-jurisdiction use of ED syndromic surveillance as with cross-jurisdiction analysis of wastewater surveillance, including the need for unified metrics, consistent statistical interpretation, mapping, and timeliness. Current local ED syndromic surveillance systems in the United States (i.e., Electronic Surveillance System for the Early Notification of Community-Based Epidemics [ESSENCE]) use unified queries and feed into the U.S. National Syndromic Surveillance Program (NSSP). Considering this history, best practices and lessons from merging the local ED syndromic systems into the national system, such as the need to report and interpret
the data in aggregate to improve public health response, should be applied to the national wastewater surveillance system.
During the COVID-19 pandemic, a few individual jurisdictions developed data visualizations to display the wastewater surveillance viral load alongside other clinical data, including ED syndromic data (e.g., Figure 4-13). At the Houston Health Department, to integrate the wastewater data with the syndromic data from ESSENCE, the wastewater data are shared with the syndromic team and plotted together. The data sharing and plotting is not automated and requires cooperation between groups that may not be in the same departments in a jurisdiction.
Instead of each jurisdiction integrating their wastewater viral load data alongside the area ED syndromic data, an automatic mapping of these data back to the jurisdiction from NSSP would be more efficient. This would be especially helpful for smaller jurisdictions without the workforce capacity to routinely map the data. Numbers of visits linked to specific International Classification of Diseases codes or respiratory or gastrointestinal syndromic data could be displayed as per pertinence to the wastewater target of interest. If the jurisdiction does not report to an ESSENCE system, NSSP could provide information from surrounding areas.
Reportable disease system data.
Reportable disease system platforms record cases by statutory requirement. CDC requires some specific diseases to be reported but the total list can vary by state. The information on confirmed or suspected cases in this system lags information from ED syndromic surveillance and does not include some diseases of specific interest in wastewater (e.g., influenza A/B or RSV), but it includes more specific information (i.e., patient/illness details that inform case follow-up and tracking).
During the COVID-19 pandemic, some jurisdictions with both wastewater surveillance systems and reportable disease systems incorporated case counts obtained from their reportable disease systems in time series of wastewater viral load to aid in interpretation of trends (see Figure 4-14). Going forward, routine incorporation of case data alongside wastewater viral load data for specific diseases that are measured in the wastewater and reportable would be extremely helpful.
Locally hosted reportable disease systems report their data to their state health department, which then reports to the CDC National Notifiable Diseases Surveillance System (NNDSS).11 The NNDSS system and those reporting to it (i.e., all 50 states) are based on the National Electronic Disease Surveillance System architectural standards to ensure interoperability between systems.12 Assuming NDSS data quality and reporting turnaround
___________________

SOURCE: Hopkins et al., 2023.

SOURCE: https://www.coronavirus.in.gov/indiana-covid-19-dashboard-and-map/wastewater-dashboard/.
times are reasonable, an automatic mapping of these data back to the jurisdiction from NNDSS would be more efficient and especially helpful for smaller jurisdictions that may not have reportable cases in their jurisdiction but would benefit from the knowledge of the extent of area cases.
Immunization data.
Immunization database systems that provide rates of immunizations by geographic unit (e.g., census tract or ZIP code) by type, gender, and age group were found to be important for understanding vaccine uptake and targeting interventions during the COVID-19 pandemic. Integrating wastewater viral load and vaccination rate information for vaccine-preventable diseases from the CDC Immunization Information System13 would provide important information for local health departments. Data should include not just required vaccines but others, such as influenza and RSV. For example, when influenza is found to be increasing in wastewater, influenza vaccine events can be directed to areas where uptake is low or, as mentioned previously, vaccination information can inform the frequency of monitoring for a specific target (i.e., high vaccination rates may trigger reduced surveillance).
Improving Timeliness of Wastewater Data
Wastewater data, like many other data systems, can suffer from a range of delays associated with the transport of samples, analytical processing, and data reporting. These delays can erode the time in which the data can inform public health decision making and potentially the impacts of those decisions. As discussed in Chapter 2, sampling frequency also affects the timeliness of information provided, particularly in terms of evaluating changes in trends. In many cases, if the most recent wastewater data available are more than 1 to 2 weeks old, it may not provide actionable information that can practically inform decision making, as the situation on the ground may have changed since the sample was collected.
In a recent analysis of the timeliness of wastewater data posted by several wastewater surveillance programs, there were sizable differences between programs (see Figure 4-15; J. Gilbert and M. Eisenberg, University of Michigan, personal communication, 2024). Groups that directly publish the data from the laboratory to the dashboard (e.g., WastewaterSCAN) show substantially less lag in data availability compared to aggregated networks that rely on other groups to upload data before it can be displayed (e.g., NWSS). The lag shown in Figure 4-15 was also affected by sampling interval, which was also shorter in WastewaterSCAN. However, across all networks, data timeliness was similar across levels of Social Vulnerability
___________________
13 See https://www.cdc.gov/vaccines/programs/iis/about.html.

SOURCE: J. Gilbert and M. Eisenberg, University of Michigan, personal communication, 2024.
Index and across urban-rural categories, suggesting that while data timeliness may be an issue for some sites, it does not appear correlated with communities’ socioeconomic status or rurality (J. Gilbert and M. Eisenberg, University of Michigan, personal communication, 2024).
Given the data lags of more than 2 weeks in aggregate networks such as NWSS, new timing requirements for reporting would enhance actionability of wastewater surveillance. Additionally, improvements in data submission processes, including allowing for provisional data submission and increasing automation of data reporting, including wastewater treatment plant flow data, would reduce data lags and enhance the timeliness of public health response.
ADVANCING STATISTICAL TOOLS FOR INTERPRETATION AND PREDICTION
The expansion of wastewater surveillance during the pandemic brought with it advances in the use of models to understand wastewater data, building on earlier efforts more focused on enteric pathogens. Wastewater data are particularly of interest for modeling and forecasting efforts due to their potential for providing leading data, compared to hospitalizations or deaths. Recent research has worked to advance the capacity of models to use wastewater surveillance data to better estimate current underlying disease incidence or prevalence (i.e., nowcasting; Klaassen et al., 2024; Lai et al., 2023), and effective reproductive numbers (Nadeau et al., 2024) and to improve the accuracy of epidemiological forecasting tools (e.g., Polcz et al., 2023; Vaughan et al., 2023). Modeling tools are also beginning to be used to extrapolate wastewater data to understand disease trends in rural areas located outside of monitored sewersheds (Meadows et al., 2024). Finally, modeling can also play a role in evaluation and guidance of interventions and decision making informed by wastewater data; models can be used to assess “what if” scenarios, alternative response strategies, and counterfactuals, such as how the timing of detection or decision making might have unfolded differently with versus without wastewater monitoring.
Wastewater data have recently been incorporated into COVID-19 forecasting models produced by CDC14 and the Public Health Agency of Canada (Joung et al., 2023). CDC has made sizable investments in this area through its Center for Forecasting and Outbreak Analytics15 and recently granted $262 million in funding to develop disease forecasting methods and tools,
___________________
14 See https://www.cdc.gov/forecast-outbreak-analytics/about/wastewater-informed-forecasting.html.
15 See https://www.cdc.gov/forecast-outbreak-analytics/index.html.
test them at the pilot scale, and ultimately scale up to deploy these tools at larger scales (CDC, 2023c).
The types of models being used range from statistical models (e.g., linear regression [Leisman et al., 2024], score-based models [Usmani et al., 2024]), to more complex statistical and machine learning models (Lai et al., 2023; Vaughan et al., 2023), to mechanistic models (Phan et al., 2023). Mechanistic models explicitly model various processes such as transmission, infection, pathogen shedding, and transport in the sewer system, and their prediction accuracy depends upon accurate information on these various processes. In contrast, statistical and machine learning tools do not depend on an understanding of processes; instead, they discern trends and predict probable outcomes using large data sets. As such, future disease transmission is assumed to behave the same as in past data sets (i.e., stationarity). These differences often give mechanistic models some advantages when it comes to prediction in new circumstances (e.g., simulating what-if scenarios or possible intervention strategies) and allow the models to be more explainable and interpretable. However, machine learning models typically have more advantage for pure forecasting due to their greater flexibility and lower reliance on assumptions about structure. Machine learning tools can also draw upon diverse data sets that may provide less-obvious information to help inform aspects of the model related to the spread of disease (e.g., weather patterns).
Although there has been an explosion of wastewater modeling efforts in the past 4 years, the use of models to estimate prevalence or predict epidemiological metrics such as cases, hospitalizations, and deaths is still in its infancy. To improve the use of models to understand incidence and prevalence and strengthen forecasting capabilities, numerous data needs exist:
- Publicly available, raw (non-normalized) wastewater surveillance data for many sewersheds across different geographic areas, sewershed sizes, and other varying features, to provide large data sets for assessing modeling capabilities;
- Improvements in wastewater surveillance data quality and consistency (see also Chapters 2 and 3), to reduce nonintrinsic variability derived from differences sampling, processing, and analysis;
- Reduced lags in data reporting, which impact the predictive power of forecasting tools;
- Improved spatial data, including sewershed boundaries so that wastewater data can be accurately mapped to other geographic data sets by county or census tract;
- Shedding data for wastewater surveillance targets, including the distribution of shedding kinetics across a range of individuals and
- the shape of that distribution for each target (and variant) by stage of the disease;
- Prospective epidemiological studies to validate mechanistic or statistical models (see Box 4-3); and
- Improved understanding of viral, bacterial, and fungal decay and loss of RNA and DNA signals in wastewater systems prior to sampling, including effect of travel times, temperature, and wastewater chemistry in a range of system sizes.
Additional developments in modeling and data integration tools could substantially advance efforts to triangulate and integrate wastewater data with other data sources. Models could provide a common mathematical and statistical framework for multiple distinct data types, enabling estimates and conclusions to be drawn from across these different sources—potentially mitigating some of the different biases present in each. As discussed earlier in this chapter, local health jurisdictions that have invested in data integration efforts to date rely mainly on plotting disparate data on the same plot or same page. Model-based analysis of disparate data sets would increase confidence in data interpretations and improve the reliability of disease forecasting, thereby improving local public health decisions while reducing staff burden. Advances in modeling tools that link machine learning with elements of mechanistic models (e.g., Chopra et al., 2023; Drake et al., 2023; Rodriguez et al., 2023) could draw upon the strengths of both approaches, bringing knowledge of component processes while also using machine learning to explore areas where such processes are poorly understood.
PUBLIC HEALTH RESPONSE GUIDANCE
As noted in the committee’s previous report (NASEM, 2023) and according to the needs assessment conducted by the NWSS Centers of Excellence from Colorado and Houston (R. Schneider, Houston Health Department and K. Weisbeck, Colorado Department of Health, personal communication, 2024), local health departments continue to need support in understanding what actions they can take with wastewater surveillance data. Additional pathogen targets as well as different sampling approaches and population coverage (e.g., sampling at large citywide wastewater treatment plants, small plants, or facilities) make understanding how to respond to the data for public health intervention even more complicated. The response to detection of a target can differ based on a variety of factors including disease severity, stigma, and/or spreading rates. Depending upon these factors, targets may have different timelines for notifications of public health staff and different intervention approaches. The actions, as well
BOX 4-3
Moving from Trends to Estimating Prevalence in the Community
While is it fairly well established that trends in respiratory viruses in wastewater correspond to the rise and fall of infections in the community, translation of these values to an empirical estimate of the number of people infected in the community remains a major challenge. Unlike hospitalizations or deaths that can provide known values to calibrate statistical models, the number of people infected at a point in time is difficult to determine. Mechanistic models could be used to estimate infection prevalence, but many knowledge gaps need to be filled. Among the multiple variables that could influence estimates in a mechanistic model, shedding rates are perhaps the most important to determine. For SARS-CoV-2, these can be highly variable depending on the individual (e.g., whether the individual is a super-shedder), stage of the disease, and likely by variants (Arts et al., 2023; F. Li et al., 2023; Prasek et al., 2023). Early studies showed that shedding rates of individuals could vary by up to four orders of magnitude (Zheng et al., 2020). Modeling of SARS-CoV-2 shedding in a community using clinical testing as the basis for estimating infection rates showed shedding can vary by almost two orders of magnitude and depending on age, demographics, or the variant circulation in the community (Prasek et al., 2022). Although some of the expansion targets under consideration (see Chapter 5) have shedding data, many do not, and what data sets exist may be incomplete for fully encompassing the variability of individuals across an outbreak. The large variation in shedding (e.g., super-shedder versus an asymptomatic/low shedder) is highly important to capture if transmission dynamics are to be accurately reflected in the models. Additionally, once the target enters the sewer system, temperature (Hart and Halden, 2020), transport times (Schussman and McLellan, 2022), partitioning to solids or settling (Ye et al., 2016), and other factors that affect decay of viruses and bacteria will influence the final concentrations of DNA or RNA recovered in a wastewater sample.
Prospective epidemiological studies could help validate mechanistic models or be used to develop statistical relationships between wastewater concentrations and the number of people infected. For example, ongoing respiratory surveillance cohorts (such as those already funded by CDC) could recruit participants in alignment with wastewater treatment plant catchment areas, enabling comparison between wastewater and epidemiological data on infection patterns (particularly for highly under-ascertained illnesses) and allowing for validation of mechanistic models. Such studies can also be used to evaluate shedding patterns (ideally by demographic variables such as age), which can be used to inform further modeling efforts. Prospective studies can also often capture asymptomatic, pre-symptomatic, and other less frequently detected infections (depending on their testing structure), making them particularly useful for validating wastewater monitoring, compared with clinical data that may only reflect symptomatic individuals.
as the response time, differ by location. For example, detection of RSV in wastewater from an assisted living facility with a population of elderly residents who are at risk for severe disease may trigger specific actions such as masking and spatial distancing within the facility while actions may differ for detection of the same target in a wastewater treatment plant covering a large population (e.g., messaging about the risk to infants as well as the elderly and emphasizing maternal as well as adult vaccination).
Development of national guidance for response actions by wastewater target and population coverage location would provide support for jurisdictions in their local decision making. Such a response framework reduces uncertainty about which actions are appropriate after the detection of a target, creating accountability and maximizing efficiency. For a given detected target, there will be a logical set of suggested responses that could be customized. This way each jurisdiction need not develop a plan independently. As an example, Komal et al. (2024) developed a framework for Houston that is adaptable for other jurisdictions according to their capacity. The plan addresses several additional wastewater targets for potential wastewater surveillance identified by a survey of local infectious disease doctors (Sheth et al., 2024a). It outlines clear internal health department notification timelines, who needs to be notified upon receiving a wastewater target detection or a spike above baseline, and what their action would be. The timelines, actions, and order of actions were derived through consultation with leaders of the various departments/programs in the public health agency. An example of application of this plan is outlined in Figure 4-16.
EVALUATING THE PUBLIC HEALTH VALUE OF THE WASTEWATER SURVEILLANCE SYSTEM
Expanding wastewater surveillance beyond the COVID-19 emergency involves costs, including monetary costs; workloads for utilities, local health jurisdictions, and CDC; and opportunity costs as leaders strive to meet those demands amidst resource scarcity. It also has the potential to yield significant public health benefits. Yet, that outcome is not guaranteed, and the currently available evidence does not permit quantification of the value of wastewater information relative to the investments required to generate it. Given the costs and resource scarcity within CDC, a plan for monitoring and evaluating the public health benefit of NWSS should be set in place once the key decisions about the system’s design over the next 5–8 years are made.
This evaluation plan should cover several dimensions of program success. First, technical success: are the chosen sampling design, targets, and analytical methods yielding the expected information (or better) at the expected level of confidence (or better)? Second, usefulness: do stakeholders

SOURCE: Adapted from Sheth et al., 2024b.
perceive the wastewater data to substantially improve their ability to make public health decisions? This involves assessing both the marginal utility of wastewater data relative to other available sources of surveillance data and people’s ability to actually act on the data in ways that prevent morbidity and mortality. Third, what burdens does participating in NWSS involve? Burdens may be material (e.g., resources, staff time) or more intangible (e.g., stigmatization, fatigue). Fourth, in system participants’ view, does the value of the information outweigh the burdens? That assessment requires
looking back at the public health wins the system has supported, as well as forward to the harms it seems likely to make meaningful contributions to averting in the future.
DATA ACCESS FOR RESEARCH
Expanding access to community-level NWSS data has substantial potential benefits for facilitating research and informing public health action. Throughout a range of contexts in public health, calls have emerged for more open data, metadata, and statistical code, recognizing the potential scientific gains associated with broadly sharing these building blocks of research innovation (IOM, 2015; Ross et al., 2023). Data sharing (with appropriate measures to protect data security and individual privacy) has become an accepted and expected part of research in many health fields, from clinical trials to genomics to health economics, even though the data sets may involve sensitive, individual-level data. Broad data access ensures “not simply that a single database can be used more widely, [but also] that these data can be leveraged, shared and combined with other datasets” (Huston et al., 2019). In other areas, such as immunization data, CDC has already taken steps to facilitate greater sharing of data across local health jurisdictions.16 Among the motivations for these efforts is CDC’s recognition that expanded access to data promotes health equity.17
Currently, health departments that submit data to NWSS cannot directly download data from sampling locations in other jurisdictions and cannot in any other way receive data that include specific geographic identifiers. CDC may facilitate communications among jurisdictions that would like to collaborate and share data but does not itself supply other jurisdictions’ data. Other interested persons, including academic researchers and private companies working in the predictive analytics space, may submit a request to CDC to receive data and metadata (i.e., the full 200 analytic variables in the NWSS database) from community-level sampling sites, after executing a data use agreement. The data include state and county information but not the exact address or name of the sampling location. Tribal data and data from sites with a population under 3,000 are not shared (K. Cesa, CDC, personal communication, 2024).
CDC’s data sharing policies represent an effort to balance data access with the need to protect and nurture CDC’s relationship with the health departments contributing data. Health departments may be concerned that sharing data openly with precise geographic identifiers could lead to
___________________
16 See https://www.cdc.gov/surveillance/data-modernization/snapshot/2022-snapshot/stories/transforming-immunization-data.html.
17 See https://www.cdc.gov/surveillance/data-modernization/dmi-health-equity.html.
stigmatization of communities where pathogen levels are relatively high or loss of public trust in the health department or local and national wastewater surveillance systems. Although the committee is not aware of evidence that any stigmatization has arisen from community-level wastewater surveillance, maintaining community trust and participation requires solicitude to the risk. Facility- or institution-level wastewater data (as opposed to community-level data) may involve a nontrivial risk of identifying individuals or creating stigma (see also NASEM, 2023).
Another argument in favor of stringent controls on data access is that most data uses that fit the definition of public health surveillance, as opposed to research, will not undergo ethical review by an institutional review board (Otto et al., 2014). Data sharing in other areas, such as clinical trials, has also raised concerns that, even if metadata are provided, secondary users may not understand how to use data in a way that generates scientifically valid results. This is a particular concern where secondary users seek to combine data from multiple primary sources in a single analysis and may not appreciate differences across data sets that make them noncomparable—a circumstance that arises for wastewater data. Finally, some data contributors to the NWSS may have executed data use agreements that did not contemplate broad data sharing and would require updating.
Yet, restrictive data sharing policies come at a cost. Specific geographic identifiers are crucial to conducting wastewater-based epidemiological analysis and creating forecasting models. The ability to use detailed geographic information and metadata may facilitate the discovery of underlying features of particular infectious diseases that could reduce future health impacts. For example, is there a trend to higher population occurrence (as implied by wastewater measurements) for individuals in certain air pollution nonattainment areas, when corrected for potential confounding variables? Geographic data help analysts understand who is and is not represented in the NWSS, how pathogen levels vary across sites, how trends in pathogen levels converge or diverge across geographic areas over time, and how well a forecasting model fits actual wastewater data from different geographic areas. Making data easy to access facilitates inclusion of more researchers in efforts to formulate and test different strategies and concepts—efforts that may not be undertaken if they involve an arduous process of applying for permission to use data or if the necessary data are wholly unavailable. An additional benefit of facilitating wide access to data is that researchers not otherwise included within the traditional framework of users (e.g., molecular biologists, engineers, sociologists, geographers) may have knowledge of or access to other data sets and sources of information that can be fused with the wastewater data to generate novel insights that could advance the field.
To balance communities’ concerns with the benefits of broader data access, the committee recommends that CDC provide community-level wastewater data with site identifiers to researchers or other public health jurisdictions through an expeditious process while maintaining some degree of control over how NWSS data are used. This recommendation would appear to be aligned with the broad goals of CDC’s recently updated Public Health Data Strategy,18 but it is unclear what specific plans CDC envisions for wastewater data. The committee suggests a data sharing process with four hallmarks:
- Requests for data use should be individually assessed. The committee’s Phase 1 report (NASEM, 2023) described how an ethics advisory committee could be constituted by CDC and tasked with reviewing applications for data uses. This ethics advisory committee, which could be modeled after existing committees reviewing secondary data uses at universities, would be given the remit of determining whether data use requests hold promise for generating a scientific and/or public health benefit and whether risks (including the risk of community stigmatization given public concern about the pathogen) are minimized through data handling procedures and reasonable in relation to the anticipated benefits. In addition to recommending approval or disapproval of requests, the ethics advisory committee would be empowered to work with requestors to strengthen data use proposals by describing specific measures to ensure adequate protection of the data and of the communities that have contributed the data. The ethics advisory committee should be transparent with NWSS data depositors and the public about the criteria used to assess requests.
- Data requestors should be required to execute a data use agreement. Where public health data have identifying information attached and are considered to be even somewhat sensitive, it is appropriate to commit those who access them to basic terms of responsible use. This includes consulting metadata (e.g., detection limits, sampling method and frequency, treatment plan population coverage, laboratory analytical methods) to understand aspects of the data that may make particular analyses or statistical approaches not scientifically valid. Doing so promotes public trust and ensures that the “ground rules” of the data sharing are respected.
- The data use agreement should be short, simple, unified, and standardized. Data requestors should sign one data use agreement with CDC, rather than individual agreements with contributing sites.
___________________
18 See https://www.cdc.gov/ophdst/public-health-data-strategy/index.html.
- Further, the data use agreement template should reflect the principle that the amount of legal architecture around a data transfer should be commensurate with the level of risk and sensitivity of the data. Community-level wastewater data—even with site identifiers—are fairly low-risk data, both in terms of the sensitivity of information they convey about individuals and small areas and in terms of the potential consequences for individuals and communities were the confidentiality of the data breached. Data use agreements should bind data users to (1) not share data with third parties; (2) not publish results that identify specific wastewater treatment plant data by name or make specific treatment plants readily identifiable; and (3) use data only to conduct the analyses specified in the data use application, returning to CDC for further permission if they would like to explore additional analyses. Bearing in mind that executing data use agreements within universities is often a protracted process and that delays tend to arise from haggling over other kinds of provisions, such as indemnification (Mello et al., 2020), limiting wastewater data use agreements to these three basic terms will help ensure that the process facilitates rather than impedes research.
- Periodic reassessment of the data access policy should be part of the work of CDC’s data ethics committee (Mello et al., 2023; NASEM, 2023). Most importantly, a decision to shift the scale of wastewater data collection or analysis from the community level to more targeted surveillance should trigger reconsideration of current policy. The committee’s Phase 1 report (NASEM, 2023) described several other conditions that also should prompt a fresh look at whether the current policy still represents the optimal balance between data access and protection of other interests. These include advances in reidentification techniques, a court ruling that wastewater data are more discoverable or admissible in legal proceedings than previously understood, changes in the degree of stigmatization or other risks associated with finding a high level of a pathogen in a specific community, and any reports of unexpected data uses, such as access by law enforcement.
CDC should make NWSS contributors aware of the shift in policy, describe participation in the data sharing program as a condition of NWSS participation, update agreements with contributors as needed, and describe how CDC safeguards data confidentiality and protects against misuse. It should also explain the benefits of sharing geographic identifiers—both for contributing health departments, which may now conduct comparisons with other jurisdictions much more easily, and for wastewater science
generally. When external researchers achieve important advances (e.g., in modeling) based on NWSS data, these innovations should be communicated to local health departments to demonstrate the ongoing value of contributing and sharing data. Over the longer term, continued conversation with NWSS participants that have expressed reservations about greater data sharing may help CDC move toward providing public access to community-level wastewater data without the need for data use agreements.
Local health departments, in turn, should send regular communications to their wastewater treatment plant partners, sharing back wastewater surveillance results and broader advances in the field of wastewater surveillance that have been made possible through WWTPs’ contributions. Helping WWTP staff understand the value of wastewater surveillance to public health action can ensure strong, continued partnerships as the exigencies of the COVID-19 pandemic fade.
CONCLUSIONS AND RECOMMENDATIONS
Further analysis is urgently needed to resolve uncertainty about whether normalization improves data quality and comparability and, if so, to identify a cohesive approach to normalization in the NWSS. Ideally, data normalization would aid comparison of data across sites and reduce variability at a single site, but normalization also has the potential to introduce significant additional variability into the reported results. Currently, there is no scientific consensus regarding which normalization factors or approaches perform best under various conditions, and no single normalization approach has been identified that improves data quality and comparability in wastewater surveillance data at a national scale. The NWSS currently presents data with inconsistent normalization approaches, which complicates interpretations across sites. NWSS leadership should develop a clear rationale for data normalization and a robust process to evaluate multiple factors. Research using large, existing data sets and data science techniques is needed to determine whether to normalize and, if so, using which method(s).
The NWSS should advance plug-and-play tools and, in the near term, provide open-source code for advanced analytical tools that provide public health agencies with nationally consistent data analysis and visualization approaches that contextualize risk. The NWSS has made substantial advancements in its public-facing dashboard, but many states and localities still prefer using their local dashboards with their own customized data analytics. Yet, the variability in data analysis approaches across states makes it difficult for localities to readily compare their observations to others. Although some states may initially prefer to continue using their own individually developed analytic approaches, as new pathogen targets are added, the burden of data analysis, visualization, and interpretation will
only continue to increase. The long-term goal is for the NWSS to provide plug-and-play tools and overarching metrics that are easy to use and understand and substantially reduce the burden on localities to develop, interpret, and contextualize their wastewater surveillance data. In the near term, CDC should work with partners to develop open-source code in a common programming language to help localities conduct advanced analytics using data downloaded from DCIPHER. To assist this effort, CDC could draw upon data analytics expertise and resources in its Centers of Excellence, large public health jurisdictions, and other federal agencies, such as the Environmental Protection Agency, U.S. Geological Survey, or the Centers for Medicare & Medicaid Services. Sharing the code with public health agencies will promote further improvement by end users.
Automated data entry and reporting deadlines would improve the timeliness of NWSS data. Currently, there are a range of workflow approaches, with substantial lag times between sample collection and data availability for some sites. Delays in sample processing and data entry impact the potential response of public health agencies to new outbreaks or disease spread. The NWSS should develop user-friendly data entry tools with automated quality checks for laboratories and wastewater treatment plants and require their use to reduce reporting delays. Laboratories should submit data within 48–72 hours after samples are received.
Improved data integration would significantly enhance the value of NWSS data. CDC should strive to integrate and improve sources of clinical data in its wastewater visualization tools and disease forecasting models so that public health agencies can better understand the larger context for the wastewater data, strengthen forecast predictions, and increase confidence in their public health actions. Databases already exist with information on immunization rates, emergency department syndromic surveillance, and reportable diseases, but these databases are not integrated with one another nor with wastewater surveillance and the data can be disparate or incomplete. Recent developments in modeling, machine learning, and data science offer important opportunities to integrate and gain insights across the data streams (including clinical testing, hospitalizations, and deaths).
To strengthen infectious disease forecasting and nowcasting using wastewater surveillance data, key information needs should be addressed. Priority information needs include
- Access to non-normalized data from NWSS sampling sites,
- Data on shedding rates (and their distribution) for NWSS targets,
- Improved geospatial data for monitored sewersheds,
- Improved understanding of pathogen decay in sewersheds, and
- Prospective epidemiological studies to validate mechanistic or statistical models.
These data would also help to extrapolate NWSS data to communities that are currently unrepresented in the NWSS. Pathogen shedding and decay data and prospective epidemiological studies will require major research investments to advance this foundational information upon which data interpretations can improve and expand. Pathogen evolution may affect shedding rates so these studies would need to be updated periodically. To be fully usefully applied, CDC will also need to reduce sources of variability from sampling, processing, and analysis, as described in Chapters 2 and 3.
CDC should adopt an expeditious process for making community-level wastewater data with site identifiers and associated metadata directly available to health departments and researchers upon request. The potential scientific benefits of broadening data sharing exceed the risks. However, given that some communities that contribute to the NWSS may be concerned about stigmatization and other risks, an unrestricted data access policy is not optimal for maintaining trust. Rather, CDC should convene an ethics advisory committee to review applications for data use by assessing the risk/benefit balance of the proposed use and the adequacy of the proposed data security and confidentiality procedures. Those granted access should execute a simple, standardized data use agreement with CDC containing three provisions: users will use data only to conduct the analyses specified in the data use application, will not share data with third parties, and will not publish results identifying specific wastewater treatment plants by name or making them readily identifiable. CDC should periodically reassess this data sharing policy in light of any new developments that bear on the risk/benefit balance of sharing. Due to identifiability concerns, facility-level data should not be included in the data sharing scheme. Over time, CDC should work with communities that have expressed concerns about publicly sharing their wastewater data to address those concerns so that data access can be further expanded, since even simplified data use agreements constitute a barrier to researchers entering the field.
CDC should develop guidance and model response action plans to help state, local, and tribal public health agencies understand the significance of changing infectious disease metrics and examples of actions that may be appropriate to further reduce risks. Although NASEM (2023) noted many examples of public health actions supported by wastewater surveillance data—often supported by related data sources—other small public health agencies that operate with limited staff have noted that the data are underused or only presented to the public without use in public health decision making. These agencies need assistance in understanding the significance of data presented by the NWSS to increase their capacity to reduce public health risks. This guidance is likely to differ for the various classes of organisms and evolve as the data integration and model forecasting capabilities improve.
CDC should develop a monitoring and evaluation plan for the NWSS that would be implemented once the key decisions about its design over the next 5–8 years are finalized. The plan should specify the information that needs to be collected to assess the key dimensions of technical success, usefulness, burdens, and whether the value of the information outweighs the burdens. The technical success assessment should include consideration of whether newly available technologies or methods could further enhance performance. The usefulness and value-of-information assessments should consider both the ways wastewater data have contributed to past public health actions and the potential for future benefit. The usefulness assessment should also consider whether the chosen list of targets has proved to be over- or underinclusive. The burden assessment should consider both tangible and intangible burdens. As with other research, collaboration with academic researchers is likely to be helpful in designing and implementing the evaluation plan.
This page intentionally left blank.


