Supply Chain Challenges and Solutions amid COVID-19 (2025)
Chapter: 4 Case Studies
CHAPTER 4
Case Studies
Introduction
The case studies in this section explore how transportation sectors and stakeholders adapted to disruptions during the COVID-19 pandemic (2020–2023), the challenges they faced, and the lessons they learned for building more resilient supply chains. Each case study includes background information, a description of challenges faced, lessons learned, and effective practices. The challenges correspond to those outlined in Chapter 3.
Case Study 1—West Coast port congestion
As demand for consumer goods rapidly shifted throughout the COVID-19 pandemic, maritime supply chains, including ports, saw significant shifts in demand. The case study covers the challenges associated with these shifts and how the ports responded to these challenges.
Case Study 2—Colonial Pipeline cyberattack
While not directly related to the pandemic, the ransomware attack on the Colonial Pipeline occurred in 2021 amid the pandemic. The case study focuses on the impact of the ransomware attack and the subsequent temporary shutdown of the pipeline on the fuel supply chain.
Case Study 3—Food and agriculture bottlenecks
The COVID-19 pandemic created several challenges for food supply chains. This case study focuses on the challenges faced by workers in food processing facilities, the shift in demand from food away from home (FAFH) to food at home (FAH), and how these factors impacted supply chains.
Case Study 4—Truck stop capacity
From 2020 on through the next few years, the transport of freight over the road rapidly increased in volume and remained elevated, testing supply chain capacity. Service and parking at truck stops became limited, though challenges with truck parking had existed prior to the pandemic and have been persistent since.
Congress signaled the importance of truck parking with the Truck Parking Safety Improvement Act of 2022, and U.S. DOT directed funding from the Bipartisan Infrastructure Law to truck parking.
Case Study 5—Personal protective equipment supply shortages
Supply chains of personal protective equipment (PPE) became stressed early on during the COVID-19 pandemic. This case study focuses on mechanisms that influence the demand side of a PPE supply chain, including emergency stockpiles, demand management, and preparedness/planning measures that can be considered ahead of time.
Case Study 1—West Coast Port Congestion (2020–2021)
Congestion at the Port of Los Angeles and Port of Long Beach (LA/LB), also known as the San Pedro Bay Port Complex, has frequently been referenced as an example of COVID-era supply chain disruptions. At one point in 2021, there were more than 80 container ships anchored and waiting in the queue for LA/LB, representing a distinct spike compared to a typical queue of less than five (Miller, 2022). Photos in the news displayed dozens of container ships queued along the West Coast and were symbolic of supply chain delays experienced by U.S. consumers in 2020 and 2021. The source of these disruptions was multifaceted and indicative of how widespread the pandemic impacts were. The resolution of these disruptions relied on a collaborative approach that considered nearly all elements of the supply chain.
Ranked as the top two U.S. container ports [measured by twenty-foot equivalent (TEU) volume], LA/LB handle about 29 percent of the market share of commodities moved through U.S. port systems. Imports are mostly dominated by East Asia trade (representing 90 percent of all volumes moved through the ports), with top imports including furniture, automobile parts, clothing, and plastics. Top exports from these ports include paper, animal feed, soybeans, recycled metal, and fabrics. During the peak disruption periods, as the demand increased, the port throughput reached capacity (BTS, 2023b).
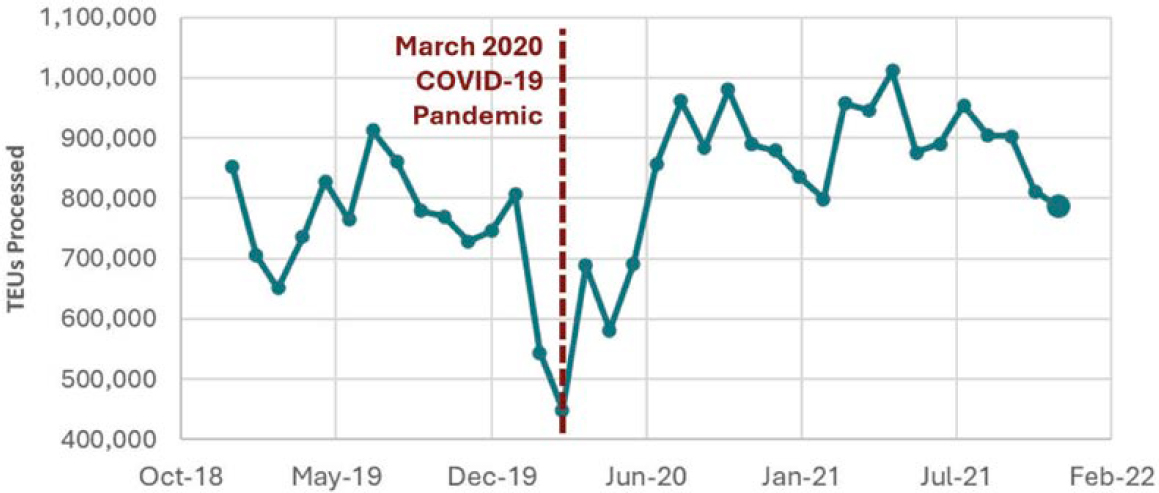
During 2019 and 2020, the Port of Long Beach experienced a moderate annual decline (1.3 percent) in TEU volumes; however, it was the monthly and daily variability of container volumes that caused the initial operational shocks. During the early phases of the pandemic in 2020, the reactionary halt on trades caused an initial decline in port operating volumes, reduced by an average of 20 percent compared to volumes in 2019 (BTS, 2024). Variations this severe are unusual, and the system was further shocked when volumes transitioned from a 20 percent reduction to a 27 percent increase in TEU volumes occurring in the second half of 2020. In 2021, as demand continued to surge, the port processed over one million container moves, a new record representing an increase of 74 percent compared to the prior year (Port of Long Beach, n.d.). Figure 4-1 depicts the variation in container volumes during this time.
The surge in container volumes presents only a limited picture of the conditions because the port’s capacity (the maximum number of vessels the port can handle at a time) is determined by multiple system parameters. Workforce challenges included labor disputes, which is a recurring issue with West Coast ports, with worker safety from illness as a focal point of identified risks.
While East Coast ports also experienced similar challenges during this time, it was West Coast ports—the major hubs for trade with Asia—that handled many of the products in high demand during the COVID-19 pandemic, including personal electronics and consumer furniture, and which thus experienced greater levels of congestion. Still, some critical differences between
East Coast and West Coast port infrastructure, operation, and policy provide a noteworthy comparison. From 2019 to 2022, East Coast ports increased their share of containerized imports from 44 percent to 48 percent and increased their exports from 48 percent to 53 percent as shippers sought to avoid West Coast port congestion (BTS, 2023b). East Coast ports have also documented the benefit of investing in connectivity, capacity, technology, and workforce which has improved operational efficiency.
East Coast ports have long been accustomed to disruptions and tend to remain resilient during major events like hurricanes. Unlike operational conditions seen in West Coast ports, the systems in place at the Port of New York and New Jersey enabled quick, coordinated responses to emerging challenges, and significant investments in connectivity, capacity, technology, and workforce training improved operational efficiency. Also, the expansion of the Suez Canal contributed a viable option for shipping lines seeking alternative all-water routes.
The short-term ramifications of the challenges experienced at LA/LB included severe congestion felt throughout the United States. The supply chain reacted, and the medium-term effects saw cargo diversions to East Coast ports, which increased operational costs. Long-term impacts for West Coast ports have included permanent changes in shipping routes and the implementation of modern technologies and policies, resulting in improved resilience for future disruptions. These events underscore the importance of investing in scalable infrastructure, implementing advanced data analytics and real-time tracking technologies, developing strategies for workforce resilience, diversifying supply chains, and establishing transparent communication channels among stakeholders. Adopting more flexible regulatory frameworks can also help enable quicker responses to changing conditions.
Challenges
Maritime port operations are interdependent upon other modes of transportation, relying on connections to road, rail, river, and airport operations. The ports themselves are constrained by the physical limitations of their real estate and their equipment (quay cranes, storage yards, straddle carriers, etc.). And all port operations rely on the availability of a skilled workforce. While port operations were the focal point of the pandemic-induced delays that occurred between 2020 and 2022, ports were only one part of the system, and many subsequent bottlenecks occurred outside the port gates.
Physical
The cargo throughput of LA/LB, like that of other maritime ports, is limited by physical characteristics of the port, such as the number of berths available and the yard layout. The ports of LA/LB are spread across 7,500 and 3,200 acres, respectively. Despite their extensive area, the fixed number of berths and specific container yard layouts could not be readily expanded or reconfigured. While many aspects of port operations are evaluated to determine maximum throughput, the system can experience bottlenecks from less likely sources. In the case of LA/LB, the limited storage areas of containers became a bottleneck. Even with more berths and cranes, there was no room for containers to be stored within the port and not enough capacity to move the containers away from the port.
Information and Data
Legacy information systems at the ports struggled to handle the 30 percent increase in container volume efficiently during the latter half of 2020. These systems were often not fully integrated, leading to delays in communication between the port authorities, shipping companies, and logistics providers, which in turn prolonged container processing times.
Equipment
During peak shipping periods in 2020, there was a reported shortfall in the availability of truck container chassis, which are critical for transporting containers from the container yards to storage or onward transport. This shortage was exacerbated by delays in equipment maintenance and repair, primarily due to labor shortages and supply chain issues affecting spare parts (U.S. DHS, 2022).
Workforce
Labor shortages during the pandemic contributed to supply chain challenges, as COVID-19 infections, new safety protocols, and related quarantine measures reduced the number of available dockworkers, truck drivers, and warehouse logistics workers by as much as 20 percent. This reduction significantly impacted the ports’ operational capabilities, especially during times of increased demand when a larger workforce was needed to manage the surge in container traffic.
Regulatory
Compliance with new health and safety protocols, including social distancing and sanitation requirements, required changes in operational procedures, which were estimated to reduce the efficiency of cargo handling operations by up to 25 percent, leading to overall slower processing times, during the initial months of implementation.
Supplier Source
The concentration of imports from East Asia, particularly China, which accounted for approximately 60 percent of the inbound containers, created a significant risk when the region was initially hit by the pandemic. The lack of diversified supply chains contributed to severe disruptions, with delays in receiving shipments and a subsequent increase in lead times for receiving goods.
Lessons Learned
The lessons learned arose from a range of challenges, including limitations in real-time data exchange, constraints from fixed infrastructure, and workforce susceptibility to external
disruptions. These conditions highlight the need for increased scalability, strategic equipment management, and diversified supply chains as effective practices to mitigate disruptions and ensure future resilience.
Inadequate Real-Time Coordination
A lack of real-time communication and coordination systems exacerbated the congestion crisis. Maritime ports learned that existing systems were not sufficient to manage the complexities of modern logistics during surges in demand.
Insufficient Scalability of Physical Infrastructure
Fixed physical infrastructure was quickly overwhelmed, revealing a critical need for scalable solutions to accommodate fluctuating cargo volumes without causing operational disruptions.
Equipment Utilization Inefficiencies
The crisis revealed significant inefficiencies in equipment management, particularly for essential assets like chassis and cranes. The ports recognized the need for a more strategic approach to equipment deployment, maintenance, and sharing.
Workforce Vulnerability to External Shocks
The need for a consistent workforce became a liability as COVID-19 spread through staff. This demonstrated the vulnerability of operations to external health crises and the need for more resilient workforce management strategies.
Slow Regulatory Response to Emerging Situations
Rigid regulatory frameworks were slow to adapt, limiting the ports’ ability to respond agilely to unprecedented scenarios. Such problems underscored the need for more flexible regulatory processes that can quickly adjust to changing conditions.
Overdependence on Single Suppliers
The reliance on a narrow set of supply sources led to severe disruptions when those sources were compromised. The ports learned the importance of diversifying supply chains to mitigate risks from regional disruptions.
Fragmented Stakeholder Communication
The ports’ initial response to the congestion crisis suffered due to fragmented communication with and among stakeholders. This problem underscored the need for more integrated and transparent communication strategies to manage complex multi-stakeholder environments effectively.
Effective Practices
In response to the congestion crisis, the ports of LA/LB implemented a series of effective practices to enhance efficiency and resilience. These included extended gate hours to increase throughput, leveraging data analytics for better cargo flow management, and fostering enhanced collaboration among stakeholders across the supply chain. Incentive programs encouraged quicker container movement, while additional resources and streamlined regulatory processes addressed bottlenecks and expedited cargo clearance. These combined strategies played a crucial role in mitigating the immediate crisis and building a more robust port system for the future.
Extended Gate Hours
Both ports of LA/LB implemented extended gate hours (24-hour operation) and opened on weekends to increase port throughput capacity and decrease congestion, adding 60 hours more to each week (an increase in hours of over 50 percent). This allowed for more flexible pick-up and drop-off times for truckers, helping to spread out the activity and reduce peak-time pressure.
Use of Technology and Data Analytics
Advanced data analytics and real-time tracking technologies were employed to better predict cargo arrival times and manage the flow of goods more efficiently. The implementation of systems like the Port Optimizer at the Port of Los Angeles helped stakeholders across the supply chain access real-time data for better coordination.
Enhanced Collaboration Among Stakeholders
Increased collaboration between port authorities, shipping companies, trucking firms, and rail operators led to better coordinated efforts to manage container movements. Regular meetings and communication channels helped align operations and address issues more dynamically.
Incentive Programs for Efficient Cargo Movement
The ports introduced incentive programs to encourage truckers to move containers during off-peak hours and to clear containers more quickly from terminals. These programs helped reduce dwell times and improved the overall fluidity of cargo movement through the ports.
Deployment of Additional Resources
Additional resources, such as more truck chassis and handling equipment, were deployed to alleviate equipment shortages. Temporary storage solutions, like pop-up container yards (making use of a nearby empty parking lot), were also created to handle overflow and free up dock space.
Streamlining Regulatory Processes
Efforts were made to streamline regulatory and customs processes to accelerate the clearance of cargo. This included prioritizing the processing of ships and cargo that had been delayed the longest and using digital tools to pre-clear goods before arrival.
Labor Force Support
Initiatives to manage and support the workforce included vaccination drives for port workers and adjustments to work protocols to ensure safety without sacrificing operational efficiency. These efforts helped stabilize workforce availability and maintain productivity.
Case Study 2—Colonial Pipeline Cyberattack (2021)
On May 7, 2021, a ransomware attack on the Colonial Pipeline Company halted the flow of oil through its pipeline network, which had been at 2.5 million barrels (105 million gallons) of product per day. In response, Colonial Pipeline proactively shut down its systems in response to the attack to avoid further disruption. Five days later, on May 12, 2021, the company restarted pipeline operations [U.S. Department of Energy (DOE), 2021]. This case study describes the impacts that the ransomware attack and subsequent shutdown of operations along the pipeline had on the fuel supply chain and the more generalizable lessons learned from such a disruption.
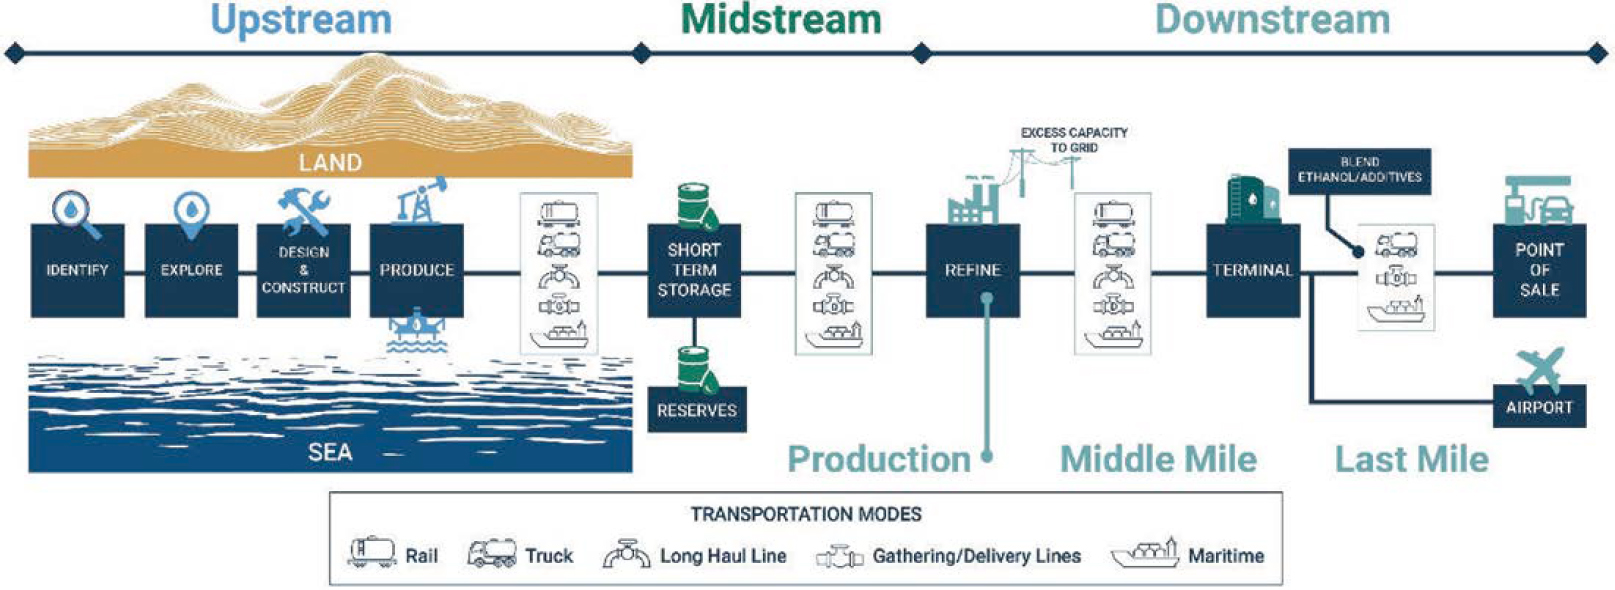
The Colonial Pipeline is part of the downstream segment of the fuel supply chain, as shown in Figure 4-2. Specifically, it is an example of middle-mile distribution, taking refined fuel product from the refinery to a fuel terminal. From the fuel terminal, fuel is most often moved via truck over the road network to a point of sale (e.g., a retail gas station). The U.S. Department of Energy, the Cybersecurity and Infrastructure Security Agency (CISA), and other organizations closely monitor the upstream and midstream segments of the fuel supply chain, and those segments—particularly refining capacity—have shown to be remarkably resilient during natural hazards and other disruptions. Issues often arise in the downstream segments of the fuel supply chain (MIT Humanitarian Supply Chain Lab, 2021; Rana et al., 2024).
The incident sparked widespread panic buying of gasoline in states including Florida, Georgia, Virginia, and the Carolinas. This resulted in long lines at gas stations and in some cases, stations running out of fuel. The closure also caused disruptions in the flow of jet fuel, impacting some airlines and airports in the southeastern United States.
Key issues: Demand surges because of consumer-driven “panic buying” can challenge supply chain systems in similar ways that a supply shortage, distribution disruption, or other similar issue would. Middle-mile capacity in fuel systems is not easily replaced.
Challenges
The supply chain challenges that can be observed through the Colonial Pipeline cyberattack fall into three of the categories described in Chapter 3: information and data, security, and congestion and capacity. This section describes how each of these challenges played out in this case.
Information and Data; Security
The Colonial Pipeline ransomware attack highlights the vulnerability of supply chains to cybersecurity threats that cause real disruptions in the flow of goods. Cybersecurity threats are unlike many natural hazards. Even with earthquakes and tsunamis that come with little warning, there is information on the areas where these events are most likely to occur (e.g., along fault lines or coastal areas). Because cyberattacks can happen anywhere at any time, it is impossible to prepare for any specific threat. Agencies like CISA are tasked with ensuring the resilience of national critical infrastructure to threats such as this one (CISA, 2023). In addition, supply chain stakeholders must be prepared to adapt quickly.
Congestion and Capacity
Rapid changes in demand, regardless of the cause, can test the resilience of a supply chain. In the case of the Colonial Pipeline ransomware attack, the public disclosure of this incident caused widespread panic buying along areas served by the pipeline. The pipeline, as a middle mile connection in the fuel supply chain, represents significant fuel transportation capacity. That capacity is not easily replaced by other modes, as is shown in Table 4-1. Pipelines in general, and the Colonial Pipeline in particular, move a significant amount of fuel compared to other modes. Replacing the pipeline’s flow would require 11,500 large tanker trucks per day.
To protect against normal fluctuations in demand, nodes along the supply chain (e.g., terminals and retail fuel stations) will carry inventory. In the case of the Colonial Pipeline ransomware attack, spikes in demand caused by panic buying rapidly depleted the inventory (stock) at nodes in the supply chain that would have carried, under normal demand conditions, at least a few days’ worth of fuel supply.
Lessons Learned
The Colonial Pipeline disruption provides an opportunity to learn about future disruptions, whether the result of human action or natural causes. A few of the key lessons learned from this incident follow.
Fuel Deserts
Like food deserts, “fuel deserts” occur when communities lack access to local fuel sources (e.g., 50 or more miles between fuel stations). These areas are particularly vulnerable during emergencies and require careful consideration in disaster response planning. Strategies may include prioritizing fuel restoration to the nearest fuel source or diverting supplies from operational sources to serve these underserved regions.
Single Store Owner Challenges
During disruptions, not all retail fuel stations have equal access to fuel supplies. This disparity is partly due to existing contracts between fuel stations and suppliers. Branded fuel stations, such as ExxonMobil, Shell, or BP, have contracts for branded fuel (with select additives). Independent stations, on the other hand, often purchase unbranded fuel on the spot market from terminal racks. According to the National Association of Convenience Stores (NACS), more than half of U.S. fuel stations are branded. When supply is limited, wholesalers may restrict the amount of fuel available on the spot market, leaving independent stations with insufficient supply.
Table 4-1. Capacity comparisons of fuel transport modes.
| Mode of Transportation | Fuel Transportation Capacity |
|---|---|
| Small tanker truck “bobtail” | 3,500 gallons |
| Large tanker truck | 9,100 gallons |
| Railroad tanker | 30,000 gallons |
| Medium-range tanker ship | 8–15 million gallons |
| Long-range tanker ship | 15–26 million gallons |
| Colonial pipeline | 105 million gallons per day |
Middle-Mile Alternatives
Pipelines are the most efficient method for transporting large volumes of fuel over long distances. Alternative options for transport over middle-mile distances (as from refinery to terminal), like trucks and rail, have limited capacity and are less practical for handling large fuel volumes, especially during disruptions. In short-term disruptions, the fuel system relies on existing stockpiles throughout the supply chain to bridge the gap.
Surge Capability
The final leg of the fuel supply chain, from terminals to retail stations, has limited capacity to increase fuel delivery during disruptions. This is primarily due to constraints in trucking capacity and potential limitations in terminal throughput.
Effective Practices
While the government cannot replace the private sector’s capacity to provide key commodities like fuel, there are actions that the government can take to promote rapid restoration of the flow of these commodities. Examples of these effective practices as described in this section include examples of “levers” that can be “pulled” by public sector actors to increase the flow of fuel through the supply chain. There are additional levers that can be utilized by private sector actors and even consumers. Some of these levers are fuel-specific, but some apply to the movement of freight in general, regardless of the type.
Hours of Service Waivers
The Federal Motor Carrier Safety Administration (FMCSA) can waive restrictions on interstate hours of service in response to disruptions, allowing drivers to make additional trips, and did so following the Colonial Pipeline ransomware attack (FMCSA, 2021). Regional waivers that provide interstate flexibility—allowing, for example, truckers in affected areas to refuel in one state and travel to another—are more impactful. State governments can also waive state-specific hours of service restrictions. This kind of waiver can create challenges, however, if drivers hauling goods must cross state boundaries from one state that has a waiver to a neighboring state that does not. (Drivers cannot take advantage of the waiver if it differs across state lines; they must stop short.)
Weight and Size Limit Waivers
FMCSA maintains standard requirements for gross vehicle weight. To meet the standard 80k lbs. gross vehicle weight limit, most tanker trucks travel with their tanks not filled to capacity. Waivers allow additional fuel (or other cargo) to be placed on vehicles, meaning more cargo can be transported on fewer trucks. Weight limitations, however, are in place to ensure long-term durability of pavement and bridges, a key consideration when issuing a waiver. Relevant actors include state governments, DOTs, and FMCSA.
Driver, Load, and Inspection Standards Waivers
Waivers can be granted to truckers exempting them from other requirements, also; however, there is no historical precedent for removing driver endorsements or changing hazardous materials (hazmat) standards, and waivers of these requirements are not recommended for safety. Waivers could be considered for frequency of inspection, though brake safety would be of concern (FMCSA, 2021).
Reid Vapor Pressure Waiver
The EPA regulates the Reid Vapor Pressure (or RVP, a measure of volatility) of gasoline during summer months to reduce evaporative emissions that contribute to ground-level ozone. This gasoline must be sold during the summer. However, in emergency situations, the EPA may temporarily waive these seasonal restrictions, allowing the sale of higher-volatility winter gasoline. In rare cases, the reverse may occur if there is an oversupply of winter-grade fuel.
Jones Act Waiver
DHS has the authority to receive requests for and approve waivers to the Jones Act. The U.S. Maritime Administration (MARAD) determines the availability of Jones Act vessels to carry the products for which the waiver is sought (U.S. DOT, 2021).
Case Study 3—Food and Agriculture Bottlenecks (2020–present)
The pandemic created significant volatility in the food and agriculture supply chain system. While the overall import price index for foods, feeds, and beverages saw a slight increase, specific categories experienced drastic shifts. Notably, meat, poultry, and fish prices decreased sharply between March and June 2020, followed by a dramatic rise in subsequent months. This volatility was driven by factors like disruptions in processing plants, shifts in consumer demand from food away from home (FAFH) to food at home (FAH), transportation bottlenecks, and labor shortages.
Figure 4-3 identifies the changes in spending between FAFH and FAH, with the most significant shift occurring during the initial lockdown restrictions in early 2020.
Before the pandemic, Americans spent a substantial portion of their food budget on FAFH, including restaurants, cafes, and workplace cafeterias. In early 2020, FAFH accounted for 51.5 percent of all nominal food expenditures in the United States (Padilla et al., 2021;
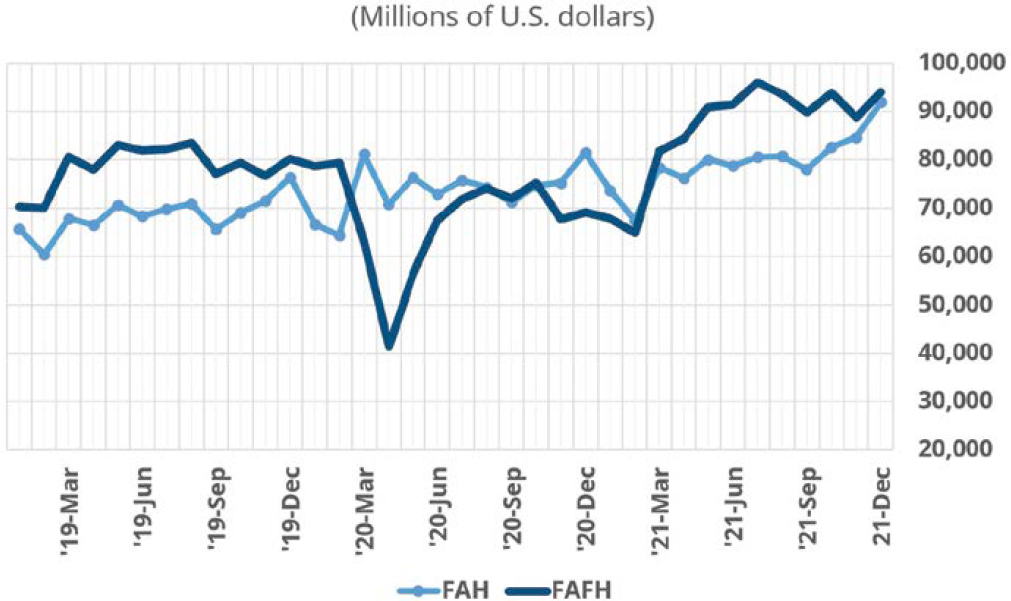
Marchesi and McLaughlin, 2022). However, the pandemic and subsequent lockdowns, stay-at-home orders, and social distancing guidelines led to a sharp decline in FAFH spending and a surge in FAH spending (Dong and Zeballos, 2021). This dramatic change in consumer behavior exposed several fragilities within the U.S. food and agriculture supply chain, revealing weaknesses that existed long before the crisis.
Source data indicates that food and beverage in-store sales rose by 12.2 percent in the first eight months of 2020 compared to 2019, while food service and drinking place sales dropped by 20.9 percent in the same period. The pandemic’s impact on the meat processing industry was severe. Labor shortages and COVID-19 outbreaks forced temporary closures of processing plants, disrupting supply chains and leading to price volatility. This was especially pronounced in North America, where the industry is highly concentrated. For instance, U.S. cattle and pig slaughter rates plummeted by 40 percent in April 2020 (Padilla et al., 2021; Vaiknoras et al., 2022). Total nominal expenditures on FAH were higher in every month of 2020 compared to 2019, while expenditures on FAFH were lower in every month after February 2020. The share of real food retail sales for meat, eggs, and nuts increased nearly 18 percent in the 52 weeks after the national emergency declaration, indicating a rise in demand for these products in the FAH market (Saksena, Okrent, and Hamrick, 2018; Marchesi and McLaughlin, 2022; McLaughlin et al., 2022).
The shift from FAFH to FAH was not solely driven by income shock but also by changes in consumer behavior due to mobility restrictions, fear of infection, and the closure of restaurants. This unprecedented event exposed vulnerabilities in the agriculture supply chain, emphasizing the need for greater flexibility and resilience to adapt to sudden changes in demand patterns.
While the long-term impacts of this shift in the U.S. food industry are still unfolding, it is clear that the pandemic has accelerated growth trends in the food industry, such as online grocery sales and direct-to-consumer food marketing models. Consumers have increasingly sought local and regional food sources, while e-commerce and online grocery sales have surged. Heightened awareness of supply chain fragility has led to calls for source diversification and supply chain resilience. However, food price volatility remains a significant challenge, necessitating ongoing monitoring and policy responses to ensure food security.
The following sections delve into the challenges to the food supply chain caused by the COVID-19 pandemic, describe the lessons learned from these challenges, and explore effective strategies for food and agriculture supply chain resilience to mitigate the impact of future disruptions.
Key issues: While multiple factors contributed to food supply chain challenges, including labor shortages, transportation bottlenecks, and processing plant closures, the overarching issue was the inability of the system to adapt quickly to the dramatic shift in demand patterns caused by the pandemic.
Challenges
The COVID-19 pandemic brought about a multitude of challenges to the food and agriculture sectors, especially workforce shortages, transportation congestion, and capacity issues. The pandemic served as a stark reminder of the interconnectedness and vulnerabilities of the food and agriculture sectors.
Congestion and Capacity
The COVID-19 pandemic exposed and amplified preexisting vulnerabilities in global agricultural supply chains, hindering the efficient movement of agricultural goods. Disruptions in air freight, a critical mode for high-value perishable products, were exacerbated by the decline in passenger air travel. Simultaneously, shipping companies responded to shortages of shipping
containers and pallets by prioritizing import-heavy routes to Asia, creating particular challenges for agricultural exporters in securing adequate supplies of containers.
Truck driver shortages further strained transportation systems. Factors such as low pay, inadequate truck parking, and the pandemic’s impact on the health of the workforce contributed to high turnover rates and a shortage of drivers, particularly in the refrigerated and perishable trucking segment, essential for food and agriculture. Increased border-crossing wait times due to pandemic-related restrictions and inspections created delays and disruptions to the flow of agricultural goods, especially perishable products like fruits, vegetables, and meat. These delays increased transportation costs and contributed to spoilage, affecting both producers and consumers (USDA, 2022).
Ocean shipping also faced significant challenges. Consolidation in the industry resulted in fewer carriers with increased market power, leading those carriers to prioritize imports over agricultural exports. This raised concerns about potential loss of market share and damage to the U.S.’s agricultural export reputation. Congestion at ocean ports, stemming from increased import demand and limited infrastructure, compounded the challenges. Congestion, combined with chassis shortages and storage limitations, resulted in significant delays and increased transportation costs (USDA, 2022).
Workforce
The pandemic severely exacerbated pre-existing labor shortages in the agricultural sector. Travel and mobility restrictions, border closures, and health concerns related to COVID-19 reduced the numbers of available workers, especially seasonal workers essential for harvesting fruits and vegetables. This shortage extended to meat and poultry processing and to truck driving, further impacting supply chains.
The pandemic exposed the vulnerability of workers in the food supply chain to health problems, especially those in meat processing plants where close proximity is unavoidable (Krumel and Goodrich, 2021). Outbreaks of COVID-19 in these facilities forced temporary closures, leading to supply disruptions and price volatility. During this time, meat and poultry processing plants were defined as critical infrastructure in the food and agriculture industry (Waldman, Mulvany, and Mosendz, 2020). Although many processing plants implemented safety protocols like face coverings, staggered shifts, worker testing, and physical barriers, workers were still vulnerable to infection.
Lessons Learned
The COVID-19 pandemic served as a stark reminder of the vulnerabilities within agricultural supply chains and provided valuable lessons for enhancing their resilience and adaptability. Some key takeaways are described in the following section.
Essential workforce
The pandemic underscored the critical role of agricultural workers and the need for a stable, healthy workforce. Pre-existing labor shortages were amplified by COVID-19, impacting all stages of the supply chain. This emphasized the importance of policies that attract and retain workers, for instance, by offering fair wages, benefits, and improved working conditions, particularly in industries like meatpacking where workers faced heightened health risks. The pandemic also highlighted the interdependence between farmers and consumers. Small farmers, who are crucial for maintaining a robust food system, are often more vulnerable to economic shocks. Agencies like the U.S. Department of Labor (U.S. DOL) and the Centers for Disease Control and Prevention’s National Institute of for Occupational Safety and Health (CDC NIOSH) have
developed programs that enhance workforce development and occupational safety and health outreach.
Supply Chain Adaptation
The pandemic exposed the limitations of highly specialized and inflexible supply chains, particularly the stark division between FAFH and FAH systems. When demand rapidly shifted from FAFH to FAH, food producers and processors faced difficulties adjusting to the new market demands. These difficulties made apparent the need for more agile and responsive systems capable of handling sudden shifts in demand. For example, investments in more flexible packaging and labeling systems could help food processors better cater to both the retail and food service sectors (USDA, 2022).
Fragility of Just-In-Time
The pandemic revealed the fragility of just-in-time inventory and production models that dominate many supply chains. Disruptions to meatpacking plants, for instance, caused ripple effects throughout the entire pork supply chain, from producers facing backlogs of livestock to consumers experiencing shortages and price spikes. This underscores the need to diversify sourcing, build in redundancies, and explore alternative inventory management strategies to enhance flexibility and responsiveness to shocks (i.e., the just-in-case approach).
Effective Practices
The lessons learned, coupled with the effective practices identified, offer valuable insights and strategies for building a more resilient, adaptable, and sustainable food system for the future. To address the challenges, authorities implemented policies to facilitate trade while the food industry adapted by streamlining operations and investing in supply chain visibility. Supporting farmers and workers through information sharing, safety measures, and labor policy changes was crucial.
Policy Actions to Stabilize Supply Chains
Open and predictable markets proved vital for ensuring a smooth flow of food along supply chains. Government policies that reduced border waiting times, streamlined certification processes, and eased trade regulations helped to prevent major disruptions in the movement of agricultural products. Notably, policymakers mostly avoided imposing export bans, which would have exacerbated the crisis, as happened during the 2007–2008 food price crisis.
Industry Adaptations to Shifting Demand
Food processors and retailers demonstrated resilience by increasing operating hours, hiring additional staff, simplifying product ranges, and finding alternative suppliers. These measures helped replenish store shelves as stockpiling behavior subsided and demand patterns shifted from FAFH to FAH.
Investments in supply chain visibility, such as tracking stock levels and real-time conditions, allowed companies to respond more effectively to disruptions. Businesses with prior experience managing disruptions, like those caused by hurricanes, were also better prepared for the challenges posed by the pandemic.
Support for Farmers and Workers
Government agencies and industry associations played a crucial role in disseminating information and providing support to farmers. Programs and resources from organizations like
USDA, U.S. DOL, and the Office of Agriculture Safety and Health (within CDC’s NIOSH) have addressed workforce development and occupational safety and health outreach (USDA, 2022).
Long-Term Investments for Resilience
Ensuring access to USDA programs, such as loans, grants, and research initiatives, for producers that promote environmental sustainability and minimize reliance on synthetic fertilizers and pesticides, is crucial. Removing barriers to access can promote the adoption of practices that enhance the resilience of the agricultural sector (USDA, 2022). Investing in local and regional food systems can reduce reliance on concentrated production and processing centers. Such an initiative would provide grants and loans for smaller scale processing facilities, seek to expand cold storage and aggregation infrastructure, and facilitate connections between local producers and institutional markets like schools and hospitals. This initiative would likely involve improved technical assistance to small-scale food producers and processors, particularly in navigating regulatory requirements and accessing new markets (USDA, 2022).
Resilience of the food and agriculture supply chain will also rely on investments in the aging infrastructure of inland waterways, such as the Mississippi River system, which are crucial for transporting bulk agricultural commodities. Additionally, investing in port infrastructure upgrades, including dredging projects to enable the movement of larger ships, can facilitate U.S. agricultural export competitiveness. There are also recommendations for investments in inland container loading facilities to improve efficiency and reduce reliance on congested port areas. To connect these nodes, targeted investments are needed to improve the condition of roads and bridges, particularly in rural areas with large volumes of agriculture production, where infrastructure often lags behind more urban areas (USDA, 2022).
Case Study 4—Truck Stop Capacity
During the COVID-19 pandemic, an increased reliance on trucking for freight transportation drove a surge in demand for truck stop capacity. However, the number of truck stop parking spaces physically available remained relatively constant, limiting parking options for truck drivers. Compounding these shortages, new regulations and social distancing mandates led to rest area and truck stop closures, which created significant challenges to truck driver safety and trucking capacity and impeded the operations of the dominant mode of commodity transport.
As a result, truck drivers faced extended wait times for parking, often exceeding 2 hours at peak congestion times, according to anecdotal reports from industry publications. These delays translated to longer delivery times and increased costs for consumers and contributed to supply chain disruptions overall. Furthermore, limited parking forced drivers to take rest breaks in unsafe locations or extend their shifts, leading to increased driver fatigue, which is a prominent risk factor for truck crashes, as reported by the Federal Motor Carrier Safety Administration (FMCSA, 2006). The lack of real-time data on truck stop availability further exacerbated the issue, making it difficult for drivers to plan their routes efficiently. Additionally, many truck drivers avoided traditional truck stops due to concerns about virus exposure and social distancing. As a result, they sought alternative parking locations, such as highway shoulders, rest areas, or industrial lots, which were often less equipped to handle high volumes of trucks. Overall parking shortages were a problem because available spaces in safer or preferred locations were in high demand, making it harder for drivers to find suitable places to rest.
A sharp decline in demand for long-haul truck capacity in early 2020 was followed by a surge in demand for the transport of medical supplies, food, and goods purchased online, leading to an abrupt increase in the Transportation Services Index (TSI), as shown in Figure 4-4. According
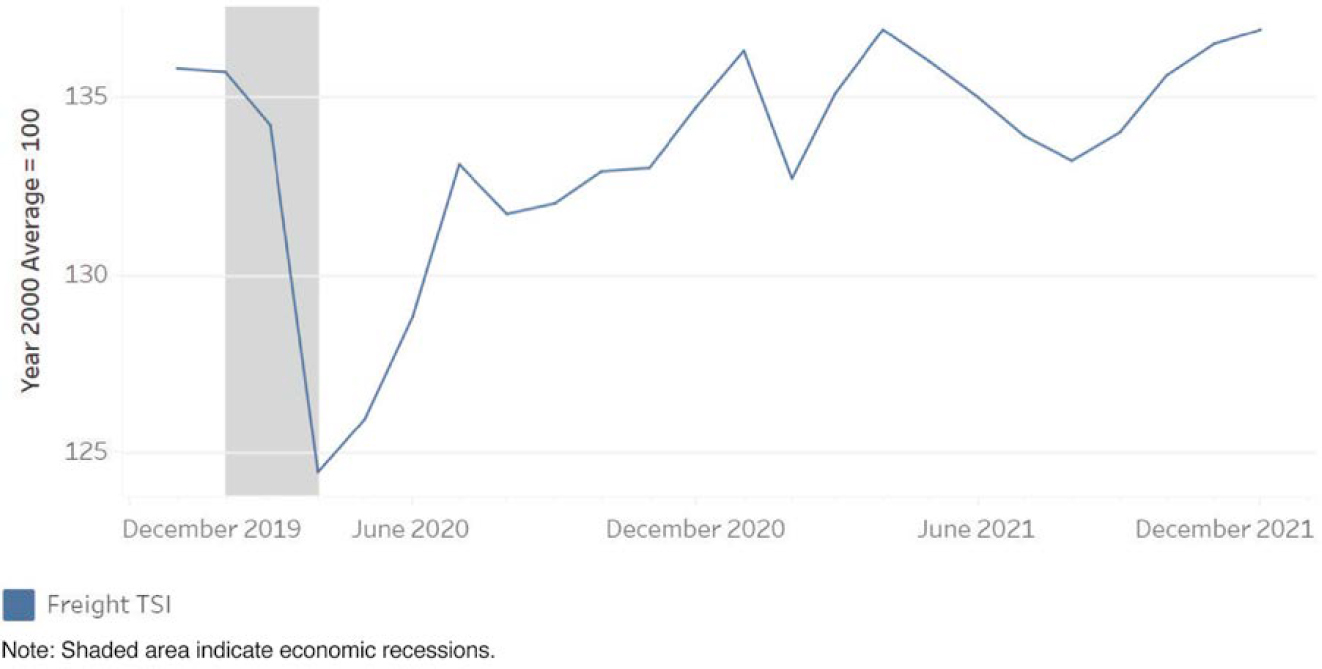
to the American Trucking Association (ATA, 2023), this surge significantly outpaced the existing capacity of truck stops. Coupled with a preexisting shortage of drivers—exceeding 80,000 (ATA, 2021)—these conditions created significant challenges for the trucking workforce and trucking capacity.
Challenges
The capacity of truck stops and the effect it has on truck transportation and driver well-being is multifaceted, presenting a set of ongoing challenges for the truck transportation industry.
Physical
The chronic shortage of truck parking during the COVID-19 pandemic was exacerbated by the regulatory closures of rest areas and truck stops, which further reduced safe and legal parking options, forcing drivers to park in unauthorized and potentially dangerous locations, such as highway shoulders and ramps, thereby impeding other ground transportation. Pandemic-related restrictions led to the closure of these essential facilities or limited their hours of operation, impacting drivers’ access to food, restrooms, and showers. These problems highlighted the fragility of the support system for truck drivers and the need for more resilient solutions.
Congestion and Capacity
The COVID-19 pandemic led to a surge in e-commerce and home deliveries, which resulted in a significant increase in freight transport volumes. This, in turn, led to an increased demand for truck parking at rest areas and truck stops.
Information and Data
The lack of readily accessible, accurate, real-time information about truck parking availability is a recurring theme. Without this information, drivers waste valuable time searching for parking, potentially exceeding their hours-of-service (HOS) limits and compromising safety.
This challenge underscores the need for investment in and expansion of truck parking information systems.
While data sources like cell phone location provide insights into travel patterns, they often lack information about the travelers themselves and the purpose of their trips. This gap makes it difficult to develop targeted policies and solutions to address specific needs within the transportation system. Several sources acknowledge the need for more efficient and comprehensive data collection methods, particularly during disruptions. Newer tools consider O-D in the context of other geographic data. Better data is crucial for understanding the real-time impacts of disruptions, optimizing resource allocation, and developing effective mitigation strategies.
Equipment
The closure of food services and limited access to truck stops during the pandemic highlighted the lack of personal refrigeration in many trucks (FTC, 2024). This challenge underscores the need for companies to consider equipping trucks with basic amenities to enhance driver well-being and resilience during disruptions. The shortage of semiconductor chips impacted the production of new trucks, which put additional strain on the existing truck fleet and may have exacerbated issues related to truck maintenance and availability.
Regulatory
Many truck stops were forced to reduce their capacity to comply with social distancing guidelines and travel restrictions. This further exacerbated the shortage of truck parking spaces. While HOS regulations are designed to prevent driver fatigue, when combined with limited parking availability, they created pressure for drivers to find parking within stricter timeframes, potentially leading to risky behaviors to avoid violations. This circumstance highlights the need for more flexible regulatory approaches in times of crisis.
Workforce
The surge in demand for essential goods produced by the pandemic increased the workload for truck drivers, who were already facing challenging conditions. The combination of increased freight volumes and reduced truck stop capacity led to longer hours for truck drivers and fewer opportunities to rest, resulting in greater driver fatigue and stress and increased risk of accidents. These circumstances underscore the need for better support systems and resources for drivers to manage stress and maintain their well-being.
Several sources identify shortages of available drivers as a major challenge in the trucking industry, predating but aggravated by the pandemic. An aging workforce, challenging working conditions, and high turnover rates contribute to this shortage, putting pressure on the industry’s ability to meet freight demands. During the pandemic, the trucking industry responded to the challenge of fewer drivers by training new employees but faced challenges due to social distancing restrictions and the need to adapt training programs for rapid, on-demand, and remote settings. This situation further emphasizes the need for flexible and innovative training solutions to address workforce challenges.
Lessons Learned
Regulatory Collaboration Between Government, Truck Stop Operators, and Trucking Companies
Collaboration between truck stop operators, government agencies, and trucking companies is essential for developing and implementing effective solutions to the challenges associated with truck stop capacity. This collaboration can include sharing information, coordinating resources,
and developing joint initiatives. The pandemic spurred regulatory changes, including temporary exemptions from hours-of-service regulations, to facilitate the transport of essential goods. However, these exemptions, while intended to expedite deliveries, also raised concerns about driver fatigue and safety, highlighting the importance of balancing supply chain needs and driver well-being (Hughes and Purdy, 2023).
Emergency Planning for Truck Stop Capacity
The COVID-19 pandemic underscored the need for a comprehensive plan to manage truck stop capacity during emergencies. This plan should include strategies for increasing capacity, providing essential services to drivers, and promoting safety.
Essential Services for Truck Drivers
Essential services, such as food, fuel, and rest areas, are critical for the well-being of truck drivers. These services must be made available at truck stops and rest stops, even during emergencies. Many initial broad restrictions associated with lockdowns, including restrictions on movement, impeded these essential services without considering the impact to national and global operations.
Technology for Truck Stop Efficiency and Safety
Technology can be used to improve truck stop efficiency and safety. For example, real-time parking availability information can help drivers find parking spaces more quickly, and electronic tolling can reduce congestion at toll plazas.
Improved Perception and Awareness of Truck Drivers
With supply chains disrupted and consumers relying heavily on deliveries, the public gained a greater appreciation for truck drivers. This recognition highlighted the importance of addressing industry challenges and improving working conditions for these essential workers (Sperry et al., 2022).
Effective Practices
Establish Contingency Plans to Allow Overflow Truck Parking Areas near Major Freight Corridors
Overflow truck parking areas can be established near major freight corridors to provide additional parking spaces for trucks during emergencies. These areas should be well-lit and secure, and they should have access to essential services, such as food, fuel, and rest areas. An inventory of these locations would provide planners and operators with the information necessary to quickly respond to surge conditions or disruptions.
Increasing the Number of Rest Stops and Truck Parking Spaces
Increasing the number of rest stops and truck parking spaces can help to reduce driver fatigue and stress. Rest stops should be located at regular intervals along major freight corridors, and they should be equipped with such amenities as showers, laundry facilities, and Wi-Fi. It’s crucial that state DOTs and MPOs accommodate these needs with freight plans and land planning, especially when promoting new distribution and manufacturing development.
Improve Truck Parking Information Systems
Enhancements of truck parking information systems can provide drivers with real-time information on parking availability. The emphasis of these systems is reliability and accuracy to
establish trust. The intent is to reduce the time that drivers spend looking for parking and avoid parking violations (Kentucky Transportation Cabinet, 2022).
Invest in Facilities That Address Driver Fatigue and Safety
The challenges of driver fatigue and safety for trucking operations must be addressed. Parking capacity is only one metric; truck stop and rest facilities must include other amenities, including restrooms, appropriate lighting levels, and security features to protect drivers and cargo (Kentucky Transportation Cabinet, 2022).
Case Study 5—Personal Protective Equipment (PPE) Supply Shortages
The COVID-19 pandemic exposed challenges across supply chains, from supply disruptions to demand spikes, and across industries—from healthcare to semiconductors to consumer goods. This case study focuses on cases when demand far exceeds supply for a given resource or commodity, and what adaptations can be made across the supply chain to address this challenge. Specifically, this case study focuses on personal protective equipment (PPE) supply chains during the COVID-19 pandemic. Though the case is written about the provision of PPE in a healthcare context, the lessons learned apply to sectors other than healthcare, including the highway transportation, urban public transportation, or any scenario where an entity manages a resource critical to the delivery of its mission or conduct of its business. For example, the lessons learned could apply to a state or local Department of Transportation’s management of those resources needed to maintain road safety and operability (e.g., sand, salt, fuel, repair materials, or vehicles).
The following sections cover the challenges, lessons learned, and effective practices identified in the management of PPE supplies in hospitals during the COVID-19 pandemic.
Key issues: Demand for personal protective equipment such as masks, gowns, and gloves far exceeded supply during the COVID-19 pandemic.
Challenges
Supply and Demand
In the early months of the COVID-19 pandemic, demand for PPE far exceeded the supply of these items, including masks, gowns, and gloves. This meant that healthcare providers who needed PPE could not access it to stay safe while performing their jobs. The supply of PPE, which included the Strategic National Stockpile, state stockpiles, inventory at healthcare facilities, and the supply from manufacturers themselves, was inadequate. Manufacturers simply could not produce enough new masks to keep up with the demand from healthcare facilities and the public. In addition, as China experienced its own pandemic outbreak, many suppliers located in China stopped shipping PPE to the United States (Associated Press, 2020).
Supplier Source
Contributing further to the challenges were issues with the sourcing of the items. The U.S. supply of certain kinds of PPE was concentrated among a few manufacturers (Freedman, 2020) and expanding that capacity would require significant investment. Existing manufacturers quickly ramped up production. New manufacturers entering the PPE space encountered a range of challenges, including difficulty acquiring factory equipment, which itself had become scarce as the pandemic intensified, and uncertainty about whether demand for PPE would remain at such elevated levels.
The dynamic of demand spiking for a given material, components of a technology, or other goods can occur in almost any supply chain. In some cases, there may be few suppliers of that item; in other cases, there may be many suppliers, but concentrated in one geographic area, region, or country.
Lessons Learned
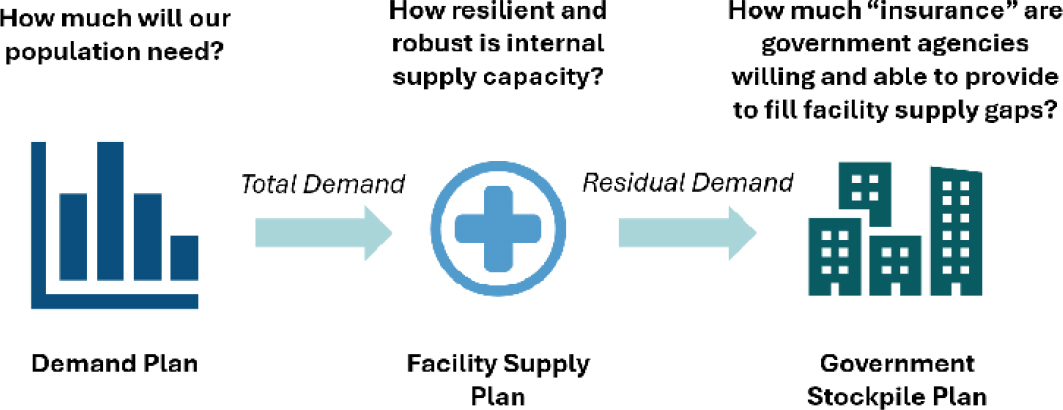
As hospitals managed their way through this surge in demand for PPE, the importance of deliberate planning for the supply of critical materials was evident. This section will describe the elements of the planning process for a facility or organization in the event of a spike in demand or supply disruption. Figure 4-5 outlines the planning process.
Demand Planning
This involves understanding the total demand for a given product from the users or customers in your scope. How much will your organization or the group you seek to serve need? In healthcare, this could be the number of masks a doctor or nurse needs in a typical shift. In the context of a public transit agency, this could be the number of masks needed daily or weekly for the staff.
Facility Supply Planning
Supply planning involves evaluating how long the users or customers will be able to cover their own needs without intervention. In a larger organization, the customers may be departments or units and with their own stockpiles. Facility supply planning discerns how much of the “last resort” stockpile will be needed to cover shortages in individual units or departments.
Government Stockpile Planning
Stockpile planning identifies how much reserve supply government agencies are willing and able to stockpile as “insurance” against brief gaps between supply and demand in emergencies. Maintaining a stockpile is costly, so government organizations may weigh the tradeoffs of maintaining the stock against the risks to public health, continuity of operations, or other measures of impact if the reserve stock cannot fill the gap.
Effective Practices
This section describes several effective practices that can be employed in the event of a significant demand surge or disruption in supply where a persistent gap between supply and demand requires action.
Implementing Conservation Policies to Decrease Facility-Level Demand
Conservation policies limit or control the demand for a given item within an organization or facility. To conserve PPE during the COVID-19 pandemic, healthcare facilities implemented policies such as cohosting COVID-19 patients, allowing their treatment by a smaller group of designated staff. This reduced staff-to-patient contact ratio and limited the number of personnel required to wear PPE. Other PPE conservation policies included (1) extending the usable life of each PPE item by allowing more reuses before disposal, and (2) speeding up diagnostic testing to more quickly determine whether a person with COVID-like symptoms was infectious and needed to use PPE.
Similar operating policies that extend the useful life of individual PPE items and minimize staff-to-staff contact and staff contact with customers or facility users can be employed in businesses and settings outside of healthcare.
Facility Supply Planning
Individual facilities must be prepared to handle some level of unexpected PPE demand on their own before tapping into outside stockpiled resources. There are several practices that facilities can effectively implement, including:
- Building a robust individual facility stockpile: Having a robust stockpile within the facility extends the period during which a facility can operate and meet its own PPE requirements before needing to request additional resources. However, maintaining stockpiles can be costly, a fact that often deters organizations from creating them, or from keeping them robust enough to cover demand for a long enough period.
- Improving relationships with suppliers: During shortages, suppliers often limit the amount of PPE they provide to each customer. By building strong relationships with suppliers and securing higher allocations, facilities can better assure adequate replenishment of their supplies during emergencies and reduce reliance on external assistance. This can be challenging for facilities where demand for PPE is normally low. In such cases, partnering with government agencies or other relevant organizations involved in PPE planning can be beneficial in preparing for potential demand spikes or supply disruptions. These partnerships may focus on transparency in inventory data reporting, identifying alternative suppliers, and sharing information about products that comply with needs and requirements (e.g., communicating about the differences between medical masks, KN95 and N95 masks, and cloth masks).
Outside of healthcare, having a PPE stockpile may or may not make sense for an organization; it may be more productive to work together with similar agencies or organizations to plan together for a PPE stockpile. Further, an organization may identify other essential items for which having an emergency stockpile could be helpful or necessary.
Government Agency Stockpile Planning
Dedicating time and human capital to maintaining a stockpile that is responsive to changing needs results in overall lower levels of inventory costs. Effective practices identified from research on this topic include:
- Creating a plan for reordering: Designate personnel to monitor and reorder products.
- Decreasing lead time for product orders: Set up agreements with suppliers to decrease the time from order to delivery of an item.
- Reassessing stockpile levels: Following a spike in demand, it is critical to reassess how much remains in stock.
- Anticipating residual demand: Instead of waiting for formal requests for assistance, anticipate demand and place replenishment orders in advance. Even anticipating demand two weeks in advance can decrease the size of the stockpile required by 15 to 25 percent.


