Previous Chapter: 2 Literature Review
Suggested Citation: "3 State of the Practice." National Academies of Sciences, Engineering, and Medicine. 2025. Asset Management Practices for Mechanically Stabilized Earth Walls. Washington, DC: The National Academies Press. doi: 10.17226/29115.

CHAPTER 3

State of the Practice

The state of the practice described in this synthesis was determined using a survey administered with an internet-based survey tool and disseminated to lead asset management personnel in the 50 state DOTs, as well as asset management personnel in Puerto Rico and Washington, DC.

The survey was subdivided into five main categories focusing on:

  • Retaining wall management practices,
  • Practices for retaining wall inventory and assessment,
  • Methods of MSE wall maintenance,
  • Methods for determining MSE wall condition and prioritizing MSE maintenance/rehabilitation projects, and
  • Methods for determining MSE deterioration rates and life-cycle costs.

Each category consisted of several questions, for a total of 33 questions specific to asset management of MSE walls. The state of the practice for each category is described in the following sections. Appendix A contains the distributed survey and Appendix B contains compiled response data. Question numbers presented in the following sections correspond with the numbering in Appendices A and B. Respondents were given an opportunity to upload guidance documents for retaining wall repair and rehabilitation. Ohio DOT shared their standard plans for MSE wall repair. These are included in Appendix C to the Contractor’s Final Report which is not included herein but is available on the National Academies Press website (nap.nationalacademies.org) by searching for “NCHRP Synthesis Report 644: Asset Management Practices for Mechanically Stabilized Earth Walls.”

Survey Responses

Responses were requested from 52 DOTs. Of these, 44 DOTs responded in full or provided partially completed responses (85% response rate, Figure 2). Each respondent was asked if their DOT maintained a retaining wall inventory that included MSE walls. Twenty-two (50%) of the responding DOTs reported that they have a retaining wall inventory. The survey was sent to asset managers within each DOT, with the request that the asset managers incorporate feedback from groups responsible for MSE wall management as necessary. The distribution of survey respondents reflects the diversity of DOT groups responsible for asset management of MSE walls. The responses came from asset management (10 of the 44 respondents, or 23%), bridge/structural (11 of the 44 respondents, or 25%), geotechnical/engineering geology (18 of the 44 respondents, or 41%), maintenance (2 of the 44 respondents, or 5%), materials (2 of the 44 respondents, or 5%), and the state retaining wall engineer (1 of the 44 respondents, or 2%). Regardless of which discipline group within the DOT, respondents were primarily engineers in supervisory or managerial roles.

Suggested Citation: "3 State of the Practice." National Academies of Sciences, Engineering, and Medicine. 2025. Asset Management Practices for Mechanically Stabilized Earth Walls. Washington, DC: The National Academies Press. doi: 10.17226/29115.
The map’s legend shows 44 states responded, 6 states with no response, and 5 case example D O Tees. The map is coded based on the type of response. The map shows the following: Responded: Alaska, Arizona, Arkansas, California, Delaware, Florida, Georgia, Hawaii, Idaho, Illinois, Iowa, Kansas, Kentucky, Maine, Maryland, Michigan, Mississippi, Missouri, Montana, Nebraska, Nevada, New Hampshire, New Jersey, New Mexico, North Dakota, Ohio, Oklahoma, Oregon, Pennsylvania, South Carolina, South Dakota, Tennessee, Texas, Utah, Vermont, Virginia, Washington, West Virginia, and Wisconsin. No response: Alabama, Massachusetts, New York, North Carolina, Rhode Island, and Wyoming. Case example D O Tees: Colorado, Connecticut, Indiana, Louisiana, and Minnesota.
Figure 2. Map showing survey respondents by state. Washington, DC, and Puerto Rico did not respond and are not shown.

Overview of MSE Retaining Wall Management

The survey sent to each state DOT asked the DOT to estimate the number of MSE walls their DOT was responsible for. The median number of MSE walls that responding DOTs were responsible for (using the definition at the beginning of the survey) was approximately 375. Of the 31 respondents to this question, 14 (approximately 44%) said their number was from an experience-based estimate, 11 (34%) described it as an estimate from a partial inventory, and 7 (22%) described it as a count based on a thorough inventory. When asked to describe their DOT’s current retaining wall inventory (Figure 3), 5 of 39 respondents (12%) reported their DOT had a complete inventory, 17 (42%) reported some form of partial inventory, and 19 (46%) reported having no retaining wall inventory.

A bar graph shows the following from left to right: 19 out of 41 respondents said My D O T does not have a retaining wall inventory. 14 out of 41 respondents said their D O T has a partial inventory (greater than 50 percent of walls) that includes both bridge-associated walls and walls associated with other asset types. 5 out of 41 respondents said their D O T has a complete inventory of all D O T-owned retaining walls. 3 out of 41 respondents said their D O T has a partial inventory (less than 50 percent of walls) that includes both bridge-associated walls and walls associated with other asset types. No respondents said that their D O T has a partial inventory (greater than 50 percent of walls) that includes only bridge-associated walls or that their D O T has a partial inventory (less than 50 percent of walls) that includes only retaining walls associated with bridges.
Figure 3. Percentage of respondents based on status of their DOT’s retaining wall inventory (Question 2).
Suggested Citation: "3 State of the Practice." National Academies of Sciences, Engineering, and Medicine. 2025. Asset Management Practices for Mechanically Stabilized Earth Walls. Washington, DC: The National Academies Press. doi: 10.17226/29115.
A bar graph shows the following from left to right: 21 out of 36 respondents selected “No asset management program like this exists for MSE walls in my state.” 5 out of 36 responded their asset management program for M S E walls has been in place Less than 5 years. 7 out of 36 said 5 to 10 years. 2 out of 36 said 10 to 20 years. 1 of the 36 respondents said greater than 20 years.
Figure 4. Percentage of respondents based on the age of their DOT’s retaining wall asset management program (Question 7).

Drilling down into the retaining wall inventories maintained by respondents, inventories with walls developed by type alone (e.g., cantilever, MSE, soldier pile) are the most common (12 respondents or 39%). Inventories with MSE walls subdivided by facing type are maintained by 9 respondents (29%), and inventories that include reinforcement type are the least common (3 respondents or 10%). Two DOT respondents noted that their DOTs allow only select types of MSE walls for traffic-bearing walls, making information on facing and reinforcement type readily available, even if it is not officially tracked in a DOT inventory. When asked about the age of their existing retaining wall inventories, 12 out of 15 respondent DOTs (80%) whose DOTs have inventories reported that their inventory databases were less than 10 years old (Figure 4).

When asked what proportion of DOT-owned MSE walls were designed using standards and codes that have since been superseded (e.g., ASD), 24 of 35 respondents (67%) reported that their DOT does not track this information. Of the 12 respondents who provided an estimate, 4 (11%) reported that less than 20% of their DOT’s MSE walls were designed using superseded standards and codes, 2 (6%) estimated it to be 20% to 40%, 4 (11%) estimated 40% to 60%, and 2 (6%) estimated the proportion at over 80% of their MSE walls having been designed using older standards.

Retaining Wall Inventory Practices

Because MSE walls can support various highway needs, from bridge abutments, to embankments, to cut slope support, the survey attempted to collect data on which groups within a DOT are typically responsible for inventorying and assessing MSE walls. Based on the survey responses, within a DOT, bridge and geotechnical groups (followed by maintenance and operations groups) are most likely to be responsible for retaining wall inventory and inspection. When asked who is responsible for inventory data collection, 9 respondents (26%) said the work was completed by DOT staff, 2 (6%) said they hired consultants, and 9 (26%) said they used both, depending on inspection needs and available budget.

Responding DOTs reported using various methods to manage data in their retaining wall inventories, including paper or electronic files in a central location, an in-house database or geodatabase, or a hosted cloud service (Figure 5). No single data management system was used by most respondents. Three DOTs commented for this question that their DOT used a combination of the response options to manage MSE asset data. When asked if their DOT kept records of as-built conditions specifically for use in their asset management program, 18 respondents (53%) reported that they did.

Suggested Citation: "3 State of the Practice." National Academies of Sciences, Engineering, and Medicine. 2025. Asset Management Practices for Mechanically Stabilized Earth Walls. Washington, DC: The National Academies Press. doi: 10.17226/29115.
A bar graph shows the following from left to right: 6 out of 32 respondents keep electric files on D O T server network. 5 out of 32 respondents use an in-house database such as Oracle or Access. 5 out of 32 have a hosted cloud service, such as ESRI's ArcGIS Online. 3 out of 32 responedents have a central location for paper files. 3 out of 32 respondents have an in-house geodatabase, such as ESRI’s ArcMap. 3 out of 32 respondents have a combination of data management tools. 1 out of 32 respondents has a custom system developed by Agile Asset. 1 out of 32 respondents uses a consultant-developed software package and database. 1 out of 32 respondents uses AASHTOWare BrM software. 4 out of 32 respondents use nothing.
Figure 5. Percentage of responding DOTs using various data management options to manage MSE asset data (Question 14).

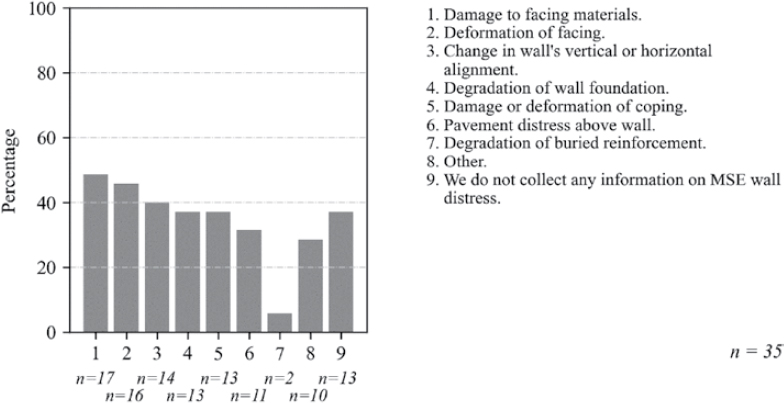
DOTs with retaining wall inventories were asked to select the types of MSE wall distress on which they collect data (Figure 6). Among DOTs that collected such data, damage to facing materials, deformation of facing, and changes in wall alignment were the most common types of distress about which they collected data.

Survey respondents were also asked to provide information on the methods and technologies used to evaluate MSE wall condition and performance (Figure 7). In-person visual inspection was the most common method used, either ad hoc during performance of other duties, in response to a specific request for a post-damage inspection, or repeated visual inspections. When asked if their DOT had identified any non-destructive testing (NDT) methods for degradation of buried elements, 31 respondents (91%) replied that they had not. The 3 respondents (9%) who answered in the affirmative explained that their DOT exhumed buried coupons or geogrid samples to monitor reinforcement degradation.

Survey respondents were also asked to provide information on how frequently MSE walls managed by their DOT are inspected following construction (Figure 8). Of the respondents, 8 (23%) reported that retaining walls are not typically reinspected, and 9 (26%) reported that

A bar graph shows the following from left to right: 17 out of 35 respondents collect information on damage to facing materials.16 out of 35 respondents collect information on deformation of facing. 14 out of 35 respondents collect information on change in a wall's vertical or horizontal alignment. 13 out of 35 respondents collect information on degradation of wall foundation and on damage or deformation of coping. 11 out of 35 respondents collect information on pavement distress above wall. 2 out of 35 respondents collect information on degradation of buried reinforcement. 9 out of 35 respondents collect information on other items. 13 out of 35 respondents do not collect any information on MSE wall distress. Respondants were allowed to select multiple options.
Figure 6. Percentage of types of wall distress collected for MSE wall assets (Question 11).
Suggested Citation: "3 State of the Practice." National Academies of Sciences, Engineering, and Medicine. 2025. Asset Management Practices for Mechanically Stabilized Earth Walls. Washington, DC: The National Academies Press. doi: 10.17226/29115.
A bar graph shows the following from left to right: 21 out of 35 respondents use ad hoc visual inspections during performance of other duties to evaluate M S E wall conditions. 19 out of 35 respondents perform post-damage inspection when called out by field personnel and perform repeat visual inspections and record-keeping. 7 out of 35 respondents repeat field surveys completed by a surveyor. 5 out of 35 respondents use remote sensing to detect changes. 3 out of 35 respondents remove and test buried metal coupons or geogrid samples. 3 out of 35 respondents perform other non-destructive testing of buried reinforcement materials. 8 out of 35 respondents use other methods. 10 out of 35 respondents have no methods to evaluate M S E wall condition. Respondants were allowed to select multiple options.
Figure 7. Percentage of types of methods used to evaluate MSE wall condition (Question 13).

DOT walls are only reinspected when tracking a known problem. Among respondents reporting a regular reinspection cycle, none reported an inspection interval greater than 10 years.

Methods for Maintenance and Rehabilitation

The survey also attempted to collect data on proactive measures used by DOTs to repair or rehabilitate distressed MSE walls. The measures were separated between work performed inside the original wall footprint and work performed outside it (Table 2). Respondents were also asked to estimate which repair methods had been most cost-effective for their DOTs.

Of responding DOTs 17 (55%) did not perform proactive repair or rehabilitation measures outside the MSE wall footprint while 13 (45%) did not perform proactive repair or rehabilitation measures inside the MSE wall footprint. Among those agencies that had completed proactive repairs outside the wall footprint, repairing erosion damage or improving drainage to direct water away from the wall were the most common measures used (Figure 9). When asked to evaluate how cost-effective these measures had been, 14 of 24 respondents (56%) described drainage improvements directing water away from the wall as the most cost-effective proactive mitigation measure (Figure 10).

A bar graph shows the following from left to right: 8 of 35 respondents never resinspect M S E walls. 9 out of 35 respondents only reinspect when tracking a known problem.7 out of 35 reinspect every 1 to 5 years. 4 out of 35 reinspect every 5 to 10 years. No repsondents reinspect greater than every 10 years. 7 out of 35 say that reinspection frequency varies within the department based on wall location and which group is responsible for inventory and assessment. No respondents reinspect variably based on age of wall where the inspection interval based on wall age is set by the respondent’s D O T.
Figure 8. Percentage of respondents by frequency of MSE wall reinspection cycle (Question 16).
Suggested Citation: "3 State of the Practice." National Academies of Sciences, Engineering, and Medicine. 2025. Asset Management Practices for Mechanically Stabilized Earth Walls. Washington, DC: The National Academies Press. doi: 10.17226/29115.

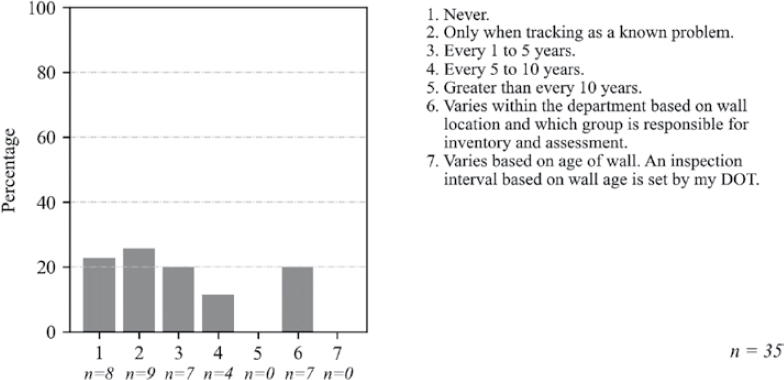
Table 2. List of proactive rehabilitation methods and typical location relative to the original MSE wall footprint (provided for Questions 20 through 23).

Type Measure
Outside of the original MSE wall footprint Drainage improvements to direct water away from the wall.
Erosion/scour repair below the wall.
Removing fill placed above the wall following construction.
Removing material deposited above the wall by landslide or erosion.
Repairing erosion damage above the wall.
Other.
Our DOT does not perform proactive measures.
Inside of the original MSE wall footprint Clearing drainage channels within the wall.
Filling voids behind wall facing.
Installation of additional drainage outlets into the wall.
Installation of structural reinforcement (e.g., soil nails, soldier piles).
Removal of trees or large woody debris from wall face or top of wall.
Repair of damaged/corroded/spalled concrete.
Replacement of missing or damaged facing elements.
Restoration of joint seals around displaced panels.
Revegetation of wall face for wrapped facing.
Treatment to prevent loss of backfill or damage to facing elements (e.g., shotcrete, grouting).

Among those agencies that had completed proactive repairs inside the wall footprint, restoration of joint seals, filling voids behind wall facing, and repair of damaged concrete were the most common measures reported (Figure 11). When asked to evaluate how cost-effective these measures had been, 6 respondents (23%) described removal of vegetation as the most cost-effective measure employed inside the wall footprint, 5 (22%) reported that repair of damaged concrete elements was most cost-effective for their DOTs, and 3 (11%) responded that restoration of joint seals around displaced panels was the most effective for their DOT (Figure 12). The variability in which mitigation methods are most cost-effective inside the wall footprint may reflect the variety of environments in which MSE walls are constructed.

The horizontal axis of the whisker plot shows numbers from 1 to 7 corresponding to the response options. Not all D O Tees utilize all repair methods, so n refers to the number of respondant D O Tees who explicity mention using this method. Data is as follows: 1. Erosion or scour repair below wall where n is 12. 2. Drainage improvements to direct water away from wall where n equals 15. 3. Removing material deposited by landslide or erosion above wall where n equals 7. 4. Removing fill placed above the wall following construction where n equals 5. 5. Repairing erosion damage above the wall where n equals 11. 6. Our D O T does not perform proactive measures where n equals 17. 7. Other, where n equals 4. The vertical axis shows the percentage from 0 to 100 in increments of 20 and represents the percentage of M S E wall repairs that use the various repair methods. The total number of respondent D O Tees was 30. The whisker plot shows the variation in percentage of each repair type within the respondant group. Median use of various repair methods was as follows: 1, 25; 2, 30; 3, 10; 4, 20; 5, 20; 6, 100; 7, 70.
Figure 9. Proportion of proactive measures employed by respondent agencies to rehabilitate an MSE wall outside of the MSE wall footprint. Plot contains explanatory annotations (Question 20).
Suggested Citation: "3 State of the Practice." National Academies of Sciences, Engineering, and Medicine. 2025. Asset Management Practices for Mechanically Stabilized Earth Walls. Washington, DC: The National Academies Press. doi: 10.17226/29115.
A bar graph summarizes the repair options inside the M S E wall footprint respondants selected as most cost-effective. The number of D O Tees selected various options as Most effective, Second most effective, and Third most effective. Selections are clustered from left to right. Each group consists of six bars as follows: Bar 1: Erosion/scour repair below the wall. Bar 2: Drainage improvements to direct water away from wall. Bar 3: Removing material deposited by landslide or erosion above wall. Bar 4: Removing fill placed above the wall following construction. Bar 5: Repairing erosion damage above the wall. Bar 6: Our D O T does not perform proactive measures. The vertical axis shows the percentage from 0 to 100 in increments of 20. The total number of respondent D O Tees was 25. The repair most frequently selected as most cost effective was drainage improvements to direct water away from the wall. The repair most frequently selected as the second most cost effectuve was repairing erosion damage above the wall. The repair most frequently selected as third most cost effective was erosion or scour repair behind the wall. The data given in the graph in the order of bars 1 to 6 are as follows: Most effective: 6, 57, 5, 0, 5, 27. Second most effective: 19, 17, 0, 6, 41, 19. Third most effective: 26, 6, 20.5, 6, 18, 26.
Figure 10. Cost-effectiveness of proactive rehabilitation measures inside of the MSE wall footprint (Table 2) by percentage of respondents selecting each measure (Question 21).

When planning for MSE wall maintenance or rehabilitation, 3 respondents (9%) reported that their DOT has a programmatic budget set aside for wall maintenance or rehabilitation. When asked if their DOT had a program or guidance for the replacement or rehabilitation of older MSE walls to align them with modern design standards, 34 respondents (97%) stated that no such guidance existed in their DOT. The standard guidance for MSE wall repair and rehabilitation shared by Ohio DOT is provided in Appendix C of the Contractor’s Final Report. This appendix is not included herein but is available on the National Academies Press website (nap.nationalacademies.org) by searching for “NCHRP Synthesis Report 644: Asset Management Practices for Mechanically

The horizontal axis of the whisker plot shows numbers from 1 to 12 corresponding to the response options. Not all D O Tees utilize all repair methods, so n refers to the number of respondant D O Tees who explicity mention using this method. Data is as follows: 1. Revegetation of wall face for wrapped facing where n equals 3. 2. Removal of trees or large woody vegetation from wall face or at top of the wall where n equals 12. 3. Repair of damaged/corroded/spalled concrete where n equals 13. 4. Replacement of missing or damaged facing elements where n equals 12. 5. Restoration of joint seals around displaced panels where n equals 9. 6. Filling voids behind the wall facing where n equals 12. 7. Clearing drainage channels within wall where n equals 6. 8 Installation of additional drainage outlets into wall where n equals 4. 9. Installation of structural reinforcement where n equals 7. 10. Treatment to prevent loss of backfill or damage to facing elements where n equals 7. 11. Encapsulate existing M S E wall in a new wall where n equals 1. 12. Our D O T does not perform proactive measures where n equals 13. 13. Other where n equals 3. The vertical axis shows the percentage from 0 to 100 in increments of 20. The total number of respondent D O Tees was 30. The median use of the various practive measures reported by D O Tees are as follows: 1, 20; 2, 15; 3, 17; 4, 15; 5, 20; 6, 20; 7, 10; 8, 8; 9, 10; 10, 10; 11, 10; 12, 100; 13, 100.
Figure 11. Distribution of proactive measures employed by respondent DOTs to rehabilitate an MSE wall inside of the MSE wall footprint (Question 22). See annotations in Figure 9 for guidance on how to interpret a whisker plot.
Suggested Citation: "3 State of the Practice." National Academies of Sciences, Engineering, and Medicine. 2025. Asset Management Practices for Mechanically Stabilized Earth Walls. Washington, DC: The National Academies Press. doi: 10.17226/29115.
A bar graph summarizes the repair options outside the M S E wall footprint respondants selected as most cost-effective. The number of D O Tees selected various options as Most effective, Second most effective, and Third most effective are clustered from left to right. Each group consists of 12 bars as follows: Bar 1: Removal of trees or large woody vegetation from the wall face or at top of wall. Bar 2: Repair of damaged/corroded/spalled concrete. Bar 3: Replacement of missing or damaged facing elements. Bar 4: Restoration of joint seals around displaced panels. Bar 5: Filling voids behind wall facing. Bar 6: Clearing drainage channels within wall. Bar 7: Installation of additional drainage outlets into wall. Bar 8: Installation of structural reinforcement. Bar 9: Treatment to prevent loss of backfill or damage to face elements. Bar 10: Encapsulate existing M S E wall in a new wall. Bar 11: Our D O T does not perform proactive measures. Bar 12: Other. The vertical axis shows the percentage from 0 to 100 in increments of 20. The total number of respondent D O Tees was 25. The repair most frequently selected as most cost effective was removal of trees or large woody vegetation from wall face or top of wall. The repair most frequently selected as the second most cost effectuve was filling of voids behind wall facing. The repair most frequently selected as third most cost effective was also filling voids behing wall facing.
Figure 12. Cost-effectiveness of proactive rehabilitation measures employed outside of the MSE wall footprint (Table 2) by percentage of respondents selecting each measure (Question 23).

Stabilized Earth Walls.” No programs or guidance to replace MSE walls at the end of their design life were identified in this survey.

Incorporation of Condition and Risk into Project Prioritization

DOTs with retaining wall asset management programs were asked to provide more information on how their DOTs defined malfunction and failure of MSE walls, determined wall condition and risk of failure, and how such information was incorporated into project prioritization. Ten respondents (23%) completed this portion of the survey.

When defining malfunction of MSE wall assets, deformation of facing, damage to facing materials, and loss of backfill were the most common performance indicators used by DOTs (Figure 13). Survey respondents used changes in wall alignment to define MSE malfunction as

A bar graph shows the percentage of respondant D O Tees using various performance indicators to define malfunction of an M S E wall. Respondants were allowed to select multiple options. From left to right: 9 out of 10 respondents use deformation of facing, damage to facing materials, or loss of backfill as performance indicators when defining the malfunction of a M S E wall. 8 out of 10 respondents use a change in wall alignment post-construction as a performance indicator. 7 out of 10 respondents use degradation of wall foundation as a performance indicator. 6 out of 10 respondents use pavement distress above the wall, 5 out of 10 respondents use another indicator. 4 out of 10 respondents use degradation of buried reinforcement as a performance indicator.
Figure 13. Percentage of performance indicators used by respondents to define malfunction of an MSE wall (Question 25).
Suggested Citation: "3 State of the Practice." National Academies of Sciences, Engineering, and Medicine. 2025. Asset Management Practices for Mechanically Stabilized Earth Walls. Washington, DC: The National Academies Press. doi: 10.17226/29115.
A bar graph shows the various performance indicators used by respondant D O Tees to define service failure of an M S E wall. Respondants were allowed to select multiple options. From left to right: 9 out of the 10 respondents uses impact on traffic as a performance indicator to define service failure of an M S E wall while 8 out of 10 use excessive loss of retained material from behind the wall as a performance indicator. 7 out of 10 respondents use pavement distress or failure above the wall while 6 out of 10 use the impact beyond D O T ROW. 4 out of 10 respondents used another performance indicator.
Figure 14. Percentage of performance indicators used by respondents to define service failure of an MSE wall (Question 26).

well, but the absence of this indicator from the top three may reflect the tolerance of MSE walls to post-construction deformation.

In addition to gathering information on how DOTs define MSE wall malfunction, respondents were asked how their DOTs defined service failure (Figure 14). An impact on traffic was the most common metric used to define failure by 9 out of 10 respondents (90%). The respondents who selected “Other” clarified that their DOTs do not have a formal definition of service failure, but that all the metrics listed would require a DOT response.

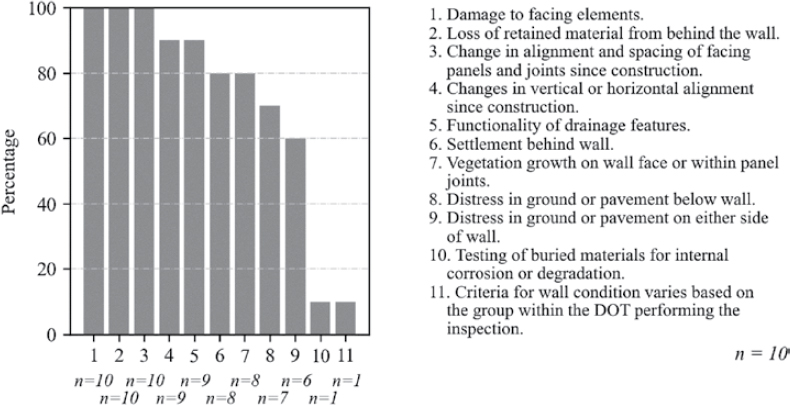
The survey gathered information on how DOTs determine wall condition (Figure 15). All responding DOTs use damage to facing elements, loss of backfill, and change in alignment to describe wall condition. The only inspection item used by less than 6 of 10 (60%) of respondents was testing of buried materials for internal corrosion or degradation (10%, or 1). Criteria for determining wall condition also varied between DOT inspection groups for Louisiana DOT.

In an asset management program, the condition of individual inspection items is compiled into an overall asset condition descriptor. When asked what descriptor was used to describe wall condition, seven DOTs (70%) reported using condition score or category (e.g., 0 to 100, or Good/-

A bar graph shows the various inspection items respondant D O Tees use to determine M S E wall condition. Respondants were allowed to select multiple options. From left to right: All 10 of the respondents use damage to facing elements, loss of retained material from behind the wall, and change in alignment and spacing of facing panels and joints since construction to determine the condition of an M S E wall. 9 out of the 10 respondents use changes in vertical or horizontal alignment since construction and functionality of drainage features to determine the condition of an M S E wall. 8 of the 10 respondents use settlement behind wall and vegetation growth on wall face or within panel joints to determine the condition of an M S E wall. 7 of the 10 respondents use distress in the ground or pavement below the wall to determine the condition of an M S E wall. 6 out of 10 respondents use distress in-ground or pavement on either side of the wall. 1 out of the 10 respondents uses testing of buried materials for internal corrosion or degradation to determine the condition of an M S E wall. The last bar shows that 1 out of the 10 respondents indicated that criteria for wall condition varies based on the group within the D O T performing the inspection.
Figure 15. Percentage of factors or inspection items used by respondents to determine condition of an MSE wall (Question 28).
Suggested Citation: "3 State of the Practice." National Academies of Sciences, Engineering, and Medicine. 2025. Asset Management Practices for Mechanically Stabilized Earth Walls. Washington, DC: The National Academies Press. doi: 10.17226/29115.

Fair/Poor), while Louisiana DOTD uses qualitative risk, Maine DOT uses qualitative hazard, and Oregon DOT uses a numerical score like the Rockfall Hazard Rating System (RHRS) scoring.

When comparing MSE walls to prioritize spending, three respondents (30%) rank walls using overall condition, one DOT uses likelihood of failure, and three (30%) do not have a formal method for prioritizing wall repairs. The three respondents who selected “Other” use a combination of condition and consequence to prioritize walls.

Decision support tools in asset management programs help the DOT allocate limited funds and improve transparency around project selection. Informal decision support tools are typically used, based on the survey responses. However, four respondents (40%) are formalizing previously informal guidelines. Within these informal tools, three respondents (30%) use a risk-based selection process, two (20%) have a target wall condition for their inventory, two (20%) use a combination of roadway functional classification and target wall condition, and one DOT uses the estimated impact of failure.

Determination of Deterioration and Life-Cycle Costs

In a mature asset management program, costs associated with building, maintaining, and rehabilitating an asset are all tracked by the DOT. Using such data, agencies can develop programmatic deterioration rates and life-cycle costs for a given asset type. These rates and costs are used to forecast the effect of current budget expenditures and to estimate future budget needs. Long-term performance data can also be used to help improve asset design and future performance.

Of the 10 DOTs that answered Questions 25 through 34 about their retaining wall asset management programs, this survey found that MSE wall construction costs and inspection costs are the most common ownership costs tracked (6 out of 10 DOTs). No respondent tracked rehabilitation costs specifically by type of wall repaired (Figure 16). Half (5 out of 10) incorporate long-term deterioration into MSE wall design by applying experience gained from previous failures and from long-term deterioration of existing assets (Figure 17).

Minnesota DOT reported they have developed a life-cycle cost for a generic retaining wall asset. Other respondents (9 out of 10) reported they have not collected sufficient data for a

A bar graph shows the percentage of respondant D O Tees tracking various ownership costs assocated with M S E walls. Respondants were allowed to select multiple options. From left to right: 6 out of 10 respondents track construction costs; 3 out of 10 respondents track inspection costs (either in-house or contracted); 1 of the 10 respondents tracks repair costs by wall type; 1 of the 10 respondents tracks maintenance costs by wall type; None of the 10 respondents tracsk rehabilitation costs by wall type; 2 out of 10 respondents indicated that none of the above are tracked by our D O T for retaining wall assets.
Figure 16. Percentage of ownership costs associated with retaining walls tracked by respondents (Question 32).
Suggested Citation: "3 State of the Practice." National Academies of Sciences, Engineering, and Medicine. 2025. Asset Management Practices for Mechanically Stabilized Earth Walls. Washington, DC: The National Academies Press. doi: 10.17226/29115.
A bar graph shows the various long-term M S E deterioration factors respodant D O Tees incorporate into current design and construciton practices. Respondants were allowed to select multiple options. From left to right: 6 out of 10 respondents indicated they incorporate lessons learned from failures to increase the design life of new walls; 3 out of 10 respondents incorporate lessons learned from long-term deterioration to update construction methods; 1 out of 10 respondents develops agency benefit factors to help prioritize current mitigation projects; No respondents use improved cost-benefit analysis for project prioritization; 1 out of 10 respondents had another approach from any named in the survey; and 2 out of 10 respondents say they do not currently have a method to factor long-term deterioration into current design and construction.
Figure 17. Percentage of long-term MSE deterioration factors incorporated into current design and construction practices (Question 33).

retaining wall life-cycle cost analysis. No life-cycle costs specific to MSE wall assets were identified by survey respondents.

Key Findings from the Survey Questionnaire

The 44 DOTs that responded to the survey, either in full or in part, provided a valuable overview of the current state of the practice in asset management of MSE retaining walls. Half of survey respondents state that their department has a retaining wall inventory. The survey responses reflect a range of methods being used to maintain these assets and manage the associated data. The variation among respondents reflects the absence of a national mandate to include retaining walls in transportation asset management programs.

Key findings from the state of the practice survey are summarized in Table 3. The table sections reflect the divisions within the state of the practice survey. Responses to specific questions are not discussed in this table. Because not all responding DOTs answered all questions, specific percentages are not included in the table.

Suggested Citation: "3 State of the Practice." National Academies of Sciences, Engineering, and Medicine. 2025. Asset Management Practices for Mechanically Stabilized Earth Walls. Washington, DC: The National Academies Press. doi: 10.17226/29115.

Table 3. Summary of key findings from responses to the State of the Practice Questionnaire.

Survey Section Key Findings
Retaining Wall Management Practices
  • The respondents’ inventories include complete, partial, estimate-based, and none.
  • The majority of inventories are less than 10 years old.
  • The majority of respondent DOTs do not track the standards used to design specific MSE walls.
Inventory and Assessment Practices
  • The Bridge or Geotechnical groups are the most likely to be responsible for managing a DOT’s wall inventory.
  • There is no single data management system being used by most respondents to handle MSE walls.
  • There is limited variation among DOTs on the types of wall distress collected for MSE assets.
Maintenance and Rehabilitation Methods
  • Roughly half of respondent DOTs have performed proactive repairs either inside or outside the MSE wall footprint.
  • Outside the wall footprint, drainage improvements were most frequently identified as the most cost-effective repair by respondent DOTs.
  • Within the wall footprint, no single rehabilitation method was described as the most cost-effective.
  • A programmatic maintenance or rehabilitation budget for MSE walls is not typical for respondent DOTs.
Determination of Wall Condition and Project Prioritization
  • The components used to determine a wall’s condition are most frequently components that can be observed using non-destructive methods.
  • The most common metric for service failure is impact on traffic.
  • Based on the survey responses, there is no standard method for prioritizing wall rehabilitation.
Methods for Determining Deterioration Rates and Life-Cycle Costs
  • MSE construction and inspections costs are the most common costs tracked by respondent DOTs.
  • MSE-specific rehabilitation and life-cycle costs have not been developed by respondent DOTs.
Suggested Citation: "3 State of the Practice." National Academies of Sciences, Engineering, and Medicine. 2025. Asset Management Practices for Mechanically Stabilized Earth Walls. Washington, DC: The National Academies Press. doi: 10.17226/29115.
Page 11
Suggested Citation: "3 State of the Practice." National Academies of Sciences, Engineering, and Medicine. 2025. Asset Management Practices for Mechanically Stabilized Earth Walls. Washington, DC: The National Academies Press. doi: 10.17226/29115.
Page 12
Suggested Citation: "3 State of the Practice." National Academies of Sciences, Engineering, and Medicine. 2025. Asset Management Practices for Mechanically Stabilized Earth Walls. Washington, DC: The National Academies Press. doi: 10.17226/29115.
Page 13
Suggested Citation: "3 State of the Practice." National Academies of Sciences, Engineering, and Medicine. 2025. Asset Management Practices for Mechanically Stabilized Earth Walls. Washington, DC: The National Academies Press. doi: 10.17226/29115.
Page 14
Suggested Citation: "3 State of the Practice." National Academies of Sciences, Engineering, and Medicine. 2025. Asset Management Practices for Mechanically Stabilized Earth Walls. Washington, DC: The National Academies Press. doi: 10.17226/29115.
Page 15
Suggested Citation: "3 State of the Practice." National Academies of Sciences, Engineering, and Medicine. 2025. Asset Management Practices for Mechanically Stabilized Earth Walls. Washington, DC: The National Academies Press. doi: 10.17226/29115.
Page 16
Suggested Citation: "3 State of the Practice." National Academies of Sciences, Engineering, and Medicine. 2025. Asset Management Practices for Mechanically Stabilized Earth Walls. Washington, DC: The National Academies Press. doi: 10.17226/29115.
Page 17
Suggested Citation: "3 State of the Practice." National Academies of Sciences, Engineering, and Medicine. 2025. Asset Management Practices for Mechanically Stabilized Earth Walls. Washington, DC: The National Academies Press. doi: 10.17226/29115.
Page 18
Suggested Citation: "3 State of the Practice." National Academies of Sciences, Engineering, and Medicine. 2025. Asset Management Practices for Mechanically Stabilized Earth Walls. Washington, DC: The National Academies Press. doi: 10.17226/29115.
Page 19
Suggested Citation: "3 State of the Practice." National Academies of Sciences, Engineering, and Medicine. 2025. Asset Management Practices for Mechanically Stabilized Earth Walls. Washington, DC: The National Academies Press. doi: 10.17226/29115.
Page 20
Suggested Citation: "3 State of the Practice." National Academies of Sciences, Engineering, and Medicine. 2025. Asset Management Practices for Mechanically Stabilized Earth Walls. Washington, DC: The National Academies Press. doi: 10.17226/29115.
Page 21
Suggested Citation: "3 State of the Practice." National Academies of Sciences, Engineering, and Medicine. 2025. Asset Management Practices for Mechanically Stabilized Earth Walls. Washington, DC: The National Academies Press. doi: 10.17226/29115.
Page 22
Next Chapter: 4 Case Examples
Subscribe to Email from the National Academies
Keep up with all of the activities, publications, and events by subscribing to free updates by email.