Leveraging Artificial Intelligence and Big Data to Enhance Safety Analysis: A Guide (2025)
Chapter: 4 Applying AI, ML, and Big Data to Safety Analysis

CHAPTER 4
Applying AI, ML, and Big Data to Safety Analysis
This chapter introduces the application of ML algorithms and analysis of big data through pilot studies that served as a proof of concept for two applications, as described below. These two pilot studies were supported by public agencies—ODOT and the City of Bellevue, WA—to solicit ideas and identify opportunities in their operations. Based on the results of the pilot studies, the research team developed suggestions for the wider application and implementation of the framework. Following the goals and described approach, the research team: (1) summarized the developed models and frameworks from previous research tasks, (2) confirmed input data needs of these ML models, (3) solicited pilot project partners and confirmed their research needs, and (4) conducted pilot studies with pilot project partners.
Case Study #1: Capturing New Data with ML, ODOT
ODOT develops programs related to Oregonʼs system of highways, roads, and bridges; railways; public transportation services; transportation safety programs; driver and vehicle licensing; and motor carrier regulation. Its stated mission is to “provide a safe and reliable multimodal transportation system that connects people and helps Oregonʼs communities and economy thrive” (ODOT n.d.). ODOT operates and maintains approximately 8,000 miles of roadway and 2,700 bridges.
The ODOT pilot project findings are critical as the state continues to seek multiple datasets to develop robust risk prediction models for safety. In 2023, members of this projectʼs research team led the development of the Oregon Vulnerable Road Users Safety Assessment. During that study, limiting factors in ODOTʼs available data were identified, including certain segments of the network on non-state or rural routes that lacked key inventory attributes. This made the desired risk-based analysis using roadway inventory as a factor more difficult. Improving the stateʼs roadway inventory was identified as a significant and real-time need, and after further discussion, the presence of overhead street lighting (which ODOT and the research team used as a risk factor in the Vulnerable Road Users Safety Assessment) was identified as a high-value need. ODOT currently has an inventory of luminaires (i.e., lighting fixtures) for state highways in ODOT Region 1 (an area that includes Portland and the surrounding suburban areas) but no inventory for other regions or local roads. This provided the research team with an ideal case to test ML against ground truth (in Region 1) and extrapolate to other ODOT areas, such as Region 2 (which includes 25% of state highway miles), as shown in Figure 2.
Therefore, the goal of the developed tool is to detect streetlight luminaires and record their latitude/longitude coordinates to add to a streetlight luminaire inventory.

Long Description.
The illustration shows the ODOT region map divided into five sections. The map is color-coded and numbered from 1 to 5. The text given in the map is as follows: Region 1: Portland Metro. Region 2: Willamette Valley and North Coast. Region 3: Southwestern Oregon. Region 4: Central Oregon. Region 5: Eastern Oregon.
Brief Description of the Core ML Module
The research team proposes an AI/ML pipeline that ingests raw SVIs and produces coding of iRAP variables related to roadway infrastructure elements. Figures 3 and 4 present two versions of the core ML module. Both versions build upon training a reasonably good semantic segmentation model (SSM) on open-source external data. The model learns to segment the images into different parts and categorize individual pixels. Because the selected external dataset includes detailed annotations for a wide range of roadway infrastructure elements, this SSM will serve as the fundamental step of the workflow to provide input for downstream modules. Once the segmentation model is trained, it will make inferences for downstream tasks and will not be fine-tuned unless the user has similarly annotated image data.
There are two alternatives for utilizing the segmentation model for downstream tasks:
- Task-specific classification model
- The first alternative (see Figure 3) involves a separate loop to train a dedicated classification model on the userʼs specific task. For example, ODOT wanted to detect streetlights in the pilot study, as identified through the research teamʼs meetings with ODOT. In this training loop, task-specific data are fed to the segmentation model to produce semantic maps, and task-related patches are extracted and used for training the task-specific classification model. Note that these extracted patches may not contain any streetlights. The performance of the training and validation is monitored with precision, recall, and the F1 score. The F1 score is a measure of a testʼs accuracy. It is calculated as the harmonic mean of precision and recall. During the training of this classification model, both relevant and irrelevant patches are extracted to establish positive and negative examples in the dataset. During inference, test data are fed to the segmentation model, which produces a semantic map. Then, only relevant patches to the target variable are extracted to feed to the task-specific classification model, producing the expected output class for the variable.
- Zero-shot foundation model
- Instead of training a task-specific classification head, the second alternative (see Figure 4) leverages recent advances in zero-shot foundation models in the computer science domain. This zero-shot function has already been thoroughly trained on extensive image-text pairs by the tech industry. In the research teamʼs proposed pipeline, the zero-shot foundation model ingests extracted patches from the previous step and compares them with user-provided class names. A similarity score is estimated and used to confirm that the predicted class by the SSM matches the text input. The similarity score measures how closely the extracted patch matches the user-provided class names. For example, in this pilot study, this function computed similarities between an extracted patch containing streetlights and a list of class names such as those listed in iRAP protocol (e.g., streetlight, guardrail) and confirmed that the similarity score with “streetlight” is the highest. In practice, the text prompts may be adjusted to provide the zero-shot foundation model with more context (e.g., “an image patch containing a streetlight extracted from a street view image” instead of merely “streetlight”).
Procedure of the Analysis Tool
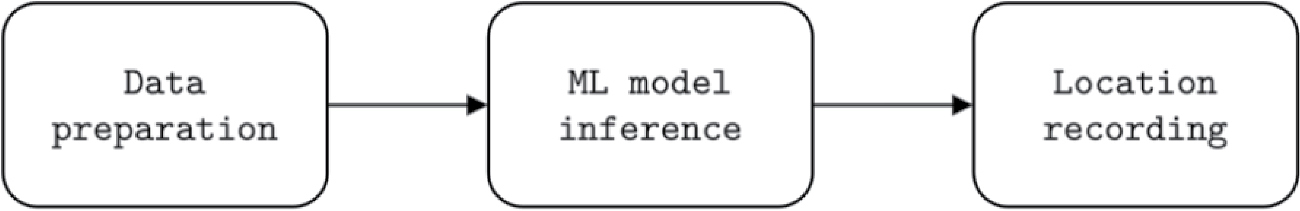
Based on the ML model previously developed, the research team proposed a procedure to assist ODOT in coding its streetlight luminaire inventory. As shown in Figure 5, this procedure consists of three steps: acquire and prepare data, run the ML model, and estimate the latitude/longitude coordinates of the infrastructure instances.
Data Preparation
There are two ways to systematically acquire SVI data. If the agency maintains an active digital record of its highway system (e.g., WSDOTʼs SRweb application and ODOTʼs Digital Video Log),

Long Description.
The flowchart showcases three types of flow represented in different colors as follows: Semantic segmentation training data flow (blue), Specialized M L module training data flow (green), and testing production or data flow (red). The flowchart begins with the Semantic segmentation model. This model takes place with the help of Task-specific labeled data (green), External open-sourced dataset (blue), and Agency test data (red). The segmentation model leads to CE or Dice Loss (mIoU) (blue) which in turn leads to the External open-sourced dataset (blue) thus forming a cyclic process of the Training segmentation model. The segmentation model leads to Predicted semantic maps (red and green). The maps lead to Patch extraction through irrelevant and relevant patches (green) and only relevant patches (red) with the help of segmentation results. Patch extraction leads to the Classification model (red and green) which leads to the Output class meeting the RAP protocol (red). The classification model leads toCE loss (Recall, Precision, F1 score) (green) which leads back to the patch extraction. This forms a cyclic process labeled Training specialized classification module.

Long Description.
The flowchart showcases two types of flow represented in different colors as follows: Semantic segmentation training data flow (blue) and testing production or data flow (red). The flowchart begins with the Semantic segmentation model. This model takes place with the help of an External open-sourced dataset (blue) and Agency test data (red). The segmentation model leads to C E or Dice Loss (mIoU) (blue) which in turn leads to the External open-sourced dataset (blue) thus forming a cyclic process of the Training segmentation model. The segmentation model leads to Predicted semantic maps (red). The maps lead to Patch extraction through only relevant patches (red) with the help of segmentation results. Patch extraction along with Agency test data (Example: List of i RAP classes) together leads to the Zero-shot vision-language model (red). The language model leads to the step 'Confirm i RAP class per patch.'
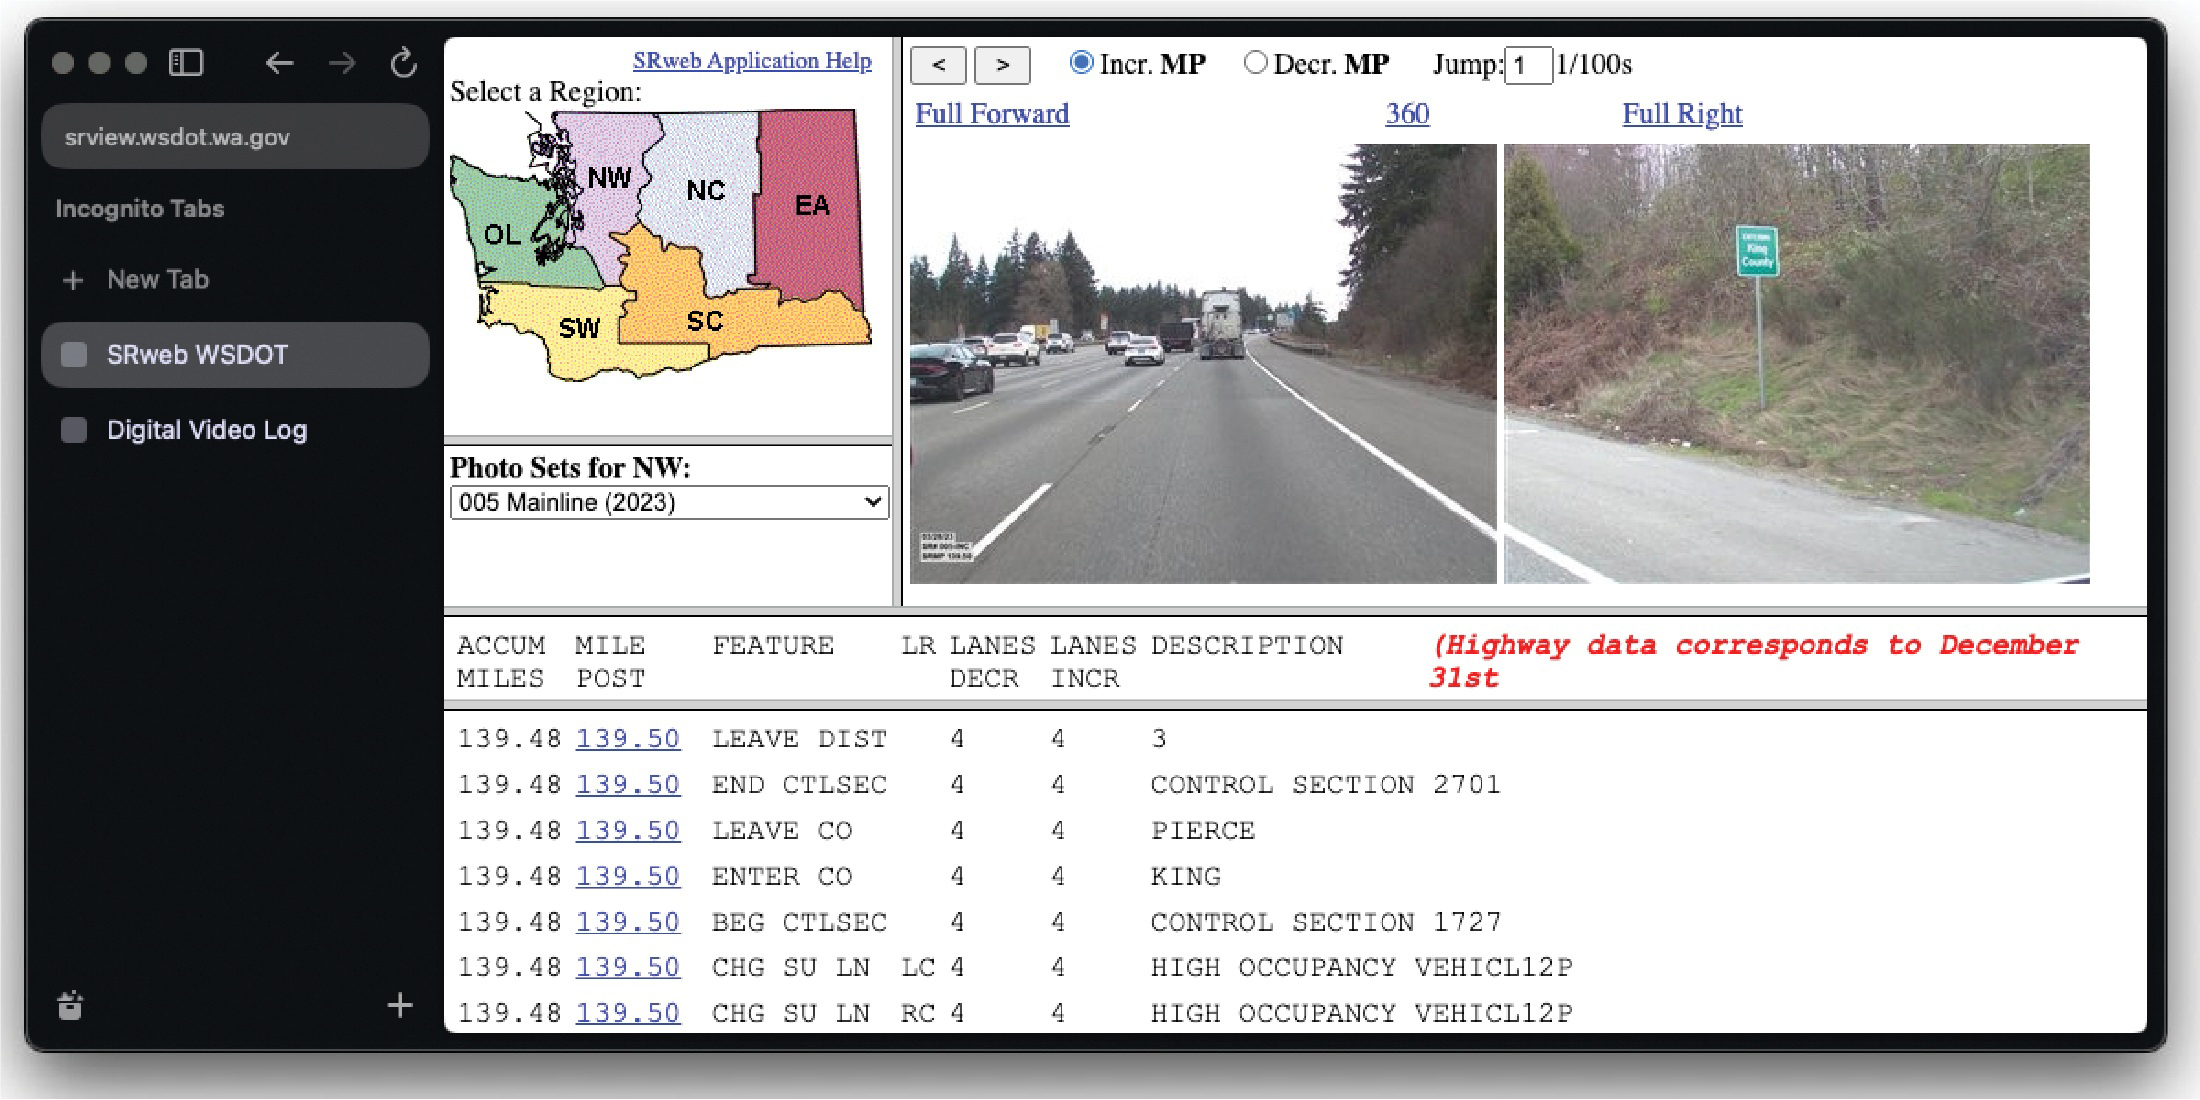
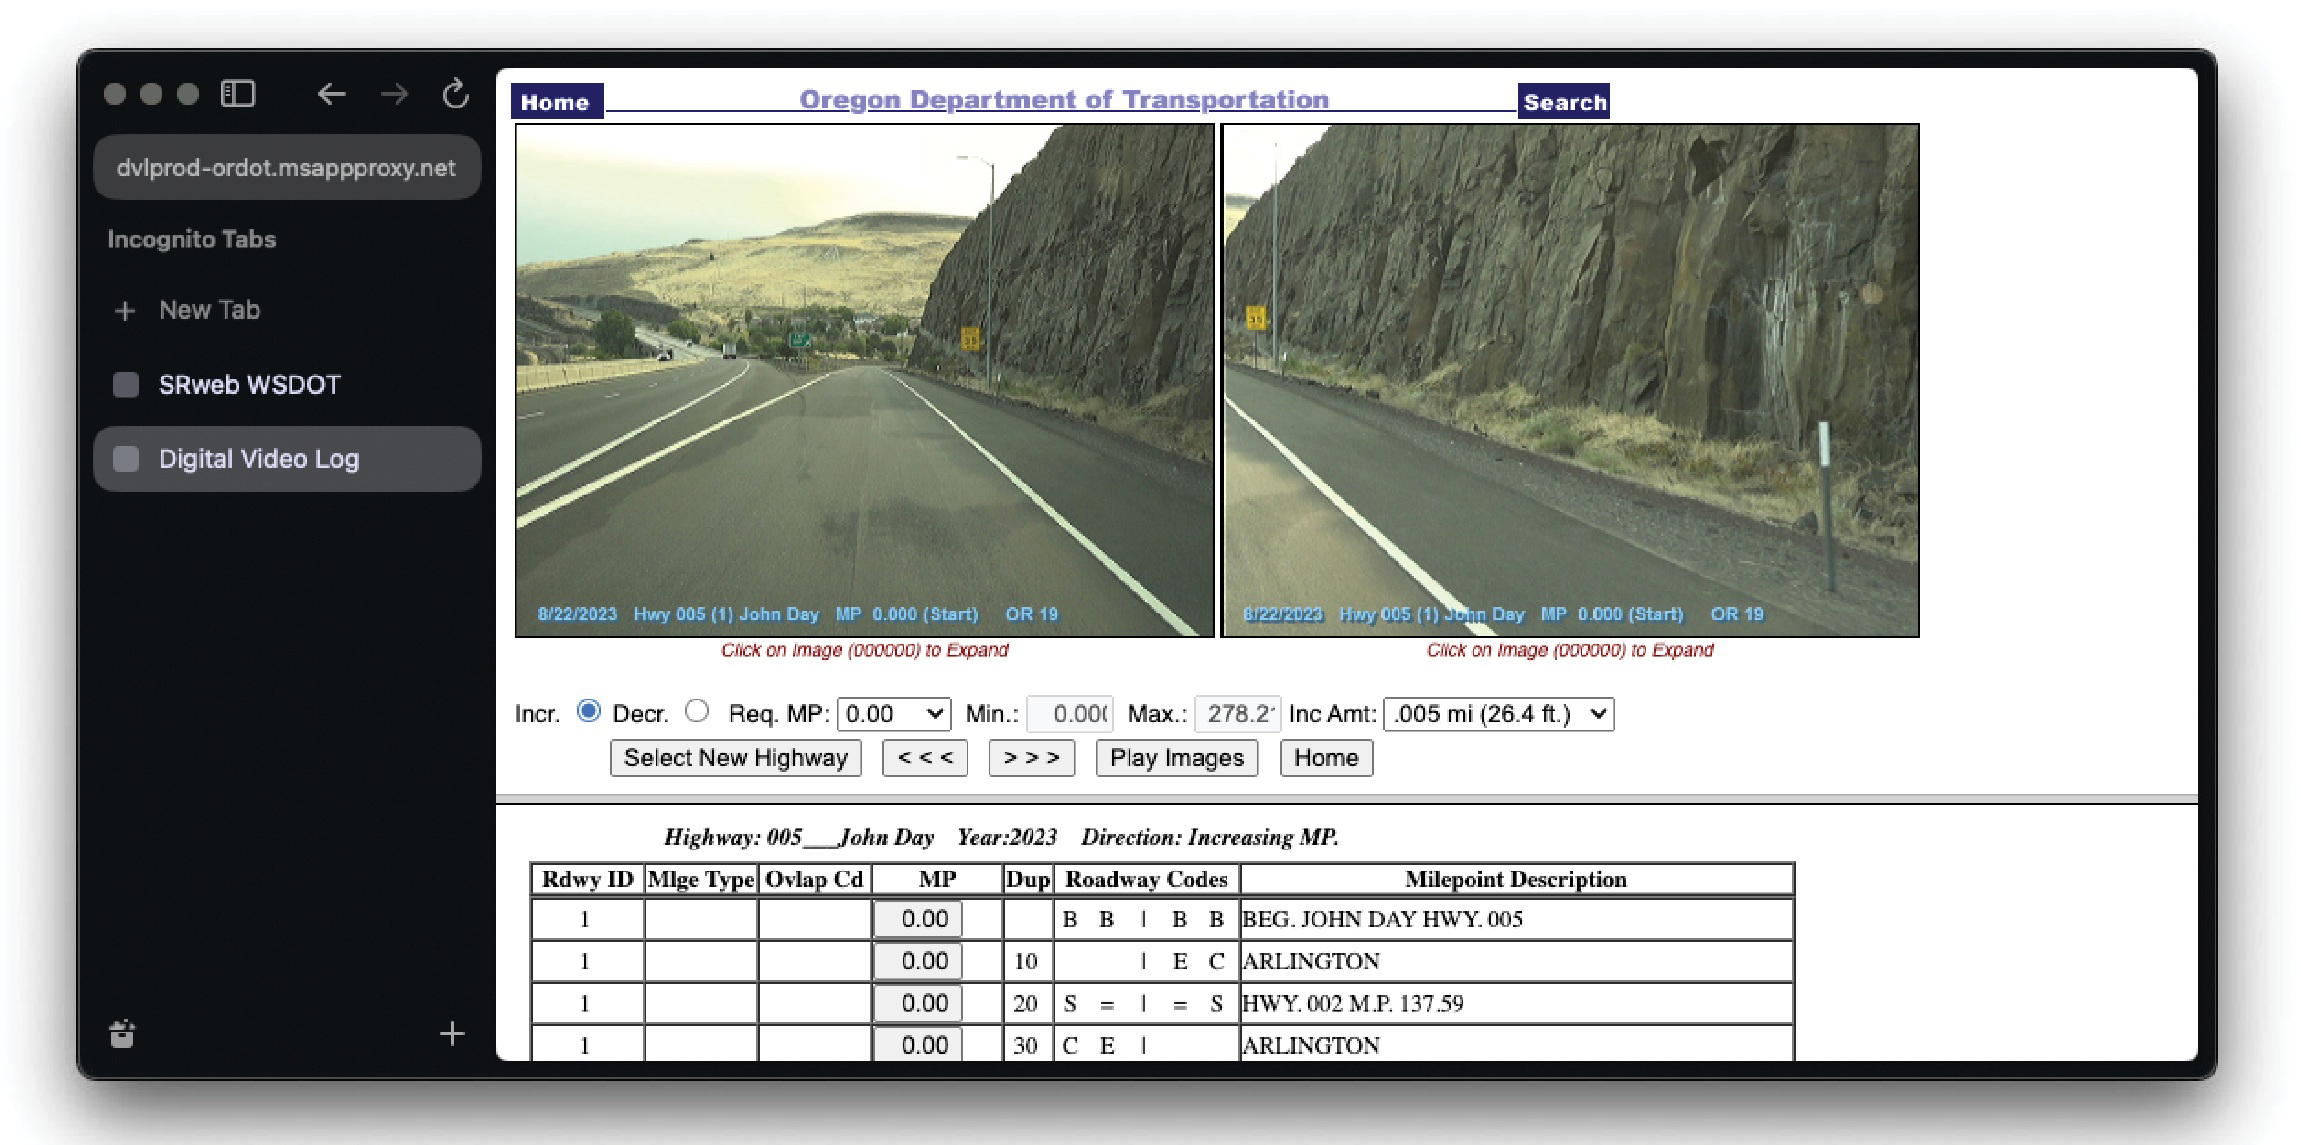
its primary source should target the “full forward” or “forward” views in the system. This is because (1) the maintained digital records have guaranteed quality and do not generate extra cost, and (2) front views are the most reliable and consistent images across platforms. As an example, WSDOTʼs SRweb (Figure 6) and ODOTʼs digital video log (Figure 7) provide different types of images per milepost (i.e., WSDOTʼs SRweb includes a 360-degree panorama in addition to forward and right-side views, while ODOT does not). Some views have different scopes (i.e., angles and the field of view appear to be different between WSDOTʼs right-side view and ODOTʼs), while the front view images are consistent. Choosing front views avoids the distortion problems that right-side views might bring. To download data from these digital records, the user guides need to be followed, which typically involve a series of selections: highway, milepost, driving direction, and finally, the “forward” view image.
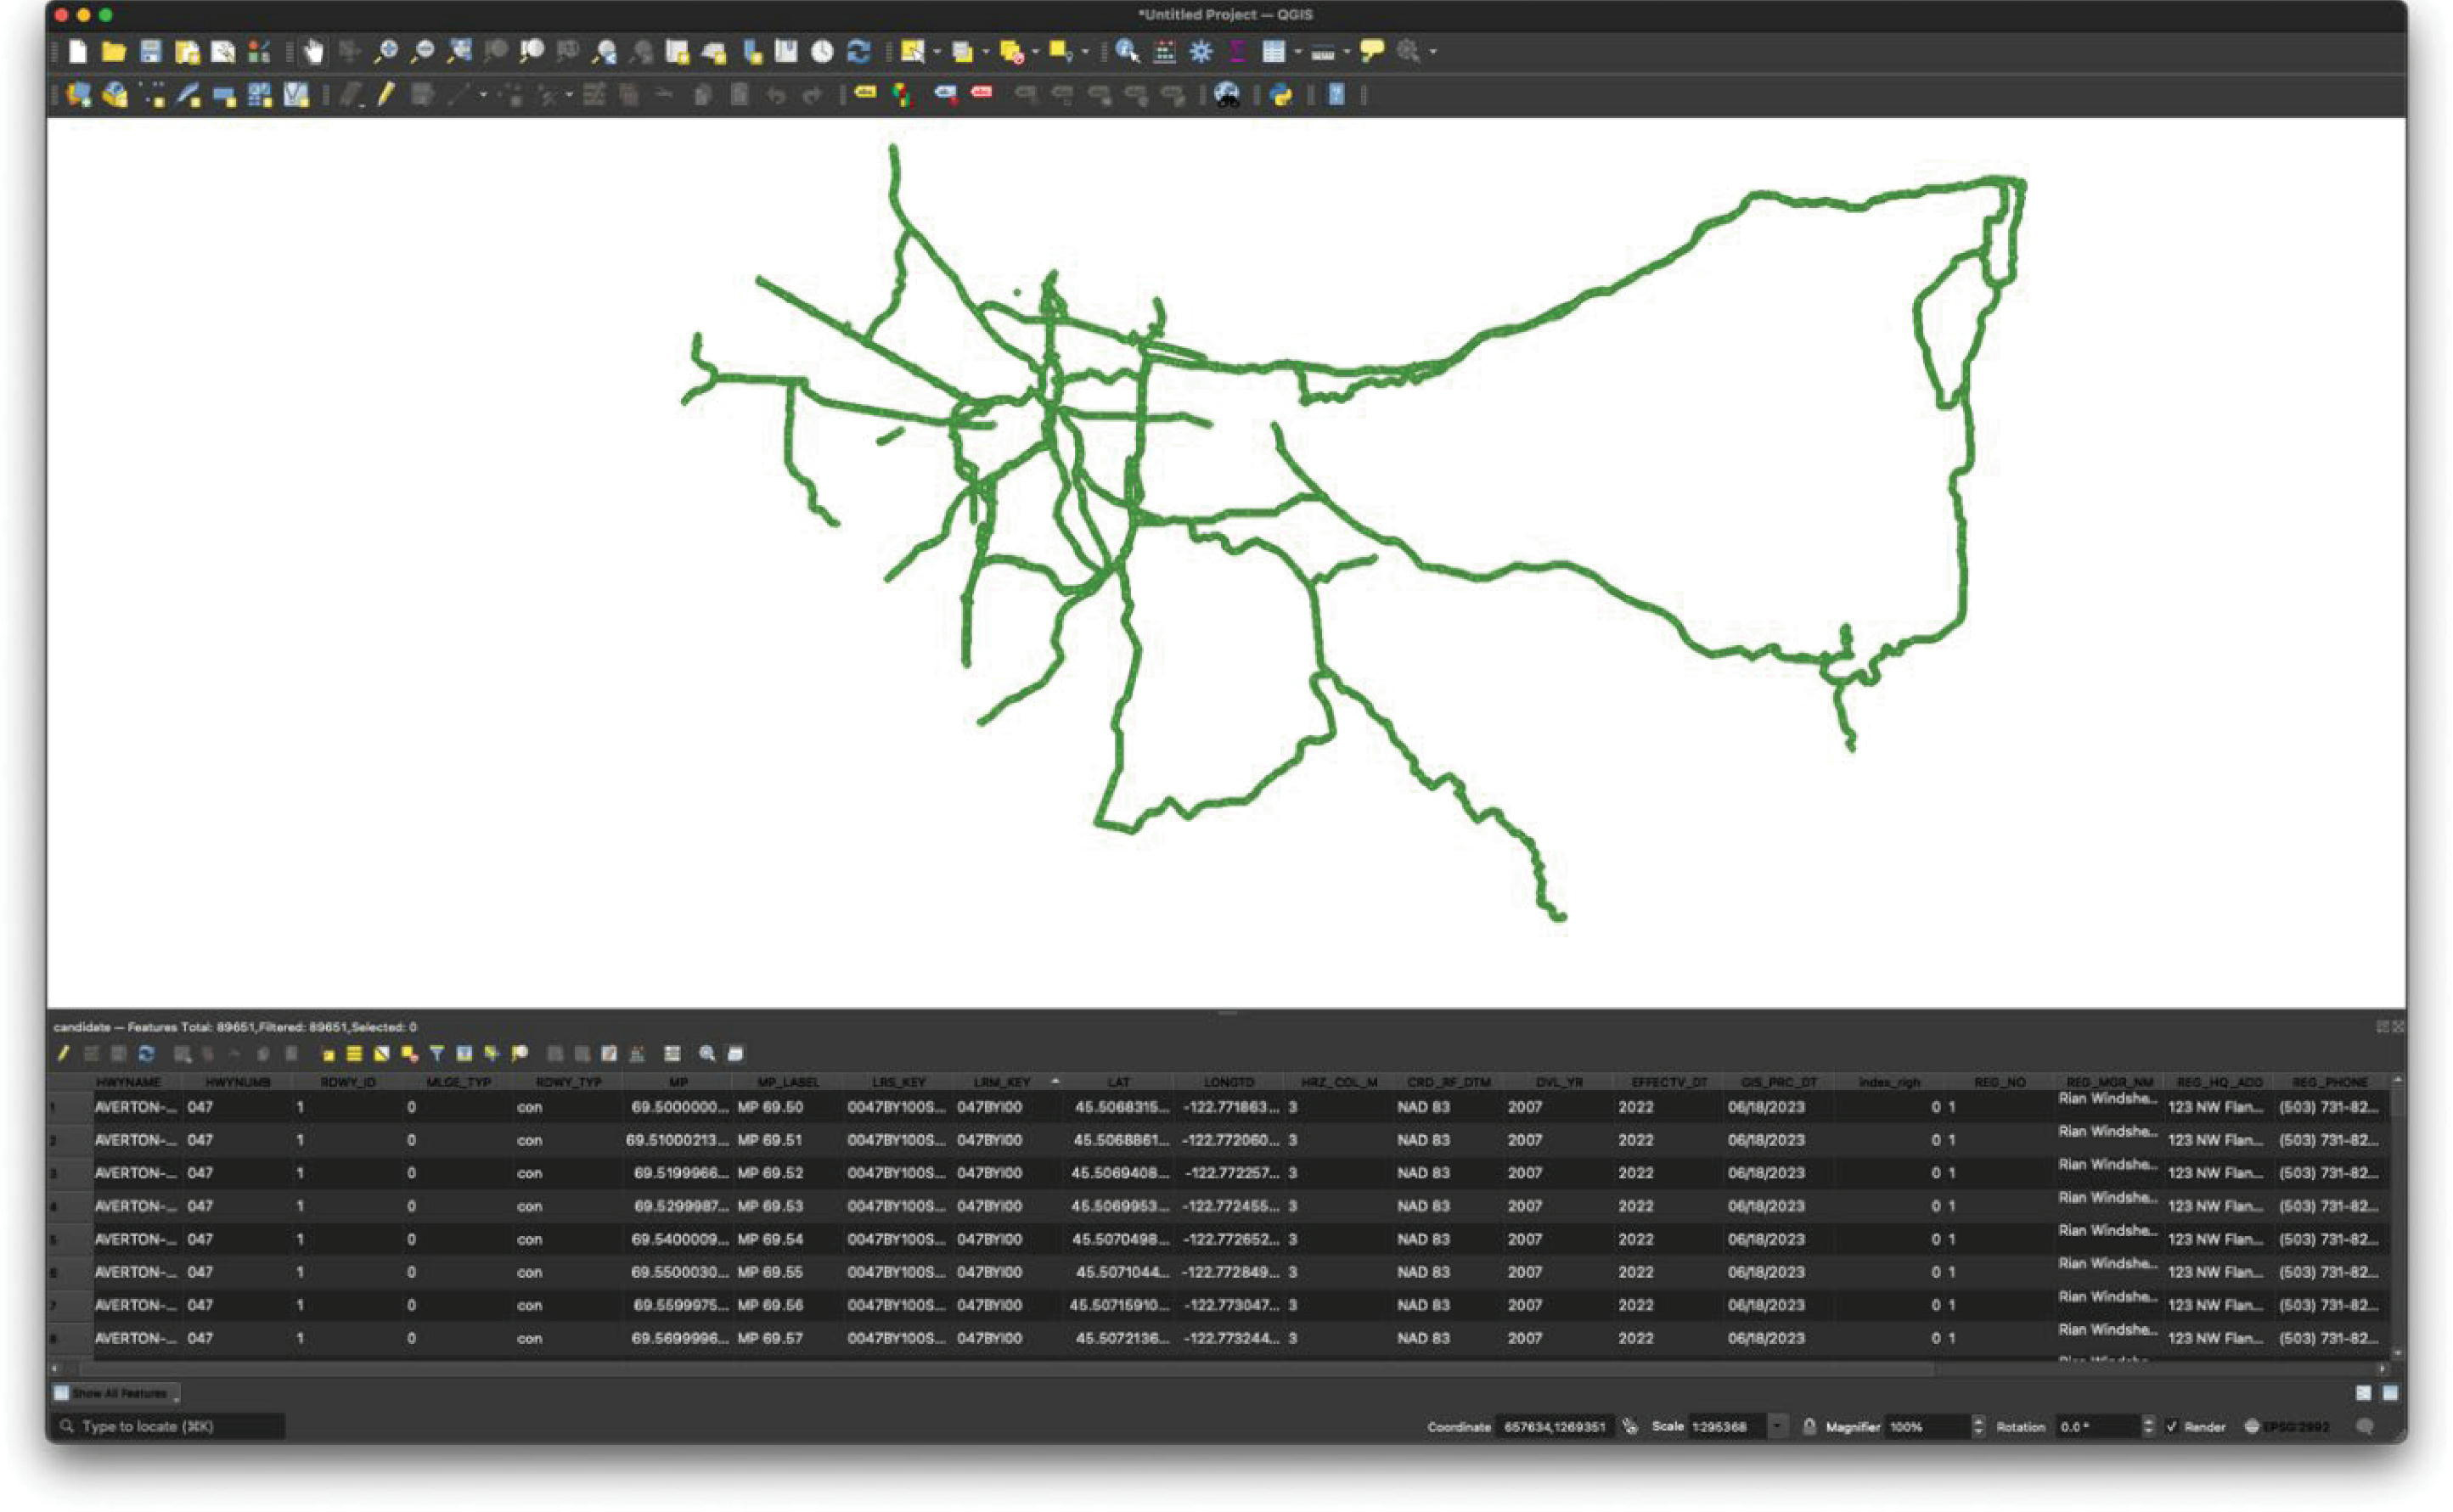
An agency can use a Python script created by the research team if the agency does not maintain an active digital record or is interested in using data from commercial mapping services. Before using the code, the user needs to (1) set up API keys on the corresponding platform (e.g., Google Maps API: https://developers.google.com/maps/documentation/embed/get-api-key), as shown in Figure 8, and (2) prepare a high-resolution roadway network shapefile (see Figure 9). The script reads the shapefile and estimates the driving direction of each point by the nearest upstream and downstream points; functions then pass the latitude/longitude,
Source: WSDOT. State Route Web (SRweb). Retrieved from https://www.srview.wsdot.wa.gov/.
Long Description.
The screenshot shows the results of srview.wsdot.wa.gov in an Incognito search tab. The result shows a map of a place divided into six regions. The six regions are color-coded and named OL, SW, NW, SC, NC, and EA. The photo sets for NW is selected as 005 Malinline (2023). Next to the map are two photos showing the full forward view and full right view of a highway lane. A table below the map and photos showcase the accum miles, milepost, feature, LR lanes decr, lanes incr, and description. The highlighted text reads, 'Highway data corresponds to December 31st.'
Source: ODOT. Digital Video Log. Retrieved from https://dvlprod-ordot.msappproxy.net/cf/dvl/.
Long Description.
The screenshot shows the results of dvlprod-ordot.msappproxy.net in an Incognito search tab. The result shows two photos showing the full forward view and full right view of a highway lane. The photos are titled 'Oregon Department of Transportation.' Both photos read 8/22/2023 Hwy 005 (1) John Day MP 0.000 (Start) OR 19. The option of Incr is selected; MP is 0.00; Min. is 0.000; Max. is 278.2, and Inc Amt is 0.005 mi (26.4 feet). The options of Select New Highway, Reverse, Forward, Play images, and Home are shown. Below these options, a table with data on Roadway ID, milage type, ovlap Cd, MP, Dup, roadway codes, and milepoint description is given.
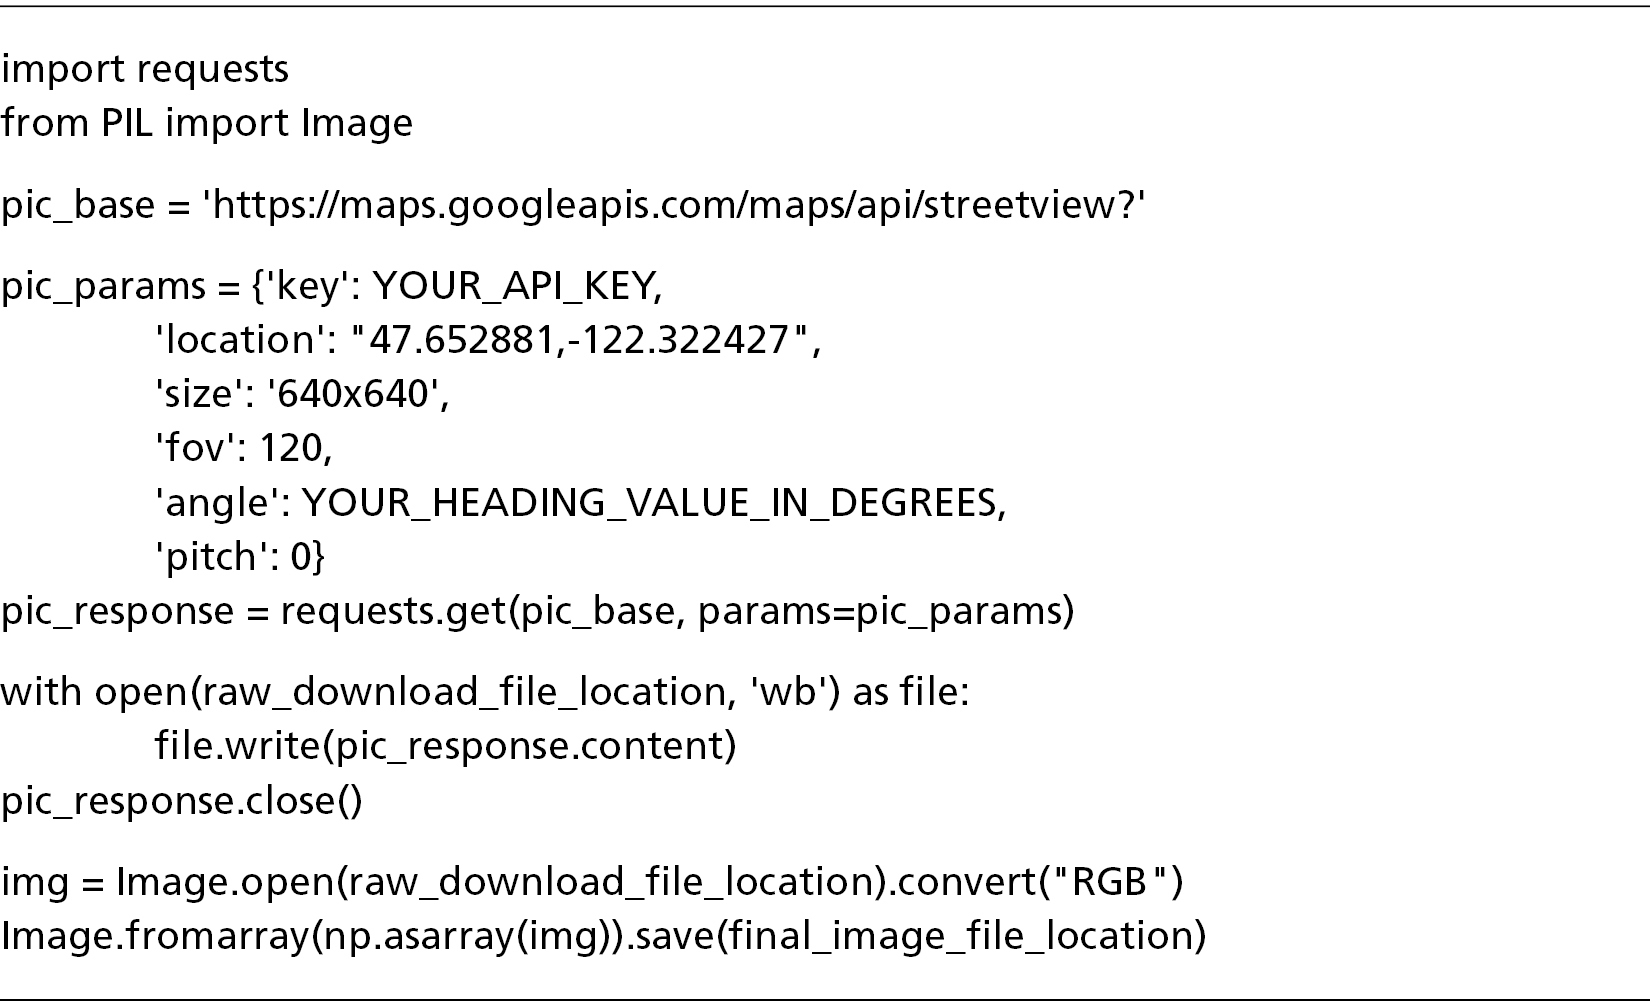
heading (i.e., driving direction), field of view, pitch, angle, and the API key as parameters to Google Maps API. The nearest SVI is downloaded if available. The user can also post-process the downloaded image for quality control. A short code snippet is also provided in Figure 10 to demonstrate a minimum working example of how to download SVI from Google Maps API. Figure 11 displays sample SVIs retrieved for each specified latitude/longitude pair and heading, stored in a local folder.
The requirements of each data element can be summarized as follows: (1) The high-resolution network ideally needs to be 0.01-mile increments or finer. (2) SVI parameters need to follow the example or be chosen based on experience, but the size parameter can be limited by platform (e.g., Google Maps limits to 640x640 pixels maximum).

Long Description.
The flowchart begins with two steps, Set up API key from service provider and Prepare high-resolution highway network shapelife. These steps together lead to the command 'Run script.' This leads to Post-process with the help of downloading SVIs.
Long Description.
The screenshot shows a file named 'Untitled Project - QGIS.' The first two ribbons or headers in the screenshot consist of multiple icons and options. The main display shows a line scribbled irregularly with no pattern. The lines resemble a map or a network. The end of the screenshot shows a table titled 'candidate - Features Total: 89651, Filtered: 89651, Selected: 0.' The table consists of multiple columns with numerical data.
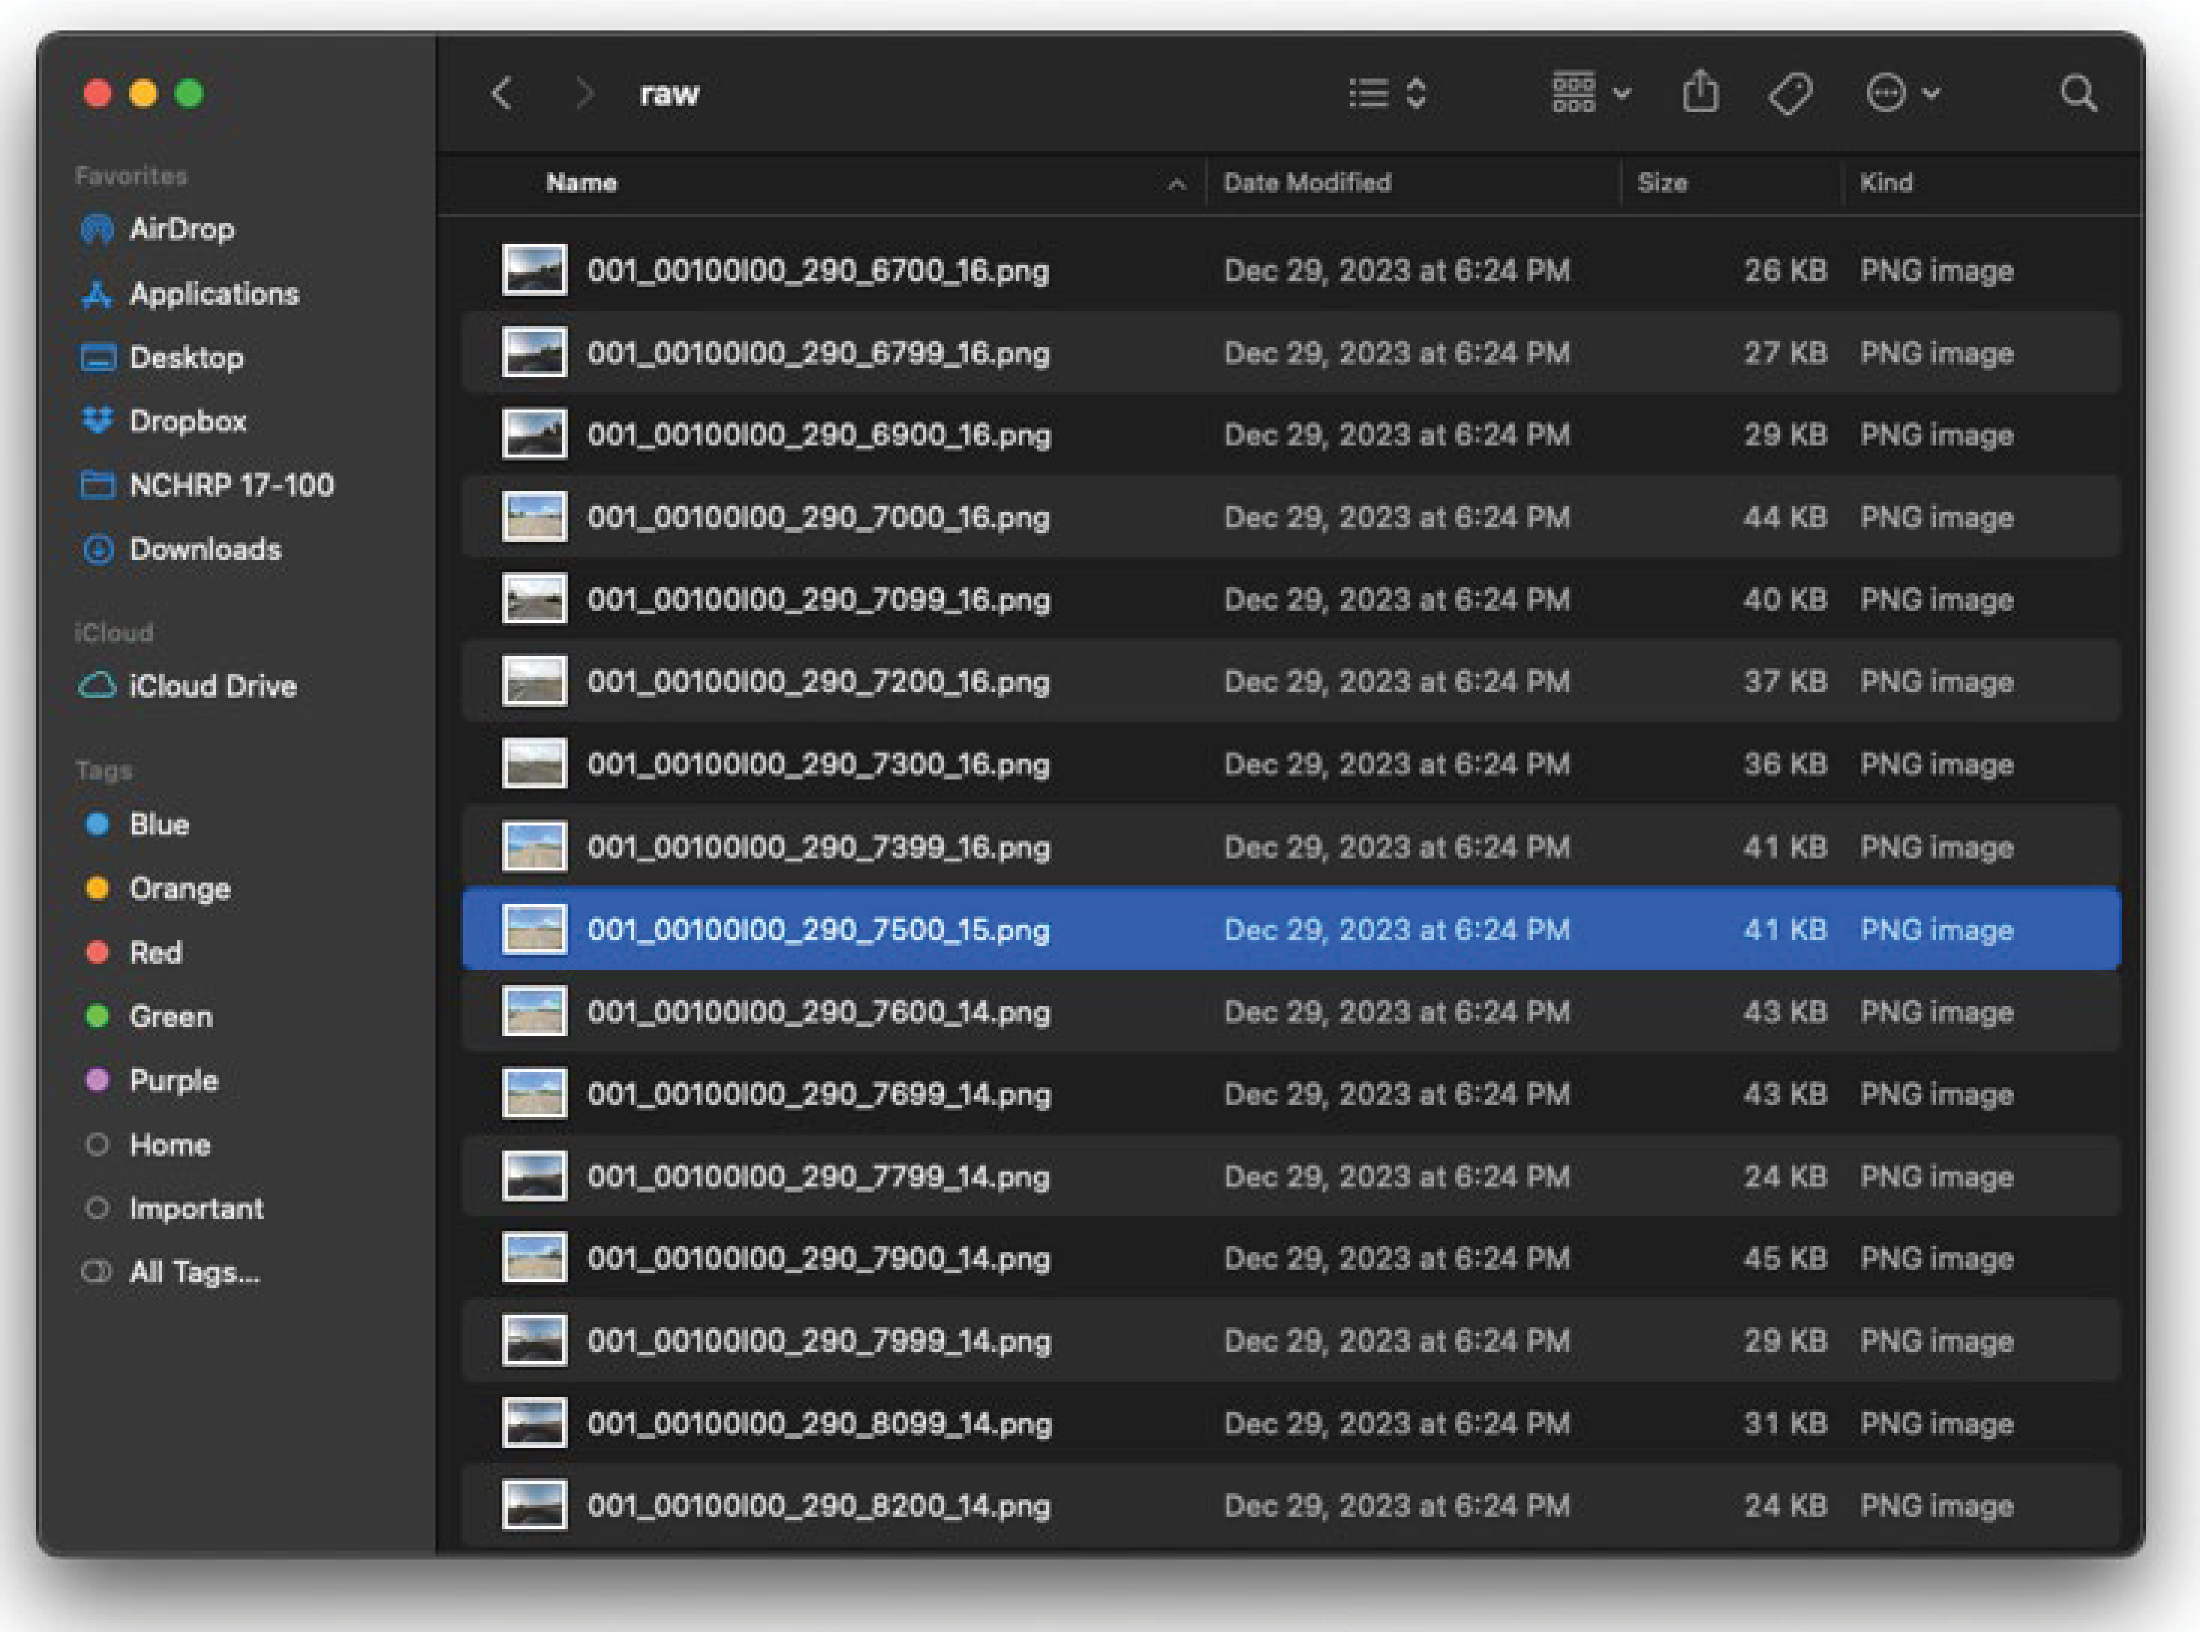
Long Description.
The left section of the screenshot lists options such as Favorites, iCloud, and Tags. The right side of the screenshot begins with a search box on top followed by the view type, share, tag, and other options. The term 'raw' is typed in the search bar and showcases the result. The result shows several photos in the png format. The name of the photos, date modified, size, and kind are listed. The photo named '001_00100I00_290_7500_15.p n g' is selected.
Running ML Script and Recording Location
The ML function leverages MMSegmentation—an open-source, PyTorch-based CV framework—to implement and execute the research teamʼs code, which is shown in Figure 12. The user first needs to follow the instructions to install MMSegmentation: https://mmsegmentation.readthedocs.io/en/latest/get_started.html. In particular, the user needs to understand the computing hardware installed on the machine [i.e., whether there is a GPU installed, what version of compute unified device architecture (CUDA) driver is present, which PyTorch version corresponds to the installed CUDA driver]. It is acceptable if the machine does not have a GPU device; in this case, the computation will be performed by the CPU, and the inference time per SVI will be several seconds (slower than a machine with a GPU). Additionally, when installing PyTorch, the user needs to make specific choices depending on their machineʼs software and hardware. The PyTorch installation page (https://pytorch.org/get-started/locally/) guides users through selecting the appropriate build and package manager (e.g., pip or Conda) for their hardware and operating system configuration.
Once the environments are properly configured, the user can navigate to the correct folder and execute the script. The script will generate segmentation results per SVI and will also mark each occurrence of the desired roadway infrastructure object class, shown in Figure 13.
Results and Findings
The research team tested the proposed process/system extensively in ODOT Region 1 on 70 miles of Interstate Highways, U.S. Highways, and Oregon state highways. The streetlight detection performance proved to be impressive, with a precision of ≥ 0.98 and a recall of ≥ 0.90.

Long Description.
The screenshot is named 'task6 - .z s h - 80x12.' The text in the screenshot reads the following: Row 1 (base) task 6 percent conda activate mmseg. Row 2 (mmseg) task 6 percent python main.py --class streetlight.

Images sourced from the Oregon Department of Transportation's Digital Video Log (https://dvlprod-ordot.msappproxy.net/cf/dvl/index.cfm)
Long Description.
The first photo shows a normal view of the highway road from the vehicle's perspective. The view shows a multi-lane highway with white markings. The second photo shows a semantic segmentation view of the same image where the roads are in purple and the vehicle is in blue.
The detection module was accurate at both (1) determining there is a streetlight in the scene when there are indeed luminaries, and (2) deducing there are no streetlights when luminaries are not present.
Sometimes, the detection module made mistakes with rare streetlight shapes or scenes like steel bridges, for example, the Oregon-Washington Bridge connecting Vancouver (WA) and Portland (OR). These objects are never seen in their original training data, which was very likely the cause of the failed detection. To overcome these challenges, users can add SVIs containing similar objects or scenes to the original training dataset or create a fine-tuned dataset to provide additional examples for the model to learn from. This is a common practice in AI/ML model training.
Figure 14 illustrates how different timestamps affect the images, which affect the ML tools. SVIs captured in the late afternoon (those that appear darker) were produced in 2019, while SVIs captured around noon (those that appear brighter) were produced in 2023. A closer comparison of the SVIs would reveal that the landscapes and highway message boards appear different. These are the additional challenges of ingesting data from third-party platforms such as Google Maps, Mapillary, Bing Streetside, and Apple Look Around, where there may be better coverage, but less control compared to agency-maintained systems. Nonetheless, the detection and localization
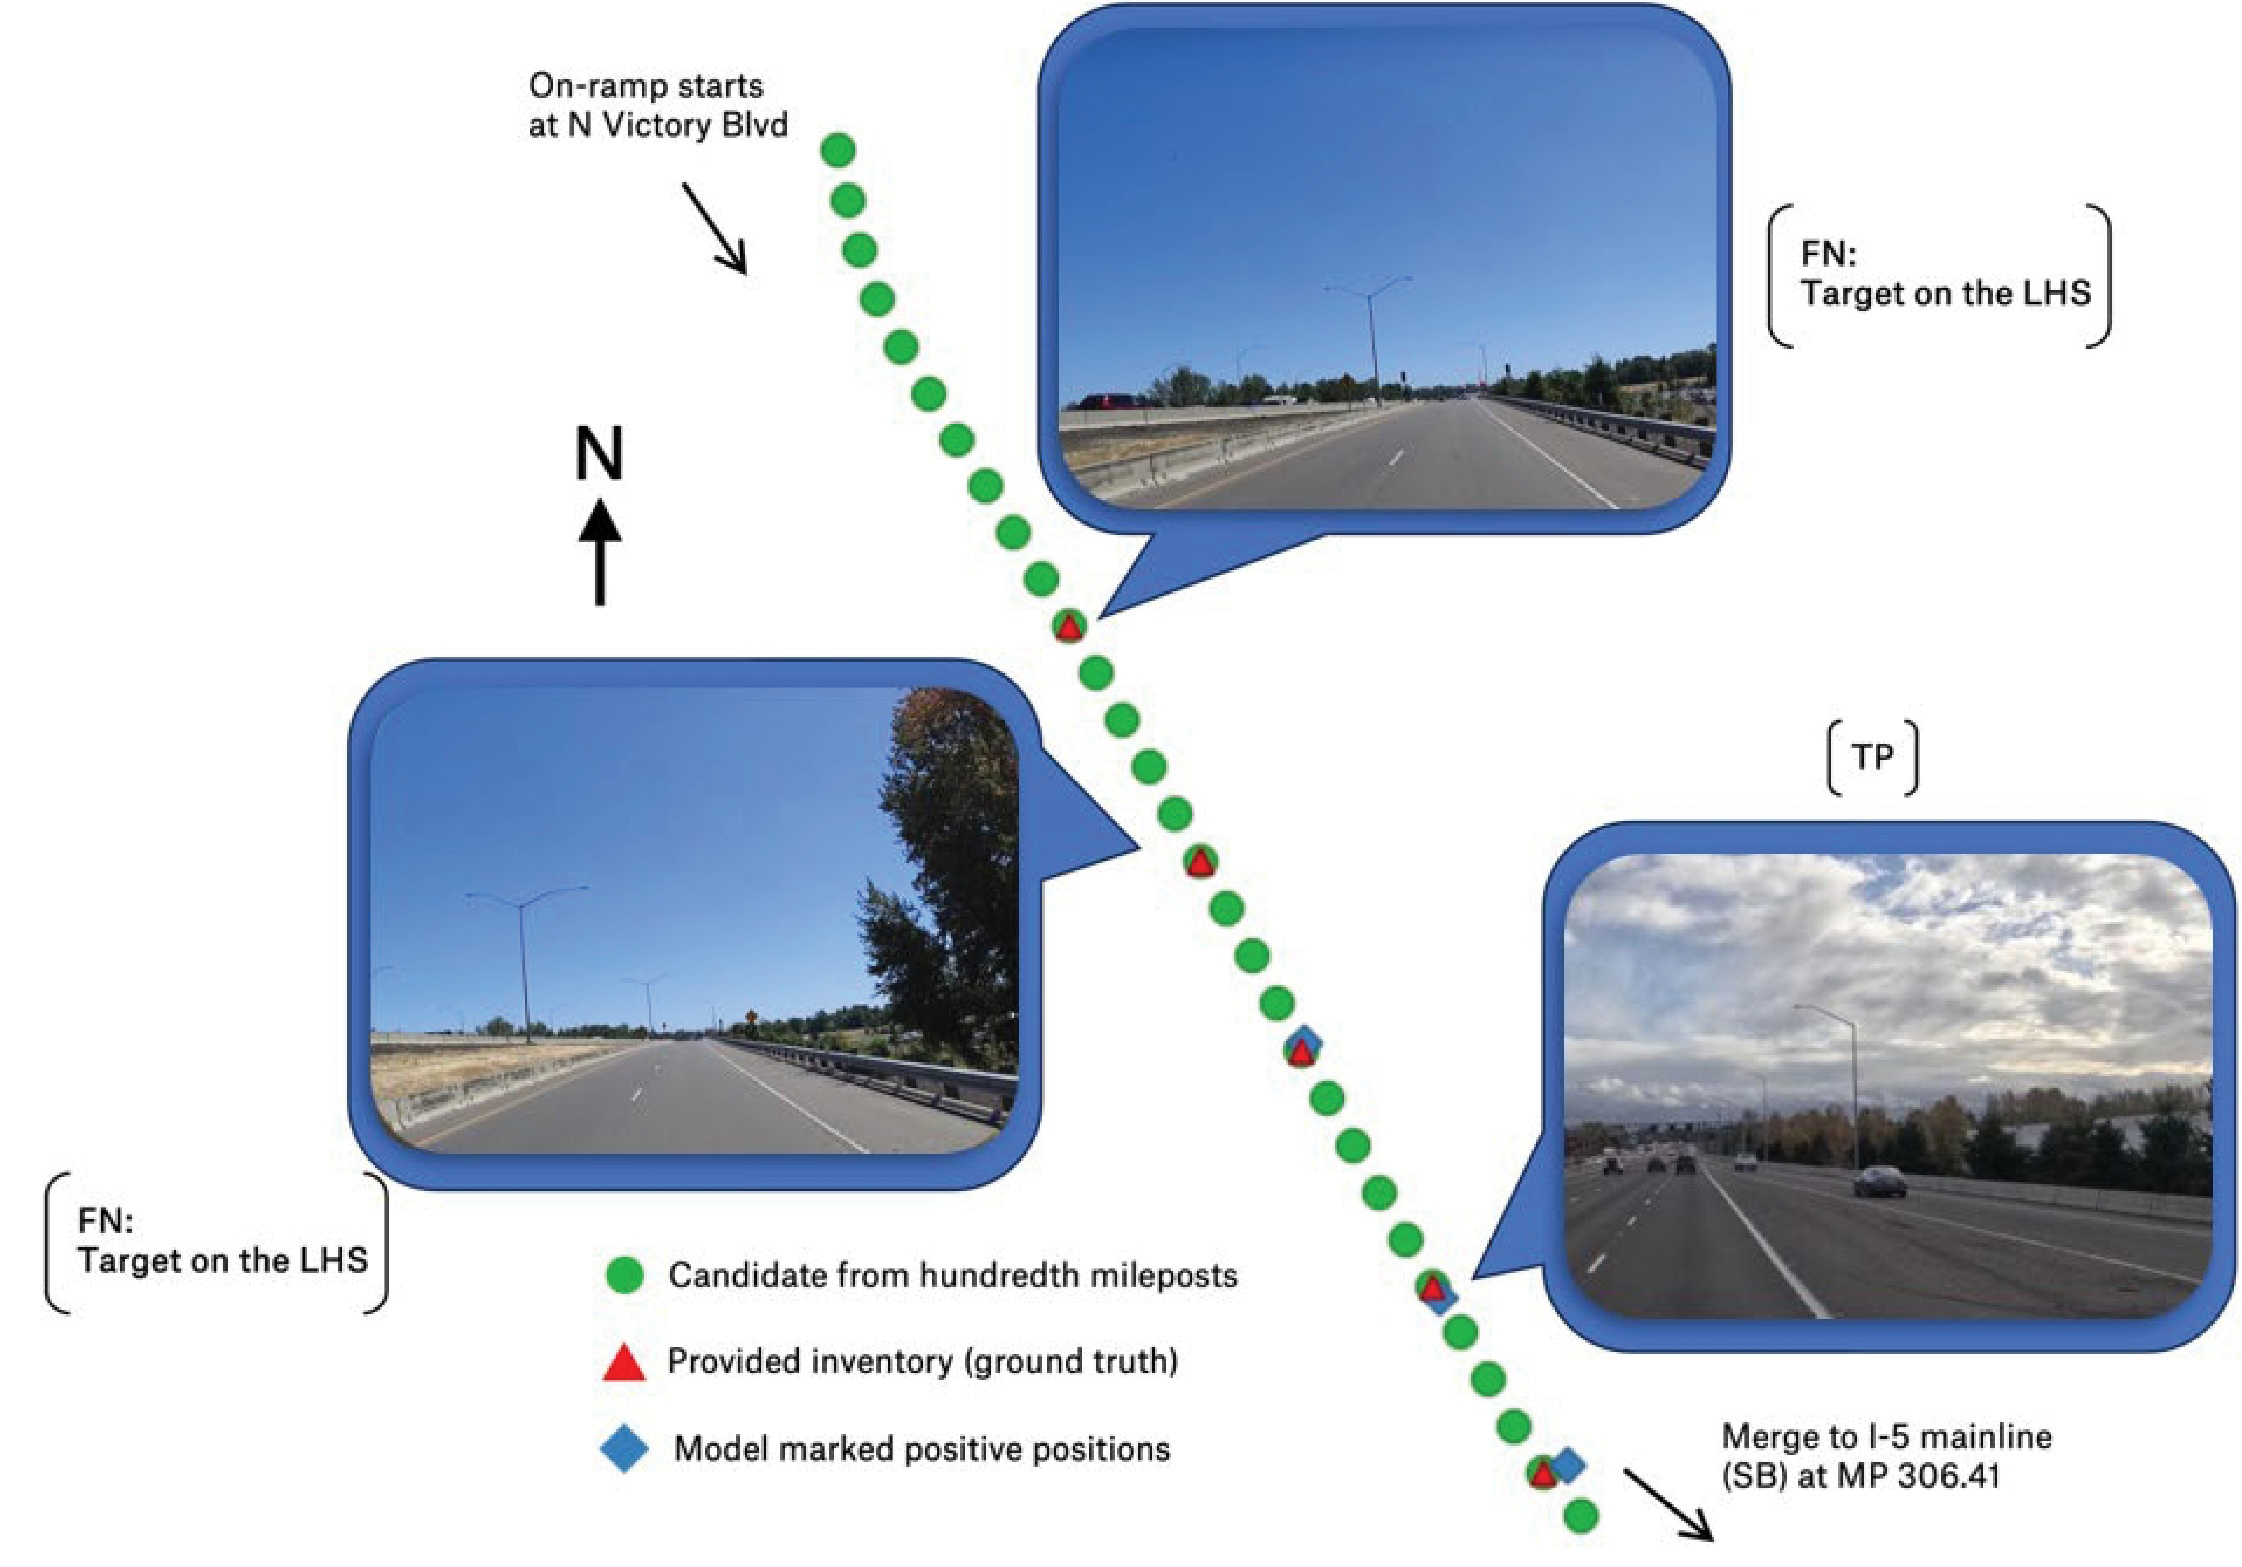
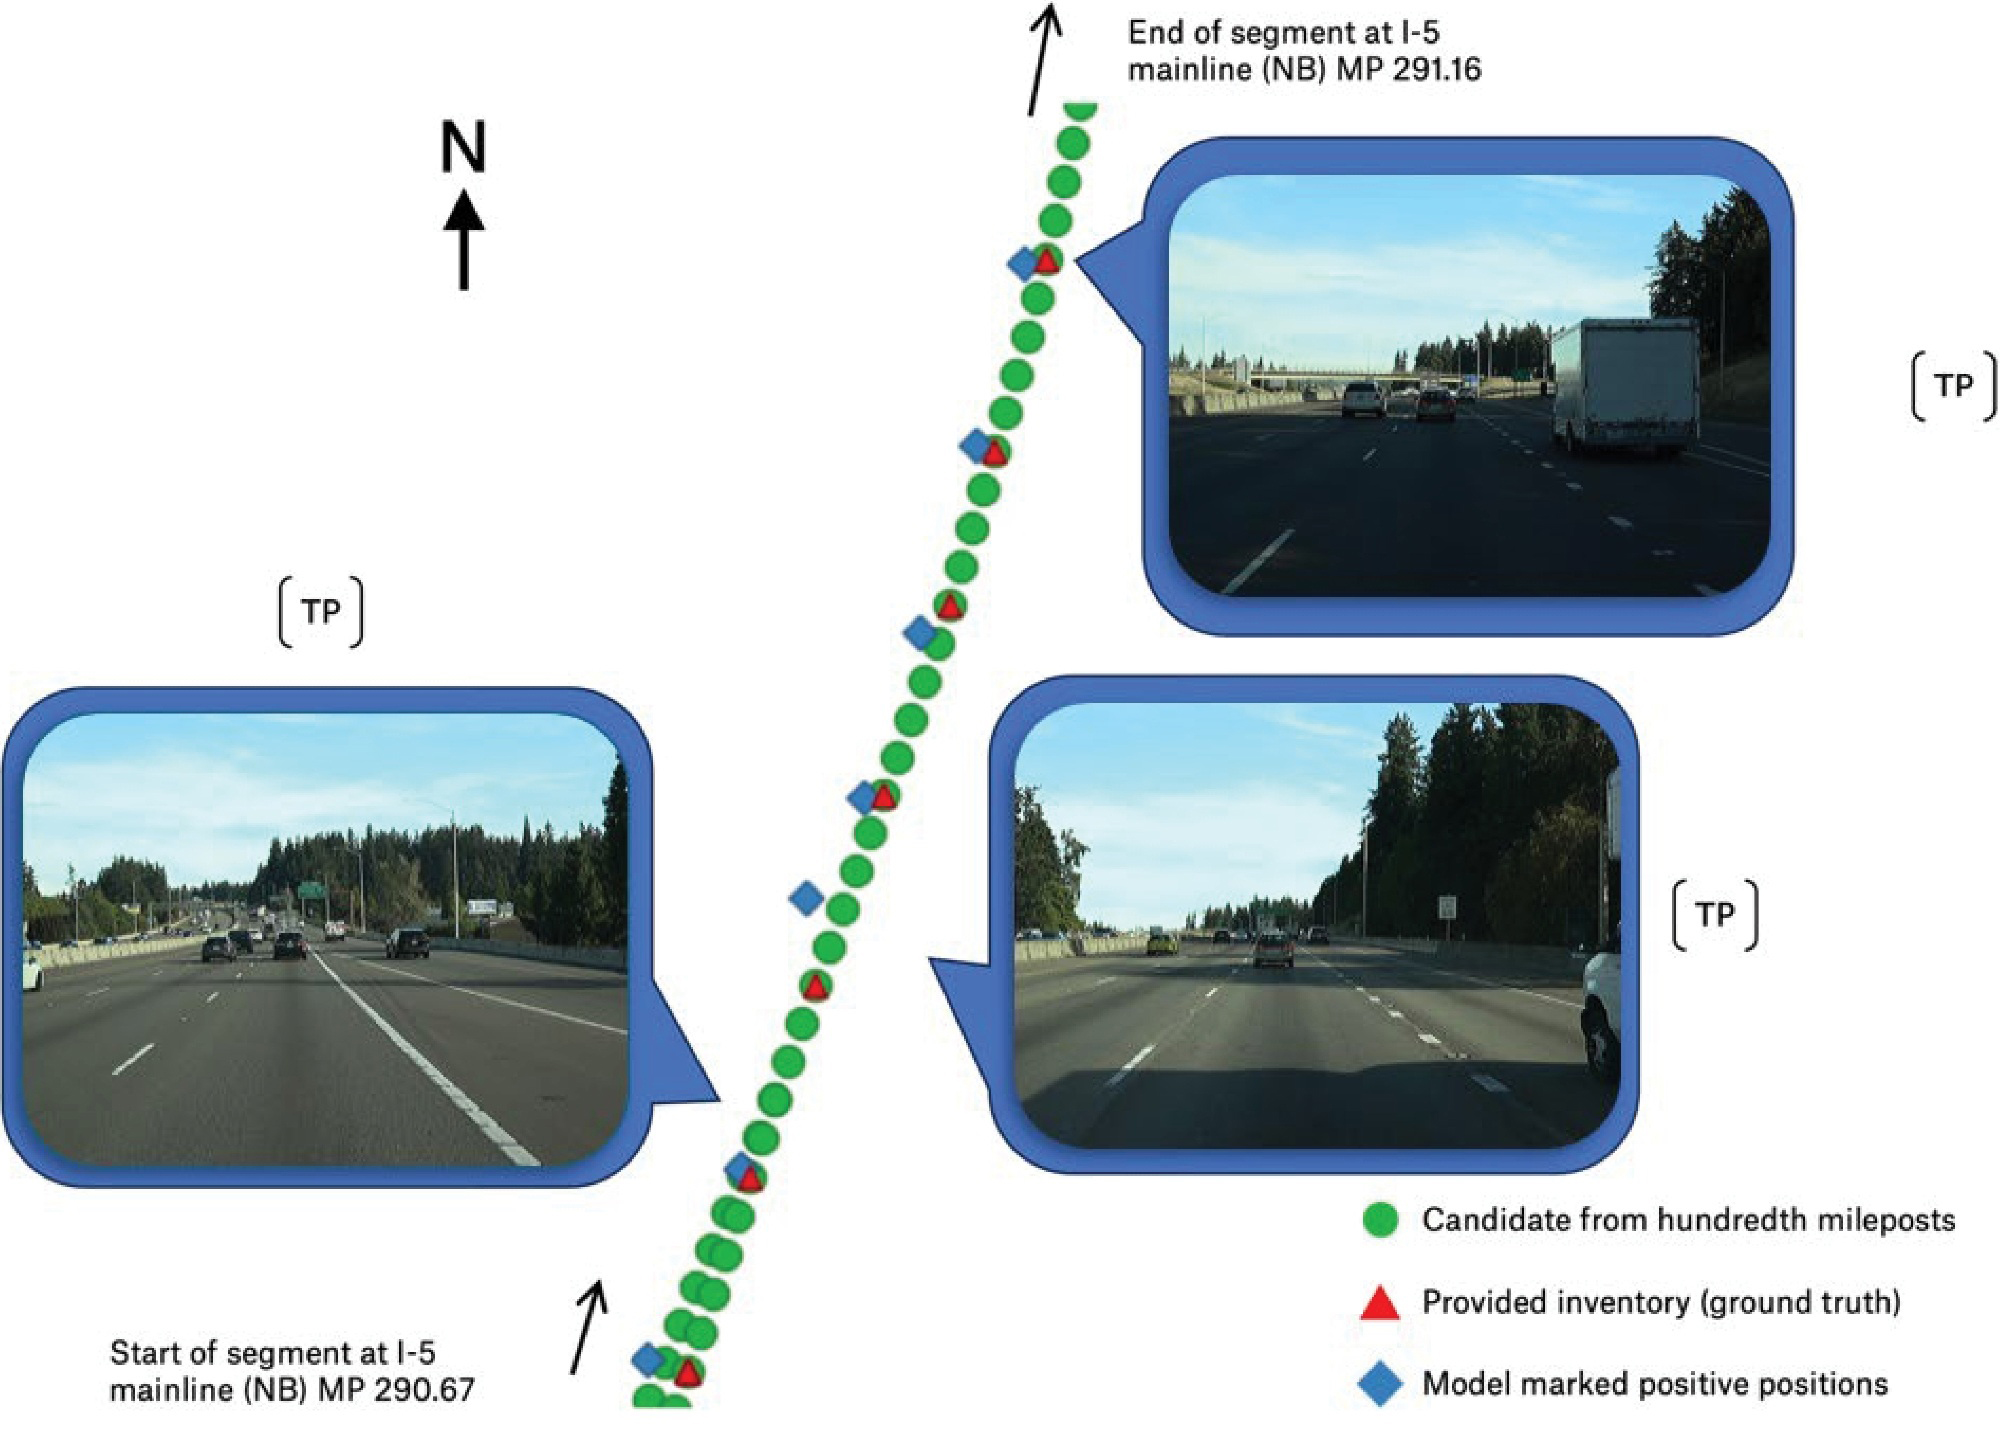
FN = false negative, TP = true positive, MP = milepost, LHS = left-hand side, SB = southbound street-level imagery sourced from Mapillary https://www.mapillary.com), licensed under CC BY-SA 4.0
Long Description.
The illustration begins with a photo on the left, showing a highway lane in broad daylight. The right side of the illustration shows two photos depicting the normal view of the highway road from the vehicle's perspective. The photos on the left and right are divided by a diagonal line which is comprised of three markings. The three markings are round (candidate from hundredth mileposts), triangle (provided inventory - ground truth), and rhombus (model marked positive positions). The first photo is labeled FN: Target on the LHS. The second photo is labeled FN, Target on the LHS.The third photo is labeled TP. The beginning of the line (top) is marked On-ramp starts at N Victory Boulevard. The end of the line is marked Merge to I-5 mainline (SB) at MP 306.41.
results were clear, as shown by the number of streetlights detected (blue diamond symbols in Figures 15 and 16) and their closeness to the ground truth locations.
The results of this pilot study show that ML can enhance the ability of a public transportation agency to develop and maintain a robust roadway and roadside inventory with minimal human resources. While this pilot focused on the presence and location of streetlight luminaires, it is anticipated that the algorithms can be modified to capture other assets that are similarly unique and definable, such as posted speed limit signs, regulatory signs (e.g., Stop, Do Not Enter) or warning signs (e.g., horizontal curve warning, Stop Ahead). Having this data accurately reflected in a statewide roadway inventory, which has been a challenge due to the labor required to capture this information, would provide a useful, data-driven foundation for improving the practice of evaluating and predicting future crash risks for all road users.
Summary
This pilot study was a successful proof of concept that ML can identify some roadside inventory elements more efficiently than traditional methods. An ODOT traffic safety engineer shared that the luminaire location data could be important for the agency to improve nighttime pedestrian safety. Since the pilot study was conducted in a rural and suburban area, the traffic safety engineer also mentioned that the background in urban areas is typically more complicated. They wondered if the research team had any plans to investigate using this tool to collect lighting information from image data in urbanized areas. The research team agreed that the system should be tested in more
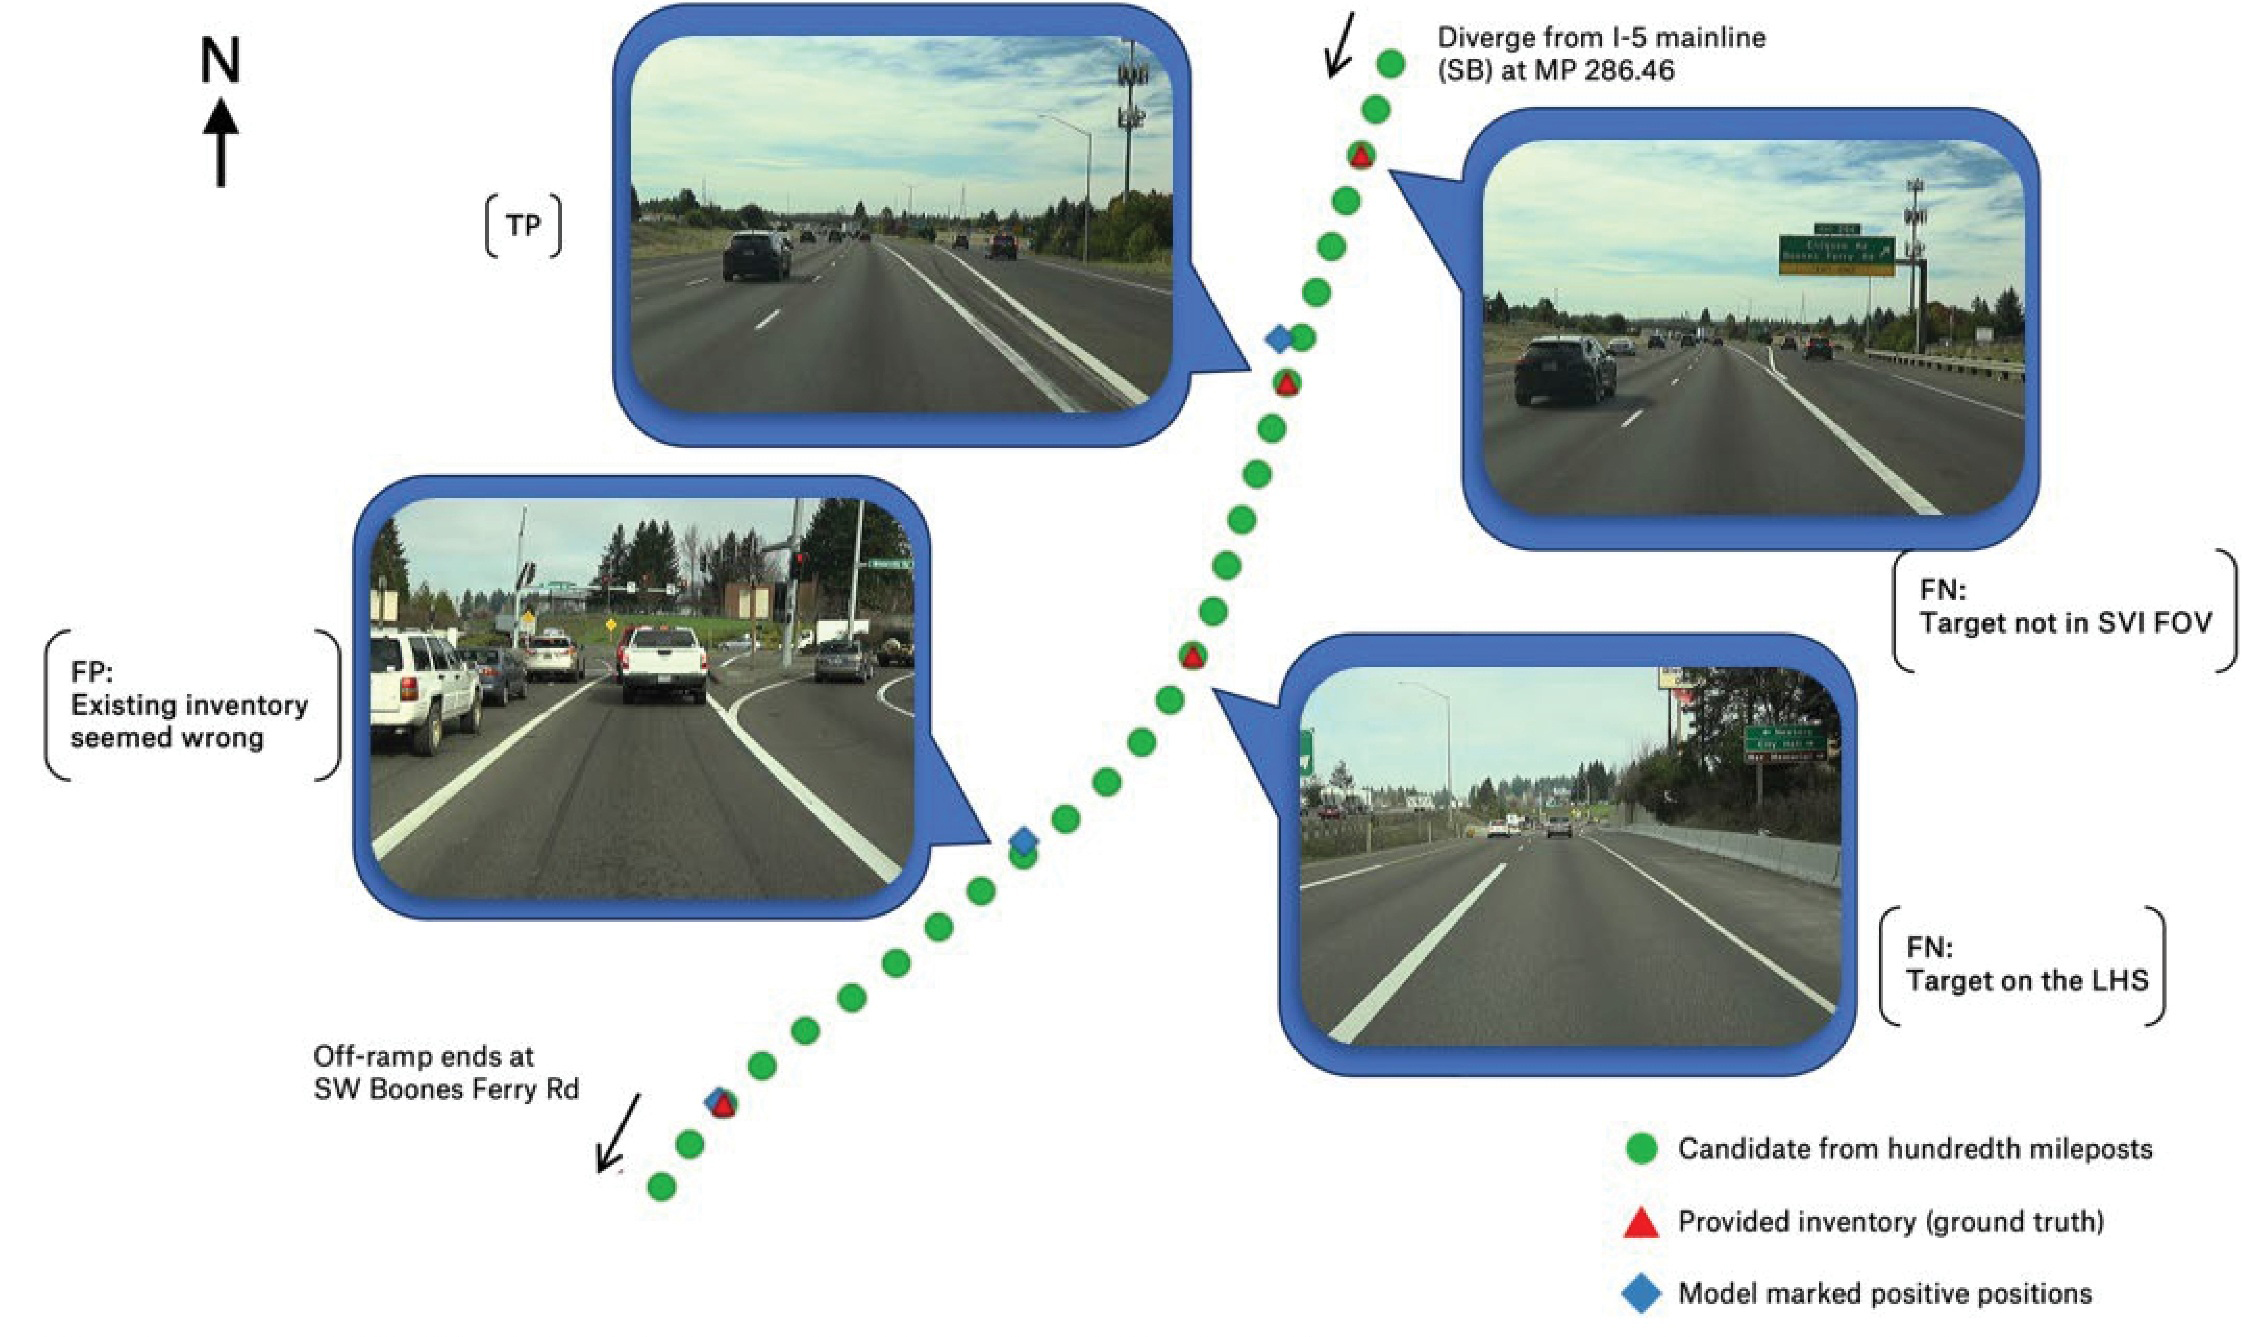
FN = false negative, FOV = field of view, FP = false positive, LHS = left-hand side, MP = milepost, NB = northbound, SB = southbound, TP = true positive Images sourced from the Oregon Department of Transportation's Digital Video Log (https://dvlprod-ordot.msappproxy.net/cf/dvl/index.cfm)
Long Description.
The illustration begins with two photos on the left, showing a highway lane in broad daylight from the vehicle's perspective well-maintained and poorly-maintained. The right side of the illustration shows two photos depicting the normal view of the highway lane in broad daylight. The first photo shows a well-constructed wide road titled FN: Target not in SVIFOV. The second photo shows a poorly maintained narrow road titled FN: Target on the LHS. The photos on the left and right are divided by a diagonal line which is comprised of three markings. The three markings are round (candidate from hundredth mileposts), triangle (provided inventory - ground truth), and rhombus (model marked positive positions). The beginning of the line (top) is marked 'Diverge from I-5 mainline (SB) at MP 286.46' and the end of the line (bottom) is marked 'Off-ramp ends at SW Boones Ferry Rd' with a downward arrow.
FN = false negative, FOV = field of view FP = false positive, LHS = left-hand side MP = milepost, NB = northbound, SB = southbound, TP = true positive Images sourced from the Oregon Department of Transportation's Digital Video Log (https://dvlprod-ordot.msappproxy.net/cf/dvl/index.cfm)
Long Description.
The illustration begins with a photo on the left, showing a highway lane in broad daylight with a pothole at its center. The photo is titled FN: Target on the LHS. The right side of the illustration shows two photos depicting the normal view of the highway road. The first photo is titled FN: Target on the LHS. The photos on the left and right are divided by a diagonal line which is comprised of three markings. The three markings are round (candidate from hundredth mileposts), triangle (provided inventory - ground truth), and rhombus (model marked positive positions). The beginning of the line (top) is marked 'On-ramp starts at N Victory Blvd' and the end of the line (bottom) is marked 'Marge to I-5 mainline (SB) at M P 306.41' with a downward arrow.
environments to understand its performance under various conditions. Overall, the ODOT staff shared their appreciation for the research teamʼs work and said that these results will be interesting for different ODOT regions.
Challenges and Lessons Learned
The research team observed multiple factors that affect detection results significantly: driving lanes, new objects, and infrastructure locations. Street-level images taken when the survey vehicle was closer to the median versus the rightmost lane or shoulder could contain significantly different information. This is particularly true on interstate or major highways where many lanes are present. Images taken near the median could miss the streetlight on the right-hand side, or the streetlight may be captured, but the location recording could be inaccurate. Objects rarely seen in the training dataset pose significant challenges for the model during inference. For example, steel bridges are common in the Pacific Northwest, but the research teamʼs model was trained on a world dataset, which resulted in a lack of confidence in analyzing bridges in the Pacific Northwest setting. The model developed in this study always confuses itself with sky pixels vs. pixels that should belong to steel bridges. Detecting local streetlights can sometimes be tricky if they are present on the left-hand side. While the model can detect the presence of streetlights in general, it cannot identify whether a particular streetlight serves the road the survey vehicle is
on. Streetlights can appear on the left-hand side in street-level images, but it is hard for the model to identify when a luminary serves the opposite driving direction.
Based on these observations, the limitations of third-party image databases need to be understood before they are adopted. Images from these databases use variable vendors to collect the data, collect at different times, and collect under various weather conditions (e.g., rainy or sunny and daytime or evening). Users also have limited control of the APIʼs behavior. For example, it is difficult for users to query or prioritize more recent SVIs over older ones at the same location. Digital video logs collected by agencies can address most of the issues. Most importantly, protocols are followed in dedicated data collection campaigns, including consistent camera models and settings, consistent driving behavior, and environmental factors such as sunny days. As videos are logged, it is possible to request the full footage for analysis, allowing richer sequential information modeled from a series of images rather than single street-level images that are geographically far apart.
Case Study #2: Analyzing Big Data, Bellevue, Washington
Bellevue is located east of Seattle, Washington. It is the fifth-largest city in the state, with a population of more than 150,000 residents. Bellevue has become a national leader in the application of new technologies to improve safety, serving as a “living laboratory” for university and industry-backed technology application and evaluation. Partners have included the University of Washington, Microsoft, Transoft, and Advanced Mobility Analytics Group (AMAG), among others. Studies have largely focused on the use of detection technologies to improve safety at signalized intersections, of which Bellevue has more than 200.
City of Bellevue, WA previously partnered with AMAG to collect and analyze video of all road users at more than 20 signalized intersections, with a focus on conflicts between motor vehicles and VRUs (see Ali et al. 2023 and Howlader et al. 2024) for examples of how AMAG data has been previously used in the assessment of traffic conflicts to identify high-crash-risk locations. The research team met with Bellevue and AMAG to discuss their needs, previous evaluations, and outcomes, and the potential for the research team to reuse the raw data from the previous study for additional research. The study intersection, 106th Avenue NE & NE 4th Street, experienced approximately 18,000 entering vehicles per day during the study period. This intersection was chosen by Bellevue Transportation Department staff as the pilot test site because the camera has a complete view of two of its right-turn pockets. The southbound-right (SB-R) turn has one departure lane and two receiving lanes, creating possibilities for turns with a large radius and potentially high turning speed; the westbound-right (WB-R) turn includes movements that originate from a shared right turn lane into a single lane. Therefore, this intersection has two different scenarios for analysis. Additionally, the video camera provides good views of four left-turn movement directions, with one fully captured eastbound-left (EB-L), one almost fully captured southbound-left (SB-L), and two partly captured northbound-left (NB-L) and westbound-left (WB-L).
The goal of this pilot study was to examine how video analytics, a tool that is becoming increasingly available at agencies, can be used for more in-depth analysis of road user behaviors. It is hoped that these behaviors are related to the geometries of these intersections so that designs can be modified and countermeasures implemented based on the safe system approach. Correspondingly, the goal of the developed tool is to perform data wrangling to analyze user behaviors among the vast amount of data produced by video data analytics.
For left-turning and right-turning vehicles at signalized intersections, the City of Bellevue, WA, desired information regarding the potential effects of intersection curb radii, the number of receiving lanes, the width of receiving lanes on the actual vehicle turning radii, the approach
angle of the vehicle to the crosswalk, and vehicle speed. The motivation was to relate sub-second turning behavior to roadway geometries so that VRU risks can be better understood and countermeasures can be proposed. For each turning vehicle, it was necessary to collect the sub-second object trajectory, the approach angle at a crosswalk, the speed, the intersection geometry (including curb radii), the lane configuration (including bicycle lanes, etc., to determine effective radii), and lane widths.
Methodology, Tools, and Data
The primary data used in this pilot study consisted of traffic movements captured using cameras mounted at signalized intersections. AMAG collected 24 days of data in Fall 2020 at several locations in Bellevue, WA, capturing approximately 14 hours of video each day per location. AMAGʼs AI/ML algorithms used You Only Look Once (YOLO) and Simple Online and Realtime Tracking with a Deep Association Metric (DeepSORT) for object detection and tracking, respectively (Redmon et al. 2016 and Wojke et al. 2017). The generalized SORT workflow includes the following steps:
- Detection: The first step in SORT tracking is object detection. In the context of vehicle tracking, this is typically YOLO (as adopted by AMAG).
- Prediction: For each existing track, the SORT algorithm predicts the new position of the object in the current frame based on its previous positions. This prediction is typically made using a simple linear constant velocity model, which assumes that the object will continue moving in the same direction and at the same speed.
- Association: The predicted positions of existing tracks are then matched with the newly detected objects in the current frame. This association is completed using a matching/association algorithm, such as the Hungarian algorithm, which minimizes the total distance between predicted and detected positions.
- Update: Once the associations are established, the tracking is updated with the new positions of the matched objects. If a detected object is not matched with any existing tracking, new tracking is created for it.
- Removal: Tracking that has not been matched with any detected objects for a certain number of frames is removed, as they are assumed to have left the field of view.
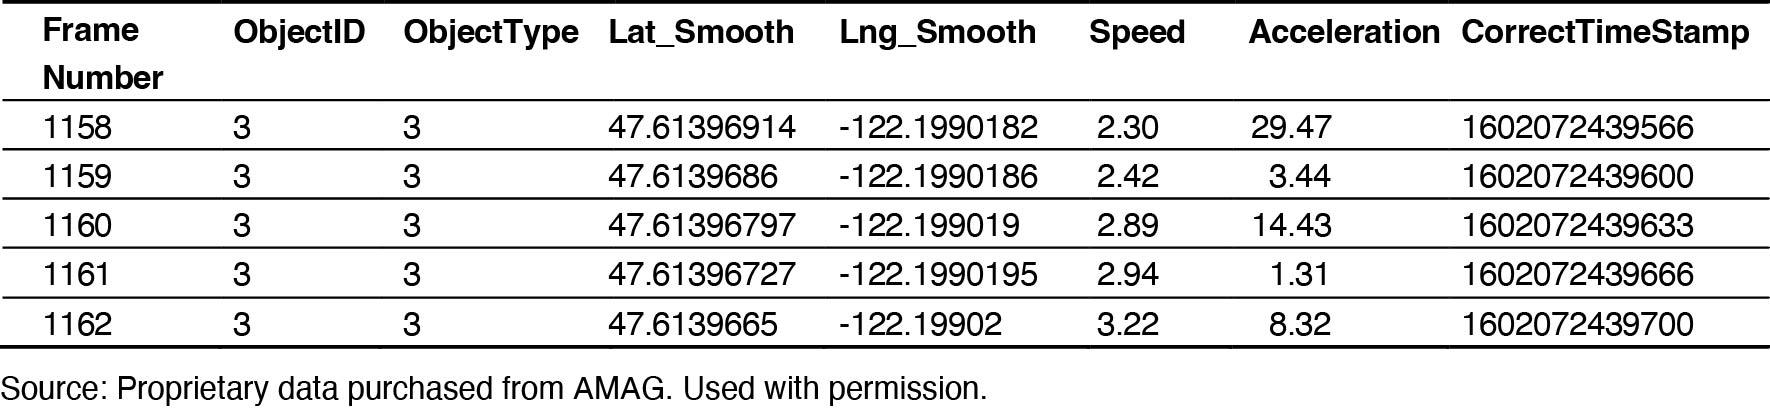
The detection and tracking algorithms analyze the raw video data frame by frame and thus produce frame-by-frame location and speed metrics for each object captured at the study intersection. Table 3 shows an example of records corresponding to a particular tracked object.
Several additional features were added to the dataset. Vehicles were first classified into stopped (i.e., impeded) vs. unstopped (i.e., unimpeded). This categorization is important because, longitudinally, there is a difference between free-flow vehicles and impeded vehicles (stopped by traffic
Long Description.
The column headings are Frame Number. Object ID. Object Type. Lat_Smooth. Lng_Smooth. Speed Acceleration. Correct Time Stamp. The data displayed in the table are as follows: Column 1 Frame Number. Row 1 1158. Row 2 1159. Row 3 1160. Row 4 1161. Row 5 1162. Column 2 Object ID. Row 1 3. Row 2 3. Row 3 3. Row 4 3. Row 5 3. Column 3 Object Type. Row 1 3. Row 2 3. Row 3 3. Row 4 3. Row 5 3. Column 4 Lat_Smooth Row 1 47.61396914. Row 2 47.6139686. Row 3 47.61396797. Row 4 47.61396727. Row 5 47.6139665. Column 5 Lng_Smooth Row 1 negative 122.1990182. Row 2 negative 122.1990186. Row 3 negative 122.199019. Row 4 negative 122.1990195. Row 5 negative 122.19902. Column 6 Speed. Row 1 2.30. Row 2 2.42. Row 3 2.89. Row 4 2.94. Row 5 3.22. Column 7 Acceleration Row 1 29.47. Row 2 3.44. Row 3 14.43. Row 4 1.31. Row 5 8.32. Column 8 Correct Time Stamp Row 1 1602072439566. Row 2 1602072439600. Row 3 1602072439633. Row 4 1602072439666. Row 5 1602072439700.
control devices or yielding to other road users). Free-flow (unimpeded) vehicles are only affected by static configurations, such as intersection geometry and speed limit, making it possible to compare trajectories from different scenes with varying traffic. The speeds from consecutive frames were analyzed, and if a vehicle was stopped for at least ten frames, it was classified as stopped. Vehicle headings were calculated per frame based on their trajectory in a ten-frame window. The original data provided bearing, which measures the angle from the center of the intersection (calculated based on site layout details) to the point on the trajectory in degrees. Headings can be an important measure of risk to active users when vehicles enter the crosswalk of the receiving lane/approaches, as flatter turns with larger turn radii limit the driverʼs field of view when they are approaching the crosswalk.
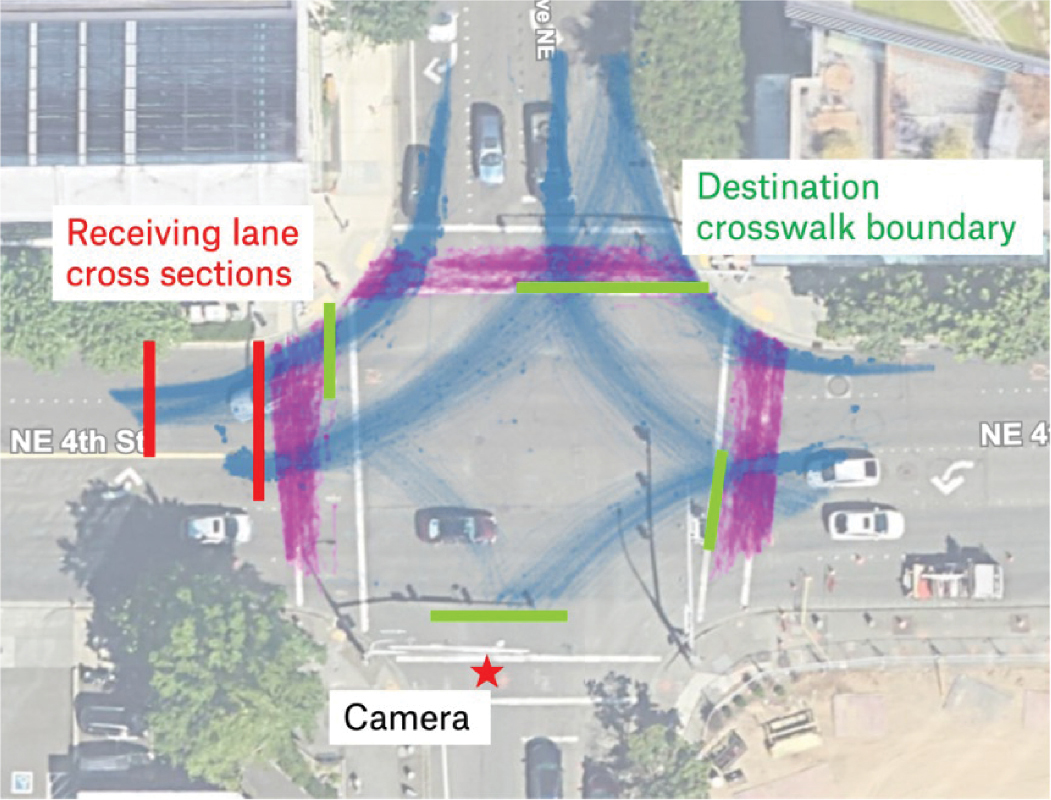
After the features are added, the tool needs the userʼs input to define the intersectionʼs layout. For example, in Figure 17, in order to analyze usage of receiving lane of SB-R movements, cross sections are defined in red; and in order to analyze headings and angles of turning vehicles approaching crosswalks in their destination directions, green bars are manually defined as boundaries, and purple shading represents pedestrian trajectories as captured and analyzed as part of the study. These user inputs are translated to coordinates and then compared with vehicle trajectories. The frames closest to the boundaries/sections are extracted and analyzed.
Findings
Receiving Lane Positions
One feature of this intersection is its SB-R movement, which has two receiving lanes. This may result in different types of right-turn behaviors, which are noteworthy for safety analysis and may reveal patterns in lane usage or pedestrian exposure risks. The “x” variable is used to identify the specific cross sections, as illustrated in Figure 18. It represents the distance from a reference point. For example, x = 16 m corresponds to the cross section at the crosswalk where turning vehicles exit the crosswalk. When x = 10 m, this corresponds to the downstream cross section for turning vehicles, where vehicles are already in or entering the straight segment. These cut-offs create cross-sectional profiles that help analyze vehicle behavior at different points along the path. The cut-off at x = 16 m creates a cross-sectional profile where turning vehicles exit the crosswalk. The cut-off at x = 10 m creates a downstream cross section for the SB-R turning
Long Description.
The view shows a plus-shaped intersection with the junction at its center. The road on the left is marked 'Receiving lane cross sections.' The road on the right is marked 'Destination crosswalk boundary.' The camera is marked on the road towards the south.
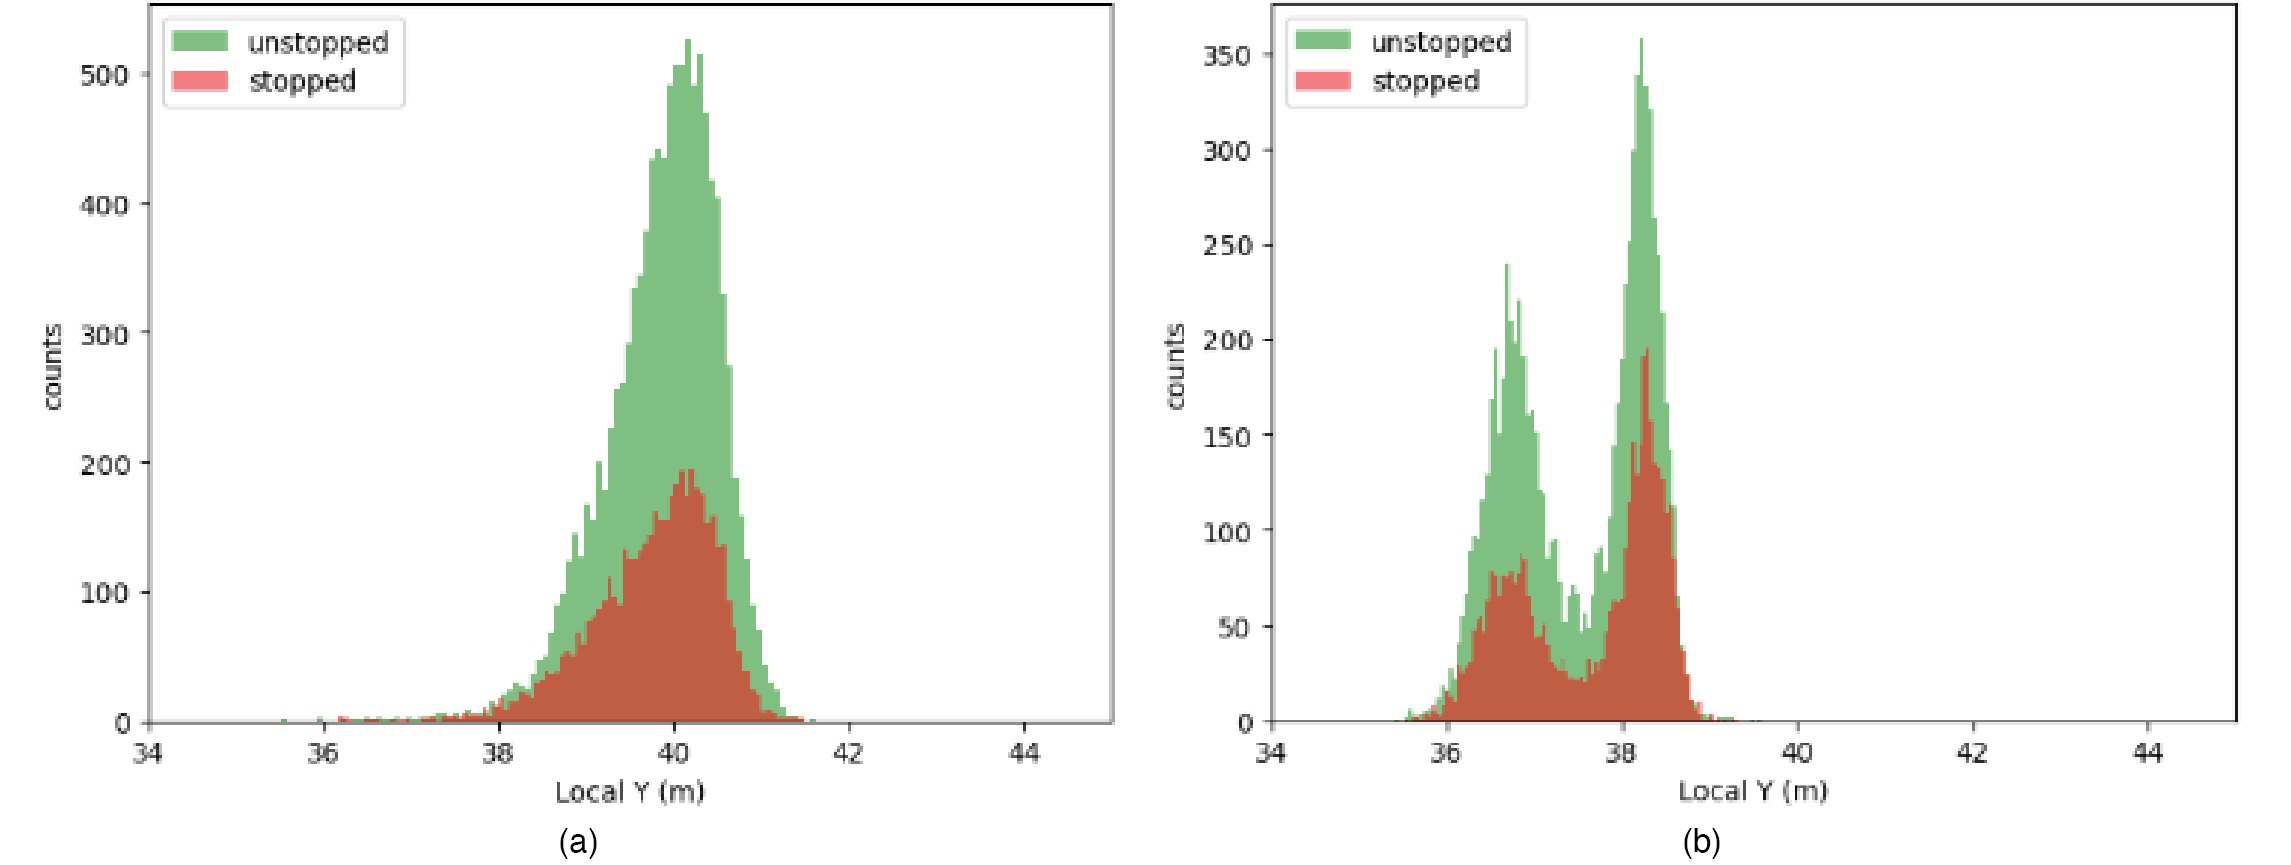
Notes: Local Y represents the lateral position of vehicles relative to a local coordinate system. Counts represents the number of vehicles observed at each local Y position.
Long Description.
In both graphs, the horizontal axes show local Y in meters from 34 to 44 in increments of 2. In graph 1, the vertical axis shows counts from 0 to 500 in increments of 100. In graph 2, the vertical axis shows counts from 0 to 350 in increments of 50. Both graphs are data on unstopped and stopped as follows: Graph 1: Unstopped: Begins at (36, 0), reaches its highest point at (40, 500), and ends at (41.5, 0). Stopped: Begins at (36.1, 0), reaches its highest point at (40, 200), and ends at (41.5, 0). Graph 2: Unstopped: Begins at (35.8, 0), reaches its highest point at (38, 350), and ends at (39.2, 0). Stopped: Begins at (35.8, 0), reaches its highest point at (38.2, 200), and ends at (39, 0). Note that the coordinate values are approximate.
vehicles, where vehicles should already be in or entering the straight segment. Figure 18 shows vehicle positions at x = 16 m exhibit left-skewed distributions for both stopped and unstopped groups, but both distributions are centered around their peaks. Vehicle positions at x = 10 m exhibit two peaks for each distribution, indicating the vehicles have switched lanes. The distributions are not skewed, indicating they can potentially be modeled as normal distributions, and the overall distribution for unstopped/stopped vehicles would be a Gaussian mixture.
Vehicle Exit Angles
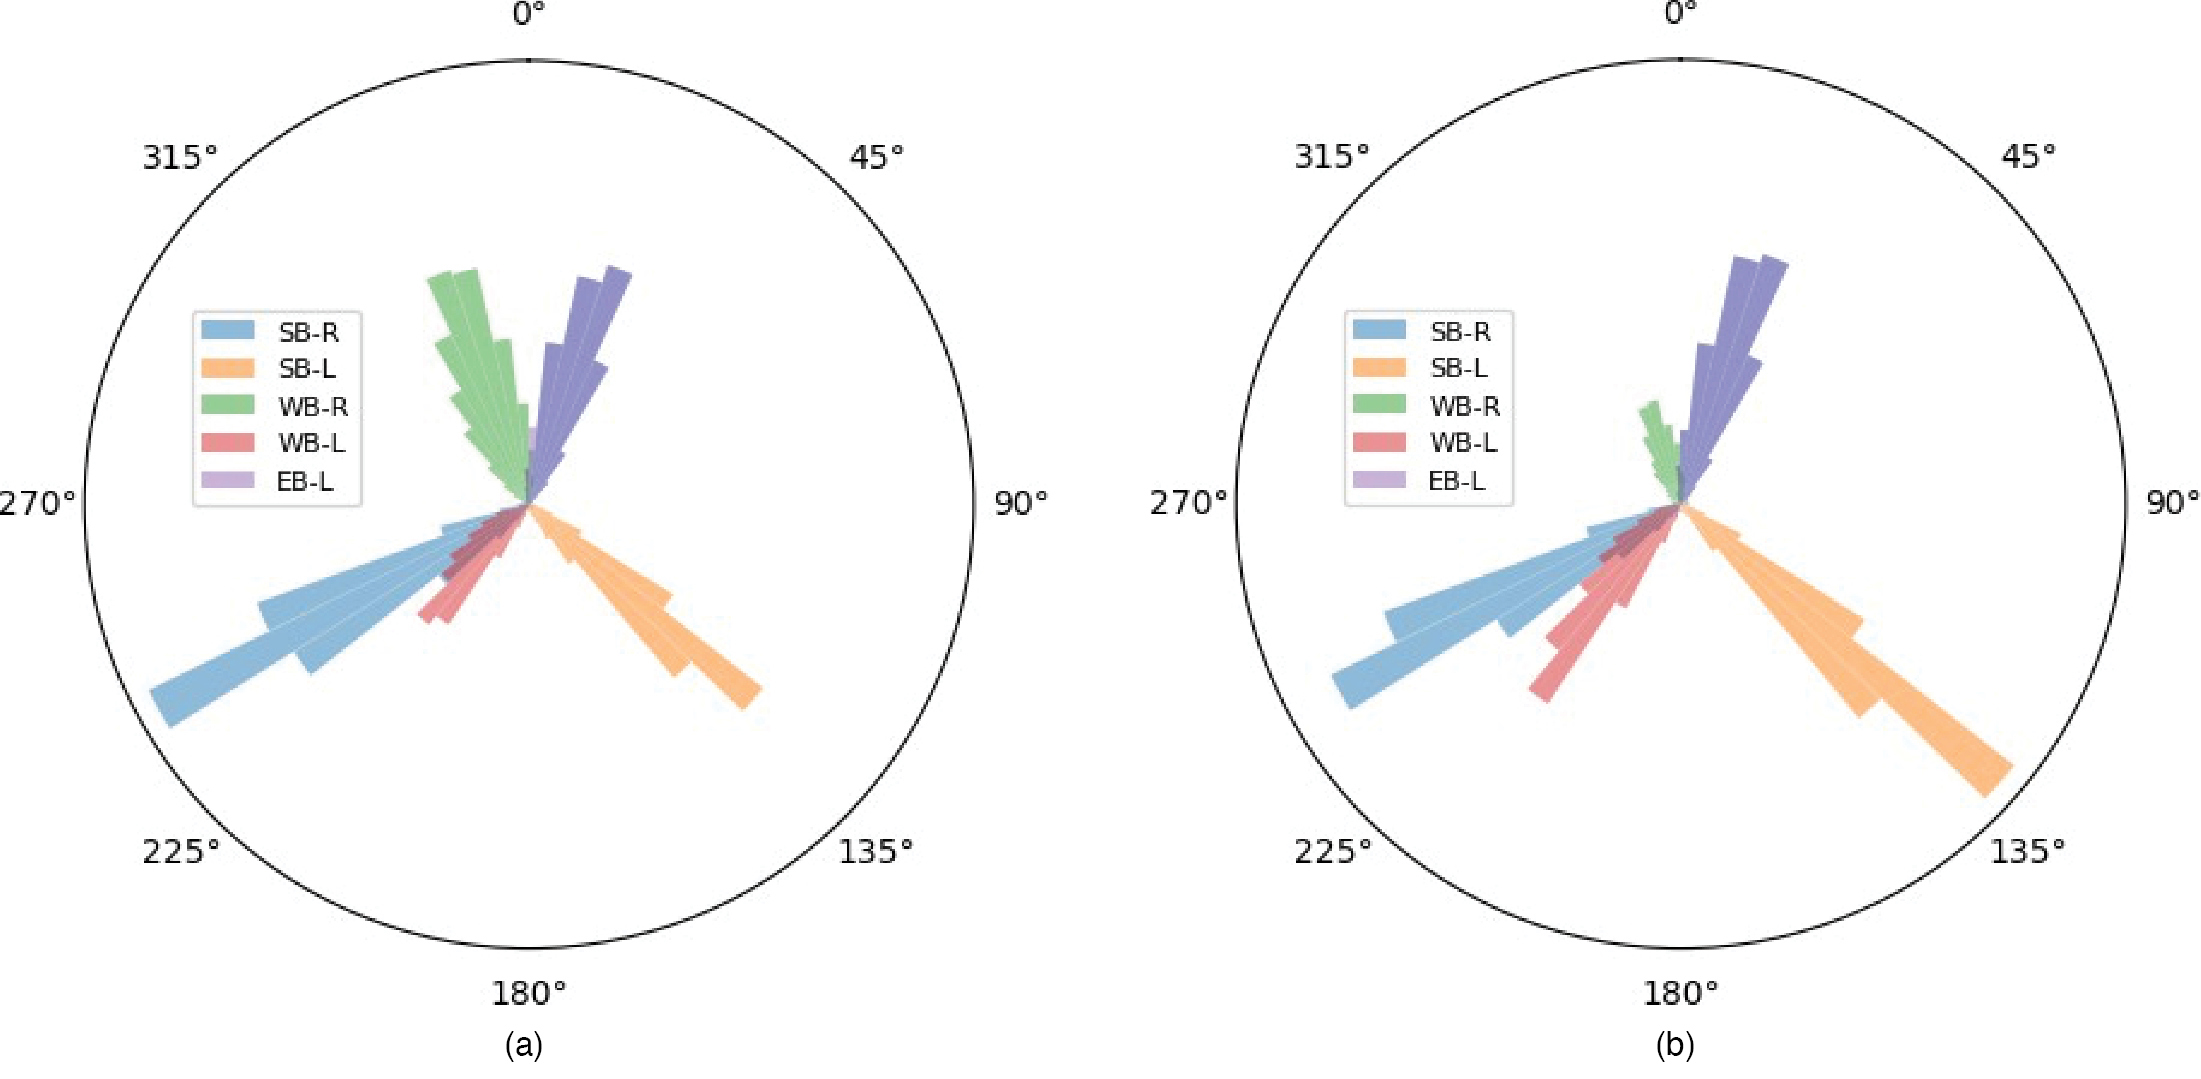
The headings of vehicles and the angles between crosswalks when vehicles reach them could be an indicator of geometric design influencing turning vehicle trajectories. The research team evaluated vehicle headings at such moments and summarized them into polar histograms, as shown in Figures 19 and 20. A general trend in comparing these headings is that larger vehicles (e.g., pickup trucks, commercial vehicles, buses, and vans) have more variation in their heading than passenger vehicles when approaching their destination crosswalk.
Summary
The results of this pilot study show that the collection of big data and new analysis methods can enhance the ability of transportation agencies and researchers to explore new research questions about road usersʼ activity at signalized intersections. City of Bellevue, WA staff expressed interest in this information (including driversʼ use of the different receiving lanes), as these were data they had never seen. Potential applications included improving signal timing algorithms and travel demand models.
The staff also asked for more details about the different object types (impeded and unimpeded). One senior transportation engineer asked, “I assume you are looking at the trajectory and seeing if they came to an almost complete stop before proceeding. Could you explain that more?” She further explained, “I do think it is a good measure to look at. If you come from a stopped position and then start to go, it probably would have a different effect than if you are free
Long Description.
Each chart shows six colored wedge-shaped bars radiating from the center at different angles. Each color represents a different category as follows: SB-R (blue), SB-L (orange), WB-R (green), WB-L (red), EB-R (purple), and EB-L (lavender). The chart is oriented with 0 degrees at the top and increases clockwise, with labeled angular positions till 315 degrees in increments of 45. The data given in the charts are as follows: Chart 1: SB-R: 235 degrees. SB-L: 135 degrees. WB-R: 355 degrees. WB-L: 220 degrees. EB-L: 25 degrees. Chart 2: SB-R: 235 degrees. SB-L: 133 degrees. WB-R: 355 degrees. WB-L: 210 degrees. EB-L: 20 degrees. Note that the angle values are approximate.

Long Description.
Each chart shows six colored wedge-shaped bars radiating from the center at different angles. Each color represents a different category as follows: SB-R (blue), SB-L (orange), WB-R (green), WB-L (red), EB-R (purple), and EB-L (lavender). The chart is oriented with 0 degrees at the top and increases clockwise, with labeled angular positions till 315 degrees in increments of 45. The data given in the charts are as follows: Chart 1: SB-R: 235 degrees. SB-L: 134 degrees. WB-R: 350 degrees. WB-L: 223 degrees. EB-L: 90 degrees. Chart 2: SB-R: 235 degrees. SB-L: 134 degrees. WB-R: 1 degree. WB-L: 215 degrees. EB-L: 60 degrees. Note that the angle values are approximate.
flow turning on a normal [traffic signal] cycle.” The research team provided additional details to define the terms “impeded” and “unimpeded.” The senior transportation engineer also identified a particular issue related to bicycle lanes: “For the departing lane, the interesting thing to me is that you show people departing from the bicycle lane so you can quantify the amount of people being in that lane is a safety hazard. If you do some kind of treatment, then there could be less people in that bike lane.”
With known information about the geometry of one intersection and the turning vehiclesʼ trajectories and speed within it, further studies could make correlations. For example, future research could compare geometric design elements (such as curb radius, effective radius, number of receiving lanes, or width of receiving lanes) to turning vehicle attributes (e.g., speed, heading at the crosswalk, or turn radius).
Challenges and Next Steps
The challenges of this pilot study included separating usable data from noise, given the large size of turning vehicle movement data—more than 50 gigabytes (GB) of data per intersection for 21 days. New findings can be hard to describe and even more difficult to determine their value. What does “vehicle heading at the crosswalk” really mean? What would it take to change this heading, and what change might significantly affect safety outcomes? The next step in this study could be to conduct a similar analysis at all 20 locations in Bellevue to develop correlations between roadway geometry, other inventory data, and driver behavior. In addition, researchers could incorporate the conflicts identified at these 20 locations to seek additional correlations among the analyzed data.


