Capturing the Durability of High Recycled Binder Ratio Asphalt Mixtures (2024)
Chapter: 3 Durability Evaluation
CHAPTER 3
Durability Evaluation
This chapter describes the results from component materials characterization and the mixture experiments used to produce a comprehensive draft Standard Practice for design and evaluation of durable asphalt mixtures. Three experiments addressed the primary durability issues (surface cracking, moisture susceptibility, and raveling) and included selected practical performance test methods and conditioning protocols to evaluate selected component materials and proportions (material combinations) for mixture durability evaluation. Mixture characterization results associated with a fourth mixture experiment for performance prediction of cracking through modeling are also included. Throughout the figures in this chapter, material combinations are color coded as orange (NR) and blue (NS) North/Freeze mixtures and red (SR) and green (SS) South/No Freeze mixtures.
A naming and labeling convention for mixtures for reporting of results was also adopted to indicate the mix design that defines aggregate type and gradation and associated RAM sources (Table 1), the RBR and associated RAM types (Table 1), the binder PG and ΔTc level (if needed) (Table 2), and any additives including ASA or RA or the decreased RBA high RAM mitigation strategy. Two examples include the typical 0.20 RBR control NS mixture with a PG 58-28 (Low ΔTc) virgin binder and no additives or decreased RBA strategy (NS_0.20_58-28Low) and the typical 0.16 RBR SR mixture with a hybrid high RAM strategy of softer virgin binder (PG 58-22 with High ΔTc) and decreased RBA (SR_0.16_58-28High_RBA). The virgin binders are labeled by PG and ΔTc level (if needed), and the RAM binders are identified by the region from which they were sampled and RAM type (RAP or TOAS).
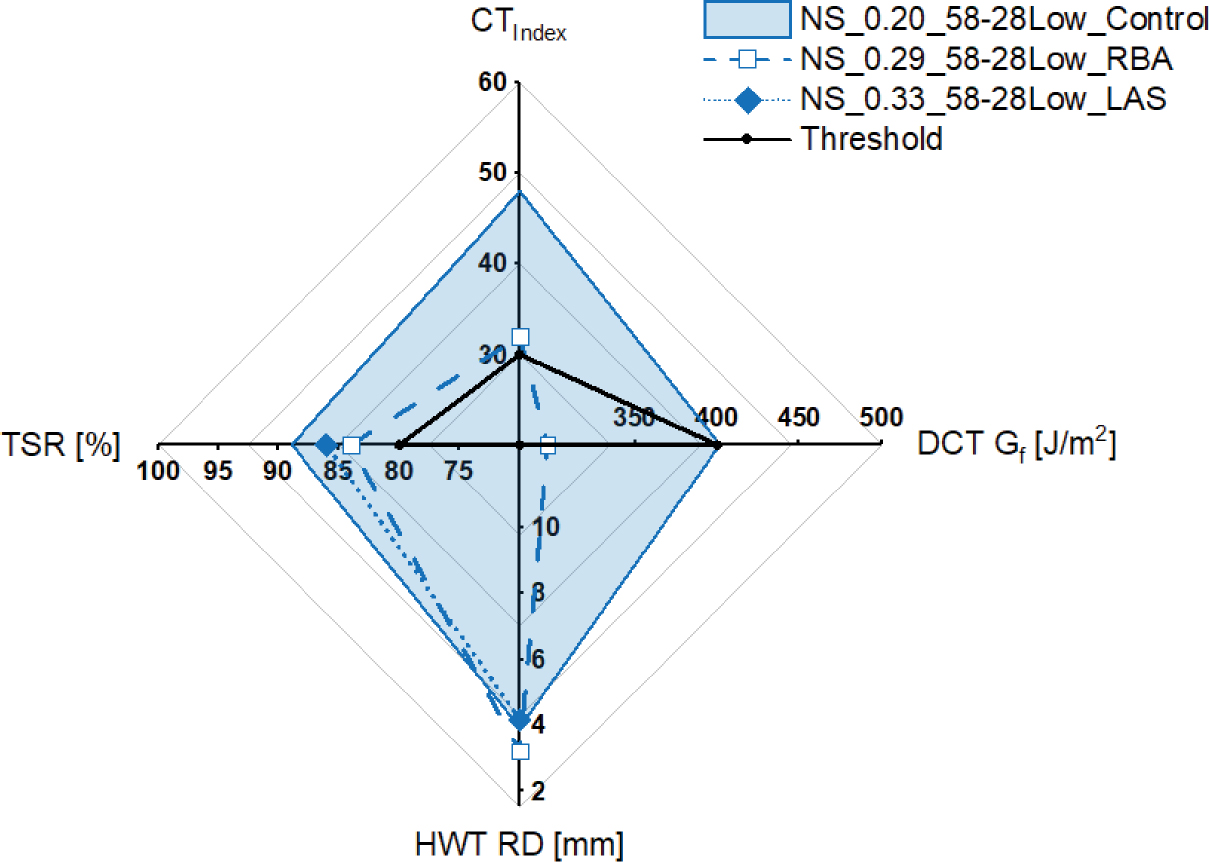
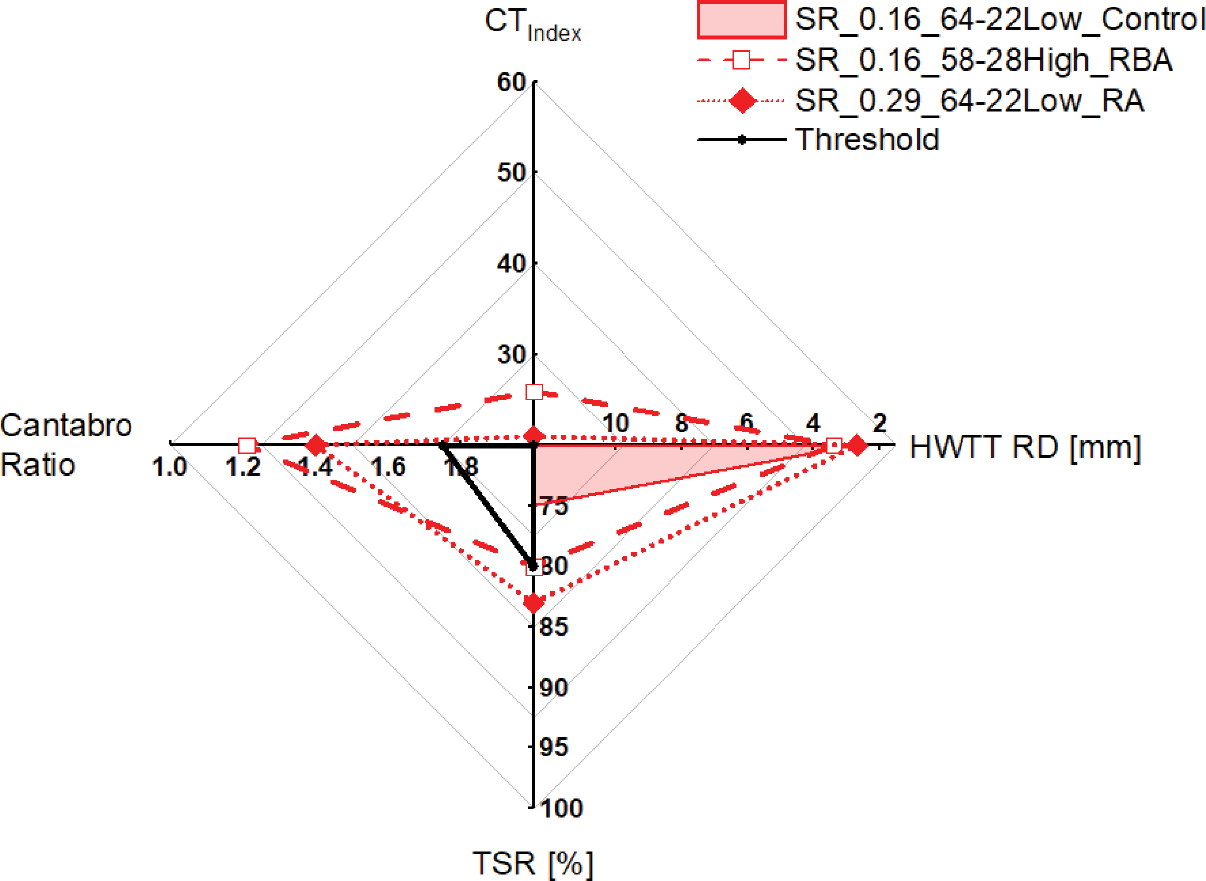
Figure 20, Figure 21, and Figure 22 combine several performance test parameters in a single diagram for the NR, NS, and SR mixtures, respectively. These performance diagrams allow for concurrent assessment of surface cracking, rutting, moisture susceptibility, and raveling and observation of the effects of increased RBR, additives, and high RAM and moisture damage mitigation strategies. Each spoke of the performance diagram shows a performance parameter with improved values increasing radially outward. These performance diagrams compare the robust high RBR mixtures with appropriate high RAM and moisture damage strategies to the typical RBR control mixtures, also with appropriate strategies as needed. The robust high RBR mixtures were developed using the stepwise approach (Figure 4). The stepwise approach was applied more completely to the NR and SR mixtures, while only a subset of parameters was determined for the NS and SS mixtures.
Figure 20 shows that an LAS agent was added to the typical 0.21 RBR control NR mixture in the third and fourth steps of the approach to ensure adequate moisture resistance, but the cracking and rutting performance evaluated in the first and second steps did not include an LAS agent. Both robust high 0.37 and 0.44 RBR NR mixtures with high RAM strategies (NR_0.37_58-28Low_RA and NR_0.44_58-28Low_RBA) exhibited decreased CTIndex but decreased rut depth and Cantabro

ratio, increased TSR, and increased or equivalent DCT Gf compared with those for the typical 0.21 RBR control NR mixture. Because these robust mixtures all met the preliminary thresholds (Table 9 and Table 10), these changes represent a shift in some of the performance parameters compared to the typical RBR control mixture. The high 0.44 RBR RAP/RAS NR mixture showcased the effect of increased RBR with RAS with similar CTIndex and decreased DCT Gf but decreased rut depth and Cantabro ratio and increased TSR versus those for the high 0.37 RBR NR mixture with only RAP.
Figure 21 shows that the typical 0.20 RBR control NS mixture met the cracking threshold without incorporating a high RAM strategy. This mixture exhibited the highest CTIndex, DCT, TSR, and similar rut depth values compared with the robust high 0.29 RBR and 0.33 RAP/RAS RBR mixtures (NS_0.29_58-28Low_RBA and NS_0.33_58-28Low_LAS), where results are available. Thus, the effect of increased RBR and RBA strategy in the high 0.29 RBR mixture produced a reduction in CTIndex, DCT, and TSR and similar rut depth values compared with the robust typical 0.20 RBR control NS mixture. The high 0.33 RBR RAP/RAS NS mixture required LAS to ensure adequate moisture resistance; however, LAS was not necessary to meet the rutting performance requirements. Thus, compared with the robust high 0.29 RBR NS mixture with only RAP, this robust high 0.33 RAP/RAS NS mixture showed the effect of increased RBR with RAS and moisture-susceptible aggregates requiring LAS to pass the TSR threshold but resulting in increased rut depth.
Figure 22 highlights that the typical 0.16 RBR control SR mixture did not meet the cracking thresholds in the first step of the approach until a hybrid high RAM strategy of softer + decreased RBA was used. This robust typical 0.16 RBR control mixture (SR_0.16_58-28High_RBA) exhibited higher rut depth but increased CTIndex and TSR than the typical 0.16 RBR control mixture without strategies, for which Cantabro ratio was not available. The robust high 0.29 RBR
SR mixture with high RAM strategy (SR_0.29_64-22Low_RA) exhibited decreased CTIndex and increased rut depth and Cantabro ratio but increased TSR compared with those for the robust typical 0.16 RBR control SR mixture (SR_0.16_58-28High_RBA). Because these robust mixtures met all the preliminary thresholds (Table 9 and Table 10), these changes represent a shift in some of the performance parameters compared with the typical RBR control mixture.
In general, based on the stepwise approach (Figure 4), the use of high RAM contents and the associated high RAM strategies required to provide sufficient cracking resistance after critical aging do not appear to create moisture susceptibility and raveling issues. If the mixture requires an ASA at typical RBR values, it will likely still need an ASA at high RBR values. In addition, some WMA additives provide anti-stripping benefits. Selection of the best high RAM strategy does depend on the material combinations (component materials and proportions), and therefore a variety of strategies should be considered for performance optimization. Decreased RBA may be the easiest to implement because it uses the same component materials, with any value less than 100% providing improved cracking resistance with aging. However, implementation of this strategy requires relaxing volumetrics of the mixture with the revised virgin binder content that accounts for decreased RBA. The value can be agreed upon through SHA industry working groups or estimated based on PGH of the RAP (Epps Martin et al. 2019). Recycling agents are also effective, but correct dosing and performance testing are imperative to preclude rutting and moisture susceptibility that may arise from the decreased wet and dry tensile strengths of the mixture. Using a substitute binder—a softer virgin binder, a binder with an increased capacity for use with RAM (higher ΔTc), or a PMA—does not appear to be as effective based on the results of this project. Finally, with extremely stiff RAP (or high RAM or RAS contents), a hybrid combination strategy may be required, such as using a softer virgin binder together with a decreased RBA.
3.1 Component Materials and Proportions
This section describes the results of characterizing the virgin and RAM binders and the RAM sources. In addition, the RA doses and selected decreased RBA values are provided for those two high RAM mitigation strategies.
3.1.1 Binders
Rheological results, namely PG and ∆Tc, for the virgin and RAM binders are shown in Table 11, Figure 23, and Figure 24. All the binders were aged following the standard Superpave procedures, including RTFO per AASHTO T 240 and 20-h PAV at 100°C per AASHTO R 28. It is interesting to note that the SE1 RAP binder is almost as stiff as the two RAS binders. The SE1 RAP comes from Alabama, where the DOT permits using RAS in its mixtures. Therefore, the presence of RAS with a PGH close to 190°C is likely the reason the SE1 RAP has a high PGH.
Results from further rheological characterization of the virgin and RAM binders with aging at intermediate temperature are provided in Table 12. Some of the RAM binders could not be characterized for some of the extended aging conditions because of extreme stiffness and embrittlement. Figure 25 and Figure 26 present the available G-R parameter results on a black space diagram, with the binder |G∗| at 15°C and 0.005 rad/s plotted on the y-axis versus δ at the same condition on the x-axis. The bold and dashed curves represent the two preliminary G-R parameter criteria of 600 kPa and 180 kPa, respectively, for the onset of block cracking and visible surface cracking. However, these criteria were developed based on a limited number of unmodified binders and a PG 58-28 climate in Pennsylvania. Their broad applicability, therefore, remains unknown and needs further investigation. This observation particularly applies to the 70-28 and 76-22 PMAs in this project, for which the damage zone (Figure 25) would likely shift to higher values of G-R.
Table 11. PG and ∆Tc results for virgin and RAM binders.
| Region | Binder | Classification | Continuous PG | PG | ΔTc |
|---|---|---|---|---|---|
| North/Freeze | PG 58-28 Low ΔTc =+0.4 |
Control | 59.6-28.6 | 58-28 | +0.4 |
| PG 58-28 High ΔTc =+2.0 |
Higher ΔTc | 60.3-28.8 | 58-28 | +2.0 | |
| PG 52-34 ΔTc =+2.5 |
Softer | 53.6-35.5 | 52-34 | +2.5 | |
| PG 70-28 ΔTc =−0.6 |
PMA | 72.3-31.4 | 70-28 | −0.6 | |
| NE RAP | RAP | 92.6-9.5 | 88-4 | −7.8 | |
| NE TOAS | RAS | 152.3+33.7a | 148+32a | −58.6 | |
| MidW RAP | RAP | 84.8-17.6 | 82-16 | −7.4 | |
| MidW TOAS | RAS | 151.0+44.0a | 148+44a | −94.1 | |
| South/No Freeze | PG 64-22 Low ΔTc =−1.4 |
Control | 65.7-25.3 | 64-22 | −1.4 |
| PG 64-22 High ΔTc =+1.3 |
Higher ΔTc | 65.0-26.4 | 64-22 | +1.3 | |
| PG 58-28 High ΔTc =+2.0 |
Softer | 60.3-28.8 | 58-28 | +2.0 | |
| PG 76-22 ΔTc =−1.0 |
PMA | 77.4-24.6 | 76-22 | −1.0 | |
| SE1 RAP | RAP | 126.7+0.3 | 124+2 | −12.8 | |
| SE2 RAP | RAP | 99.3-11.4 | 94-10 | −9.9 |
aResults are estimated based on 4-mm DSR results for reference only.

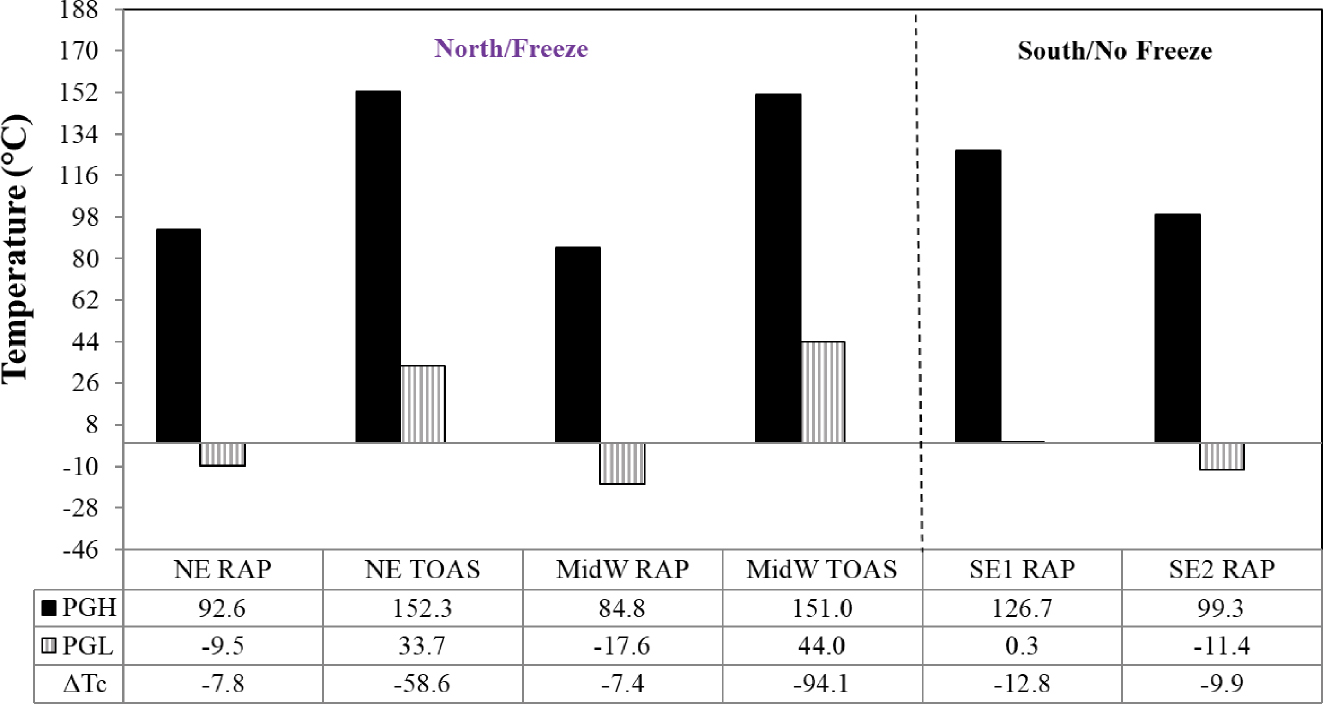
Table 12. G-R15°C, 0.005 rad/s parameter results for virgin and RAM binders.
| Region | Binder | Classification | G-R at 15°C and 0.005 rad/s (kPa) | ||
|---|---|---|---|---|---|
| Unaged | RTFO + PAV20 | RTFO + PAV40 | |||
| North/Freeze | PG 58-28 Low ΔTc = +0.4 |
Control | 0.3 | 21.7 | 111.3 |
| PG 58-28 High ΔTc = +2.0 |
Higher ΔTc | 0.1 | 16.3 | 88.3 | |
| PG 52-34 ΔTc = +2.5 |
Softer | 0.007a | 4.2 | 30.3 | |
| PG 70-28 ΔTc = –0.6 |
PMA | 4.3 | 81.9 | 299.2 | |
| NE RAP | RAP | 416.3 | 6,589.2 | ||
| NE TOAS | RAS | 9,087.2 | |||
| MidW RAP | RAP | 371.1 | 1,078.8 | ||
| MidW TOAS | RAS | 18,696.5 | |||
| South/No Freeze | PG 64-22 Low ΔTc = −1.4 |
Control | 0.7 | 205.8 | 966.8 |
| PG 64-22 High ΔTc = +1.3 |
Higher ΔTc | 0.7 | 47.0 | 189.2 | |
| PG 58-28 High ΔTc = +2.0 |
Softer | 0.1 | 16.3 | 88.3 | |
| PG 76-22 ΔTc = −1.0 |
PMA | 8.2 | 191.6 | 736.9 | |
| SE1 RAP | RAP | 7,882.1 | |||
| SE2 RAP | RAP | 1,868.4 | 5,333.4 | ||
aReported to three decimals to indicate value above zero.

As expected, the North/Freeze virgin and RAP binders exhibited lower G-R parameter values than their South/No Freeze counterparts for all aging conditions when comparisons were possible. The North/Freeze unmodified binders did not enter the cracking damage zone even after extended aging. Only the unmodified 64-22_Low exceeded the criterion for visible surface cracking after PAV40. Furthermore, the 64-22_Low binder exhibited the highest relative change in black space, indicating greater aging susceptibility.

Note that the G-R damage zone (180–600 kPa) in Figure 25 and Figure 26 was developed for unmodified binders as used in a PG 58-28 climate. If another PG grade, such as PG 64-22, were to be used in the same climate, the same G-R limits would apply. However, if the PG 64-22 binder is used in a PG 64-22 climate, either the G-R damage zone should be moved up to higher moduli or the G-R test temperature should be adjusted upward, as is done for the intermediate |G∗|sin(δ) fatigue parameter in current PG specifications. Guidelines for this approach were developed in NCHRP Project 9-59 (Christensen and Tran 2022), as discussed subsequently.
As expected, the MidW RAP showed the lowest G-R parameter values before and after aging, showing potential to be used for high RBR mixtures. The other three RAP materials had different values of G-R as initially extracted, but after further oxidation, all three exhibited similar G-R parameter values that greatly exceeded the upper limit for the damage zone. Both RAS binders and the SE1 RAP binder exhibited the highest G-R parameters, which included absurdly low phase angles indicative of extremely slow relaxation properties.
The PMA binders exhibited steeper slopes than those for the unmodified binders, but their aging pathways were shorter (better aging susceptibility) for the same aging conditions. Results are subject to the assumption that a black space diagram is valid for comparing all binders, with the G-R parameter damage zone limits in Figure 25 defined only for unmodified binders as used in a PG 58-28 climate.
Results from further rheological characterization (AASHTO M 332) of the virgin and RAM binders at high temperatures are provided in Table 13, Figure 27, and Figure 28.
Table 13. MSCR results for virgin and RAM binders.
| Region | Binder | Classification | MSCR Parameter/Rating | |||
|---|---|---|---|---|---|---|
| Testing Temperature | Jnr @ 3.2 kPa (1/kPa) | %R @ 3.2 kPa (%) | Traffic Rating | |||
| North/Freeze | PG 58-28 Low DTc = +0.4 |
Control | 58℃ | 3.77 | 0.0 | S |
| PG 58-28 High DTc = +2.0 |
Higher DTc | 58℃ | 3.31 | 0.0 | S | |
| PG 52-34 DTc = +2.5 |
Softer | 52℃ | 1.50 | 3.0 | H | |
| PG 70-28 DTc = −0.6 |
PMA | 58℃ | 0.11 | 72.8 | E | |
| NE RAP | RAP | 58℃ | 6.6E-03a | 62.3 | E | |
| NE TOAS | RAS | 58℃ | 3.6E-03a | 96.5 | E | |
| MidW RAP | RAP | 58℃ | 5.1E-02a | 43.2 | E | |
| MidW TOAS | RAS | 58℃ | 3.7E-03a | 96.4 | E | |
| South/No Freeze | PG 64-22 Low DTc = −1.4 |
Control | 64℃ | 3.19 | 0.2 | S |
| PG 64-22 High DTc = +1.3 |
Higher DTc | 64℃ | 3.95 | 0.0 | S | |
| PG 58-28 High DTc = +2.0 |
Softer | 58℃ | 3.31 | 0.0 | S | |
| PG 76-22 DTc = −1.0 |
PMA | 64℃ | 0.30 | 61.6 | E | |
| SE1 RAP | RAP | 64℃ | 7.0E-04a | 86.5 | E | |
| SE2 RAP | RAP | 64℃ | 1.2E-02a | 66.1 | E | |
NOTE: E = extreme traffic loading (>30 million ESALs and <20 km/h); H = heavy traffic loading (10–30 million ESALs or 20–70 km/h); S = standard traffic loading (<10 million ESALs and >70 km/h).
aReported in scientific notation to indicate value above zero.
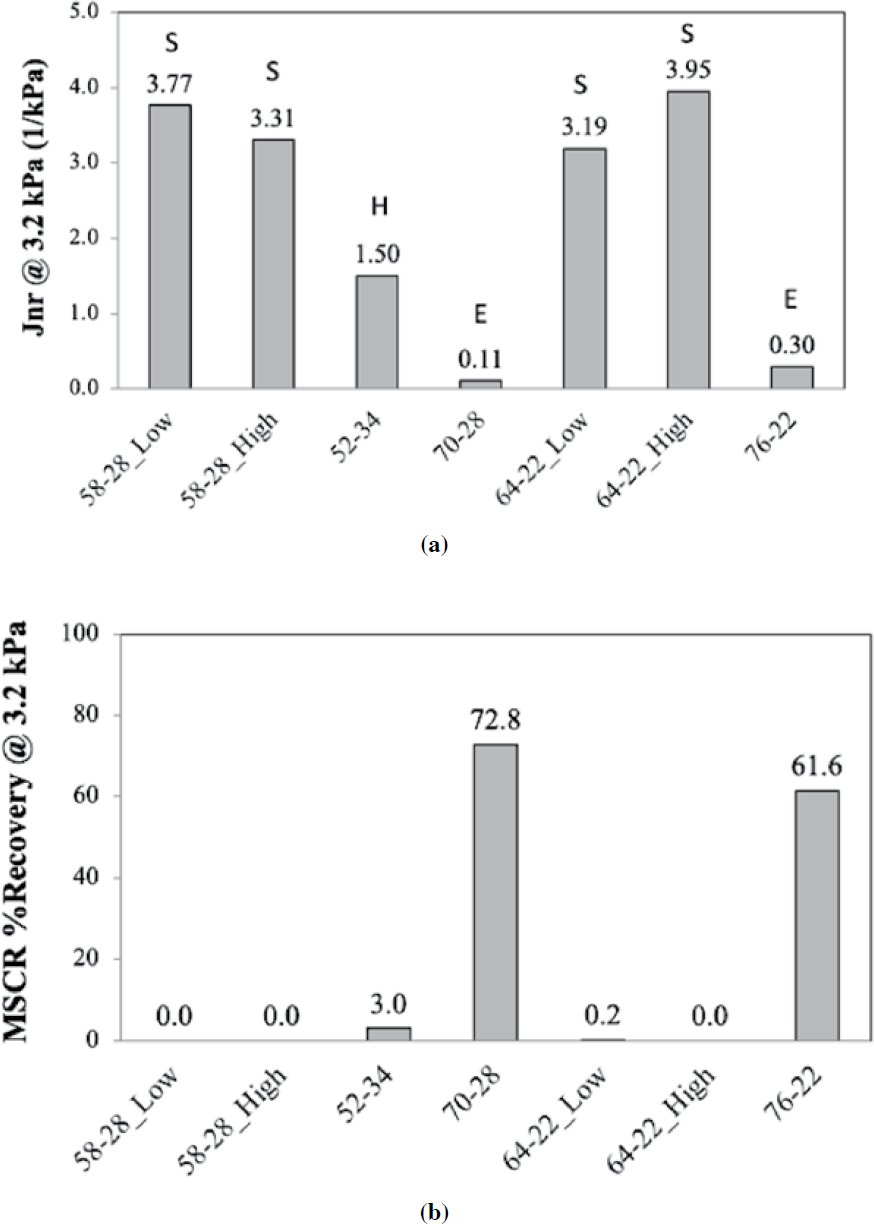
Both PMA binders exhibited lower Jnr3.2 results, better traffic ratings, and higher %R3.2 values than their unmodified control and softer counterparts, indicating the improved rutting resistance of binders modified with polymeric additives. All the RAM binders had almost negligible Jnr3.2 values and high traffic ratings at 58°C or 64°C. Their %R3.2 values should be interpreted cautiously because they are influenced by the low Jnr3.2 values, which are also influenced by the selected testing temperature. The behavior of the MSCR %R3.2 parameter is highly influenced by the creep compliance Jnr of binders, regardless of the presence and content of polymer (Rodezno et al. 2021; Bahia, Swiertz, et al. 2018).
Further analysis was also conducted on the frequency sweep rheological data for the virgin binders before and after aging, following the recommendations from NCHRP Project 9-59 (Christensen and Tran 2022). Table 14 shows the G-R parameter results determined at 10 rad/s (G-R10rad/s) at specific temperatures based on the PGL and comparisons to a maximum threshold of 5,000 kPa after RTFO + PAV20 and 8,000 kPa after RTFO + PAV40. Table 15 shows the R-value results and comparisons to ranges of 1.5 to 2.5 after RTFO + PAV20 and 2.0 to 3.2 after RTFO + PAV40. These R-value results were obtained from DSR master curve analysis using the

Christensen-Anderson model at a reference temperature of 15°C with variable glassy modulus Gg and |G∗| greater than 105 Pa.
The ranges for good binder performance are provided to ensure that the R-value is not too high—which otherwise would tend to contribute to the rapid accumulation of fatigue damage in thin pavement structures, especially at low temperatures—and that it is not too low—which otherwise would tend to contribute to poor fatigue performance in thick pavement structures. High values of R reflect poorer binder relaxation properties, such as brittleness observed after extensive oxidative aging. Therefore, when considering only non-load-associated, age-induced surface distresses such as block cracking or raveling, an upper limit on the R-value is crucial but the lower limit is likely unnecessary. Only two virgin binders (64-22_Low and 76-22) did not meet these new G-R limits with aging, and two different binders (52-34 and 70-28) did not meet the proposed R-value limits after RTFO + PAV20. These analyses were not conducted for the RAM binders because testing temperatures for binders with PGL above −10°C were unavailable (Christensen and Tran 2022).
Caution is needed when using the G-R parameter (and possibly the R-value) for the PMA binders (70-28 and 76-22) because polymer modification can significantly increase failure strain at a given
Table 14. G-R10 rad/s parameter results for virgin binders.
| Region | Binder | Classification | G-R at 10 rad/s (kPa) | |||
|---|---|---|---|---|---|---|
| Temperaturea (℃) | Unaged | RTFO + PAV20b | RTFO + PAV40c | |||
| North/Freeze | PG 58-28 Low ΔTc = +0.4 |
Control | 22℃ | 245.3 | 2,637.0 Pass |
4,644.0 Pass |
| PG 58-28 High ΔTc = +2.0 |
Higher ΔTc | 22℃ | 73.2 | 2,081.0 Pass |
5,693.0 Pass |
|
| PG 52-34 ΔTc = +2.5 |
Softer | 19℃ | 28.5 | 1,167.0 Pass |
3,486.0 Pass |
|
| PG 70-28 ΔTc = −0.6 |
PMA | 22℃ | 192.0 | 2,674.0 Pass |
7,554.0 Pass |
|
| South/No Freeze | PG 64-22 Low ΔTc = −1.4 |
Control | 25℃ | 215.7 | 5,445.0 Fail |
11,680.0 Fail |
| PG 64-22 High ΔTc = +1.3 |
Higher ΔTc | 25℃ | 181.0 | 2,090.0 Pass |
5,151.0 Pass |
|
| PG 58-28 High ΔTc = +2.0 |
Softer | 22℃ | 73.2 | 2,081.0 Pass |
5,693.0 Pass |
|
| PG 76-22 ΔTc = −1.0 |
PMA | 25℃ | 462.2 | 5,241.0 Fail |
10,270.0 Fail |
|
aTest temperature based on PGL (Christensen and Tran 2022).
bPassing criterion after RTFO + PAV20: G-R ≤ 5,000 kPa at 10 rad/s.
cPassing criterion after RTFO + PAV40: G-R ≤ 8,000 kPa at 10 rad/s.
binder modulus. This issue is being addressed by NCHRP Project 9-60, as noted in a publication by Elwardany et al. (2020) that recommends controlling both relaxation and low-temperature failure properties measured in the asphalt binder cracking device test in future PG binder specifications.
Additional analysis was conducted on the frequency sweep rheological data for the virgin binders before and after aging to determine several rheological parameters, including crossover frequency (ωc), crossover modulus (Gc), crossover temperature (TGc), δ at |G∗| = 8.967 MPa and 15°C (variable
Table 15. R-value results for virgin binders.
| Region | Binder | Classification | R-value | ||
| Unaged | RTFO + PAV20a | RTFO + PAV40b | |||
| North/Freeze | PG 58-28 Low ΔTc = +0.4 |
Control | 1.7 | 2.3 Pass |
2.4 Pass |
| PG 58-28 High ΔTc = +2.0 |
Higher ΔTc | 1.6 | 2.1 Pass |
2.4 Pass |
|
| PG 52-34 ΔTc = +2.5 |
Softer | 1.8 | 2.6 Fail |
2.8 Pass |
|
| PG 70-28 ΔTc = −0.6 |
PMA | 2.2 | 2.9 Fail |
2.9 Pass |
|
| South/No Freeze | PG 64-22 Low ΔTc = −1.4 |
Control | 1.7 | 2.2 Pass |
2.9 Pass |
| PG 64-22 High ΔTc = +1.3 |
Higher ΔTc | 1.7 | 2.1 Pass |
2.2 Pass |
|
| PG 58-28 High ΔTc = +2.0 |
Softer | 1.6 | 2.1 Pass |
2.4 Pass |
|
| PG 76-22 ΔTc = −1.0 |
PMA | 1.9 | 2.1 Pass |
2.5 Pass |
|
aPassing criterion after RTFO + PAV20: R-value between 1.5 to 2.5.
bPassing criterion after RTFO + PAV40: R-value between 2.0 to 3.2.
frequency), δ at |G∗| = 10 MPa and 10 rad/s (variable temperature), and the G-R parameter at 10 Hz (G-R10 Hz) over a range of intermediate temperatures (i.e., 15°C, 17°C, 19°C, 22°C, 25°C, 27°C, and 29°C). Results for ωc, Gc, TGc, and δ are provided in Table 16, Table 17, and Table 18. Results for G-R10 Hz are provided in Table 19, Table 20, and Table 21. These refined results and the previously reported results for ΔTc (Table 11), R-value (Table 15), and G-R10 rad/s and several intermediate temperatures (i.e., 15°C, 17°C, 19°C, 22°C, 25°C, 27°C, and 29°C) (Table 22, Table 23, and Table 24) were used to compare IDEAL-CT results to complete the binder versus mixture analysis.
3.1.2 RAP
Table 25 provides the RAM binder contents by automated extraction, and Figure 29 presents the RAP washed gradations after removing the binder in an ignition oven.
Table 16. ωc, Gc, TGc, and δ results for virgin binders, unaged.
| Region | Binder | ωc (rad/s) | Gc (Pa) | TGc (°C) | δ at |G*| = 8.967 MPa, 15°C (°) | δ at |G*| = 10 MPa, 10 rad/s (°) |
|---|---|---|---|---|---|---|
| North/Freeze | PG 58-28 Low ΔTc = +0.4 |
1.09E+02 | 1.86E+07 | 7.3 | 51.5 | 50.4 |
| PG 58-28 High ΔTc = +2.0 |
6.90E+02 | 3.28E+07 | 1.4 | 56.3 | 55.6 | |
| PG 52-34 ΔTc = +2.5 |
7.28E+03 | 3.96E+07 | −8.2 | 55.5 | 54.4 | |
| PG 70-28 ΔTc = −0.6 |
2.24E+02 | 1.67E+07 | 4.4 | 50.5 | 49.9 | |
| South/No Freeze | PG 64-22 Low ΔTc = −1.4 |
6.23E+01 | 1.97E+07 | 8.4 | 52.0 | 51.4 |
| PG 64-22 High ΔTc = +1.3 |
8.54E+01 | 2.14E+07 | 7.2 | 52.9 | 52.3 | |
| PG 58-28 High ΔTc = +2.0 |
6.90E+02 | 3.28E+07 | 1.4 | 56.3 | 55.6 | |
| PG 76-22 ΔTc = −1.0 |
2.31E+01 | 1.53E+07 | 11.6 | 49.9 | 49.0 |
Table 17. ωc, Gc, TGc, and δ results for virgin binders, RTFO + PAV20.
| Region | Binder | ωc (rad/s) | Gc (Pa) | TGc (°C) | δ at |G*| = 8.967 MPa, 15°C (°) | δ at |G*| = 10 MPa, 10 rad/s (°) |
|---|---|---|---|---|---|---|
| North/Freeze | PG 58-28 Low ΔTc = +0.4 |
1.76E+00 | 4.74E+06 | 20.7 | 40.7 | 39.9 |
| PG 58-28 High ΔTc = +2.0 |
5.92E+00 | 8.91E+06 | 15.7 | 45.3 | 44.8 | |
| PG 52-34 ΔTc = +2.5 |
2.52E+01 | 6.77E+06 | 10.7 | 44.1 | 43.4 | |
| PG 70-28 ΔTc = −0.6 |
6.76E-01 | 3.01E+06 | 21.2 | 40.7 | 40.1 | |
| South/No Freeze | PG 64-22 Low ΔTc = −1.4 |
2.34E-02 | 3.83E+06 | 34.6 | 39.8 | 39.4 |
| PG 64-22 High ΔTc = +1.3 |
1.69E+00 | 6.93E+06 | 19.9 | 43.7 | 43.2 | |
| PG 58-28 High ΔTc = +2.0 |
5.92E+00 | 8.91E+06 | 15.7 | 45.3 | 44.8 | |
| PG 76-22 ΔTc = −1.0 |
2.61E-01 | 5.53E+06 | 25.8 | 42.3 | 41.9 |
Table 18. ωc, Gc, TGc, and δ results for virgin binders, RTFO + PAV40.
| Region | Binder | ωc (rad/s) | Gc (Pa) | TGc (°C) | δ at |G*| = 8.967 MPa, 15°C (°) | δ at |G*| = 10 MPa, 10 rad/s (°) |
|---|---|---|---|---|---|---|
| North/Freeze | PG 58-28 Low ΔTc = +0.4 |
2.23E-01 | 2.69E+06 | 26.6 | 37.1 | 36.4 |
| PG 58-28 High ΔTc = +2.0 |
5.88E-01 | 5.03E+06 | 24.2 | 41.7 | 40.9 | |
| PG 52-34 ΔTc = +2.5 |
1.52E+00 | 3.17E+06 | 20.7 | 39.4 | 38.8 | |
| PG 70-28 ΔTc = −0.6 |
3.40E-02 | 1.54E+06 | 32.4 | 36.4 | 35.9 | |
| South/No Freeze | PG 64-22 Low ΔTc = −1.4 |
4.57E-03 | 1.36E+06 | 40.2 | 35.6 | 35.1 |
| PG 64-22 High ΔTc = +1.3 |
2.35E-01 | 4.81E+06 | 26.4 | 41.7 | 41.3 | |
| PG 58-28 High ΔTc = +2.0 |
5.88E-01 | 5.03E+06 | 24.2 | 41.7 | 40.9 | |
| PG 76-22 ΔTc = −1.0 |
2.50E-02 | 2.84E+06 | 34.2 | 38.8 | 38.4 |
Table 19. G-R10 Hz Parameter results for virgin binders, unaged.
| Region | Binder | G-R at 10 Hz (kPa) | ||||||
|---|---|---|---|---|---|---|---|---|
| 15℃ | 17℃ | 19℃ | 22℃ | 25℃ | 27℃ | 29℃ | ||
| North/Freeze | PG 58-28 Low ΔTc = +0.4 |
8,980.0 | 5,667.0 | 3,340.0 | 1,598.0 | 681.1 | 393.2 | 213.4 |
| PG 58-28 High ΔTc = +2.0 |
3,423.0 | 2,026.0 | 1,182.0 | 553.2 | 239.0 | 141.8 | 81.2 | |
| PG 52-34 ΔTc = +2.5 |
555.2 | 333.5 | 203.6 | 92.7 | 45.0 | 26.9 | 15.9 | |
| PG 70-28 ΔTc = −0.6 |
4,843.0 | 3,128.0 | 1,933.0 | 999.8 | 484.3 | 311.8 | 202.3 | |
| South/No Freeze | PG 64-22 Low ΔTc = −1.4 |
14,330.0 | 9,247.0 | 5,681.0 | 2,910.0 | 1,361.0 | 849.6 | 503.3 |
| PG 64-22 High ΔTc = +1.3 |
12,360.0 | 7,659.0 | 4,801.0 | 2,403.0 | 1,142.0 | 714.9 | 421.4 | |
| PG 58-28 High ΔTc = +2.0 |
3,423.0 | 2,026.0 | 1,182.0 | 553.2 | 239.0 | 141.8 | 81.2 | |
| PG 76-22 ΔTc = −1.0 |
22,000.0 | 14,010.0 | 9,284.0 | 4,665.0 | 2,416.0 | 1,477.0 | 917.5 | |
Table 20. G-R10 Hz parameter results for virgin binders, RTFO + PAV20.
| Region | Binder | G-R at 10 Hz (kPa) | ||||||
|---|---|---|---|---|---|---|---|---|
| 15℃ | 17℃ | 19℃ | 22℃ | 25℃ | 27℃ | 29℃ | ||
| North/Freeze | PG 58-28 Low ΔTc = +0.4 |
27,870.0 | 19,880.0 | 14,170.0 | 8,560.0 | 5,043.0 | 3,478.0 | 2,307.0 |
| PG 58-28 High ΔTc = +2.0 |
26,900.0 | 18,770.0 | 13,460.0 | 7,629.0 | 4,462.0 | 2,963.0 | 2,022.0 | |
| PG 52-34 ΔTc = +2.5 |
8,466.0 | 6,006.0 | 4,131.0 | 2,494.0 | 1,412.0 | 996.3 | 694.3 | |
| PG 70-28 ΔTc = −0.6 |
26,110.0 | 18,350.0 | 13,360.0 | 7,945.0 | 4,886.0 | 3,420.0 | 2,427.0 | |
| South/No Freeze | PG 64-22 Low ΔTc = −1.4 |
66,990.0 | 50,900.0 | 37,940.0 | 24,380.0 | 15,260.0 | 11,040.0 | 7,776.0 |
| PG 64-22 High ΔTc = +1.3 |
40,330.0 | 28,420.0 | 20,270.0 | 12,000.0 | 7,261.0 | 5,036.0 | 3,469.0 | |
| PG 58-28 High ΔTc = +2.0 |
26,900.0 | 18,770.0 | 13,460.0 | 7,629.0 | 4,462.0 | 2,963.0 | 2,022.0 | |
| PG 76-22 ΔTc = −1.0 |
76,580.0 | 56,980.0 | 41,920.0 | 25,800.0 | 15,710.0 | 11,030.0 | 7,680.0 | |
Table 21. G-R10 Hz parameter results for virgin binders, RTFO + PAV40.
| Region | Binder | G-R at 10 Hz (kPa) | ||||||
|---|---|---|---|---|---|---|---|---|
| 15℃ | 17℃ | 19℃ | 22℃ | 25℃ | 27℃ | 29℃ | ||
| North/Freeze | PG 58-28 Low ΔTc = +0.4 |
36,600.0 | 27,280.0 | 19,630.0 | 12,590.0 | 7,631.0 | 5,586.0 | 3,872.0 |
| PG 58-28 High ΔTc = +2.0 |
50,200.0 | 36,280.0 | 27,240.0 | 16,780.0 | 10,640.0 | 7,561.0 | 5,372.0 | |
| PG 52-34 ΔTc = +2.5 |
18,080.0 | 13,150.0 | 98,90.0 | 6,171.0 | 3,932.0 | 2,838.0 | 2,027.0 | |
| PG 70-28 ΔTc = −0.6 |
48,390.0 | 37,290.0 | 28,230.0 | 18,590.0 | 12,060.0 | 9,037.0 | 6,622.0 | |
| South/No Freeze | PG 64-22 Low ΔTc = −1.4 |
96,630.0 | 75,650.0 | 60,400.0 | 40,390.0 | 27,550.0 | 20,600.0 | 15,950.0 |
| PG 64-22 High ΔTc = +1.3 |
70,690.0 | 52,430.0 | 38,950.0 | 24,090.0 | 15,100.0 | 10,850.0 | 7,756.0 | |
| PG 58-28 High ΔTc = +2.0 |
50,200.0 | 36,280.0 | 27,240.0 | 16,780.0 | 10,640.0 | 7,561.0 | 5,372.0 | |
| PG 76-22 ΔTc = −1.0 |
10,5000.0 | 80,820.0 | 63,500.0 | 41,120.0 | 26,760.0 | 19,350.0 | 14,530.0 | |
Table 22. G-R10 rad/s parameter results for virgin binders, unaged.
| Region | Binder | G-R at 10 rad/s (kPa) | ||||||
|---|---|---|---|---|---|---|---|---|
| 15℃ | 17℃ | 19℃ | 22℃ | 25℃ | 27℃ | 29℃ | ||
| North/Freeze | PG 58-28 Low ΔTc = +0.4 |
2,059.0 | 1,172.0 | 623.4 | 245.3 | 80.0 | 40.1 | 20.0 |
| PG 58-28 High ΔTc = +2.0 |
601.4 | 326.2 | 180.5 | 73.2 | 28.6 | 16.0 | 8.8 | |
| PG 52-34 ΔTc = +2.5 |
82.5 | 49.2 | 28.5 | 12.3 | 5.5 | 3.1 | 1.8 | |
| PG 70-28 ΔTc = −0.6 |
1,092.0 | 653.3 | 389.3 | 192.0 | 94.3 | 63.4 | 42.7 | |
| South/No Freeze | PG 64-22 Low ΔTc = −1.4 |
3,417.0 | 2,024.0 | 1,181.0 | 531.9 | 215.7 | 123.0 | 66.3 |
| PG 64-22 High ΔTc = +1.3 |
2,812.0 | 1,610.0 | 959.6 | 416.9 | 181.0 | 104.9 | 58.6 | |
| PG 58-28 High ΔTc = +2.0 |
601.4 | 326.2 | 180.5 | 73.2 | 28.6 | 16.0 | 8.8 | |
| PG 76-22 ΔTc = −1.0 |
6,076.0 | 3,658.0 | 2,253.0 | 999.6 | 462.2 | 265.7 | 161.9 | |
Table 23. G-R10 rad/s Parameter results for virgin binders, RTFO + PAV20.
| Region | Binder | G-R at 10 rad/s (kPa) | ||||||
|---|---|---|---|---|---|---|---|---|
| 15℃ | 17℃ | 19℃ | 22℃ | 25℃ | 27℃ | 29℃ | ||
| North/Freeze | PG 58-28 Low ΔTc = +0.4 |
10,520.0 | 7,099.0 | 4,920.0 | 2,637.0 | 1,423.0 | 894.6 | 562.0 |
| PG 58-28 High ΔTc = +2.0 |
8,746.0 | 5,941.0 | 3,970.0 | 2,081.0 | 1,098.0 | 695.4 | 458.1 | |
| PG 52-34 ΔTc = +2.5 |
2,616.0 | 1,748.0 | 1,167.0 | 652.4 | 345.0 | 234.4 | 153.3 | |
| PG 70-28 ΔTc = −0.6 |
9,848.0 | 6,727.0 | 4,781.0 | 2,674.0 | 1,567.0 | 1,052.0 | 738.1 | |
| South/No Freeze | PG 64-22 Low ΔTc = −1.4 |
28,900.0 | 21,140.0 | 15,570.0 | 9,163.0 | 5,445.0 | 3,715.0 | 2,553.0 |
| PG 64-22 High ΔTc = +1.3 |
14,200.0 | 9,832.0 | 6,904.0 | 3,732.0 | 2,090.0 | 1,352.0 | 902.6 | |
| PG 58-28 High ΔTc = +2.0 |
8,746.0 | 5,941.0 | 3,970.0 | 2,081.0 | 1,098.0 | 695.4 | 458.1 | |
| PG 76-22 ΔTc = −1.0 |
31,320.0 | 22,400.0 | 16,230.0 | 9,128.0 | 5,241.0 | 3,458.0 | 2,345.0 | |
Table 24. G-R10 rad/s parameter results for virgin binders, RTFO + PAV40.
| Region | Binder | G-R at 10 rad/s (kPa) | ||||||
|---|---|---|---|---|---|---|---|---|
| 15℃ | 17℃ | 19℃ | 22℃ | 25℃ | 27℃ | 29℃ | ||
| North/Freeze | PG 58-28 Low ΔTc = +0.4 |
15,890.0 | 11,430.0 | 7,905.0 | 4,644.0 | 2,611.0 | 1,775.0 | 1,163.0 |
| PG 58-28 High ΔTc = +2.0 |
19,470.0 | 13,710.0 | 9,950.0 | 5,693.0 | 3,383.0 | 2,265.0 | 1,565.0 | |
| PG 52-34 ΔTc = +2.5 |
6,742.0 | 4,797.0 | 3,486.0 | 2,024.0 | 1,220.0 | 833.2 | 584.4 | |
| PG 70-28 ΔTc = −0.6 |
21,800.0 | 16,210.0 | 12,200.0 | 7,554.0 | 4,769.0 | 3,389.0 | 2,433.0 | |
| South/No Freeze | PG 64-22 Low ΔTc = −1.4 |
47,130.0 | 36,380.0 | 28,350.0 | 18,070.0 | 11,680.0 | 8,600.0 | 6,478.0 |
| PG 64-22 High ΔTc = +1.3 |
28,930.0 | 20,440.0 | 14,790.0 | 8,530.0 | 5,151.0 | 3,524.0 | 2,477.0 | |
| PG 58-28 High ΔTc = +2.0 |
19,470.0 | 13,710.0 | 9,950.0 | 5,693.0 | 3,383.0 | 2,265.0 | 1,565.0 | |
| PG 76-22 ΔTc = −1.0 |
48,390.0 | 36,780.0 | 27,850.0 | 16,870.0 | 10,270.0 | 7,346.0 | 5,331.0 | |
Table 25. RAM binder contents by automated extraction.
| RAM | Pb (%) |
|---|---|
| NE RAP | 5.07 |
| NE TOAS | 25.18 |
| MidW RAP | 4.28 |
| MidW TOAS | 21.24 |
| SE1 RAP | 4.75a |
| SE2 RAP | 5.73 |
aBy ignition oven.
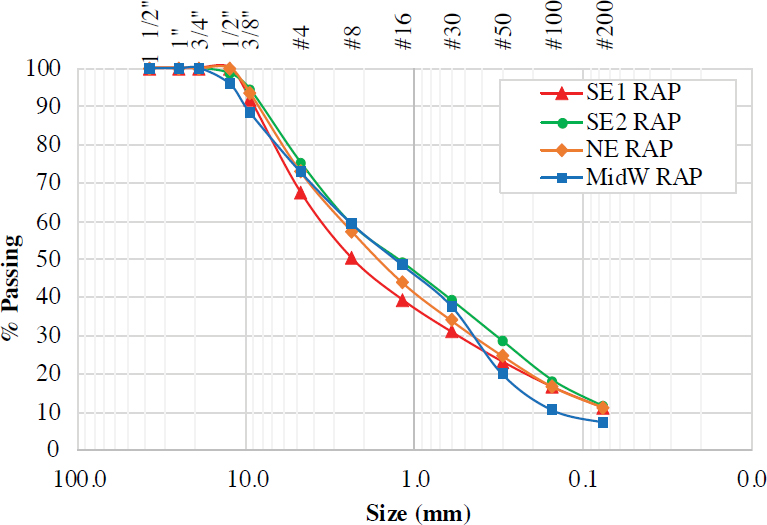
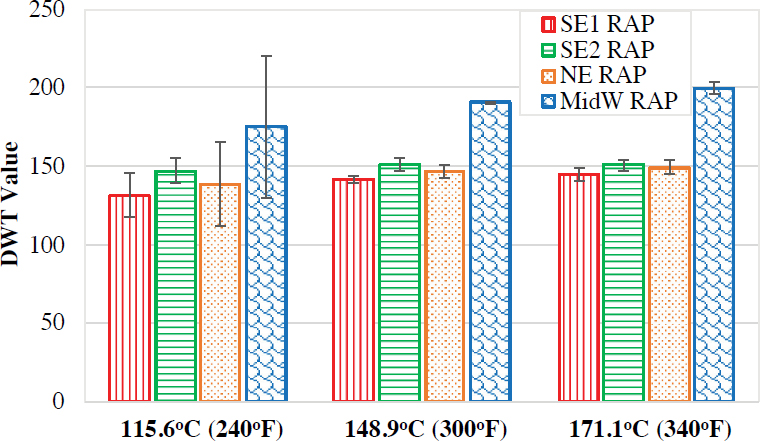
Figure 30 shows the DWT results at 115.6°C (240°F), 148.9°C (300°F), and 171.1°C (340°F) for the four RAP sources. Figure 31 shows the measured DoA results at 140°C and 170°C for the four RAP sources along with the RAP PGH values (Table 11) and the estimated BAF results at 140°C based on the equations in the original draft Standard Practice. As expected, the stiff SE1 RAP with high PGH also exhibits the lowest workability by DWT and the lowest RAP binder activation by both DoA and BAF.
Figure 32 combines the results and highlights a potential relationship between DoA and the ratio of RAP binder content (Table 25) to RAP PGH.
3.1.3 Aggregates
Table 26 provides the available durability properties for the four aggregate sources (with multiple stockpiles indicated) gathered from online databases and SHAs. These properties are F/T soundness per AASHTO T 103, Los Angeles abrasion (LAA) per AASHTO T 96, sand equivalent per AASHTO T 176, sodium or magnesium sulfate (NaSO4, MgSO4) soundness per AASHTO T 104, and absorption capacity (AC) per AASHTO T 354 and T 84/85.
3.1.4 Recycling Agent Doses
Recycling agent doses by weight of total binder for all relevant mixtures are shown in Table 27. These doses were recommended by the supplier based on measured virgin and RAP binder

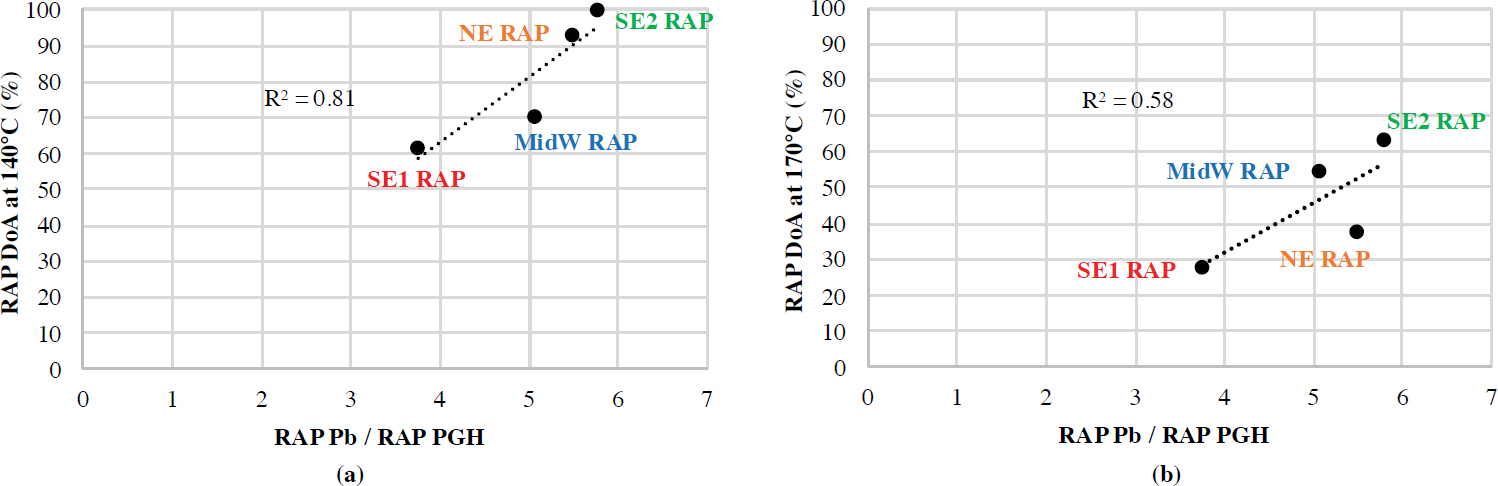
Table 26. Available aggregate durability properties.
| Aggregate | Type | F/T (%Loss) | LAA (%Loss) | Sand Equiv. | X_SO4 Soundness (%Loss) | AC |
|---|---|---|---|---|---|---|
| North Resistant | Granite Dolomite Granite |
23 Agg1 22 Agg2 |
96 Agg3 |
0.3 Agg1 (Na) |
0.55 Agg1 0.6 Agg2 1.00 Agg3 |
|
| South Resistant | Granite | 33 Agg1 36.2 Agg2 |
92 Agg3 |
0.1 Agg1 0.2 Agg2 (Na) |
0.8 Agg1 0.8 Agg2 0.5 Agg3 |
|
| North Susceptible | Gravel Granite Dolomite Granite |
0.0 Agg1 0.0 Agg2 2.5 Agg3 0.0 Agg4 |
24.3 Agg1 27.4 Agg2 21.5 Agg3 25.1 Agg4 |
0.8 Agg1 1.6 Agg2 0.4 Agg3 0.1 Agg4 (Na) |
0.88 Agg1 0.58 Agg2 0.87 Agg3 0.54 Agg4 |
|
| South Susceptible | Granite Gneiss |
48 Agg1 | 95 Agg2 87 Agg3 |
1.0 Agg1 (Mg) |
0.55 Agg1 0.30 Agg2 0.32 Agg3 |
Table 27. Recycling agent doses.
| Region | Mixture | Recycling Agent Dose (% by weight total binder) |
|---|---|---|
| North/Freeze | NR_0.37_58-28Low_RA | 4.8 |
| NS_0.29_58-28Low_RA | 2.8 | |
| South/No Freeze | SR_0.16_64-22Low_RA | 3.7 |
| SR_0.29_64-22Low_RA | 7.0 | |
| SS_0.39_64-22Low_RA | 4.9 |
properties (Table 11), target binder blend PG (PG 58-28 for North aggregates and Northeast and Midwest RAP sources and PG 64-22 for South aggregates and Southeast RAP sources), measured RAP binder contents and verified total binder contents (Pb), and RAP contents (Table 1) according to the following hybrid dose selection method that can be standardized for all recycling agents:
- Increase dose such that PGL = target PGL−3 and verify PGH < target PGH+5.9.
- If PGH > target PGH+6.0, increase dose further such that PGL = target PGL−5.9 and verify PGH < target PGH+5.9.
- If PGH still > target PGH+6.0, increase dose even further such that PGH = target PGH+5.9.
3.1.5 Decreased RAM Binder Availability
The RAP BAF equation at 150°C from the draft Standard Practice was used with the PGH values for three of the four RAP binders (Table 11), excluding the atypical, extremely stiff SE1 RAP, to estimate BAF values and select a decreased RAP RBA value of 85%. A decreased RAS RBA value of 75% was also selected based on the median and mode values from seven states surveyed in TxDOT Project 0-7062 (Epps Martin et al. 2021). Georgia DOT’s COAC method was used to adjust the total and virgin binder contents of some RAM mixtures for performance testing in the laboratory experiments.
3.2 North Moisture-Resistant Mixtures
This section describes the results of characterizing the NR mixtures with respect to surface cracking resistance, rutting and moisture susceptibility, raveling resistance, and characterization required to predict cracking performance.
3.2.1 Surface Cracking Resistance of NR Mixtures
Table 28, Figure 33, and Figure 34 compare the surface cracking resistance results (from the IDEAL-CT and DCT tests) for the 13 evaluated NR mixtures with the preliminary thresholds provided in Table 9. Figure 33 and Figure 34 include error bars representing ± one standard deviation from the mean and Tukey’s HSD pairwise comparisons, with the same letters indicating statistically equivalent results.
No high RAM mitigation strategy was needed for the typical 0.21 RBR NR control mixture, but high 0.37 and 0.44 RBR NR mixtures required an RA (NR_0.37_58-28Low_RA) or decreased RBA (NR_0.44_58-28Low_RBA) to meet the preliminary threshold for satisfactory surface cracking performance. These three mixtures were moved forward in the stepwise approach to assess balanced performance with respect to rutting and to evaluate moisture susceptibility. For the typical 0.21 RBR NR mixture, substitute virgin binders (with higher ΔTc or softer PG) did not improve cracking resistance. For the high 0.37 RBR NR mixture with only RAP, the effect of an RA was pronounced with a 99% improvement in CTIndex over the corresponding control mixture without strategies. The effect of a softer virgin binder was minor (+18%) and was comparable to the effect of decreased RBA (+49%), which was significant but not sufficient to meet the threshold. The hybrid high RAM strategy of softer + decreased RBA combined the effectiveness of both strategies (+65%) and produced a marginal mixture. For the high 0.44 RBR RAP/RAS NR mixture, the effect of decreased RBA was pronounced (+130%), whereas the effect of a softer virgin binder was minimal (+10%) and insufficient.
All of the potentially robust NR mixtures that passed the IDEAL-CT threshold also passed both DCT thresholds after STOA and 85% retained Gf after further shorter mid-term critical aging. The mixture with the hybrid PMA+RBA high RAM strategy (NR_0.37_70-28_RBA) was
Table 28. Surface cracking resistance of NR mixtures.
| Aggregate | RAM Source | RBR | Virgin Binder Type | High RAM Strategies | Aging | IDEAL-CT | DCT |
|---|---|---|---|---|---|---|---|
| North Resistant | NE RAP | 0.21 | PG 58-28 Low ΔTc = +0.4 |
None (Control) | 6 h @ 135℃ | Pass | Pass |
| PG 58-28 High ΔTc = +2.0 |
Higher ΔTc | 6 h @ 135℃ | Pass | Pass | |||
| PG 64-22 Low ΔTc = −1.4 |
Harder | 6 h @ 135℃ | Fail | ||||
| 0.37 | PG 58-28 Low ΔTc = +0.4 |
None (Control) | 6 h @ 135℃ | Fail | |||
| PG 58-28 High ΔTc = +2.0 |
Higher ΔTc | 6 h @ 135℃ | Fail | ||||
| PG 52-34 ΔTc = +2.5 |
Softer | 6 h @ 135℃ | Fail | ||||
| PG 58-28 Low ΔTc = +0.4 |
Recycling Agent @ 4.8% | 6 h @ 135℃ | Pass | Pass | |||
| PG 58-28 Low ΔTc = +0.4 |
Decreased RBA | 6 h @ 135℃ | Fail | ||||
| PG 52-34 ΔTc = +2.5 |
Softer + Decreased RBA | 6 h @ 135℃ | Marginal | Pass | |||
| PG 70-28 ΔTc = −0.6 |
PMA + Decreased RBA | 3 days @ 95℃ | Fail | Pass | |||
| NE RAP + NE TOAS | 0.44 | PG 58-28 Low ΔTc = +0.4 |
None (Control) | 6 h @ 135℃ | Fail | ||
| PG 52-34 ΔTc = +2.5 |
Softer | 6 h @ 135℃ | Fail | ||||
| PG 58-28 Low ΔTc = +0.4 |
Decreased RBA | 6 h @ 135℃ | Pass | Pass |
NOTE: Gray cell indicates combination not evaluated.
also tested to determine its resistance to low-temperature cracking because it was included in the performance modeling experiment.
3.2.2 Rutting and Moisture Susceptibility of NR Mixtures
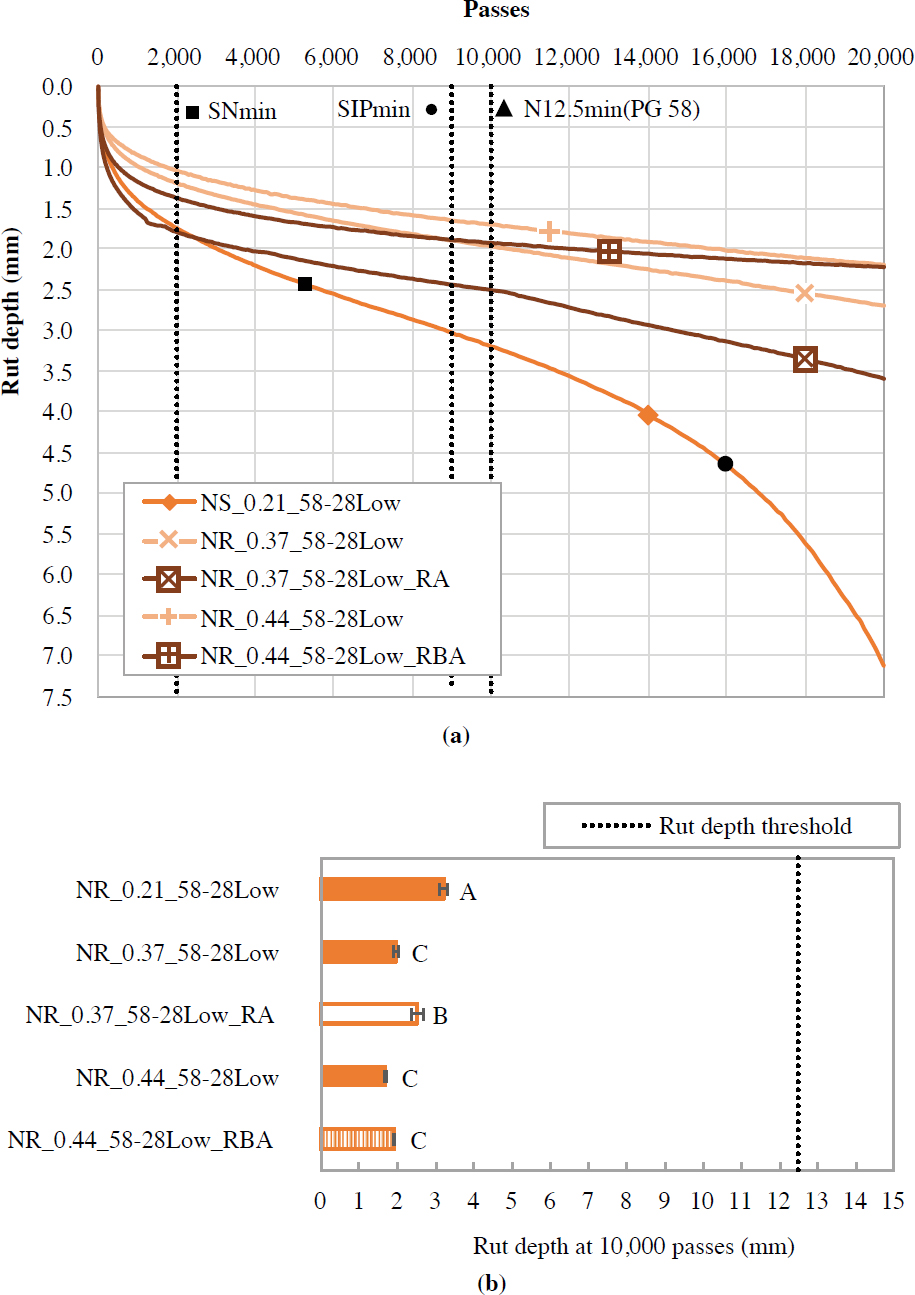
Table 29, Figure 35, Figure 36, and Figure 37 compare rutting and moisture susceptibility results from the HWT and IDT strength tests for the five evaluated NR mixtures with the preliminary thresholds provided in Table 9. The results shown in Table 29 in parentheses were not required for the stepwise approach.
Figure 35 shows the relationship between HWT rut depth and number of passes. Note that the y-axis scale is enlarged to a maximum rut depth of 7.5 mm for improved visualization and comparison of the differences among the mixtures. Therefore, the rutting threshold (12.5 mm) was not included because it is beyond the extent of this scale. Figure 35 also shows HWT rut depth results with error bars indicating ± one standard deviation from the mean and Tukey’s HSD pairwise comparisons, with the same letters indicating statistically equivalent results. Figure 36 shows TSR values and error bars indicating ± one standard deviation from the mean for both the dry ST results and the overlaid wet ST results (lighter color). Statistical comparisons are not provided for the TSR results because only a single result is produced, but practical differences were evaluated based on a d2s% value of 9.3% (Azari 2010). Figure 37 shows wet ST results separately, with error bars indicating ± one standard deviation from the mean and Tukey’s HSD pairwise comparisons.
All three NR mixtures that met the preliminary threshold for cracking performance were balanced and also met the thresholds for rutting performance and moisture resistance by HWT.


Table 29. Moisture susceptibility of NR mixtures.
| Aggregate | RAM Source | RBR | Virgin Binder Type | High RAM Strategies | Moisture Damage Strategies | Moisture Conditioning | IDT (TSR) | HWT |
|---|---|---|---|---|---|---|---|---|
| North Resistant | NE RAP | 0.21 | PG 58-28 Low ΔTc = +0.4 |
None (Control) | None | TSR with F/T | Fail | Pass |
| LAS | TSR with F/T | Pass | ||||||
| 0.37 | PG 58-28 Low ΔTc = +0.4 |
None (Control) | None | TSR with F/T | (Pass) | (Pass) | ||
| LAS | TSR with F/T | |||||||
| PG 58-28 Low ΔTc = +0.4 |
Recycling Agent @ 4.8% | None | TSR with F/T | Pass | Pass | |||
| LAS | TSR with F/T | |||||||
| NE RAP + NE TOAS | 0.44 | PG 58-28 Low ΔTc = +0.4 |
None (Control) | None | TSR with F/T | (Fail) | (Pass) | |
| LAS | TSR with F/T | |||||||
| PG 58-28 Low ΔTc = +0.4 |
Decreased RBA | None | TSR with F/T | Pass | Pass | |||
| LAS | TSR with F/T |
NOTE: Gray cell indicates combination not evaluated.

The typical 0.21 RBR NR control mixture required a LAS agent (NR_0.21_58-28Low_LAS), but both high 0.37 and 0.44 RBR NR mixtures with high RAM strategies (NR_0.37_58-28Low_RA and NR_0.44_58-28Low_RBA) did not need a moisture damage strategy to pass the threshold for moisture resistance. Consequently, these two high RBR mixtures and the typical RBR control mixture with LAS were moved forward in the stepwise approach to assess raveling resistance and the combined effects of traffic, aging, and moisture in performance modeling.
As expected, the rutting performance statistically improved (lower rut depth) with increased RBR. Increased RBR also resulted in a practical improvement in the TSR. The addition of an RA did reduce both the dry and the wet ST strength values of the high 0.37 RBR NR mixture, with the dry ST falling below the preliminary threshold, but the TSR value exhibited improvement over the typical RBR control mixture (NR_0.21_58-28Low). For the high 0.44 RBR RAP/RAS NR mixture, decreased RBA also reduced the dry and wet ST strength and increased the TSR when compared with the typical RBR control mixture (NR_0.21_58-28Low). Practical improvements in the TSR greater than 9.3% (based on the d2s criterion) over the corresponding control mixtures were shown with (a) the addition of an LAS to the typical 0.21 RBR NR control mixture, (b) the addition of an RA to the high 0.37 RBR NR mixture, and (c) decreased RBA for the high 0.44 RBR RAP/RAS NR mixture.
3.2.3 Raveling Resistance of NR Mixtures
Table 30 and Figure 38 compare the Cantabro raveling resistance results for the four evaluated NR mixtures with the preliminary thresholds provided in Table 9. Figure 38 shows abrasion loss

Table 30. Raveling resistance of NR mixtures.
| Aggregate | RAM Source | RBR | Virgin Binder Type | High RAM Strategies | Moisture Damage Strategies | Conditioning | Cantabro |
|---|---|---|---|---|---|---|---|
| North Resistant | NE RAP | 0.21 | PG 58-28 Low ΔTc = +0.4 |
None (Control) | LAS | None | Pass |
| Freeze Combo | Pass | ||||||
| 0.37 | PG 58-28 Low ΔTc = +0.4 |
Recycling Agent @ 4.8% | None | None | Pass | ||
| Freeze Combo | Pass | ||||||
| PG 70-28 High ΔTc = −0.6 |
PMA + Decreased RBA | None | None | Pass | |||
| Freeze Combo | Pass | ||||||
| NE RAP + NE TOAS | 0.44 | PG 58-28 Low ΔTc = +0.4 |
Decreased RBA | None | None | Pass | |
| Freeze Combo | Pass |
(%AL) by Cantabro results including %AL ratio values with and without Freeze combination conditioning that includes the effects of aging and moisture. The results without Freeze combination conditioning are overlaid in lighter color.
All NR mixtures tested passed the preliminary thresholds for sufficient raveling resistance, and three of them (NR_0.21_58-28Low_LAS, NR_0.37_58-28Low_RA, and NR_0.44_58-28Low_ RBA) are therefore considered robust. The high 0.37 RBR mixture with PMA did not pass the threshold for cracking performance and was not evaluated with respect to rutting and moisture susceptibility, but it was evaluated with respect to raveling to explore the effect of binder type. The high 0.44 RBR RAP/RAS NR mixture with decreased RBA exhibited the largest abrasion loss for both conditions but the lowest %AL ratio, signifying the most resistance to combined conditioning, likely from this strategy that results in additional effective binder.
Figure 39 provides additional results for the four evaluated NR mixtures (including the three robust NR mixtures) based on the G-Rm parameter determined from |E∗| results, presented subsequently, that were used to predict cracking performance with the CZM approach and FlexPAVE. The G-Rm parameter that combines both aspects of rheology (stiffness and embrittlement) is analogous to the G-R parameter for binders. A performance threshold is not available, but the first draft Standard Practice developed in NCHRP Project 09-58 (Epps Martin et al. 2019) did include a maximum 19,000 MPa for this parameter after a different conditioning protocol (long-term oven aging [LTOA] of 5 days at 95°C) on compacted specimens. After the same Freeze combination conditioning that includes the effects of both aging and moisture, the high 0.37 RBR mixture with an RA exhibited the lowest G-Rm (less than the typical 0.21 RBR NR control


mixture) that may be associated with improved raveling and cracking performance. The potentially robust high 0.37 RBR RAP and 0.44 RBR RAP/RAS NR mixtures, even with hybrid PMA + RBA or decreased RBA mitigation strategies, respectively, exhibited greater raveling potential than the typical 0.21 RBR NR control mixture. As indicated for the binder results, the combined stiffness and embrittlement captured by the G-Rm parameter may not be appropriate or may need revision when PMA binders are used.
3.2.4 Modeling Characterization for NR Mixtures
Figure 40 provides the rheological characterization results CZM and FlexPAVE require to predict cracking performance for the four NR mixtures evaluated after Freeze combination

conditioning that includes the effects of aging and moisture. These |E∗| master curves at a reference temperature of 20°C were developed based on a generalized Maxwell model and a Prony series. Figure 41 provides the corresponding CTIndex values from the load-displacement curves measured during the IDEAL-CT, which are needed to characterize mixture fracture properties for the CZM cracking performance prediction.
Figure 41 shows the negative impact of high RBR on CTIndex after Freeze combination conditioning, even with high RAM mitigation strategies. With the effects of both aging and moisture for the high 0.37 RBR NR mixture, an RA appears to be a more effective high RAM mitigation strategy than the hybrid PMA + RBA. Decreased RBA also appears to be effective after Freeze combination conditioning for the high 0.44 RBR RAP/RAS NR mixture. Some differences between these NR mixtures were also shown in the |E∗| master curves in Figure 40. These |E∗| master curves for the typical 0.21 RBR control NR mixture and the high 0.37 RBR NR mixture with an RA were similar. Stiffening effects at lower frequencies were exhibited by both the high 0.44 RBR RAP/RAS NR mixture and the mixture with PMA (NR_0.37_70-28_RBA), even with additional binder, because of the decreased RBA high RAM mitigation strategy.
CF testing was also conducted on these same four NR mixtures. The results from the CF and |E∗| tests were employed to determine the damage characteristic curves and cracking parameters using FlexMAT and to conduct a structural pavement analysis using FlexPAVE. This section discusses the damage characteristic curves and cracking parameters, while Chapter 4 presents the results of the structural pavement analysis. Figure 42 illustrates the damage characteristic curves for the four NR mixtures. Each curve represents the relationship between material integrity (C) and damage (S) of the asphalt mixture. This is used to predict fatigue damage and failure in the asphalt mixture by determining the reduction in material integrity as damage accumulates within the specimen.
In addition to the damage characteristic curves, FlexMAT also provides the Sapp parameters, as shown in Table 31. Mixtures with higher Sapp parameters are expected to exhibit better performance in terms of fatigue cracking. However, the Sapp parameter has its limitations. As an index, it does not consider traffic conditions, nor does it account for interactions among pavement layers when determining fatigue performance.
Based on a comparison of the Sapp parameters shown in Table 31 with the CTIndex results shown in Figure 41, both tests suggest that the typical 0.21 RBR control NR mixture and the mixture with PMA (NR_0.37_70-28_RBA) have the highest and lowest cracking resistance, respectively. However, both tests ranked the high 0.44 RBR RAP/RAS mixture and the high 0.37 RBR NR mixture with an RA differently.

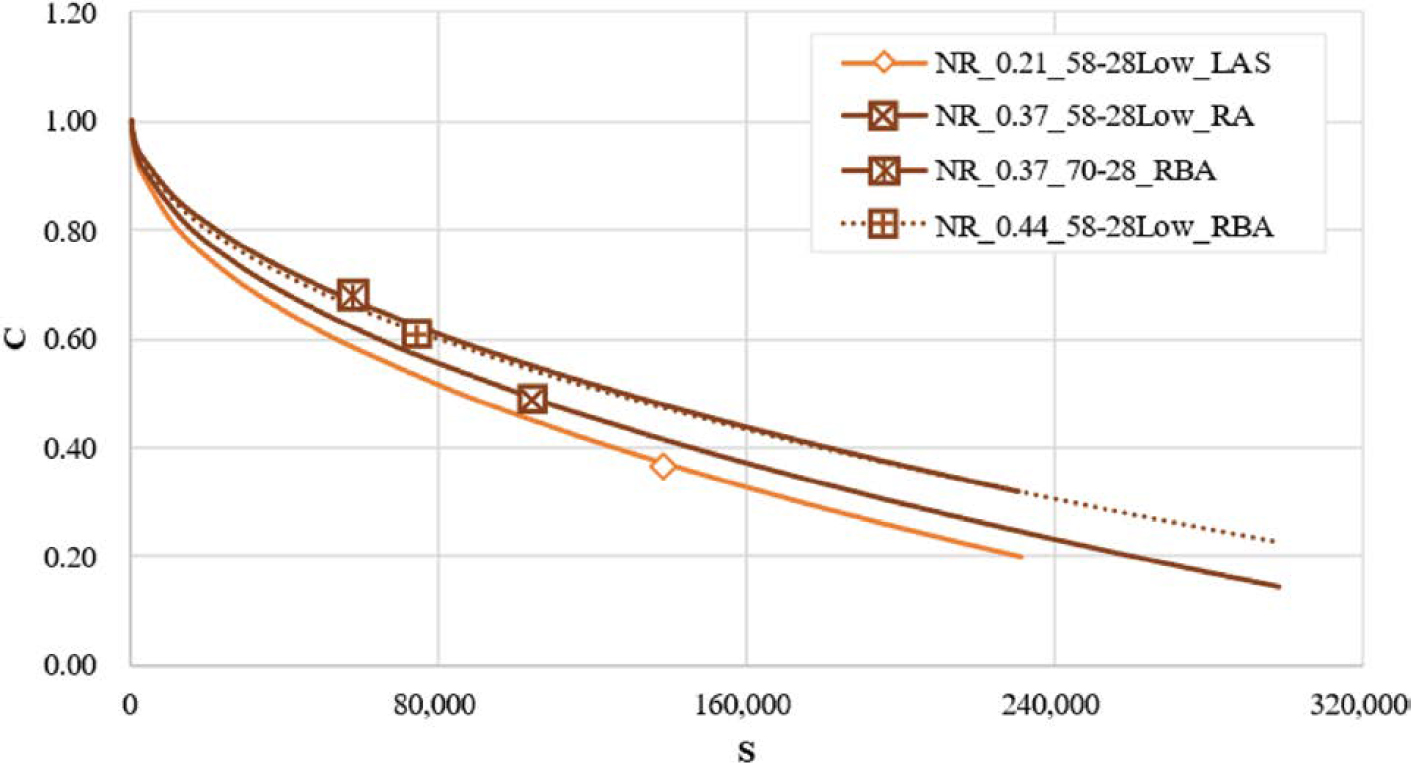
Table 31. Sapp index of NR mixtures.
| Mixture | Sapp |
|---|---|
| NR_0.21_58-28Low_LAS | 30.8 |
| NR_0.37_58-28Low_RA | 24.5 |
| NR_0.37_70-28_RBA | 19.0 |
| NR_0.44_58-28Low_RBA | 30.9 |
3.3 South Moisture-Resistant Mixtures
This section describes the results of characterizing the SR mixtures with respect to surface cracking resistance, rutting and moisture susceptibility, raveling resistance, and characterization required to predict cracking performance.
3.3.1 Surface Cracking Resistance of SR Mixtures
Table 32 and Figure 43 compare the surface cracking resistance results (from the IDEAL-CT and DCT tests) for the 12 evaluated SR mixtures with the preliminary thresholds provided in Table 10. Figure 43 includes error bars representing ± one standard deviation from the mean and Tukey’s HSD pairwise comparisons, with the same letters indicating statistically equivalent results.
Neither the typical 0.16 RBR SR mixture nor the high 0.29 RBR SR mixtures with the commonly used PG 64-22 binder met the preliminary performance threshold because they contained extremely stiff SE1 RAP. Effective high RAM strategies were therefore needed to obtain satisfactory surface cracking resistance. For the typical 0.16 RBR SR mixture, using a hybrid softer + decreased RBA strategy was most effective (SR_0.16_58-28Low_RBA). Using a softer virgin binder (SR_0.16_58-28High) also improved cracking resistance significantly (+56% improvement in CTIndex), but it was insufficient to pass the preliminary threshold. For the high 0.29 RBR
Table 32. Surface cracking resistance of SR mixtures.
| Aggregate | RAP Source | RBR | Virgin Binder Type | High RAM Strategies | Aging | IDEAL-CT | DCT |
|---|---|---|---|---|---|---|---|
| South Resistant | SE1 RAP | 0.16 | PG 64-22 Low ΔTc = −1.4 |
None (Control) | 8 h @ 135℃ | Fail | |
| PG 64-22 High ΔTc = +1.3 |
Higher ΔTc | 8 h @ 135℃ | Fail | ||||
| PG 58-28 High ΔTc = +2.0 |
Softer | 8 h @ 135℃ | Fail | ||||
| PG 76-22 ΔTc = −1.0 |
PMA | 5.0 days @ 95℃ | Fail | ||||
| PG 64-22 Low ΔTc = −1.4 |
Recycling Agent @ 3.7% | 8 h @ 135℃ | Fail | ||||
| PG 58-28 High ΔTc = +2.0 |
Softer + Decreased RBA | 8 h @ 135℃ | Pass | ||||
| 0.29 | PG 64-22 Low ΔTc = −1.4 |
None (Control) | 8 h @ 135℃ | Fail | |||
| PG 64-22 High ΔTc = +1.3 |
Higher ΔTc | 8 h @ 135℃ | Fail | ||||
| PG 58-28 High ΔTc = +2.0 |
Softer | 8 h @ 135℃ | Fail | ||||
| PG 76-22 ΔTc = −1.0 |
PMA | 5.0 days @ 95℃ | Fail | ||||
| PG 64-22 Low ΔTc = −1.4 |
Recycling Agent @ 7.0% | 8 h @ 135℃ | Pass | ||||
| PG 64-22 Low ΔTc = −1.4 |
Decreased RBA | 8 h @ 135℃ | Fail |
NOTE: Gray cell indicates combination not evaluated.
SR mixture, the most effective mitigation strategy was using an RA (SR_0.29_64-22Low_RA). Using a softer virgin binder (SR_0.29_58-28High) was the second most effective strategy for this mixture, but it was also insufficient to pass the preliminary threshold. These two mixtures with satisfactory cracking performance were moved forward in the stepwise approach to assess balanced performance with respect to rutting and to evaluate moisture susceptibility.
3.3.2 Rutting and Moisture Susceptibility of SR Mixtures
Table 33, Figure 44, Figure 45, and Figure 46 compare rutting and moisture susceptibility results from the HWT and IDT strength tests for the four evaluated SR mixtures with the preliminary thresholds in Table 10. The results shown in Table 33 in parentheses were not required for the stepwise approach.
Figure 44 shows the relationship between HWT rut depth and number of passes. Note that the y-axis scale is enlarged to a maximum rut depth of 7.5 mm for improved visualization and comparison of the differences among the mixtures. Therefore, the rutting threshold (12.5 mm) was not included because it is beyond the extent of this scale. Figure 44 also shows HWT rut depth results with error bars indicating ± one standard deviation from the mean and Tukey’s HSD pairwise comparisons with the same letters indicating statistically equivalent results. Figure 45 shows TSR values and error bars indicating ± one standard deviation from the mean for both the dry ST results and the overlaid wet ST results (lighter color). While statistical comparisons are not provided for the TSR results because only a single result is determined, practical differences were evaluated based on a d2s% value of 9.3% (Azari 2010). Figure 46 shows wet ST strength results, with error bars indicating ± one standard deviation from the mean and Tukey’s HSD pairwise comparisons.
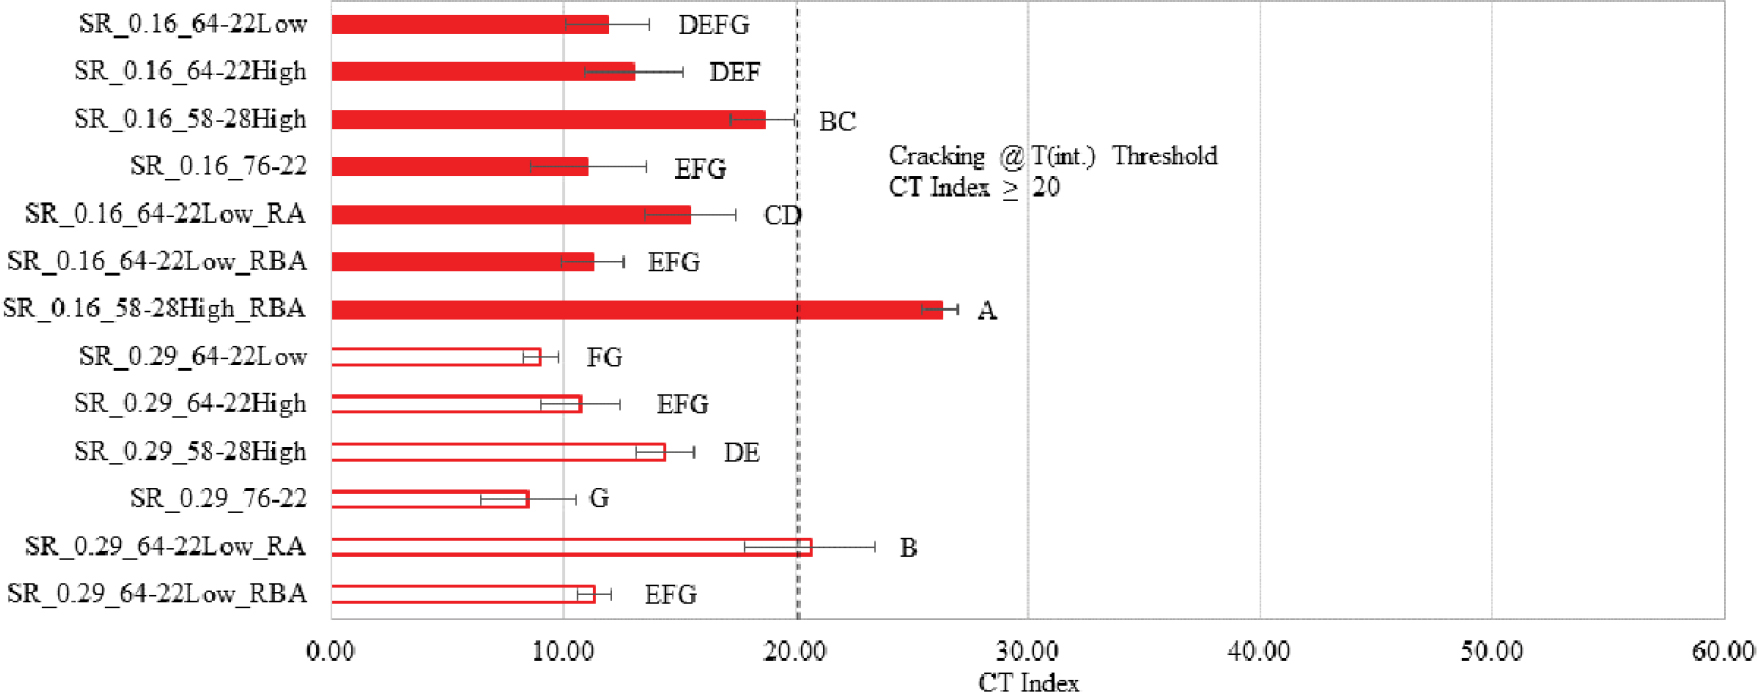
Table 33. Moisture susceptibility of SR mixtures.
| Aggregate | RAM Source | RBR | Virgin Binder Type | High RAM Strategies | Moisture Damage Strategies | Moisture Conditioning | IDT (TSR) | HWT |
|---|---|---|---|---|---|---|---|---|
| South Resistant | SE1 RAP | 0.16 | PG 64-22 Low ΔTc = −1.4 |
None (Control) | None | TSR without F/T | Fail | Pass |
| LAS | TSR without F/T | Marginal | ||||||
| PG 58-28 High ΔTc = +2.0 |
Softer + Decreased RBA | None | TSR without F/T | Pass | Pass | |||
| LAS | TSR without F/T | |||||||
| 0.29 | PG 64-22 Low ΔTc = −1.4 |
None (Control) | None | TSR without F/T | Fail | Pass | ||
| LAS | TSR without F/T | Fail | Pass | |||||
| PG 64-22 Low ΔTc = −1.4 |
Recycling Agent @ 7.0% | None | TSR without F/T | Pass | Pass | |||
| LAS | TSR without F/T | (Pass) | (Pass) |
NOTE: Gray cell indicates combination not evaluated.


All SR mixtures tested exhibited adequate rutting performance and moisture resistance by HWT. This includes the typical 0.16 RBR and high 0.29 RBR SR mixtures that met the preliminary threshold for cracking performance after application of the effective high RAM strategies—hybrid softer + decreased RBA and RA, respectively (SR_0.16_58-28High_RBA, SR_0.29_64-22Low_RA). These two potentially robust SR mixtures also passed the moisture resistance threshold without using an LAS agent. However, neither the typical 0.16 RBR SR control mixture nor the high 0.29 RBR SR mixture without strategies met the threshold, even with an LAS agent. The two potentially robust mixtures were moved forward in the stepwise approach to assess raveling resistance and the combined effects of traffic, aging, and moisture in performance modeling. The addition of an RA or both additives (RA and LAS agent) reduced both the dry and the wet ST strength values of the high 0.29 RBR SR mixture but practically improved the TSR. These effects were statistically significant for the wet ST strength when compared with the corresponding high 0.29 RBR SR mixture without strategies, and the LAS agent provided practical improvement in TSR for the mixture with an RA.
3.3.3 Raveling Resistance of SR Mixtures
Table 34 and Figure 47 compare the Cantabro raveling resistance results for the two potentially robust SR mixtures with the preliminary thresholds provided in Table 10. Figure 47 shows %AL
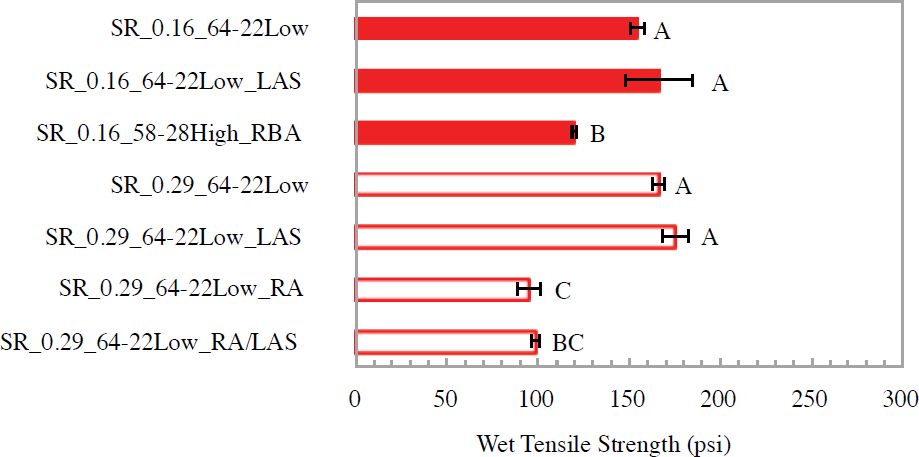
Table 34. Raveling resistance of SR mixtures.
| Aggregate | RAM Source | RBR | Virgin Binder Type | High RAM Strategies | Moisture Damage Strategies | Conditioning | Cantabro |
|---|---|---|---|---|---|---|---|
| South Resistant | SE1 RAP | 0.16 | PG 58-28 High ΔTc = +2.0 |
Softer + Decreased RBA | None | None | Pass |
| No Freeze Combo | Pass | ||||||
| 0.29 | PG 64-22 Low ΔTc = −1.4 |
Recycling Agent @ 7.0% | None | None | Pass | ||
| No Freeze Combo | Pass |

determined in the Cantabro test, including %AL ratio values with and without the No Freeze combination conditioning, to account for the effects of aging and moisture. The results without Freeze combination conditioning are overlaid in lighter color.
The two tested SR mixtures passed the preliminary thresholds for raveling resistance, so SR_0.16_58-28High_RBA and SR_0.29_64-22Low_RA are considered robust. Both exhibited similar abrasion loss for both conditions. The high 0.29 RBR SR mixture with RA exhibited a higher %AL ratio, signifying less resistance to combined conditioning than the typical 0.16 RBR SR mixture with the hybrid strategy of softer + decreased RBA.
Figure 48 provides additional results for the two robust SR mixtures based on the G-Rm parameter determined from |E∗| results, presented subsequently, that were used to predict cracking performance with the CZM approach and FlexPAVE. The G-Rm parameter that combines both aspects of rheology (stiffness and embrittlement) is analogous to the G-R parameter for

binders. A performance threshold is not available, but the first draft Standard Practice developed in NCHRP Project 09-58 (Epps Martin et al. 2019) did include a maximum 19,000 MPa for this parameter after a different conditioning protocol on compacted specimens (LTOA of 5 days at 95°C). After the same No Freeze combination conditioning that includes the effects of both aging and moisture, both the robust SR mixtures with hybrid softer + decreased RBA and RA high RAM mitigation strategies exhibited similar G-Rm that may be associated with improved raveling and cracking performance.
3.3.4 Modeling Characterization for SR Mixtures
Figure 49 provides the rheological characterization results CZM and FlexPAVE require to predict cracking performance for the two evaluated SR mixtures after No Freeze combination conditioning that includes the effects of aging and moisture. These |E∗| master curves at a reference temperature of 20°C were developed based on a generalized Maxwell model and a Prony series. Figure 50 provides the corresponding CTIndex values from the load-displacement curves measured during the IDEAL-CT, which are needed to characterize mixture fracture properties for the CZM cracking performance prediction.
Figure 50 shows the negative impact of high RBR on CTIndex after No Freeze combination conditioning, even with the most effective high RAM mitigation strategy. With the effects of both aging and moisture, the selected high RAM strategies appear to be effective. The |E∗| master curves in Figure 49 for these robust SR mixtures were similar.
CF testing was also conducted on these same two SR mixtures. The results from the CF and |E∗| tests were employed to determine the damage characteristic curves and cracking parameters using FlexMAT. Figure 51 shows the damage characteristic curves for the two mixtures, and Table 35 includes the Sapp parameters. Mixtures with higher Sapp parameters are expected to exhibit better performance in terms of fatigue cracking. Comparison of the Sapp parameters shown in Table 35 with the CTIndex results shown in Figure 50 revealed that the two tests ranked the cracking resistance of the two mixtures differently.
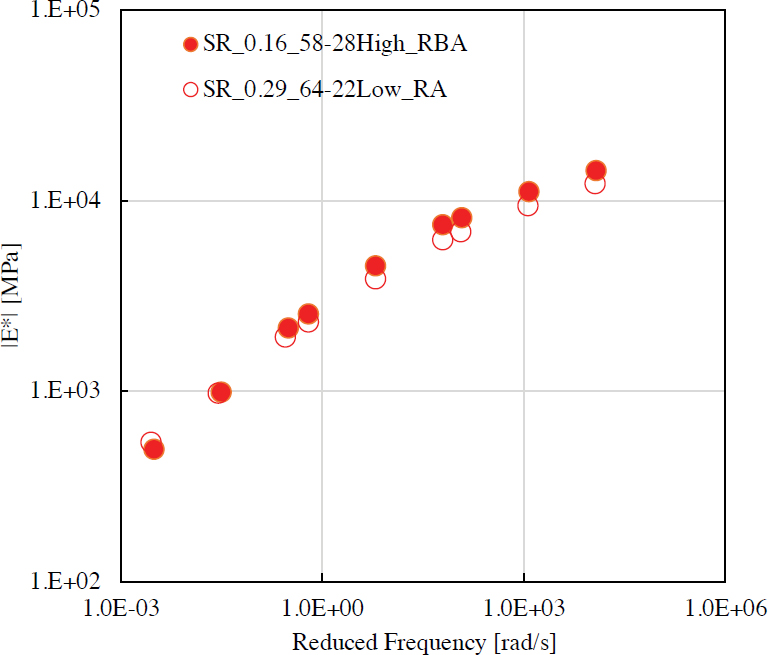

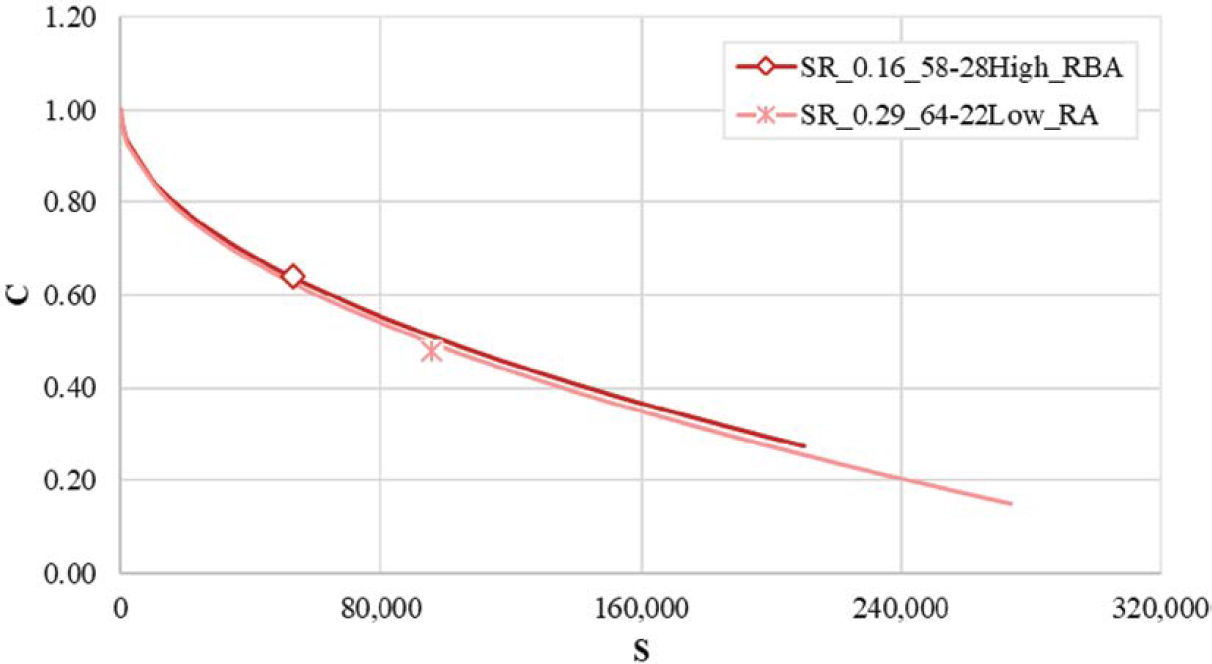
Table 35. Sapp index of SR mixtures.
| Mixture | Sapp |
|---|---|
| SR_0.16_58-28High_RBA | 18.4 |
| SR_0.29_64-22Low_RA | 22.0 |
3.4 North Moisture-Susceptible Mixtures
This section describes the results of characterizing the NS mixtures with respect to surface cracking resistance as well as rutting and moisture susceptibility.
3.4.1 Surface Cracking Resistance of NS Mixtures
Table 36, Figure 52, and Figure 53 compare surface cracking resistance results from the IDEAL-CT and DCT tests for the four evaluated NS mixtures with the preliminary thresholds
Table 36. Surface cracking resistance of NS mixtures.
| Aggregate | RAP Source | RBR | Virgin Binder Type | High RAM Strategies | Aging | IDEAL-CT | DCT |
|---|---|---|---|---|---|---|---|
| North Susceptible | MidW RAP | 0.20 | PG 58-28 Low ΔTc = +0.4 |
None (Control) | 6 h @ 135℃ | Pass | Pass |
| 0.29 | PG 58-28 Low ΔTc = +0.4 |
None (Control) | 6 h @ 135℃ | Fail | |||
| PG 58-28 Low ΔTc = +0.4 |
Recycling Agent @ 2.8% | 6 h @ 135℃ | Marginal | ||||
| PG 58-28 Low ΔTc = +0.4 |
Decreased RBA | 6 h @ 135℃ | Pass | Fail |
NOTE: Gray cell indicates combination not evaluated.


provided in Table 9. Figure 52 and Figure 53 also show error bars indicating ± one standard deviation from the mean and Tukey’s HSD pairwise comparisons, with the same letters indicating statistically equivalent results.
No high RAM mitigation strategy was needed for the typical 0.20 RBR NS control mixture, but the high 0.29 RBR NS mixture required the decreased RBA (NS_0.29_58-28Low_RBA) strategy to meet the preliminary threshold for surface cracking performance. These two mixtures that met the cracking resistance threshold were moved forward in the stepwise approach to assess balanced performance with respect to rutting and to evaluate moisture susceptibility. For the high 0.29 RBR NS mixture, the effect of an RA was substantial (+38%) compared with the corresponding control mixture without strategies but was not quite sufficient to meet the threshold. The typical 0.20 RBR potentially robust control NS mixture also passed both DCT thresholds after STOA and 85% retained Gf after further shorter mid-term critical aging, but the high 0.29 RBR potentially robust NS mixture did not pass either of these thresholds, even with the high RAM strategy of decreased RBA.
3.4.2 Rutting and Moisture Susceptibility of NS Mixtures
Table 37, Figure 54, Figure 55, and Figure 56 compare rutting and moisture susceptibility results from the HWT and IDT strength tests for the four evaluated NS mixtures with the preliminary thresholds provided in Table 9. Figure 54 shows the relationship between HWT rut depth and number of passes. Note that the y-axis scale is enlarged to a maximum rut depth of 7.5 mm for improved visualization and comparison of the differences among the mixtures. Therefore, the rutting threshold (12.5 mm) was not included because it is beyond the extent of this scale. Figure 54 also shows HWT rut depth results with error bars indicating ± one standard deviation from the mean and Tukey’s HSD pairwise comparisons, with the same letters indicating statistically equivalent results. Figure 55 shows TSR values and error bars indicating ± one standard deviation from the mean for both the dry ST results and the overlaid wet ST results (lighter color). Statistical comparisons are not provided for the TSR results because only a single result is produced, but practical differences were evaluated based on a d2s% value of 9.3% (Azari 2010). Figure 56 shows the wet ST strength results separately, with error bars indicating ± one standard deviation from the mean and Tukey’s HSD pairwise comparisons.
The two potentially robust NS mixtures that met the preliminary cracking performance thresholds (NS_0.20_58-28Low and NS_0.29_58-28Low_RBA) also passed thresholds for rutting performance and moisture resistance by HWT. Both the typical 0.20 RBR NS control
Table 37. Moisture susceptibility of NS mixtures.
| Aggregate | RAM Source | RBR | Virgin Binder Type | High RAM Strategies | Moisture Damage Strategies | Moisture Conditioning | IDT (TSR) | HWT |
|---|---|---|---|---|---|---|---|---|
| North Susceptible | MidW RAP | 0.20 | PG 58-28 Low ΔTc = +0.4 |
None (Control) | None | TSR with F/T | Pass | Pass |
| LAS | TSR with F/T | |||||||
| 0.29 | PG 58-28 Low ΔTc = +0.4 |
None (Control) | None | TSR with F/T | Pass | Pass | ||
| LAS | TSR with F/T | |||||||
| PG 58-28 Low ΔTc = +0.4 |
Decreased RBA | None | TSR with F/T | Pass | Pass | |||
| LAS | TSR with F/T | |||||||
| MidW RAP + MidW TOAS | 0.33 | PG 58-28 Low ΔTc = +0.4 |
None (Control) | None | TSR with F/T | Fail | Pass | |
| LAS | TSR with F/T | Pass |
NOTE: Gray cell indicates combination not evaluated.


mixture and the high 0.29 RBR NS mixture with decreased RBA passed the moisture resistance by TSR threshold without a LAS agent. There was no statistically significant effect of RAP RBR or decreased RBA for the NS mixtures with respect to rut depth and wet ST strength, and the TSR values were all practically equivalent. The high 0.33 RBR RAP/RAS NS mixture was not characterized with respect to cracking performance but was evaluated for moisture susceptibility, and an LAS agent was needed to pass the moisture resistance threshold by TSR. The rutting performance was statistically equivalent to that of the typical RBR control mixture. Conversely, the high 0.33 RAP/RAS NS mixture exhibited statistical and practical differences in the wet ST strength and TSR as compared with the corresponding typical RBR control mixture, and the LAS agent provided significant improvement in both wet ST strength and TSR.
3.5 South Moisture-Susceptible Mixtures
This section describes the results of characterizing the SS mixtures with respect to rutting resistance and moisture susceptibility (from the HWT and IDT strength tests). Table 38, Figure 57, Figure 58, and Figure 59 compare rutting and moisture susceptibility results of the three evaluated SS mixtures with the preliminary thresholds provided in Table 10. These mixtures were only characterized in the moisture susceptibility experiment, and the results shown in Table 38 in parentheses were not required for the stepwise approach.
Figure 57 shows the relationship between HWT rut depth and number of passes. Note that the y-axis scale is enlarged to a maximum rut depth of 7.5 mm for improved visualization and comparison of the differences among the mixtures. Therefore, the rutting threshold (12.5 mm) was not included because it is beyond the extent of this scale. Figure 57 also shows HWT rut
Table 38. Moisture susceptibility of SS mixtures.
| Aggregate | RAM Source | RBR | Virgin Binder Type | High RAM Strategies | Moisture Damage Strategies | Moisture Conditioning | IDT (TSR) | HWT |
|---|---|---|---|---|---|---|---|---|
| South Susceptible | SE2 RAP | 0.22 | PG 64-22 Low ΔTc = −1.4 |
None (Control) | None | TSR without F/T | Fail | Pass |
| Lime | TSR without F/T | Pass | (Pass) | |||||
| 0.39 | PG 64-22 Low ΔTc = −1.4 |
None (Control) | None | TSR without F/T | Fail | Pass | ||
| Lime | TSR without F/T | Pass | (Pass) | |||||
| PG 64-22 Low ΔTc = −1.4 |
Recycling Agent @ 4.9% | Lime | TSR without F/T | Pass |
NOTE: Gray cell indicates combination not evaluated.


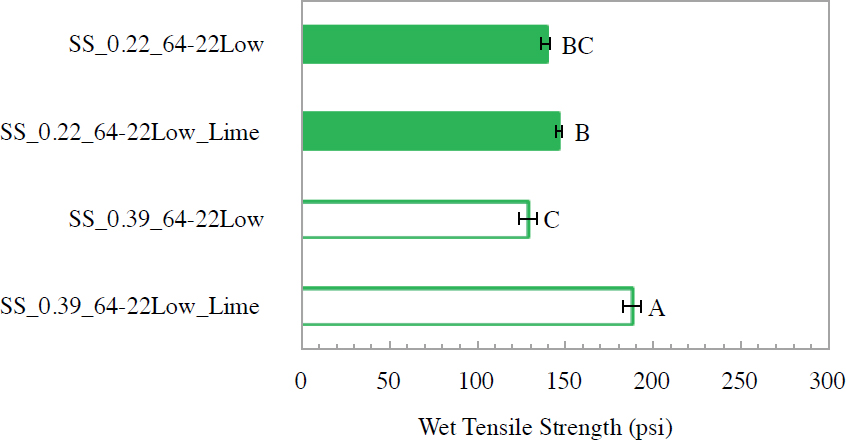
depth results with error bars indicating ± one standard deviation from the mean and Tukey’s HSD pairwise comparisons, with the same letters indicating statistically equivalent results. Figure 58 shows TSR values and error bars indicating ± one standard deviation from the mean for both the dry ST results and the overlaid wet ST results (lighter color). Statistical comparisons are not provided for the TSR results because only a single result is produced, but practical differences were evaluated based on a d2s% value of 9.3% (Azari 2010). Figure 59 shows the wet ST strength results separately, with error bars indicating ± one standard deviation from the mean and Tukey’s HSD pairwise comparisons.
All SS mixtures tested exhibited sufficient and statistically equivalent rutting performance by HWT. Neither the typical 0.22 RBR control mixture nor the corresponding high RBR control mixture without strategies provided sufficient moisture resistance by TSR unless lime was used as an ASA moisture damage strategy (SS_0.22_64-22Low_Lime and SS_0.39_64-22Low_Lime). This addition of lime practically improved the TSR of both the typical 0.22 RBR and the high 0.39 RBR SS mixtures and statistically improved the wet ST of the high 0.39 RBR SS mixture. The positive effect of RBR was also statistically significant for the wet ST for the mixtures with an ASA moisture damage strategy.


