Resilience in Transportation Networks, Volume 1: Resilience Case Studies (2024)
Chapter: Section 2: Case Study Abstracts
Section 2: Case Study Abstracts
2.1 Atlantic Region Council (ARC) Vulnerability and Resiliency Framework for the Atlanta Region
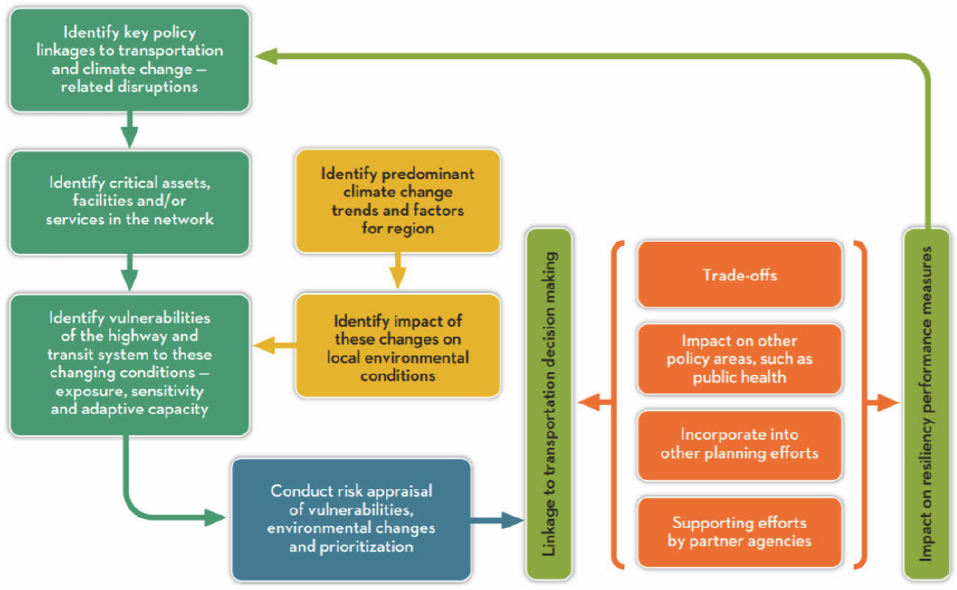
Figure 9: Proposed ARC Readiness Framework.
The ARC Vulnerability and Resiliency Framework for the Atlanta regions builds on the FHWA Climate Change & Extreme Weather Vulnerability Assessment Framework, extending it to focus more on transportation-related decision-making. Assessing vulnerability has primarily focused on transportation assets, as previous disasters have demonstrated that transportation network failures significantly exacerbate large-scale disruptions. This exacerbation has shown to be due to cascading effects resulting from dependencies in the transportation system and illustrating the impact of transportation system resilience on other policy areas.
The framework was used to identify critical assets, facilities, and services in the transportation network, considering the effects of climate change on local environmental conditions. It then identifies vulnerabilities by scoring their exposure, sensitivity, and adaptive capacity. The anticipation that future conditions will differ from present conditions is central to the analysis, and scenario-based forecasting is used to explore impacts under different assumptions and timescales. A combination of Geographic Information Systems (GIS), travel demand modeling, and expert guidance are used in the assessment. The risk appraisal is then linked to transportation decision-making, including impact on other policy areas, such as public health, through incorporation into other planning efforts and supporting efforts by partner agencies.
The greatest challenge to engaging in a resilience and vulnerability assessment is data. A repository of relevant geodata must be created and populated. While existing data sources and tools can be leveraged, substantial data cleaning and correction are necessary before analysis can be performed. The effort is part of the “100 Resilient Cities” initiative funded by the Rockefeller Foundation, which funded a “Chief Resilience Officer” position for several years in Atlanta, providing an explicitly responsible person for resilience issues and activities. While the foundation funding is not replicable, many practices and procedures pioneered by network members remain applicable in other contexts. Drawing on the experience of other agencies in applying frameworks is very important, as is the existence of formal channels for doing so. Making the shift toward a resilience-based framework requires changing existing processes and protocols. Guidance for the framework included recommendations on incorporating it into operational processes. Further, having an explicit framework makes it possible to compare transportation policies and initiatives for conformity with resilience principles. Figure 9 illustrates the proposed ARC readiness framework.
Keywords: risk assessment, data-driven models, institutional capacity, governance, adaptation
2.2 Climate Ready Boston
In response to the challenge of climate change, including flooding, snowstorms, and hotter summers, the Climate Ready Boston initiative was intended to produce a systemic and comprehensive framework. This framework was developed by working with local climate scientists, engineers, planners, and designers to identify vulnerable locations and engage in changes to promote resilience. This resilience approach is best described as preparedness in a risk reduction and readiness sense. The approach intends to identify long-term risks and plan to take long-term actions to ameliorate long-term risks.
The implementation cost of risk identification and making mitigation plans were minimal, with the cost of implementing the identified solutions running from a few million to half a billion dollars. The planned adaptive approach is to improve flood defenses, create resilient infrastructure, and adapt existing buildings to changing conditions through local planning, mitigating flood risk, and coordinated infrastructure investments. These costs were set against the value generated by the suggested improvements, providing a rough cost-benefit analysis of risk-reducing in the case of flooding, and identifying benefits to existing public infrastructure such as fire stations. Climate Ready Boston developed a detailed asset inventory by combining over a hundred datasets. It also identified interdependencies between different assets and amenities, individual and systemic vulnerabilities, and existing resilience measures.
Upon review of the science and climate change projections, the city finds existing defenses will likely be insufficient in coming decades as it faces increased hazards due to sea-level rise and other effects of climate change projected for the region. The city has spent time analyzing and quantifying the risk by mapping the zones of risk and structures/infrastructure at risk and the likelihood and timescales at which those risks will occur. Further analysis extends the definition of resilience beyond risk reduction to include improved emergency response and disaster recovery capacity by ensuring the reliability and continuity of essential services, government agencies, and critical businesses. It also includes pre-distancing financial preparation through insurance or catastrophe bonds. Catastrophe bonds, paying out a set amount when set conditions are met, ensure against risk, trading a stream of payments against a potential windfall in a disastrous situation.
Climate Ready Boston is an example of a potentially effective program for identifying and quantifying risks associated with sea-level rise by identifying solutions and developing plans incorporating necessary actions and considerations for effective implementation. It offers an effective and practical blueprint other communities can follow while engaging in their own resilience planning. The modeling approaches used to identify locations with increased vulnerability to flooding due to sea-level rise can be replicated using existing GIS tools. Identifying low-lying areas prone to flooding and future inflow points provides an alternative mechanism to FEMA flood maps, which identify only present flood conditions and cannot evaluate future flood risk resulting from changed conditions.
Developing coastal resilience solutions for Boston is an iterative process, done across multiple districts over time rather than region-wide, reducing peak effort, ensuring that deliverables remain timely, and allowing for learning to occur throughout the process. While the majority of actions suggested related to risk reduction, risk reduction can be considered a pre-emptive form of damage mitigation, reducing harm and disruption in the event of a disaster and thus speeding recovery in a post-disaster context.
Keywords: flood, sea-level rise, risk assessment, preparedness, data-driven models
2.3 Cyber/GPS Security
This case study explores disruptions resulting from illegal, human-made access to destroy or disable a computer or computer network to cause harm or damage. Cyberattacks are a growing threat to transportation infrastructure networks increasingly managed and linked through technology. The case study explores the use of Information Sharing Analysis Centers (ISACs) to facilitate information sharing between public and private sectors to respond to cyberattacks.
Key takeaways include:
- Cyberattacks are getting more persuasive and expensive. Cyber threats require proactive prevention and business continuity planning.
- There is currently no evidence that the transportation industry has been a specific target of cyberattacks. Cyberattacks do not conform to traditional geopolitical or industrial boundaries due to the interconnected systems among global businesses and governments.
Information sharing is critical to preventing, minimizing, and recovering from cyberattacks. In the U.S., information sharing across industries and government sectors has been formalized through the creation of Information Sharing and Analysis Centers (ISACs).
- State departments of transportation could consider forming an ISAC focused specifically on Connected and Automated Vehicle (CAV) technologies.
- Security is everyone’s responsibility, not just the cybersecurity team.
Keywords: cybersecurity, cyberattack, network
2.4 EPA/Rhode Island Community Planning Framework
“Planning Framework for a Climate-Resilient Economy” is a report from the U.S. EPA which includes input from the state of Rhode Island (RI). It develops a framework for planning for resilience, and the report gives local governments and stakeholders guidance concerning how to develop and implement this planning framework.
Throughout the document, examples and applications for North Kingstown, RI, are presented. Planned implementation in North Kingstown was sidelined by the election of a new Town Council. But numerous other examples from all over the U.S. are included. The framework is oriented toward the entire local economy, discussing planning and projects for transportation facilities and economic components such as commercial establishments and utilities.
This framework will likely be useful to localities looking to initiate or improve climate resilience efforts, and it is suggestive of how major stakeholders can work together. In most cases, the planning framework will not have a dedicated funding source, nor is the framework currently required by federal or state law. However, it provides guidance for handling threats that may become more serious in the coming years.
In terms of assisting the application and success of the planning framework, federal and state governments may be able to do more by documenting and tracking the success of such local efforts throughout the country. Federal and state governments may also help local efforts by providing technical assistance with GIS analysis, climate modeling, and other information technologies.
Keywords: land use, recovery, climate change, FEMA, drought
2.5 Florida Resilience Planning at Metropolitan Planning Organizations
This case study explores efforts within Florida to incorporate resilience into the transportation planning process. The Florida Department of Transportation (FDOT) has undertaken resilience planning efforts and developed guidance to assist the state’s 27 MPOs in incorporating resilience into their efforts. Florida’s resilience planning has been guided and assisted by FHWA’s Vulnerability Assessment and Adaptation Framework. The case also highlights data-driven planning efforts undertaken by Resilient Tampa Bay, a coalition of regional groups that include the region’s MPOs.
Key Takeaways
- Efforts by the Florida DOT and its partner agency fall into the Preparedness phase of resilience frameworks. This phase is appropriate for any transportation planning efforts and especially important in regions with recurring disruptive events (e.g., hurricanes, flooding, forest fires, and landslides) or those that can reasonably expect a disruptive event to occur, like an earthquake.
- Resilience planning is an ongoing process for FDOT and the state. Florida is home to 27 MPOs with various levels of sophistication, which adds complexity to an already complex undertaking. Florida-based resilience coalitions often work together, but having a standard reference is important for consistency in approach and outcomes. FDOT developed a Resiliency Quick Guide that has also become a tool to educate local politicians and communities about state efforts.
- There has been a lot of enthusiasm and support for Florida’s resilience planning efforts. However, it remains unclear how incorporating resilience in the planning process translates into projects developed in LRTPs and carried through to the project development process and implementation.
- There is an opportunity to use the Needs Plans to identify the transportation infrastructure essential to accommodate future travel demand and assess how projects would strengthen the network’s resilience.
Keywords: vulnerability assessment, resilience, resiliency, adaptation framework
2.6 Louisiana Supply Chain Transportation Council
In 2016 Louisiana experienced two 1,000-year non-hurricane flood events in just six months. Much of the state was declared a disaster area, and FEMA activated the National Disaster Recovery Framework (NDRF). A key recommendation for implementing NDRF was the creation of a public-private council that explored ways of utilizing Louisiana’s extensive multimodal network to keep freight moving. The case study provides transportation practitioners with several key takeaways:
- FEMA’s NDRF provides a proven process for implementing risk reduction and readiness efforts. While the SCTC was an outgrowth of NDRF Recovery Function, the fact that it is situated within the Preparedness phase of the disaster timeline points to its appropriateness for any freight-related transportation planning efforts in regions with recurring disruptive events (e.g., hurricanes, flooding, forest fires, and landslides) or those reasonably expecting a disruptive event, like an earthquake.
- Funding for staff to perform administrative, coordination, implementation, and outreach activities, is key to accomplishing the work required in a recovery effort. Federal support is likely to fluctuate, and local staff resources may not have the needed resources to move the action items forward. Having knowledgeable and effective administrative staff can help mitigate these issues.
- Project champions are needed to support and assemble key players as active participants. The SCTC was championed by the Louisiana Legislature, Assistant DOTD Secretary, the Freight Advisory Council (FAC), and others. Engaging the private sector via the FAC provided a ready-to-use roster of potential participants to acquire the needed input and support.
- Including academic institutions in recovery efforts brought multiple benefits, including additional grant opportunities and intellectual resources for analysis and modeling capabilities.
Keywords: flood, risk assessment, recovery, supply chain resilience
2.7 Washington State DOT’s Bridge Seismic Retrofit Program
Millions witnessed the World Series Earthquake on October 17, 1989. The earthquake struck California’s Central Coast area, killing 63 people, injuring nearly 4,000, and leaving more than a million people without power. The World Series Earthquake was estimated to have cost over $6 billion in property damage, with several key pieces of infrastructure like the Bay Bridge left in ruins. While the state of Washington was unaffected by this California catastrophe, it became a wake-up call for another state prone to earthquakes. As a result of witnessing the destruction in California, Washington State DOT (WSDOT) initiated a Bridge Seismic Retrofit in 1990 to address the seismic vulnerability of the state’s highway bridges. The case study examines the program’s history and where it stands today.
Keywords: earthquake, DOTs, network resilience
2.8 Pedestrian Flow-Path Modeling
Coastal areas are sensitive to various risks, including rising sea levels, frequency of storms, and the occurrence of tsunamis in regions prone to earthquakes. Tsunamis can cause significant loss of life and property damage in coastal areas. In addition to severe tremors experienced during tsunamis,
other hazards can cause additional damage: surface rupture, liquefaction, and landslides. Successful evacuation in such areas is, therefore, critical.
Past research on pedestrian-evacuation modeling under tsunami hazards has primarily focused on identifying areas and populations subjected to tsunami risks. In contrast, limited research has been conducted on identifying the paths and capacity of assembly areas for the population that is at risk but has sufficient time to evacuate. This research aimed to develop a modeling approach for successfully evacuating at-risk individuals in areas where evacuations are possible. The study used a geospatial evacuation-modeling approach to (1) determine minimum pedestrian travel speeds to safety, the most efficient paths, and identify evacuation basins, (2) estimate the total number of people and their demographic characteristics at predetermined assembly areas, and (3) identify which paths may be compromised as a result of ground failure due to the earthquake.
The coastal communities of Aberdeen, Hoquiam, and Cosmopolis, located in southwestern Grays Harbor County in Washington State, were selected to demonstrate this approach. The demographic characteristics of evacuees were used to determine the need for additional support. Then the paths inaccessible due to ground failure or bridge failure were determined.
The modeling results for the study region included hazard zones, evacuation pathways and basins, and estimated minimum travel speeds. The model also estimated the number of people, their demographics at assembly areas, and the obstacles along evacuation pathways. The results suggest a wide range in the number and type of evacuees at predetermined assembly areas and highlight the communities with no readily accessible assembly area. Model results also indicate that earthquake-induced ground failures could obstruct access to some assembly areas, causing evacuees to take routes to other assembly areas.
Emergency response managers in relief planning could use these model results. Travel speed maps can provide information on minimum travel speeds and the direction in which the evacuees need to move. Modeled evacuation pathways and basins linked with population data could assist with developing realistic response and relief support. Overall, evacuation modeling could help to identify opportunities for outreach, response planning, and mitigation strategies, enhancing the likelihood of successful evacuations.
Keywords: Sea-level rise, Earthquakes, Preparedness, Risk Management
2.9 Typhoon Emergency Response Modeling:
Modeling the effectiveness of infrastructure and travel demand management measures to improve traffic congestion during typhoons
Households and businesses need to have access to a reliable transportation system that minimizes disruption to traffic flow. Flooding causes severe impacts on society, directly or indirectly, and physical damage to infrastructure incurs repair costs and frequent delays for commuters until the facility is restored. During flooding, roadway capacity is decreased, and travel time is increased for commuters. This case study was conducted to evaluate the measures that could be implemented to reduce severe congestion during a typhoon.
The challenge is that it is not always possible to identify which road segments might be flooded. Therefore, a stochastic model was developed that assigns a failure probability to each road segment
based on climate model outputs for the region. The travel time reliability between any given origin-destination pair could be determined using this model. For the case study, the region selected was the Tokai region in Japan, where large typhoons often occur. During these disruptions, many commuters’ travels time might increase by as much as four hours on their usual homebound commute.
The model was applied to the road network of the Tokai region, and two measures were identified that could be implemented to reduce severe congestion. The first was to strengthen heavily used roads, and the second was to implement commuter demand management. The commuter demand management program involved informing potential commuters and asking them to delay their trips. The two strategies were tested using the regional travel demand model and performing traffic assignment. Model results include travel time reliability between origin-destination pairs under the two strategies. Overall, it was found that strengthening heavily used roads would significantly relieve congestion more than delaying the trip departure time. A combination of both strategies would achieve the best results.
The case study provides a potential methodology to test similar measures identified for a particular region. All metropolitan areas in the United States have travel demand models available, and most state DOTs also maintain statewide models. Availability of past and predicted climate data and knowledge about roadway vulnerability could take the research presented here to the next step by building a predictive model that could identify facilities likely to be affected. Strategies identified in this study and other strategies could be tested using travel demand models and operational models available for a given region.
Keywords: flooding, highways, DOTs, response, network resilience
2.10 Asset-Based Risk Management
The assessment of risks to transportation assets and the development of strategies to mitigate those risks is an integral part of any resilience approach. The case study evaluates two agency approaches to evaluating the implementation of an asset-based risk management program. The two agencies studied are the Utah Department of Transportation (UDOT) and the Waka Kotahi New Zealand Transport Authority (NZTA). This case is particularly interesting because the two agencies focused on the different aspects of the risk equation. UDOT was primarily concerned with assessing the threat probability of an event, and NZTA was primarily concerned with evaluating the consequences a disruptive event may have on transportation and downstream assets. NZTA used the concepts of interdependencies and cascading effects as a proxy for consequence. NZTA also developed four interdependency typologies (digital, physical, geographic, and organizational) to help understand an asset’s relationship to other “lifeline” assets. The NZTA approach highlighted the different levels (strategic and tactical) where the concepts of interdependencies can be used. UDOT presents a practical approach that can be replicated in other DOTs and transportation agencies. The NZTA approach was a research effort, and the concepts developed can also be applied by DOTs in considering an asset-based risk management program.
Methods of evaluating criticality can vary widely, from a simple measure of roadway volumes to estimations of an asset’s interdependencies with other systems and their potential for downstream or cascading effects. Similarly, measuring threat can take on varying degrees of complexity, such as using historical data from authoritative sources like FEMA or employing complex predictive models.
The risk definition developed by FHWA is Risk = Consequence x Threat. The Risk Analysis and Management for Critical Asset Protection (RAMCAP) definition developed by ASME Innovative Technologies Institute is Risk = Consequence x Vulnerability x Threat, where vulnerability measures the probability, an event will cause a predetermined damage estimate to an asset.
UDOT embarked on a series of pilots in 2017 to evaluate the business case for implementing a formal asset-based risk management process within its Transportation Performance Management Division. The process involved four steps: risk identification, analysis, evaluation, and mitigation. UDOT is currently rolling out its asset-based risk management program. An essential element of this effort is how the process will fit within their existing workflows.
NZTA focused on understanding the interdependencies of its infrastructure systems and the risk of cascading effects on asset failures due to extreme events, human-made or natural. A core assumption of the NZTA effort is that economic and community vitality rely more and more on transportation networks at local, regional, national, and international scales. The research was aimed at 1) building on the existing body of knowledge about the relationships between transportation networks and other infrastructure systems, 2) identifying and reviewing existing methods, tools, and platforms to assess interdependencies, 3) developing a methodology to assess interdependencies between transportation networks and wider infrastructure systems and use pilot studies to assess those methodologies, and 4) Identifying a range of potential risk treatment options to manage interdependencies. The NZTA approach was more research-focused, and its primary purpose was to inform future policy decisions. However, at a practical level, the NZTA approach developed relatively straightforward interdependency concepts to assess the criticality of an asset. These concepts can be of value to U.S. DOTs by informing both strategic and tactical level approaches to implementing resilience and asset-based risk management programs.
Together the two approaches present agencies with a range of implementation options, highlighting important concepts that DOTs need to consider as they implement or modify existing resilience programs.
Key Words: risk management, interdependencies, threat probability, cascading effects
2.11 Supply Chains in the Midwest Amid COIVD-19
This case study discusses supply chain disruption after the outbreak of COVID-19 in the Midwest, emphasizing the role of transportation infrastructure. COVID-19 affected the supply chain due to disruption in the source of supply, transportation delays, and demand uncertainty. Indiana, a manufacturing state, faced issues in importing parts from China. Inside Indiana Business reported that in 2019, Indiana imported $7.7 billion in goods from China. The imported goods include motor vehicles, furniture parts, pharmaceutical components, and orthopedic products (Wes Mills, 2020). Even if suppliers are available, some industries producing non-essential items have had to shut down because of decreased demand for their products (DePass, 2020). On the other side, food and health supplies experienced precautionary buying (The effect of precautionary buying, 2020). Precautionary buying is a customer behavior resulting from fear of product shortage when a crisis occurs. Therefore, customers tend to buy more than their regular consumption. Precautionary buying causes challenges by taking critical items away from those in need. Another part of the supply chain affected at the customer level was last-mile delivery since customers increasingly
preferred delivery services (Gray, 2020). However, the shortage in available trucks increased customer waiting time (Commendatore, 2020).
In the food industry, supply chain disruptions were noticeable in milk and meat distribution (Good, 2020; Trapani, 2020). The Midwest is the leading provider of meat in the United States. According to U.S. Department of Agriculture data, in May 2020, cattle slaughter decreased by 37% compared to the last year’s data, while the capacity decrease was from 10% to 15%. The reason for the decreasing capacity was the closure of meat plants due to the spread of COVID-19 among workers in the meat packaging plants (Good, 2020). The data indicates that in the meat industry, disruption at the packaging and distribution level of the supply chain was more significant than at the production level. This bottleneck was observed specifically in meat plants in Wisconsin, Illinois, Iowa, Minnesota, and Indiana (Meat Industry in Midwest, 2020). The lack of truck drivers and containers resulted in transportation delays at the distribution level of the supply chain (Gray, 2020).
Figure 10 illustrates the overall flow in the supply chain system along with the disruptions at different levels after the outbreak of COVID-19. The primary impact affecting supply chain response was customer demand surge due to precautionary buying of critical items such as personal protective equipment (PPE) and groceries. Moreover, the demand of customers for last-mile delivery increased. The secondary impact was a decrease in available workers in the packaging and transportation systems. At the same time, increased customer demand required more workers and drivers in the supply chain system. The number of poultry and meat processing facilities’ workers declined because 4,913 cases out of 130,000 workers reported positive for COVID-19 (Gibbins et al., 2020). The decline in truck drivers can be attributed to the closure of Departments of Motor Vehicles (DMVs) in 27 states which postponed issuing licenses, the shutdown of commercial driver training classes (B. M. Singh, 2020), and the temporary closure of some rest areas and truck parking (American Trucking Association, 2020). A survey of supply chain managers of nine Midwestern states indicated that two-thirds of the managers reported transportation delays after COVID-19. In the survey, 54.3% of the vendors reported workers’ absence during the pandemic (DePass, 2020). The tertiary impact was the shutdown of industries which caused a lack of raw materials and essential parts. Figure 10 indicates that disruptions occurred at multiple levels of the supply chain. Keywords: response, risk assessment, multimodal, supply chain resilience, pandemic, COVID-19

2.12 Howard Street Tunnel Fire, Baltimore, MD
The Howard Street Tunnel Fire is an example of a chokepoint within the freight network that caused disruptions in the supply chain along the East Coast when a derailment caused a fire to break out in the tunnel, closing the rail route for over a week. This case study looks at the response to the incident and recommends mitigation actions to reduce network disruptions of this type in the future.
The Howard Street Tunnel on the Baltimore Belt Line is a crucial link in what has become the principal rail freight line from Baltimore to Philadelphia and beyond. This segment of the CSXT network is considered a chokepoint for freight train service from the Port of Baltimore to East Coast and Midwest markets.
On July 18, 2001, a 60-car CSXT freight train derailed in the Howard Street Tunnel, sparking a fire that burned for six days and blocked traffic for much longer. The Howard Street Tunnel Fire called attention to the Baltimore Belt Line and the use of the tunnel as a through-route for East Coast freight, both as a risk to the surrounding structures and as a link in the overall freight transportation network. CSXT has implemented various improvements to increase the integrity of the link, and alternative routes were explored with a $1-3 billion price tag.
In 2016, a $425 million design was proposed to enhance the tunnel to meet double-stack train heights. This option recommended creating the necessary additional clearance of 1.5 ft in the tunnel by trimming and notching the arched ceiling and lowering the tunnel floor by replacing the current wooden ties with steel crossties.
In 2019, after many attempts to receive federal funding to help improve the tunnel, the state of Maryland was successfully awarded a $125 million Infrastructure for Rebuilding America (INFRA) grant for the project.
Although the fire department was able to respond to the emergency, delays wasted considerable time, including an approximate 1-hour delay in initially notifying emergency responders of the derailment. Sharing the details of the incident between the private asset owner and the public agencies suffered from significant compartmentalization. The delay in appointing a public information officer and placing them at the scene also slowed communication links between the public, media, incident command, emergency offices, CSXT, and city, state, and federal officials.
Improved coordination and information sharing between the city, the railroad, and local responders could have potentially prevented or limited damage, disruption, and other losses that occurred to the tunnel, surrounding infrastructure, and business activity in the downtown area.
Recommendations include increasing multiagency (public-private) joint training exercises to improve a coordinated response and communication during an event of this type, sharing engineering and maintenance drawings of the respective public and private assets, and ensuring the roles, responsibilities, and communication protocols are in place before an incident.
Keywords: response, redundancy, flood, fire, railway
2.13 Puerto Rico After Hurricanes Irma and Maria
In 2017, Hurricanes Harvey, Irma, and Maria struck the United States. The widespread devastation brought by the 2017 Atlantic Hurricane Season affected 28 million people, destroyed infrastructure, and caused lifeline shortages in Puerto Rico, the U.S. Virgin Islands, Florida, and Texas (FEMA, 2018). Damage from these hurricanes totaled about $250 billion (FEMA, 2018). This case study aims to examine the results of incorporating response and recovery approaches in Puerto Rico in the wake of consecutive hurricanes to reduce transportation network disruptions in the future.
The Federal Emergency Management Agency (FEMA) assigned 17,000 people to response operations between August and November 2017. The evaluation by FEMA included data collected through interviews, direct observation, and state, regional, and national plans. This data was used to develop a hurricane season chronology and analysis to validate FEMA’s report.
FEMA defined five areas of resilience focus 1) scaling a response for concurrent complex incidents, 2) staffing for concurrent complex incidents, 3) sustained whole community logistic operations, 4) responding during long-run infrastructure outages, and 5) mass care to initial housing operations. In the first area, FEMA relocated staff from unaffected regions to the National Response Coordination Center (NRCC) to offer support and improve operations. It also accelerated and provided alternative procedures for the process of receiving Public Assistance Grant Program funds. Finally, FEMA developed plans to estimate the demand for temporary shelters and restore electricity.
Hurricanes Irma and Maria severely damaged Puerto Rico’s critical infrastructure. The hurricanes destroyed the island’s power grid, leaving 3.7 million inhabitants without power for days. All airports and seaports in Puerto Rico remained closed for an extended time, and roads and bridges were obstructed by approximately 6.2 million cubic yards of debris.
All 68 hospitals in Puerto Rico suffered damage and lost power for a considerable time. These losses took a heavy and unprecedented toll on the healthcare system. Also, transportation barriers that limited people’s access to healthcare facilities, lack of clean water and medical supplies, and the presence of debris led to outbreaks of infectious diseases and, ultimately, a health crisis on the island. Furthermore, the relief and emergency response were delayed because the two hurricanes disrupted the power grid and communication towers. The transportation network was affected by massive flooding, causing excessive erosion on the roads and collapsed bridges. The loss of power and communication networks also disrupted air transportation. The maritime transport and supply chains were affected by accumulated debris in seaports which required additional dredging.
Even though the island of Puerto Rico is prone to recurring hurricanes and flooding, local authorities did not have the appropriate disaster preparedness and response plans in place. The poor state of the infrastructure on the island increased vulnerabilities and exacerbated the impacts produced by Hurricanes Irma and Maria. Key takeaways from Puerto Rico’s lack of resilience preparedness include:
- Infrastructure maintenance is critical for elements of infrastructure that may be directly affected and for all dependent aspects of infrastructure. This principle was evident in the case of healthcare operations. Power restoration in Puerto Rico was vital for citizens but potentially even more crucial for the operations of healthcare facilities. Along the same lines, increasing the capacity of seaports for accommodating larger cruise ships would also increase the island’s resilience.
- There needs to be greater awareness of overall supply chains at local, state, and national levels to reduce future impacts and support faster response. For example, the shutdown of manufacturing facilities in Puerto Rico produced a saline bag shortage in the mainland United States.
- Provide real-time data for reducing congestion on roads and highways and evaluate the design conditions of the routes to reduce road degradation.
Keywords: FEMA, response, recovery, risk management, supply chain delays
2.14 Puerto Rico After Hurricanes – Equity
The widespread devastation brought by the 2017 Atlantic Hurricane Season affected 28 million people, destroyed the infrastructure, and caused lifeline shortages in Puerto Rico, the U.S. Virgin Islands, Florida, and Texas. This case study builds on the findings of Case 3B.3: Puerto Rico After Hurricanes Irma and Maria and expands the analysis with a focus on the equity of the response. The purpose of this case study is to explore the underlying reasons behind inequities in the slow recovery of Puerto Rico. The coincidence of three of the most destructive tropical cyclones in U.S. history, the absence of urgent international response, political and administrative challenges in Puerto Rico, and unequal follow-up by the U.S. Federal government were found to be among the most influential reasons why Puerto Rico’s recovery has been much slower than other affected areas.
Keywords: response, supply chain delays, FEMA
2.15 Superstorm Sandy
Superstorm Sandy, initially one of the largest Atlantic hurricanes on record in terms of size, was a unique weather event. It struck the coast of the northeast U.S. in October and November 2012 as one of the most destructive storms to hit the New York metropolitan area in the past 100 years.
Sandy had a major impact on the massive Port Authority of New York and New Jersey (PANYNJ). Sandy required the closure of many PANYNJ facilities in the short run, and it badly damaged the Holland Tunnel and the Port Authority Trans Hudson (PATH) rail system. PANYNJ undertook a program of over $500 million to repair the damage and improve facilities. Construction will continue well into the 2020s. The real-time damage from Sandy in 2012 and the schedule for capital repairs are summarized in tables in the main text.
PANYNJ established a sustainability policy in 2008 and 2009, well before the damage from Sandy. However, Sandy has significantly influenced the development and implementation of that policy. Notable developments include:
- Climate Resilience Design Guidelines
- Council on Port Performance – An industry group convened by PANYNJ to address a variety of operational and resilience issues
- A dedicated Resilience & Sustainability Unit
- Use of Benefit-Cost Analysis (BCA)
In principle, other agencies and major facilities could adopt resilience programs and policies similar to PANYNJ. However, the practical barriers to doing so are considerable, and different institutions may take widely differing approaches.
Keywords: performance-based metric, climate change, waterway, supply chain resilience, sea-level rise
2.16 Port of Everett, Washington State, COVID-19 Response
The Port of Everett, located in Everett, WA, in Snohomish County, is the third largest port in Washington State. The Port of Everett is an extension of the aerospace manufacturing process and plays a critical role in the just-in-time delivery schedule. It transports all oversized parts for the 747, 767 (military and commercial), 777, K-C46 Tanker, and the 777X airplane programs. It also serves as a backup facility to the 787 Dreamliner.
In order to safeguard its operational abilities to support the Boeing supply chain and to continue to move aerospace components quickly and securely through the transportation system, the port must have a business continuity plan in place that can be implemented during and post disruption. The Port of Everett, as part of the joint Puget Sound Regional Maritime Transportation Disaster Recovery Exercise Program (Exercise Program), prepared and practiced Business Continuity and Resumption of Trade Planning (Continuity of Operations Plan (COOP)) in 2014. This plan has been reviewed and updated as needed each year.
Although the COOP did not specifically address pandemics, it provided a framework for port leadership to use as a reference or guiding document that outlines actions and procedures that can be adapted to the event at hand. Although the port was unprepared for a pandemic, it had emergency and response plans that provided guidance on steps to take, policies in place, and procedures to follow. As soon as the governor declared an emergency, the port quickly stepped into response mode. Using their prepared plans, port staff methodically reviewed the current situation and prepared for a potential complete shutdown. Fortunately, ports in Washington State are considered essential services, so they could remain open with limited services while many other agencies struggled in their response. The port quickly realized that opening its facilities back to the public would require distancing and capital improvements. Using their internal procurement procedures and pre-approved vendors, the Port purchased personal protective equipment and barriers that quickly became backorder or not obtainable by slower moving agencies.
Keywords: preparedness, response, waterway, pandemic, planning, COVID-19
2.17 Pre- and Post-Katrina Preparedness in New Orleans, LA
Before Hurricane Katrina, New Orleans and its surrounding parishes were accustomed to periodic hurricanes that overwhelmed levees, flooded the city, and wreaked havoc on the lives and livelihoods of residents. Typically, levees were rebuilt, debris was cleared, and private interests rebuilt damaged homes and buildings. Some improvements to the levee system were made prior to Katrina. Still, the system-wide project lacked the funding and political will to complete a region-wide infrastructure project of such scale. Plans were in place before Katrina intended to improve outbound highway capacity for vehicle-based evacuation. Specifically, a contraflow program was established to double highway capacity for evacuation. Within the evacuation plan, however, there
was an acknowledgment that hundreds of thousands of New Orleans residents would be unable to evacuate due to the lack of access to private vehicles. It was an apparent failure that this shortcoming was known but not addressed, and this failure has been widely chronicled in the disaster planning literature.
The work that preceded Hurricane Katrina to prepare for what most concede as inevitable has since been extensively chronicled as inadequate. However, this is not to say that the city, regional, and state governments did nothing significant to prepare for major hurricane events before the storm. As detailed below, most planning efforts were focused on facilitating highway travel away from the city and physically restraining flood waters with levees. Intentional narratives that the city had been only moderately and temporarily affected by previous floods, combined with increased sophistication and scale of levees, contributed to a sense that the persistent flooding problem had mainly been engineered away.
Examining the planning efforts before Hurricane Katrina reveals that a combination of errors led to a weakened response. An inadequate levee system was not properly updated after the previous storm, largely because of ineffectual governance and mismanagement of public funds. The existing plans for evacuation only addressed vehicle travel, and consideration of transit-dependent residents was nonexistent. A weakened national guard was limited in its capacity by the number of available guardsmen, the quality of equipment remaining, and handicapped communications systems. Around 20,000 residents were able to take shelter in the Superdome, and reports of poor management and unsafe conditions were also ubiquitous in this setting. Finally, 130,000 other residents were unable or unwilling to evacuate and were not permitted into the overcrowded shelter. Nearly 2000 people lost their lives in the disaster, and the city of New Orleans has yet to recover in terms of economic outcomes and population fully.
The first and most obvious equity issue in the New Orleans Hurricane Evacuation Plan was that it relied entirely on personal vehicles as the means for evacuation. The plan itself even recognized that many residents would be unable to evacuate for lack of access to vehicles or friends or relatives with vehicles. The evacuation plan indicated three reasons people might not evacuate in the case of a major hurricane: unwillingness to leave, lack of access to personal transportation, and lack of highway capacity. Of these three reasons, the evacuation plan only responds to one, lack of highway capacity. The choice to neglect the other two obstacles to safely evacuating all New Orleans residents demonstrates a bias toward those with socioeconomic advantages and a lack of commitment to those without them. The evacuation plan identified 200-300,000 residents who could not use the highway system to seek refuge. However, this plan suggests increasing outbound highway capacity to facilitate safe evacuation for those with the means to own and maintain a private vehicle. The official guidance in the plan for those who do not have personal transportation options is to seek charity from friends or family. The insufficiency of this guidance is evident by its prediction that hundreds of thousands of residents would be left behind due to the lack of accessibility.
A resilient system has many safeguards, redundancies, and adaptability, but the opposite is found in the planning and response to Hurricane Katrina. Overstressed systems such as the communication network, highways, flood protection, and government agencies exemplify a lack of resilience. The poor response to Hurricane Katrina demonstrates the need for resilience in these systems.
According to Litman (Litman 2006), the following should be considered best practices for resilient transportation systems:
- Include disaster response as part of all transportation planning.
- Establish a system to prioritize evacuations based on location, need, and ability.
- Coordinate vehicle rentals and fuel supplies and provide special services along evacuation routes.
- Create networks for contacting and providing services for the most vulnerable people.
- Give buses and other high-occupancy vehicles priority.
- Have an adequate inventory of buses and drivers with clearly established instructions for emergency operations.
- Coordinate fuel, emergency repair, and other mobility support services.
Keywords: response, highway, network resilience, flood, hurricane, evacuation
2.18 COVID-19 A Regional Response to a Global Health Pandemic
This case study explores the history of the United Nations (UN) and the organization’s primary humanitarian relief programs: the United Nations Development Program (UNDP), the United Nations Refugee Agency (UNHCR), the United Nations Children’s Fund (UNICEF), the World Food Program (WFP), and the World Health Organization (WHO). The case study also explores the WHO’s lessons learned from the severe acute respiratory syndrome or SARS outbreak nearly two decades ago and its recent supply chain relief actions related to COVID-19. Finally, the case study explores an emerging partnership between a regional group in Minnesota focused on health and wellness, and officials in Liege, Belgium, to research supply chain synergies through global air cargo hubs.
Key takeaways include:
- In an increasingly complex global trade supply chain environment, there are benefits to designating specialty hubs to distribute critical supplies.
- Being resilient in responding to humanitarian crises is dependent upon partnerships and communications. When established institutions miss or overlook an opportunity to meet a need or be more effective, organic public-private partnerships can fill leadership roles.
Keywords: pandemic, COVID-19, supply chain delays, aviation


