Calibration and Development of State-DOT-Specific Safety Performance Functions (2024)
Chapter: 3 State of Practice

CHAPTER 3
State of Practice
A survey was developed and sent to state DOT representatives to learn more about how individual state DOTs are customizing and applying the HSM quantitative methods. The survey consisted of 32 questions and was administered via online survey software. A copy of the survey is provided in Appendix A of this report. The survey was sent to all members of the following AASHTO committees, which included representatives from all 50 states and the District of Columbia:
- AASHTO Committee on Safety
- AASHTO Committee on Traffic Engineering
- AASHTO Committee on Design
The remainder of this chapter summarizes the survey responses and findings; Appendix B contains a compilation of all the survey responses.
Responses
A total of 46 of 51 state DOTs provided responses to the survey, which represented a response rate of 90%. Figure 3 shows the individual agencies that responded.
Current State of Practice
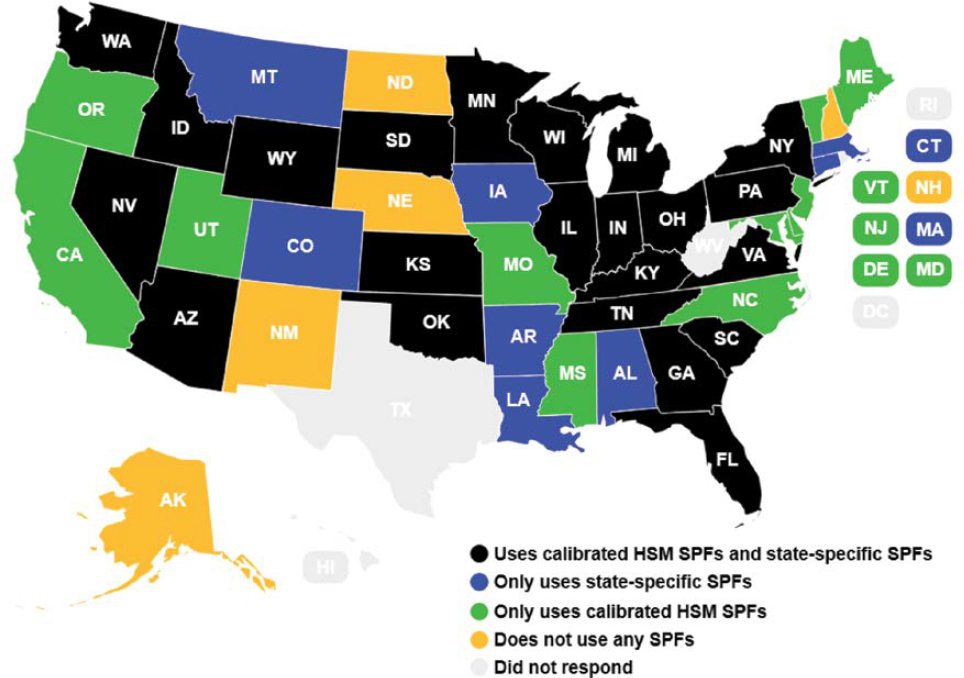
Figure 4 shows the current state of practice for the responding state DOTs with respect to calibration of HSM SPFs or development of state-specific SPFs (survey question no. 5). Twenty-eight percent (or 13 of 46) responding DOTs indicated that they currently do not apply any of the HSM SPFs or SPFs developed by other DOTs. (Note that this includes agencies that do not apply any SPFs as well as agencies that only apply state-specific SPFs.) Of those that apply SPFs, 22 of the 33 responding DOTs (67%) apply calibration factors to these SPFs, while the remaining 11 responding DOTs (33%) do not. (Note that this may also include agencies that also develop and apply calibration factors to the HSM SPFs.)
Of the DOTs that did not respond to the survey, the literature review found that Texas developed calibration factors and their own state-specific SPFs (see Chapter 2). No information was found in the literature for the other non-respondents. It should also be noted that additional responses to the survey and interviews with the DOTs revealed that California and Washington State apply the HSM SPFs with a calibration factor of 1.0 (equivalent to an uncalibrated model) since data from these states were used to develop these SPFs. Additionally, Delaware respondents noted that they are currently applying the HSM SPFs without a calibration factor but are in the process of developing calibration factors for local conditions.
The remainder of this section describes responses to specific questions regarding SPF calibration and development, respectively.

SPF Calibration
Table 77 provides a summary of the HSM SPF type–facility type combinations that DOTs reported calibrating for their own use (survey question no. 8). As shown, the majority of the calibrated factors have been developed for design-level SPFs, particularly two-lane rural, multilane rural, and urban–suburban arterial road segments and intersections.
Answers in the “other” category generally refer to roundabout SPFs (both network-screening-level and design-level), as well as clarifications on the ramp SPFs that were applied and application of specific CMFs to those SPFs.
DOTs were generally evenly split between using academic partners (57% or 12 of 21 responding DOTs) or external consultants (62% or 13 of 21 responding DOTs) to develop calibration factors (survey question no. 9). However, 14% (or 3 of 21) of responding DOTs indicated that calibration was performed within the agency. Note that the percentages do not add up to 100% as agencies were allowed to select multiple responses for this and several subsequent questions.
The approximate cost to develop these calibration factors is provided in Table 78 (survey question no. 10). As shown, the costs range significantly and depend greatly on data collection activities. Due to how survey questions were asked, differences were not able to be quantified between network-screening-level and design-level SPFs.
Notable additional responses included:
- Various research projects included one to four facility types and cost between $50,000 and $100,000 for each project.
- Calibration was done too long ago to remember costs.
- Calibration of freeways, ramp segments, speed-change lanes, and ramp terminals cost $388,000; calibration of roundabouts cost $58,000.
- Around $15,000 per facility type (including all segments/intersections in that facility type as well as regionalized calibration factors).
- Hard to determine as this was part of multiple projects. The most significant portion of the cost was data collection.
Table 77. Summary of HSM SPF type–facility type combinations.
| Facility Typea | Responsesb | |
|---|---|---|
| Network-Screening-Level SPFs | Design-Level SPFs | |
| Two-lane rural roadway segments | 24% (5) | 95% (20) |
| Multi-lane rural roadway segments | 19% (4) | 76% (16) |
| Urban–suburban arterial roadway segments | 19% (4) | 71% (15) |
| Basic freeway segments | 14% (3) | 52% (11) |
| Freeway segments with speed-change lanes | 5% (1) | 24% (5) |
| Intersections on two-lane rural roads | 19% (4) | 86% (18) |
| Intersections on multi-lane rural roads | 19% (4) | 71% (15) |
| Intersections on urban–suburban arterials | 19% (4) | 76% (16) |
| Freeway ramps | 5% (1) | 24% (5) |
| Other (please elaborate) | 10% (2) | 29% (6) |
aState DOTs developed calibration factors (n = 21) .
bResponses for network-screening-level SPFs and design-level SPFs.
Table 78. Approximate cost to develop calibration factors (n = 21).
| Response | Percent (Number) of Responses |
|---|---|
| < $10,000 per facility type | 5% (1) |
| $10,000–$25,000 per facility type | 14% (3) |
| $10,000–$25,000 per facility type | 10% (2) |
| > $50,000 per facility type (please elaborate) | 19% (4) |
| Unsure | 52% (11) |
Table 79. Tools used to develop calibration factors (n = 1).
| Response | Percent (Number) of Responsesa |
|---|---|
| Manual calculations | 29% (6) |
| Spreadsheet | 71% (15) |
| FHWA Calibrator Tool | 19% (4) |
| Other (please elaborate) | 24% (5) |
| Unsure | 5% (1) |
aNote that the percentages do not add up to 100% as agencies were allowed to select multiple responses for this and subsequent questions.
A summary of the tools used to develop the calibration factors is provided in Table 79 (survey question no. 11). The majority of calibration factors were developed without specialized software, primarily using spreadsheet-based applications.
Notable additional responses provided include:
- Safety Analyst
- SPSS
- GIS and other applications
The majority of DOTs (16 of 19 responding DOTs, 84%) apply the calibration factor as defined in the HSM (survey question no. 12). One of 19 responding DOTs (5%) indicated that the DOT applied calibration functions. Two of 19 responding DOTs (11%) indicated that they used both.
Table 80 provides responses about how often calibration factors were updated (survey question no. 13). As shown, most DOTs developed calibration factors just once. Only one of 22 responding DOTs (5%) reported updating its calibration factors annually. Due to how the survey question was asked, differences were not able to be quantified between network-screening-level and design-level SPFs.
DOTs were also asked about the development of multiple calibration factors for a given facility type to account for regional differences across their agency (survey question no. 14). Just 29% (or six of 21) of responding DOTs indicated that they did develop regionalized calibration factors, while 57% (or 12 of 21) of responding DOTs indicated that they did not. The remaining three
Table 80. Calibration factor update interval (n = 22).
| Response | Percent (Number) of Responses |
|---|---|
| Annually | 5% (1) |
| Every 2–3 years | 9% (2) |
| Every 4–5 years | 9% (2) |
| More than every 5 years | 18% (4) |
| Never, they were only developed once | 50% (11) |
| Unsure | 9% (2) |
Table 81. Reasons calibration factors used as preferred alternative for customizing HSM methods (n = 21).
| Response | Percent (Number) of Responses |
|---|---|
| Data availability | 43% (9) |
| Available staff resources | 33% (7) |
| Available staff skill sets | 24% (5) |
| Available budget | 38% (8) |
| Provides the best value for needed precision to support agency decision-making | 57% (12) |
| So we do not have to develop our own adjustment factors | 10% (2) |
| Other (please elaborate) | 24% (5) |
responding DOTs (14%) indicated that they sometimes used regionalized calibration factors. Additional details suggested that two of 21 DOTs (10%) attempted regionalized calibration factors but found little difference between the regionalized and statewide calibration factors, and thus they opted to use the statewide calibration factors instead. One agency indicated that it would like to do so in the future when sufficient data are available.
Table 81 summarizes DOT responses about why calibration factors were chosen as the preferred alternative to adjusting SPF outputs to local conditions (survey question no. 15). The most common responses (57% or 12 of 21 responses) indicate that calibrated SPFs provide a reasonable level of precision and that data availability is a primary reason DOTs choose to calibrate (43% or nine of 21 responses). Due to how survey questions were asked, differences could not be quantified between network-screening-level and design-level SPFs.
Notable “Other” responses included:
- Calibration factors were initially used when the HSM was published, but the agency is now moving toward state-specific SPFs.
- Applying calibration factors to HSM SPFs makes it easier to use HSM spreadsheet tools, since the calibration factor is an input and similar tools do not exist for state-specific SPFs.
- Calibration factors are used as a “gap-filling” method until state-specific SPFs can be developed.
- Easier integration with the IHSDM tool.
Respondents were asked how calibrated SPF predictions were validated or compared to reported crash frequencies to assess accuracy (survey question no. 16). Table 82 provides a summary of responses.
Table 82. Methods used to validate calibrated SPF predictions (n = 20).
| Response | Percent (Number) of Responsesa |
|---|---|
| No validation or comparison between the predicted crash frequencies and reported crash frequencies is performed | 30% (6) |
| We compare predictions with reported values for different facility types | 50% (10) |
| We compare predictions between uncalibrated and calibrated models | 15% (3) |
| We examine if calibration factors are within a reasonable range (please elaborate) | 25% (5) |
| Other (please elaborate) | 15% (3) |
aNote that the percentages do not add up to 100% as agencies were allowed to select multiple responses for this and subsequent questions.
Notable “Other” answers include:
- CURE plots (two DOTs)
- Review the value of the calibration factors to see if they were too high or low (two DOTs)
The following responses were received to the open question of how well-calibrated SPFs represent safety conditions experienced by your agency (survey question no. 17):
- Unsure
- It depends on the facility type; those that have a very high calibration factor represent an opportunity for the development of state-specific SPFs
- Generally, well
- Majority represent average conditions well, but there are some outliers that are caused by data issues
- Comparison of predicted and observed conditions at hotspot locations tends to be in the same range
- Historically sufficient
- Some facility types fit well while others are just fair
- Typically, calibrated values are reasonable
- Generally, work well when predicting total crash frequency but crash type by severity are less reasonable
- There is a feeling that they predict lower than the actual crash frequency
- Don’t have enough observed data yet
Table 83 provides agency responses to the biggest challenges to developing calibration factors (survey question no. 18). Major challenges are available staff skill sets (67% or 14 of 21 responses) and available staff resources (62% or 13 of 21 responses).
Notable “Other” responses include:
- Having enough sites
- Combining data from all engineering divisions and ensuring that they are recent
- Having reliable, accessible, and easy-to-use data
The 10 DOTs that did not develop or apply calibration factors were asked about why they did not. Responses are summarized in Table 84 (survey question no. 20). “Available staff resources” is a key issue for 46% or five of 11 respondents, followed by “Uncalibrated SPFs provide precision needed to support agency decision-making” for 36% or four of 11 respondents.
However, answers under “Other” represented 64% or seven of 11 of the responses, including:
- Our state’s data were included in the original HSM SPF development and thus already capture our state’s conditions (two responses).
Table 83. Challenges to developing calibration factors (n = 21).
| Response | Percent (Number) of Responsesa |
|---|---|
| Data availability | 48% (10) |
| Available staff resources | 62% (13) |
| Available staff skill sets | 67% (14) |
| Available budget | 48% (10) |
| Other (please elaborate) | 14% (3) |
aNote that the percentages do not add up to 100% as agencies were allowed to select multiple responses for this and subsequent questions.
Table 84. Reasons for not developing calibration factors (n = 11).
| Response | Percent (Number) of Responsesa |
|---|---|
| Data availability | 18% (2) |
| Available staff resources | 46% (5) |
| Available staff skill sets | 9% (1) |
| Available budget | 18% (2) |
| Uncalibrated SPFs provide precision needed to support agency decision-making | 36% (4) |
| Other (please elaborate) | 64% (7) |
aNote that the percentages do not add up to 100% as agencies were allowed to select multiple responses for this and subsequent questions.
- Currently developing calibration factors
- Existing software (AASHTOWare Safety) uses our own data for state-specific SPF development, making calibration factors not necessary
- Have already developed state-specific SPFs
- Knowledge gaps
- Insufficient sample size
SPF Development
Table 85 provides a summary of the HSM SPF type-facility type combinations for which DOTs reported developing state-specific SPFs (survey question no. 23). For network-screening-level SPFs, the top three facility types were (a) two-lane rural roadway segments (61% or 16 of 26 responses), (b) multi-lane rural roadway segments (58% or 15 of 26 responses), and (c) intersections on urban–suburban arterials (54% or 14 of 26 responses). For design-level SPFs, the top three facility types were (a) two-lane rural roadway segments (39% or 10 of 26 responses), (b) intersections on two-lane rural roads (39% or 10 of 26 responses), and (c) intersections on urban–suburban arterials (39% or 10 of 26 responses).
Table 85. Summary of facility types for which state DOTs developed state-specific SPFs (n = 26).
| Facility Type | Responsesa | |
|---|---|---|
| Network-Screening-Level SPFs | Design-Level SPFs | |
| Two-lane rural roadway segments | 62% (16) | 39% (10) |
| Multi-lane rural roadway segments | 58% (15) | 31% (8) |
| Urban–suburban arterial roadway segments | 50% (13) | 31% (8) |
| Basic freeway segments | 50% (13) | 31% (8) |
| Freeway segments with speed-change lanes | 8% (2) | 15% (4) |
| Intersections on two-lane rural roads | 50% (13) | 39% (10) |
| Intersections on multi-lane rural roads | 50% (13) | 35% (9) |
| Intersections on urban–suburban arterials | 54% (14) | 39% (10) |
| Freeway ramps | 12% (3) | 12% (3) |
| Other (please elaborate) | 15% (4) | 23% (6) |
aNote that the percentages do not add up to 100% as agencies were allowed to select multiple responses for this and subsequent questions.
Notable “Other” responses include:
- Design-level SPFs for roundabouts
- Network-screening-level SPFs for segments and signalized intersections (all functional classifications combined) and design-level SPFs for signalized intersections by context classification
- Network-screening-level SPFs for roadway departure crashes on two-lane rural roadway segments
- Network-screening-level SPFs for median crossover crashes on multi-lane highways
- Network-screening-level SPFs for roadway departure and pedestrian crashes
- Design-level SPFs for segments with high tension cable median barriers
- Design-level SPFs for urban–suburban collector roads
- Design-level SPFs for five-lane rural roads
With regard to who developed these state-specific SPFs, 14 of 27 responding DOTs (52%) partnered with academic researchers, and 17 of 27 DOTs (63%) used an external consultant (survey question no. 24). Five of 26 DOTs (19%) indicated that this SPF development was performed within the agency.
The approximate cost to develop these state-specific SPFs is provided in Table 86 (survey question no. 25). Due to how survey questions were asked, differences could be quantified between network-screening-level and design-level SPFs.
Additional responses included:
- Unknown (two responses)
- Over $1 million to develop all SPFs for the agency (including two-lane rural road segments and intersections, urban–suburban arterial road segments and intersections, urban–suburban collector road segments and intersections)
- Cost was included in calibration effort, so hard to determine but definitely less than $100K per facility type
It should be noted that the majority of responses (40% or 10 of 25 respondents) were for the least expensive option (<$20,000) and the costs are generally skewed to the lower categories compared to the SPF calibration costs provided in Table 77. This is presumably due to the fact that state-specific SPFs are more likely to be network-screening-level SPFs, which require much less information than the design-level SPFs, which are generally calibrated.
Table 87 provides agency responses to how often state-specific SPFs were updated (survey question no. 26). Due to how survey questions were asked, differences were not able to be quantified between network-screening-level and design-level SPFs.
Seven of 27 responding DOTs (26%) indicated that state-specific SPF predictions were somehow adjusted to account for regional differences in safety performance across the state (survey
Table 86. Approximate cost to develop state-specific SPFs (n = 25).
| Response | Percent (Number) of Responses |
|---|---|
| < $20,000 per facility type | 40.0% (10) |
| $20,000–$40,000 per facility type | 16.0% (4) |
| $40,000–$60,000 per facility type | 16.0% (4) |
| $80,000–$100,000 per facility type | 12.0% (3) |
| > $100,000 per facility type (please elaborate) | 20.0% (5) |
Table 87. State-specific SPF update interval (n = 27).
| Response | Percent (Number) of Responses |
|---|---|
| Annually | 15% (4) |
| Every 2–3 years | 11% (3) |
| Every 4–5 years | 22% (6) |
| More than every 5 years | 11% (3) |
| Never, they were only developed once | 33% (9) |
| Unsure | 7% (2) |
question no. 27). The remaining DOTs either did not adjust SPF predictions (19 DOTs, 70%) or were unsure if SPFs were adjusted to account for regional differences across the state (one DOT, 4%).
Table 88 summarizes DOTs’ responses about why state-specific SPFs were chosen as the preferred alternative to account for local conditions in safety predictions (survey question 28). The two top responses were (a) precision needed for crash frequency predictions (57% or 13 of 23 responses) and (b) sufficient resources available to support project to develop SPFs (48% or 11 of 23 responses).
Notable “other” responses included:
- Done in concert with deployment of HSM compliant software Vision Zero Suite
- The opportunity presented itself and was taken
- It was a better fit to the data
- It was a decision made by predecessors
- To account for regional differences in the state
Respondents were asked if they combined SPF adjustment factors in the HSM with state-specific SPFs that they developed (survey question no. 29). Most DOTs (78% or 21 of 27 responses) indicated that they did not do this, while 11% (or three of 27) were unsure. Three of the 27 responding DOTs (11%) indicated that they did combine HSM adjustment factors and their SPFs.
Respondents who did not develop their own SPFs were asked why they did not choose this alternative (survey question no. 30). Table 89 provides a summary of reasons the DOTs did not develop their own state-specific SPFs. Due to how survey questions were asked, differences were not able to be quantified between network-screening-level and design-level SPFs. The chief reason the responding DOTs did not develop their own state-specific SPFs was available staff resources (67% or 10 of 15 responses).
Table 88. Reasons state-specific SPFs used as preferred alternative for customizing HSM methods (n = 23).
| Response | Percent (Number) of Responsesa |
|---|---|
| Precision needed for crash frequency predictions | 57% (13) |
| Had sufficient in-house expertise to develop SPFs | 30% (7) |
| Had sufficient resources available to support project to develop SPFs | 48% (11) |
| Do not have specific data/variables to apply other SPFs | 13% (3) |
| Needed to capture regional differences across the state | 22% (5) |
| Other (please elaborate) | 26% (6) |
aNote that the percentages do not add up to 100% as agencies were allowed to select multiple responses for this and subsequent questions.
Table 89. Reasons state DOTs did not develop state-specific SPFs (n = 15).
| Response | Percent (Number) of Responsesa |
|---|---|
| Data availability | 47% (7) |
| Available staff resources | 67% (10) |
| Available staff skill sets | 33% (5) |
| Available budget | 33% (5) |
| Other methods provided precision needed to support decision-making | 27% (4) |
| Other (please elaborate) | 20% (3) |
aNote that the percentages do not add up to 100% as agencies were allowed to select multiple responses for this and subsequent questions.
Notable “Other” answers included:
- Calibration factors make it easier to use the HSM tools
- Have not incorporated any SPFs or safety software into projects yet
- This is currently in progress
All responding DOTs were asked about challenges to developing state-specific SPFs (survey question no. 31). Table 90 provides a summary of their responses. Due to how survey questions were asked, differences could not be quantified between network-screening-level and design-level SPFs.
Notable “Other” responses include:
- Quality
- Use of state’s data in development of HSM SPFs
- Difficulty convincing senior management of the robustness of the process
- Lack of available adjustment factors
- Crash data quality
- Easier to use HSM tools that are readily available
- Getting contracts developed, siloed nature of different datasets within the agency, and data relevance
- Bridging the gap between academia and practice (specifically, lack of understanding the needs of practitioners)
Table 90. Challenges to developing state-specific SPFs (n = 40).
| Response | Percent (Number) of Responsesa |
|---|---|
| Data availability | 60.0% (24) |
| Available staff resources | 65.0% (26) |
| Available staff skill sets | 57.5% (23) |
| Available budget | 40.0% (16) |
| Other (please elaborate) | 27.5% (11) |
aNote that the percentages do not add up to 100% as agencies were allowed to select multiple responses for this and subsequent questions.


