Developing a Guide for Rural Highways: Reliability and Quality of Service Evaluation Methods (2024)
Chapter: Appendix B: Two-Lane Highway Passing Lane Segment vs Multilane Highway Segment
Appendix B: Two-Lane Highway Passing Lane Segment vs Multilane Highway Segment
Introduction
In most situations, it should be clear to the analyst whether a section of highway with two directional lanes should be analyzed with the multilane highway analysis methodology or two-lane highway passing lane segment analysis methodology. However, the HCM does not provide explicit guidance on this issue. This section provides such guidance for selecting the appropriate analysis methodology as well as situations in which both analysis methodologies may provide similar LOS results.
A two-lane highway passing segment, referred to hereafter as a passing lane segment, is typically a short length (3 miles or less) of roadway with two directional lanes that is preceded and succeeded by relatively longer stretches of two-lane highway (1-lane per direction). Two-lane highway passing lane segments are intended to break up platoons of vehicles that have formed upstream due to extended stretches of two-lane highway with limited or no passing opportunities. Operations within the passing lane segment are typically marked by many lane changes at or near the beginning of the passing lane segment--slower or faster vehicles moving to the added lane, depending on signage--and many lane changes at or near the end of the passing lane segment due to the lane drop.
The two-lane highway passing lane segment analysis methodology is not intended for application to stretches of two-lane roadway (one direction) in the following situations/configurations:
- An intersection is at the point of transition from one lane to two lanes (same direction) for the highway, and
- A single lane stretch of highway that expands to two lanes (same direction) due to a lane addition from an interchange on-ramp or similar.
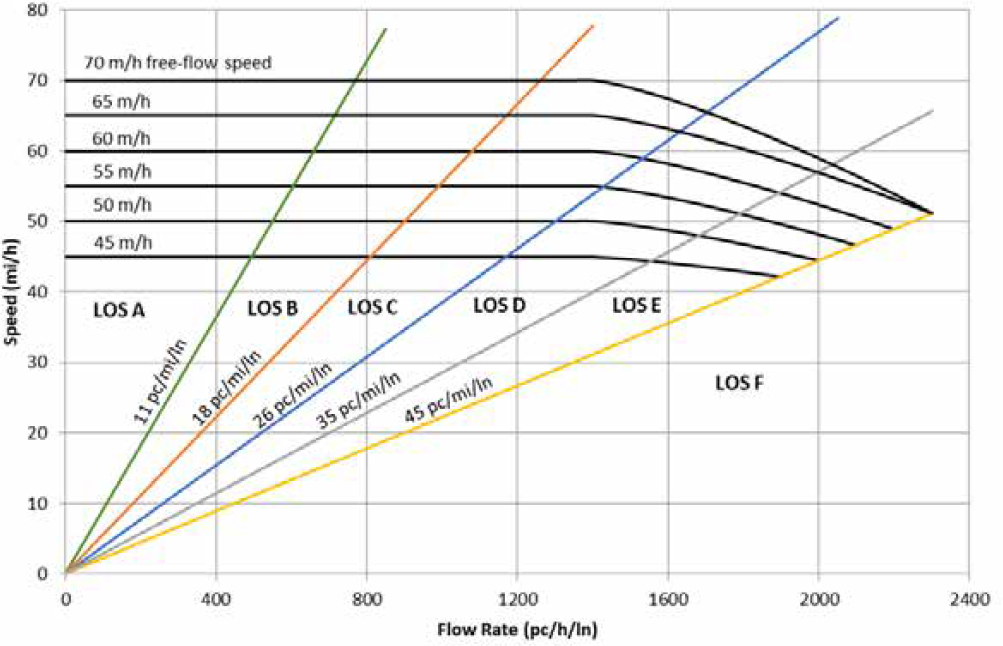
To understand why it is important to apply the appropriate analysis methodology, a brief review of the key analysis components is first provided. Figure B-1 shows speed-flow curves for a multilane highway segment. Figure B-2 shows an example speed-flow curve for a passing lane segment. There is a general similarity in the shape of the curves between the two segment types, as should be expected due to the multilane configuration of both segment types.
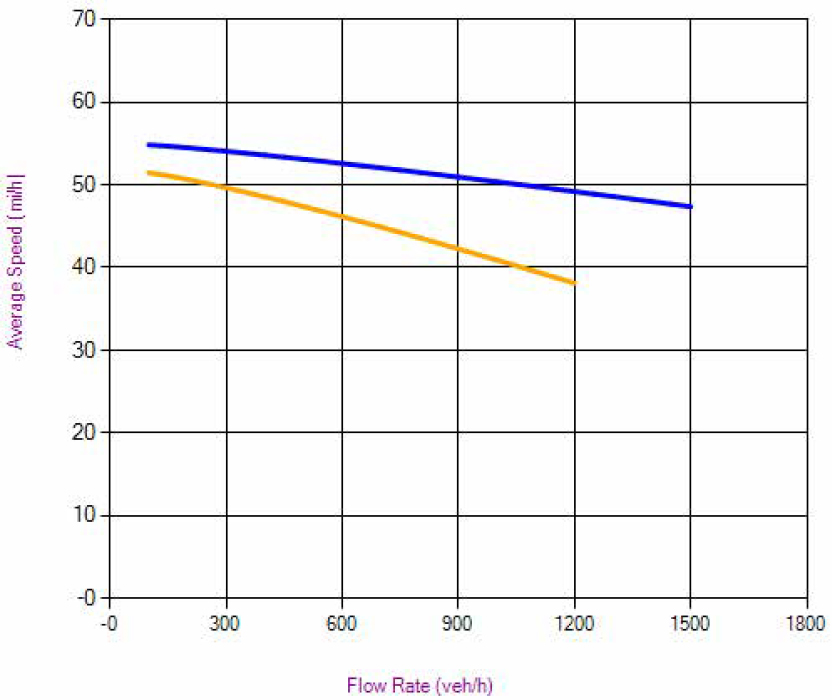
Note: Upper curve (blue) is for vertical class 1, 5% HV, lower curve (orange) is for vertical class 5, HV% = 15%; BFFS = 55 mph, segment length = 1.5 mi
It should be noted that the flow rate units for the multilane highway speed-flow plot are pc/h, whereas the flow rate units for the passing lane segment are veh/h. The two-lane highway analysis methodology does not utilize the passenger car equivalence (PCE) concept. Increasing truck percentage in the traffic stream does not change the shape of the multilane highway speed-flow curve, rather, it just increases the analysis flow rate along the same curve (further to the right along the x axis). Because of limited passing opportunities along two-lane highways, heavy vehicles in the traffic stream can result in very significant speed reductions for the entire traffic stream, especially on upgrades. Thus, it is necessary to be able to change the shape of the speed-flow curve, such as shown with the lower curve in Figure B-2. With this approach, the percentage of heavy vehicles is used directly, rather than indirectly through the PCE concept. For more information about this topic, see Washburn et al. (2018). Additionally, the multilane highway performance measure results are 'segment-wide', whereas passing lane segment results apply to the midpoint of the segment.
Other significant differences in the analysis methodology are with respect to segment length and grade, as follows:
- Segment length:
- Multilane highway segment: Length is only a factor for the multilane highway analysis when there is a specific grade (i.e., not level or rolling general terrain)
- Passing lane segment: Length is a factor for two-lane highway analysis, regardless of grade, up to the maximum practical length.
- Segment grade:
- Multilane highway segment: Grades ≥ 6% give the same results due to the limits of the PCE values in HCM Exhibits 12-26 - 12-28
- Passing lane segment: Grade incline and length translated to appropriate vertical alignment class (1-5)
Research Approach
To provide for a comparison of LOS analysis differences between multilane highway and passing lane segments, the respective analysis methodologies were run for wide range of traffic and geometric inputs. The variables and their settings used in the experimental design for the analysis scenarios are shown in Table B-1 and Table B-2.
Table B-1. Geometric Characteristics Experimental Design Settings
| Variables | Values |
|---|---|
| Number of Directional Lanes | 2 |
| Roadway Length (mi) | 0.5, 1.5, 2.5 |
| Roadway Grade (%) | 0, 2, 4, 6, 8 |
Table B-2. Traffic Characteristics Experimental Design Settings
| Variables | Values |
|---|---|
| Free-Flow Speed (mph) | 55, 65 |
| Flow Rate (veh/h) | 300, 600, 900, 1200, 1500, 1800 |
| Heavy Vehicle Percentage (%) | 0, 5, 10, 15 |
Notes:
- The truck type was split 60/40 for SUT’s and TT’s, respectively (for multilane highway segments).
- Free-flow speeds of 55 and 65 mph are used because this range covers most rural multilane and two-lane highway segments. Furthermore, if the Free-flow speed (FFS) is lower than 50 mph, passing lanes are typically not present.
Of the listed variables, the roadway grade and FFS are only used in the multilane highway analysis calculations. While the equivalent vertical alignment classification and posted speed, respectively, are used in the two-lane passing lane analysis calculations.
Because of the differences in the analysis methodologies, the following steps were taken to create as comparable inputs as possible between the two segment types.
- FFS
- Multilane highway segment: Set directly.
- Passing lane segment: FFS is a function of posted speed, percentage of heavy vehicles, and vertical classification (HCM equations 15-2, 15-3, and 15-4)
- The posted speed for the two-lane highway passing lane segments were set to yield an FFS that matched as closely as possible to the multilane highway FFS.
- Roadway Grade
- The conversion from the roadway grade (length and %) for a multilane highway segment to the equivalent vertical alignment classification for a two-lane highway segment was done using HCM Exhibit 15-11.
Results
The LOS for both the multilane highway and two-lane passing lane results were converted into a numeric value in the range of 0 to 5 for comparison purposes. The conversion factors for both the multilane highway and two-lane passing lane are shown in Figure B-3.

Each numeric value corresponds to a LOS letter/grade, 0 = A, 1 = B, 2 = C, 3 = D, 4 = E, 5 = F.
The graphs representing the LOS comparison between the multilane and two-lane highway analysis use the average of the 0%, 5%, 10% and 15% heavy vehicle percentage. Taking the average of the heavy vehicle percentage, for each respective length and grade, allowed the graphs to be more legible. Since there is little variance between the LOS across the different heavy vehicle percentages, utilizing the averages did not impact the overall results.
Multilane vs Two-lane Speed-Flow Curves are shown in the following figures.
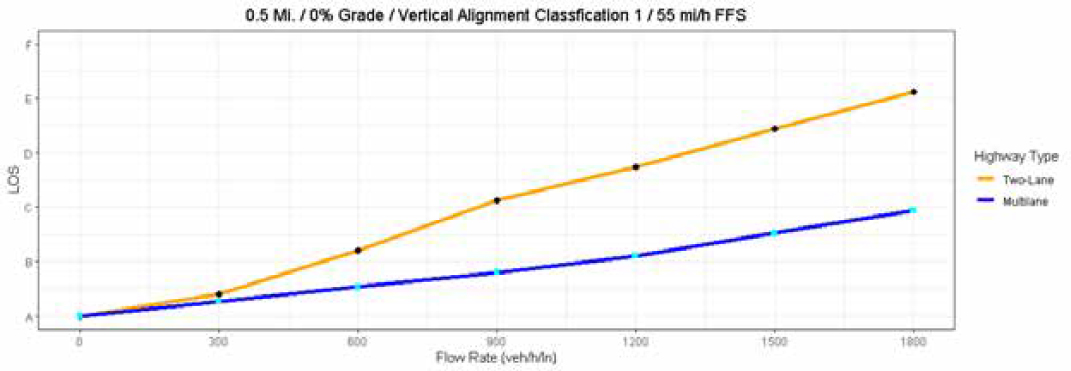
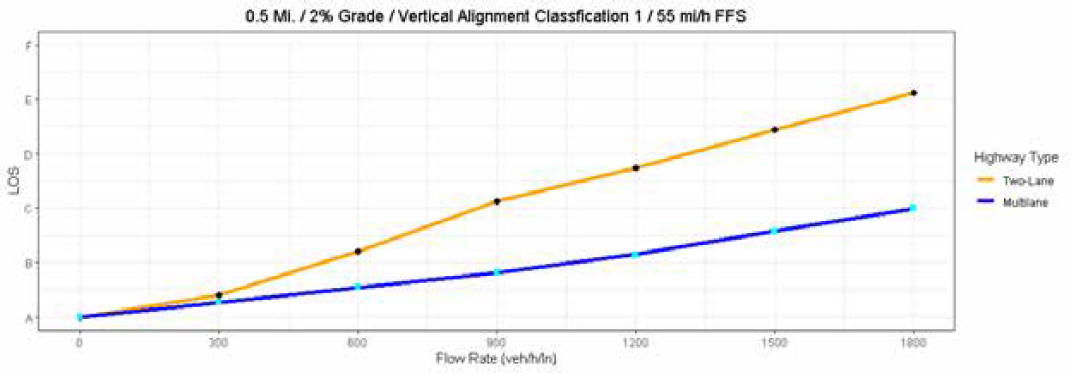

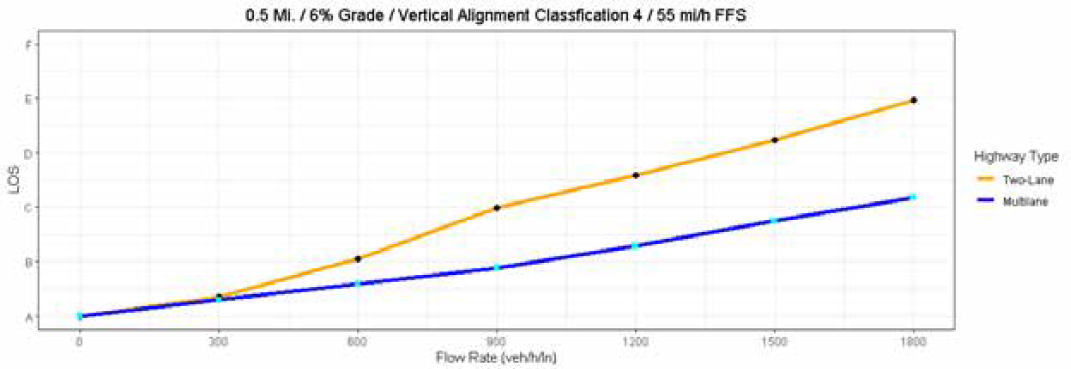
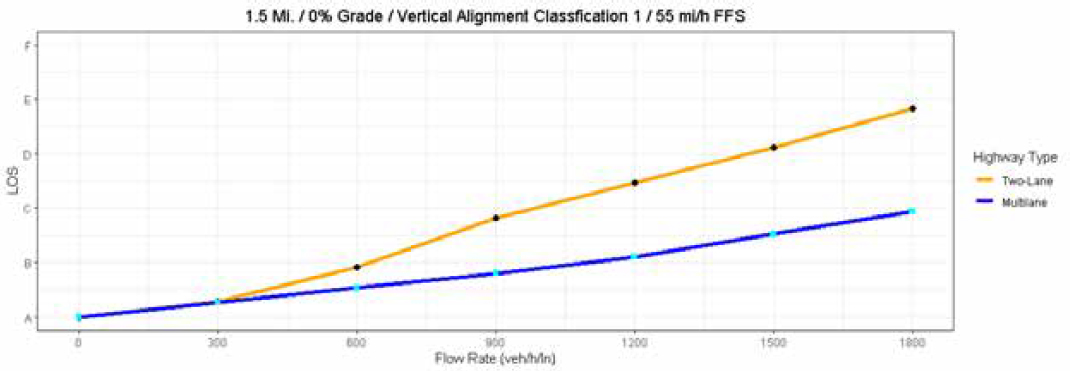
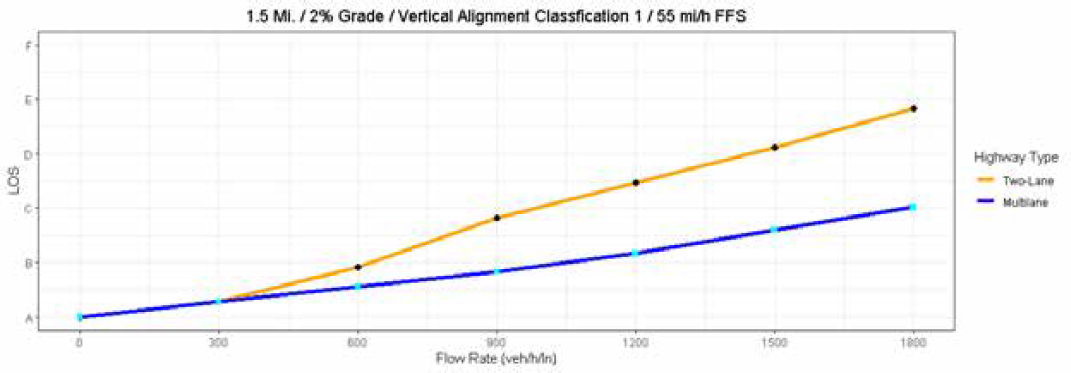
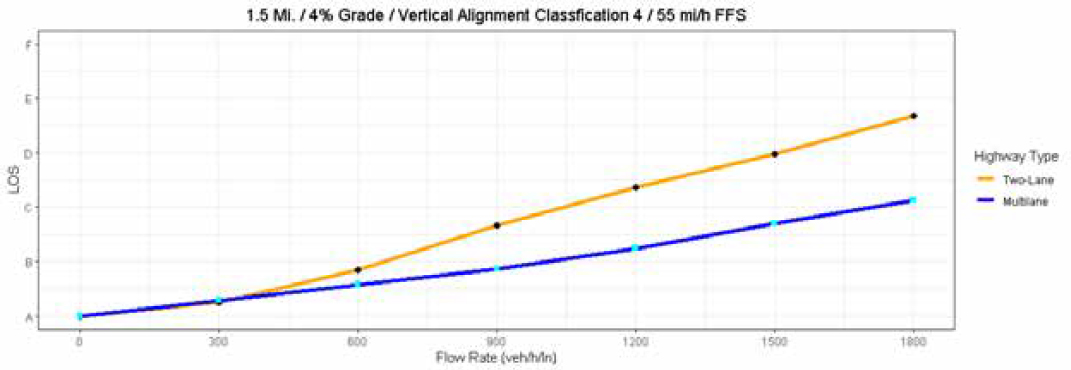
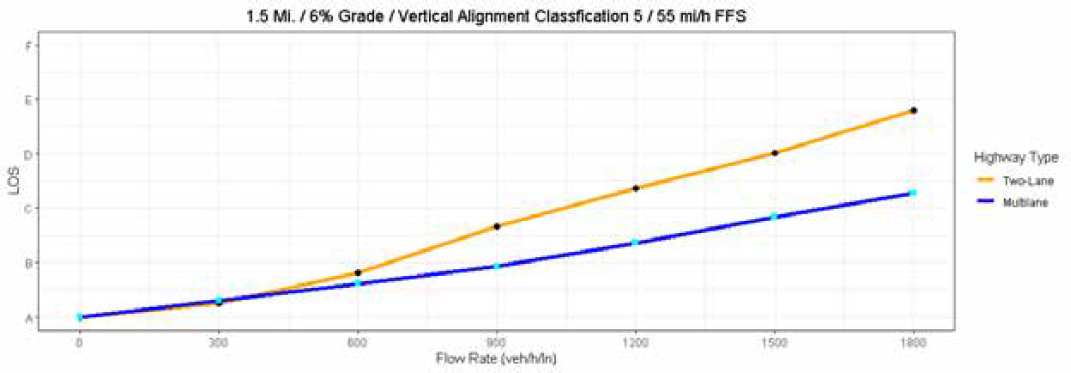
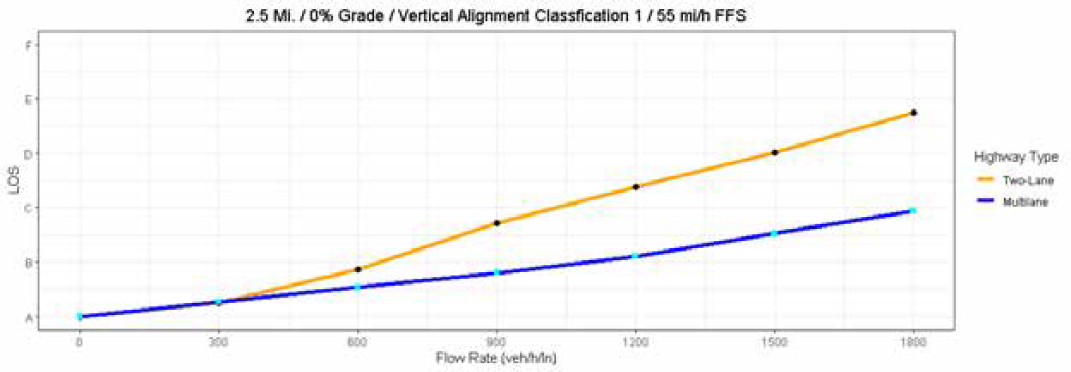


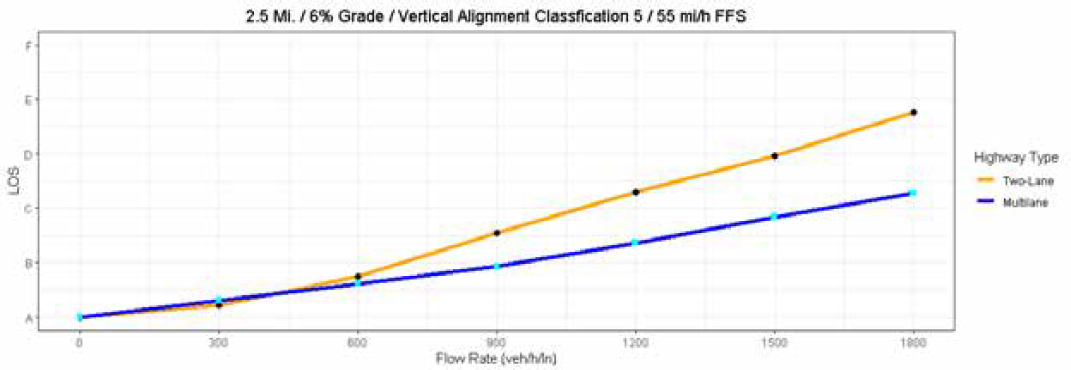
The results between the 55 mph and 65 mph FFS showed consistent trends. Only the plots from the 55 mph FFS are included since the difference in LOS between the multilane highway and two-lane passing lane is larger at this speed. This difference shows the importance of using the correct methodology when calculating a multilane highway or two-lane passing lane.
Based on these results, the following conclusions and guidance is provided:
Multilane Highway Segment
- The LOS results are generally insensitive to grade for 0% heavy vehicles.
- For level terrain, LOS will always be 'A' or very close, as the max flow rate that could enter a passing lane segment is around 1800 veh/h (900 veh/h/ln).
- For a specific grade analysis, the LOS results for grades of 6% and higher will be same because 6% is highest grade for which PCE values are provided.
- For a specific grade analysis, the LOS results will be the same for segment lengths of 1.5 miles for grades ≤ 3.5% or 1.0 miles for grades ≥ 4.5%, due to the limits of the PCE values in HCM Exhibits 12-26 - 12-28.
Passing Lane Segment
- The LOS results will be the same for lengths of 3 miles and greater, as a function of the segment length limits in HCM Exhibit 15-10. This generally reflects the diminishing returns in platoon dispersion for passing lane segment lengths greater than 3 mi in length.
For the following conditions, the same LOS results can be expected from both the multilane highway and passing segment analysis methodologies. Note that these conditions are specific to resulting LOS values, not necessarily any specific performance measure results, such as average speed.
- Segment lengths ≥ 1.5 miles and flow rates ≤ 300 veh/h.
- Segment lengths ≥ 2.5 miles and flow rates ≤ 600 veh/h.
For other conditions, it is important to choose the appropriate analysis methodology.


