Visualization for Public Involvement (2024)
Chapter: 4 Case Examples
CHAPTER 4
Case Examples
The case examples provide additional insights into the state DOT experience and their implementation of visualization for public involvement. The case examples were developed from 1-hour telephone interviews with each selected DOT. Each interview followed a loosely scripted outline (Appendix C) with questions then customized based on individual DOT survey responses. This discussion outline was provided to each DOT in advance, along with a request that they share visualization examples. The visualization examples for inclusion in the case example writeups were provided by the DOTs post-discussion and are intended to illustrate current DOT practice. The discussions were free form and did not always reference the projects shown in the visualization examples. All images in the case examples have been reproduced with permission from the relevant DOTs. Quotes by participating DOT staff are provided verbatim from the interviews.
DOTs were considered for case example interviews based on geographic diversity, use of technologies or practices, noteworthy approaches to overcoming common barriers to the use of visualization methods, and availability for the interview if the DOT recorded their interest in participating in their survey submittal. Four DOTs agreed to participate:
- California Department of Transportation (Caltrans)
- Michigan DOT (MDOT)
- North Carolina DOT (NCDOT)
- Utah DOT (UDOT)
Interview questions addressed specific practices that distinguished the selected agencies from their peers and allowed for an in-depth exploration of their survey responses. Some DOTs focused mostly on visualization practice and implementation and others concentrated on institutional issues, but several recurring themes were noted across all interviews. Interview participant roles within the agencies were varied (e.g., a public involvement officer, a strategic communications manager, a senior transportation engineer, a community studies and visualization group leader, a visualization team lead, and a landscape architect). Some DOT telephone interviews included more than one participant.
General Observations
The following themes recurred during each interview:
- Use of visualization by state DOTs is often decentralized, and methods and their implementation vary across regions and districts.
- Decisions about using visualization typically rest with a project manager or regional unit.
- Visualization is especially effective when sharing design aesthetics or proposed alternatives.
- Using the right visualization for each project phase is critical to a positive public response and avoids conveying the idea that public input is not valued.
- User-friendly visualizations that simplify highly technical, complex information and jargon are more digestible to the public, who may not be interested in or able to understand detailed engineering information.
- DOT evaluation of the effectiveness of visualization methods is primarily qualitative.
- Consultants’ state of visualization practice is generally more developed than that of DOTs.
- Cost/funding availability, staff technical ability, and accessibility/equity challenges are common barriers to the broader use of visualization, especially more advanced methods.
- The ability to procure and install the specialized software needed to generate more advanced visualizations is a critical barrier.
- Project budgets and schedule are often deciding factors in determining the level of effort for a visualization, but technology is making it easier to generate visualization products.
Caltrans
Caltrans is a large agency organized by districts, with the districts having varying levels of visualization capability. Historically, visualizations have been part of the environmental process for visual impact assessment. Exhibit 4-1 provides an example. Simulations have been developed as static before-and-after views to support the analysis of visual impacts. The before-and-after simulations were printed and made into posters for public meetings. Although there have been visualizations developed for other uses, such as a media release during construction or to support discussion of complex issues for large projects, the use of visualization as a tool for project development has been limited to the minimum necessary to meet the project need. Caltrans staff noted “This [use of visualization as a tool for project development] was amplified by a shift to remote work and public meetings during the pandemic where visualizations were able to reach a broader audience.”
Most districts have staff who can, in varying capacities, create some types of visualization products, but no one group holds the responsibility for visualization work products. The Headquarters Bridge Architecture and Aesthetics group is a specialized unit providing visualization, but only on projects that include structures such as bridges and retaining walls. District landscape
Exhibit 4-1. Caltrans photo-simulation—SR-37 360 Tour.
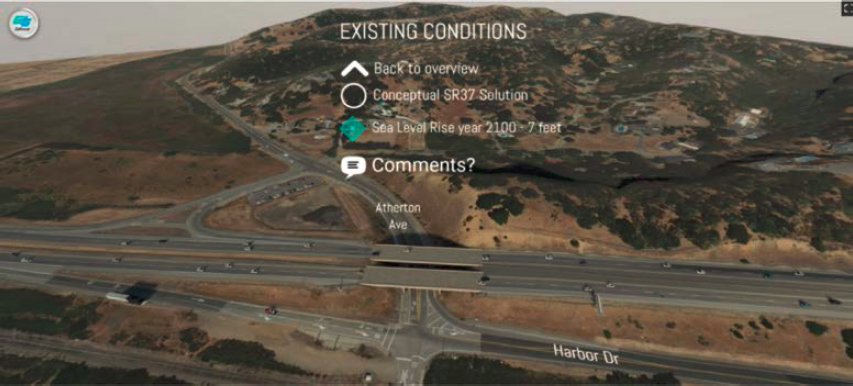
Source: Caltrans, used with permission.
The SR-37 360 Tour, developed for the Resilient SR-37 project, visually describes conceptual responses to sea level rise for this regionally important connection linking the north, east, and west San Francisco Bay Region.
architect staff are responsible for simulations for visual impact assessment during the environmental clearance phase but are not necessarily used for visualization support in other phases of project development. District 4, in the San Francisco Bay Area, recently established a dedicated visualization branch within the Office of Landscape Architecture to broaden the use of visualization work products to amplify engagement, assist in collaboration with partners, and support multi-disciplinary teamwork during project development.
“This was amplified by a shift to remote work and public meetings during the pandemic, where visualizations were able to reach a broader audience.”
—Caltrans Staff
The support for the establishment of a dedicated group for visualization was realized as a convergence of several factors, including a heightened awareness of the skill set and work products from internal innovation fairs, recognition through a Western Association of State Highway and Transportation Officials award, and high-profile project work products. Caltrans staff noted “This [support] was amplified by a shift to remote work and public meetings during the pandemic, where visualizations were able to reach a broader audience.”
Types, Formats, and Implementation of Visualization Technologies
Caltrans uses the full spectrum of visualization tools (see Exhibits 4-2 and 4-3 for examples and further detail). The visual format options are discussed between internal stakeholders and prepared for virtual or in-person meetings to solicit engagement. The more advanced tools (i.e., real-time interactive 3D, AR, VR) are typically used for more complex projects that require more partners, regulatory agencies, and the public to be informed. Conversely, Caltrans staff noted that “. . . when engaging with smaller community groups, hand-sketched concepts are more engaging for people who want to influence the design before all the decisions are made.”
“. . .when engaging with smaller community groups, hand-sketched concepts are more engaging for people who want to influence the design before all the decisions are made.”
—Caltrans Staff
Accessibility and Equitable Engagement Strategies
Caltrans uses various methods to share visualizations with the public, including in-person and virtual meetings, websites, video, and print and digital publications. Although Caltrans mostly uses static visualization displays at in-person meetings, more recently Caltrans has been using QR codes linking to interactive websites and Google cardboard viewers to provide experiential visualization—these approaches have been well-received. Caltrans staff commented, “When thinking about accessible communication, start by asking who you are trying to communicate with and why.”
Exhibit 4-2. Caltrans photo-simulation of the El Camino Real Roadway Renewal project.
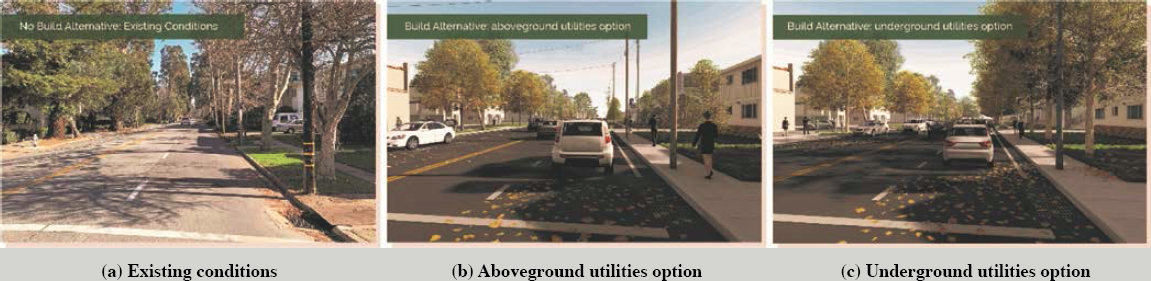
Source: Caltrans, used with permission.
For El Camino Real Roadway Renewal, a photo-simulation series illustrated existing conditions (a) and two future conditions 20 years post-construction, most clearly show the difference between alternatives replacing impacted street trees with utilities left above ground (b) and replacing the trees after undergrounding utilities (c). The presence of aboveground utilities would limit the size of permissible replacement trees.
Exhibit 4-3. Caltrans 3D rendering of planning-level visualizations for wildlife crossing in Humboldt County, CA.
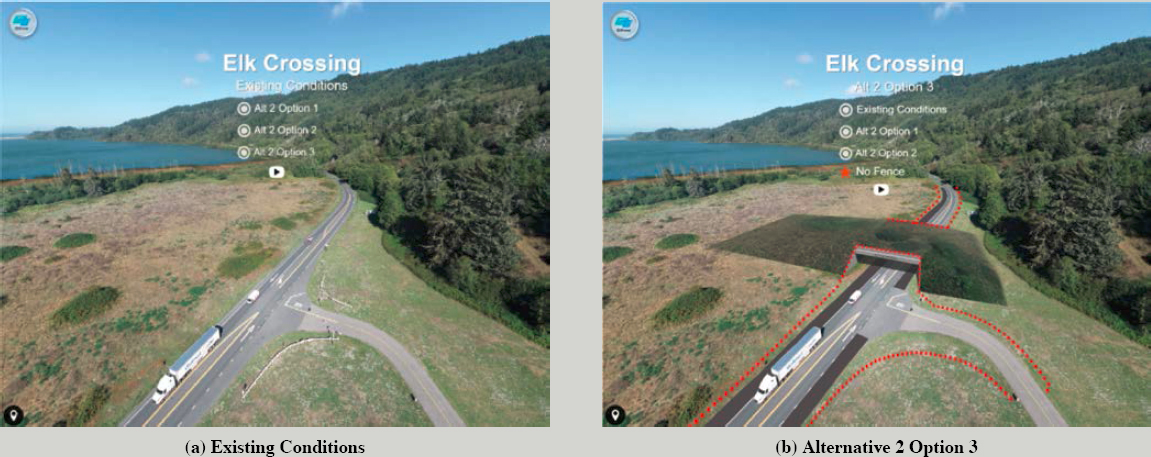
Source: Caltrans, used with permission.
Visualizations were used to coordinate reviews by environmental agencies and landowners.
Visualizations are also used for on-site physical demonstrations of proposed concepts. Examples include showing a section of a proposed sound wall design in a parking lot and testing a new roundabout design in a live demonstration area that the public can drive through for a firsthand experience.
The Governor’s Middle Mile Broadband Initiative (MMBI) was created to achieve digital equity in California by expanding broadband networks into rural, tribal, and other underserved areas traditionally without reliable, high-speed internet service. Visualizations can effectively overcome language and educational barriers; however, static images and more sophisticated experiential visualization technologies can be challenging for people who have visual impairments. Discussing accommodations at the start of the development process and designing the visualizations with visual impairments in mind can support better outcomes than remediating at the end. Accessibility accommodation, including hard-copy prints of digital resources, are generally available on request.
“When thinking about accessible communication, start by asking who you are trying to communicate with and why.”
—Caltrans Staff
Barriers to Using Innovative Visualizations
Visualizations have been available for decades, either in-house or from consultants, but visualization use has been limited. As a result of the COVID-19 pandemic, the proliferation of web-based meetings made visualizations easier to consume by a larger audience and raised stakeholder expectations. Exhibit 4-4 presents an a visualization used during a virtual meeting.
Additionally, advances in software and hardware have made rapid, cost-effective development of visualizations possible within Caltrans. Although adoption of new technology and expensive hardware and software can present barriers to innovation for DOT employees, as visualization work products become more ingrained in workflow, costs will decrease and become part of normal purchasing. Perhaps the greatest contributor to the shifting paradigm at Caltrans is the federal recognition of visualizations as a valuable tool in the project development process. In 2022, Caltrans won AASHTO’s Transportation Award for Best Use of Technology & Innovation for the Western Association of State Highway and Transportation Officials region for Caltrans’
Exhibit 4-4. Caltrans 3D virtual environment of Tamalpais Drive Overcrossing Improvements in Marin County, CA.
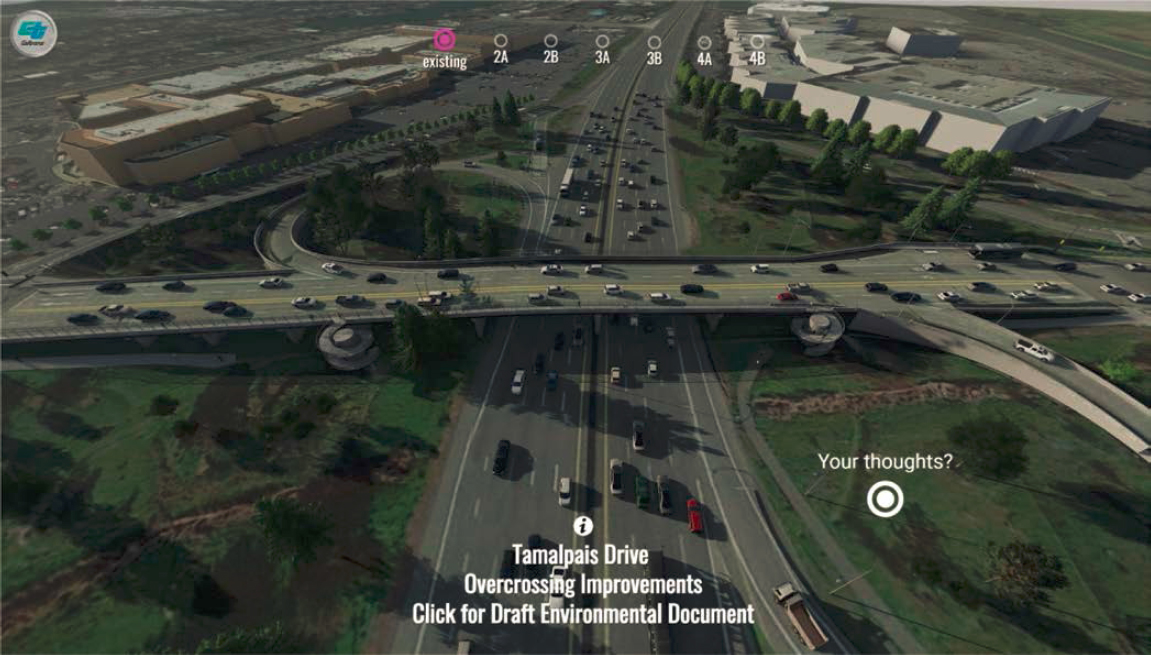
Source: Caltrans, used with permission.
The Tamalpais Drive Overcrossing Improvements included multiple design alternatives that could be explored online along with a link to submit feedback. The 360 Tour was released by QR code embedded in public-notice postcard mailers and newspaper ads.
360 Tours. Winning the regional award made Caltrans a finalist for the national award. The resulting federal recognition and a statewide marketing campaign have given formal use of visualizations increased credibility.
DOT Guidelines and Policies
Caltrans Headquarters has launched a Visualization Task Force as part of the Building Information Modeling for Infrastructure (BIM4I) statewide initiative. The task force will develop a formal approach for integrating visualizations into the project delivery process. The integration is being coordinated with statewide public engagement policy efforts. The deliverable of the task force will be an organized process for visualization development that identifies funding, work products, and schedules from project initiation to construction. The effort is designed to address the cycle of ad hoc and reactive requests for visualizations and integrate use of visualizations into project delivery.
Located in Mariposa County, CA, the Ferguson landslide area (Ferguson Slide) has seen several rockslides affecting the tourist route into Yosemite National Park (Exhibit 4-5). Detours, which have been in place for many years, create lengthier travel times. The Ferguson Rock Shed Project has been pursued to address this situation. Several aesthetic concepts developed by the Caltrans Bridge Architecture & Aesthetics Branch were shared and discussed with the Caltrans project team. The visualizations helped convey the overall presence the structure would have in the environment. The aesthetics of the structure also included tribal influences that were coordinated with tribal representatives who were part of the project development team.
Exhibit 4-5. Caltrans 360 Tours of the Ferguson Rock Shed Project in Mariposa County, CA.
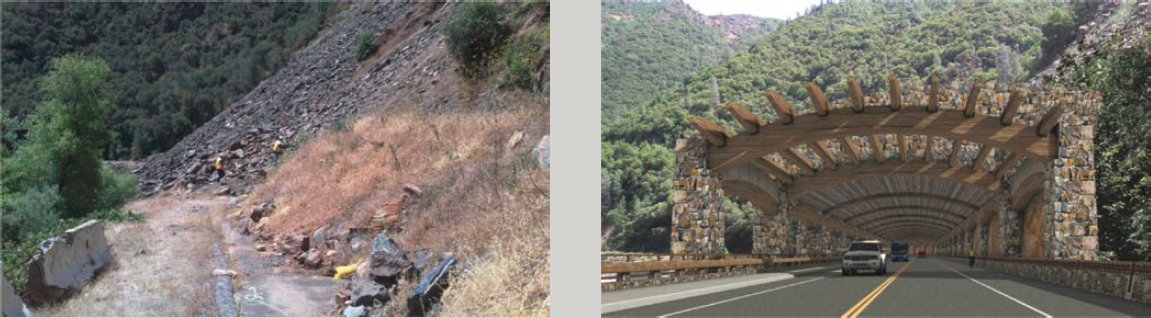
Source: Caltrans, used with permission.
Michigan Department of Transportation
The Michigan Department of Transportation (MDOT) is a large, decentralized agency organized into districts. These districts have varying levels of interest in using visualization technology. The approach to using visualization for public involvement is decentralized and largely driven by community preferences, information needs, and project budgets. There is no notable difference in visualization preferences across rural, suburban, and urban communities. MDOT uses “a little bit of everything” from the visualization toolbox around the state, but there is no common platform for sharing visualizations across MDOT regions. MDOT staff noted, “It’s important to ask project teams about the best way to reach people that drives decision-making. And when something is not working, we need to be able to pivot.”
“It’s important to ask project teams about the best way to reach people that drives decision-making. And when something is not working, we need to be able to pivot.”
—MDOT Staff
The MDOT Public Involvement and Hearings Officer (PIO) communicates daily across the state, communicating branding and message requirements and inquiring about visualization needs, but the PIO has both limited opportunities to (1) engage directly in the Request for Proposals project stage and (2) make recommendations on appropriate visualization methods. A project manager’s local knowledge is what typically determines which visualization methods will be used on a project, and the chosen methods are successful most of the time. Generally, the project managers are open to modifying outreach approaches when significant public feedback is lacking, especially on multi-year programs. MDOT staff commented that “Sometimes it’s easy to forget how much information a picture communicates to stakeholders . . . it can be more important than the paragraph we show next to it.”
MDOT noted that some project managers are progressive in their public involvement approaches, while others prefer traditional and simpler visualization methods. Exhibit 4-6 shows landscaping improvements along the Modernize 75 Corridor. Visualization is more universally applied when the PIO is involved. In many instances, consultant recommendations are influential in driving use of a visualization tool, whether a consultant’s proprietary tool or third-party software.
“Sometimes it’s easy to forget how much information a picture communicates to stakeholders . . . it can be more important than the paragraph we show next to it.”
—MDOT Staff
Types, Formats, and Implementation of Visualization Technologies
MDOT finds spending resources on visualization most justified and feasible when National Environmental Protection Act (NEPA) protocols are initiated on a project. The agency places high importance on using visualization to engage the public in developing alternatives. For example, during a 2-week online open house held in lieu of an in-person public meeting, MDOT used the interactive functionality and features of a virtual environment to “walk” stakeholders through
Exhibit 4-6. MDOT illustrated sketches of landscaping improvements along the Modernize 75 Corridor.
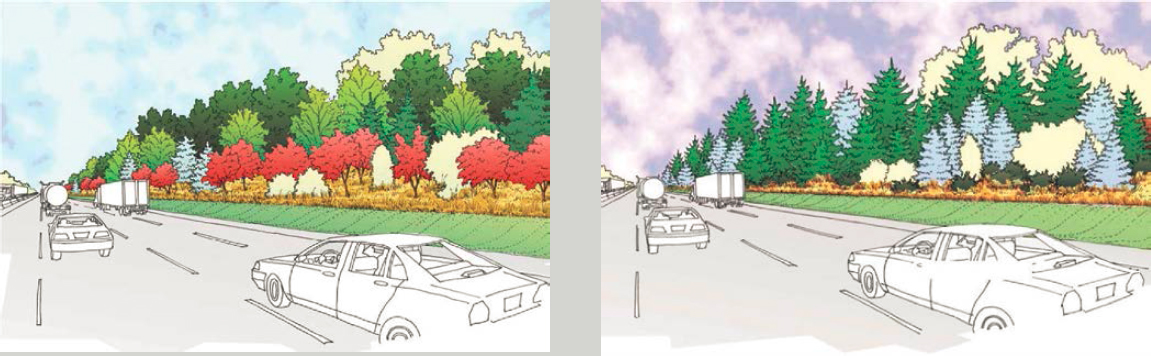
Source: MDOT, used with permission
Landscaping improvements along the Modernize 75 Corridor were important to communities along I-75, so conceptual illustrations were presented to show visual aesthetics.
project features, achieving an elevated level of public engagement. Stakeholders could engage at any time during the 2-week period and contributed to the overwhelming community feedback.
Smaller communities in Michigan’s Upper Peninsula tend to prefer virtual meetings and project videos on YouTube. MDOT creates these by driving the project corridor with a GoPro camera and adding annotations to indicate issues of concern (e.g., by highlighting an area with a difficult road merge).
“. . . the visualizations were 100% instrumental in winnowing down the alternatives.”
—MDOT Staff
In the planning process, visuals (e.g., maps, conceptual sketches, and cross-sections) are often more beneficial than text descriptions. During a review of the effectiveness of conceptual renderings, the MDOT Public Involvement team noted the importance of providing legible text and using layperson terminology rather than technical jargon. MDOT also finds infographics a valuable tool in public involvement efforts. MDOT staff noted that “the visualizations were 100% instrumental in winnowing down the alternatives.”
On the I-94 Connected and Automated Vehicle Corridor Project, the initial presentation at the public meeting was unsuccessful. When the slides were redone to include visual representations of the connected and automated vehicle features being discussed, a more responsive and engaging meeting transpired. MDOT used a series of side-by-side conceptual sketches and traffic simulation still images to highlight the benefits of the I-94 Connected and Automated Vehicle Corridor (see Exhibit 4-7). MDOT’s revised approach was “. . . just show what we are doing and how we are doing it. . . .” A YouTube video made from the new slide presentation expanded information outreach.
Accessibility and Equitable Engagement Strategies
MDOT strictly adheres to accessibility compliance for all public involvement deliverables and uses accessibility testing software. In some instances, visualization methods—such as a VR meeting room—have been rejected because of the complexity of making them accessible.
MDOT, recognizing that parts of Michigan have populations that are economically disadvantaged or with limited English proficiency, assesses whether information is being presented in a format accessible to these stakeholders. Often, graphic information is presented in multiple formats, from high level to “breaking things down” to imagery not requiring text explanation. Exhibit 4-8 provides an example of how MDOT has used photographs to make construction
Exhibit 4-7. MDOT traffic simulation to highlight the benefits of the I-94 Connected and Automated Vehicle Corridor.
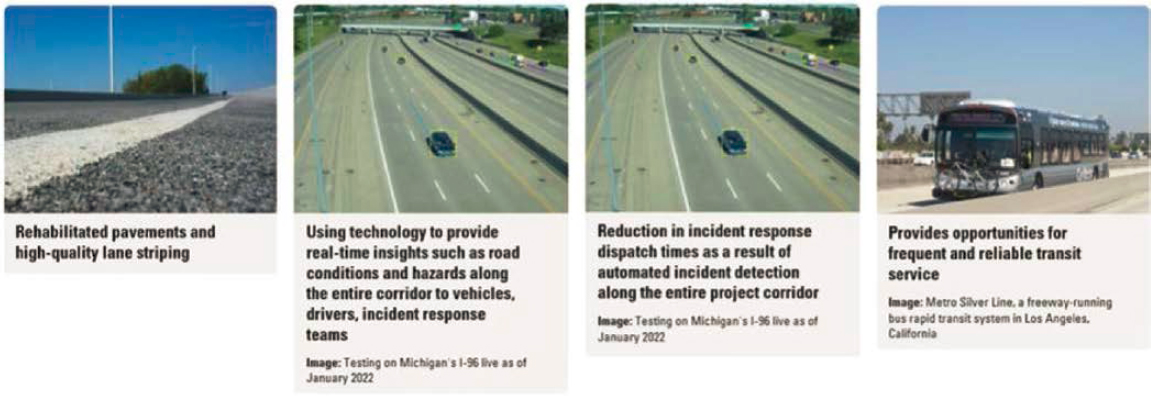
Source: MDOT, used with permission
program complexity accessible to the public. Selecting appropriate engagement methods requires understanding the communication channels used in each community.
For the I-75 Corridor project, MDOT held several public meetings to share the seven project alternatives on display boards, during which a suggestion (and follow-on written proposal from a stakeholder) resulted in the combining of two alternatives. MDOT then deployed an online survey asking the public to rank the alternatives, which were provided as visualizations with text descriptions. A YouTube video was first used to introduce the survey, and 3,000 views netted 219 survey responses. Project implementation alternatives were narrowed from seven to three, with the visualizations playing a significant role in the winnowing process.
DOT Guidelines and Policies
Consultant recommendations influence the use of visualizations, especially more advanced methods, when value can be defined. Exhibit 4-9 provides an example of how such methods can make concepts more accessible to laypeople.
Exhibit 4-8. MDOT photo array of the tunnel boring machine used to construct the tunnels for I-75 Segment 3.
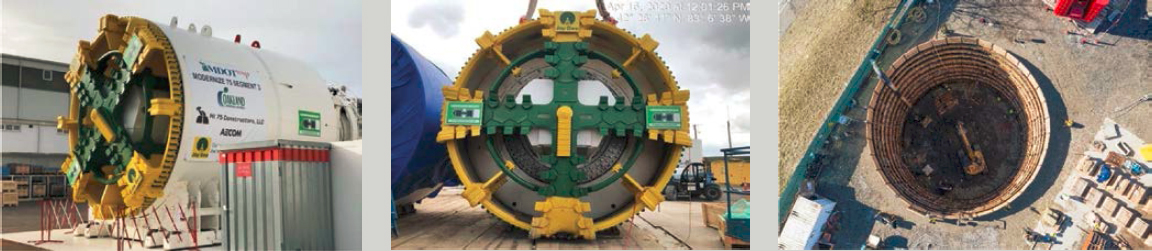
Source: MDOT, used with permission
The “Tunnel” is a major part of the drainage system improvements for I-75 Segment 3. Photographs of the massive tunnel boring machine used to construct the tunnels brought the complexity of this construction program to life for the public.
Exhibit 4-9. MDOT 3D rendering of a managed lane configuration on I-96.
Source: MDOT, used with permission
This rendering from a 3D model simplifies understanding about the operation of a managed lane configuration on I-96.
Exhibit 4-10 shows visuals of the I-94 Modernization project in Detroit, which involved replacement of 38 bridges. MDOT shared visuals of new bridge aesthetics at public meetings, including a constellation design intended to evoke Detroit’s Underground Railroad history, to emphasize the importance of aesthetic appeal that also embraces regional history.
With the potential for cost savings and greater control over how visualizations are developed, MDOT plans to perform more public involvement and visualization development in-house. The process will start with software procurement in collaboration with another state agency, including a 14-month process to develop a list of what is needed.
Exhibit 4-10. MDOT concept illustrations of the I-94 Modernization project in Detroit.

Source: MDOT, used with permission
The project involved replacement of 38 bridges. MDOT shared visuals of new bridge aesthetics at public meetings, including a constellation design intended to evoke Detroit’s Underground Railroad history.
Barriers to Using Innovative Visualizations
MDOT identified four major barriers to using advanced visualizations:
- Cost/funding availability.
- Staff technical capabilities.
- Difficulty meeting ADA and Section 508 accessibility requirements.
- Difficulty providing equitable access to visualization for all stakeholders.
MDOT staff noted, “We blew the budget, but the overwhelming public comment response (over 1,200) was well worth it. We usually receive only 40–50 comments in an in-person meeting.” Having to document the value of visualization methods in order to justify expenditures and then work the request through the MDOT management limits the use of more advanced visualization methods. Project managers typically lead in using visualization methods, and several managers are moving MDOT toward more advanced public involvement methods. However, successful procurement is influenced by approval from regional directors and supervisors, who may not perceive the value of visualization methods. Fiscal needs and limited budgets often outweigh the goal of advancing technology innovation in public involvement, even though public involvement is universally supported across MDOT. Limitations in staff knowledge of visualization methods are also a barrier to broader use.
“We blew the budget, but the overwhelming public comment response (over 1,200) was well worth it. We usually receive only 40–50 comments in an in-person meeting.”
—MDOT Staff
North Carolina Department of Transportation
The North Carolina DOT (NCDOT) is a large agency with a centralized Public Involvement Group and Communications Office. NCDOT follows a centralized approach to visualization technology but a regional approach to public involvement. NCDOT management supports innovation in outreach. NCDOT staff noted, “Visualization is graphical public involvement. Project teams ‘see’ information in 3D, but the public does not. A visualization is worth 1,000 words and then some, to convey complex concepts to the public in the easiest manner possible.”
The four-person Visualization Team originated under NCDOT’s Information Technology unit but was moved under the Environmental Analysis Unit (EAU) when a cabinet-level Department of Information Technology was created. The EAU Public Involvement, Community Studies & Visualization Group (PICSViz) now often determines the need for visualization on projects and develops the scope of work, which is fine-tuned as a project progresses.
NCDOT staff commented that “When public meetings were placed on hold during the 2020 pandemic, we had the opportunity to use the more advanced and innovative visualization tools we were developing and showcase how they improve public involvement. They have really enhanced our public outreach and participation because more people are seeing content.”
“Visualization is graphical public involvement. Project teams ‘see’ information in 3D, but the public does not. A visualization is worth 1,000 words and then some, to convey complex concepts to the public in the easiest manner possible.”
—NCDOT
Having specialized visualization expertise within EAU facilitates discussions with project teams about visualization options—many teams are unsure about what they want or need or are unaware of the options available. On occasion, other divisions in need of visualization will use EAU resources (e.g., the Department of Motor Vehicles).
Since the COVID-19 pandemic, NCDOT has changed its approach to public involvement by adding new techniques to its public involvement toolbox. These techniques have reduced the need for public meetings for every project and much information is shared digitally via social media and project websites, which are managed by the NCDOT Communications Office.
NCDOT finds tremendous benefits in using visualization for public involvement. Visualizations are easily shared through various media channels and can be used to explain a project to anyone, regardless of their background or prior knowledge. Visualizations enhance engagement at live meetings and improve dialog at in-person events.
Types, Formats, and Implementation of Visualization Technologies
EAU and its Visualization Team use the full gamut of visualization methods—from static deliverables to immersive/interactive tools—depending on the messaging need, audience, and function. Exhibit 4-11 presents an example taken from the VR application created to help convey the design concept of the I-440 Walnut-to-Wade project to the public.
The Visualization Team regularly researches the state of visualization practice, seeking ways to improve product delivery and trying new software tools. NCDOT staff noted that, “It’s about determining the right product at the right time. The important thing is to use what works, be willing to try something new, be creative, listen to your audience . . . and evaluate your results.”
For each project, the engagement approach and visualization methods are determined by the project scope and complexity, project phase, possibility of controversy, anticipated engagement level, and sophistication of the community. NCDOT subscribes to two online engagement platforms to manage public feedback and project mailing lists. Stored data can be exported for review of trends in public sentiment and email can be used to keep the public informed about project developments.
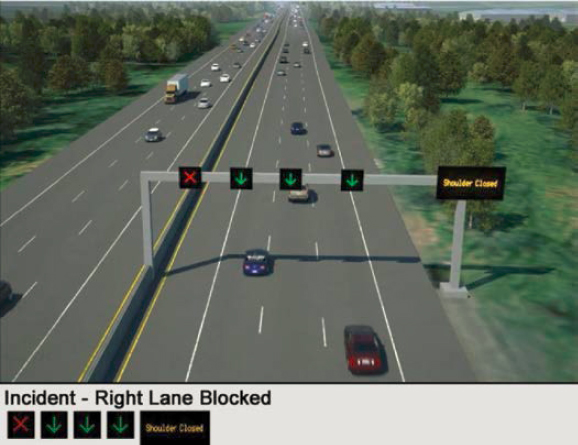
Although more traditional visualization methods (e.g., printed matter and display boards) remain in use, implementation of more experiential visualization methods at public meetings is growing (e.g., AR/VR, real-time interactive). However, some areas within North Carolina have limited broadband bandwidth, so using advanced technology at public meetings may not be feasible and display boards and QR codes are more suitable. Exhibits 4-12 and 4-13 provide examples of these approaches. Generally, the public is receptive to advanced and emerging visualization technologies.
“When public meetings were placed on hold during the 2020 pandemic, we had the opportunity to use the more advanced and innovative visualization tools we were developing and showcase how they improve public involvement. They have really enhanced our public outreach and participation because more people are seeing content.”
—NCDOT Staff
“It’s about determining the right product at the right time. The important thing is to use what works, be willing to try something new, be creative, listen to your audience . . . and evaluate your results.”
—NCDOT Staff
In choosing what type of visualization to use, the project stage is a key factor. Typically, for a preliminary outreach effort NCDOT uses static renderings, photo simulations (Exhibit 4-14) and video, and full-blown 3D models and fly-through animations at a later stage (Exhibit 4-15). NCDOT envisions that 2D deliverables will cease to be used and all visualizations will be generated from 3D models as the technology, expertise, and workflows evolve. Exhibit 4-16 provides an
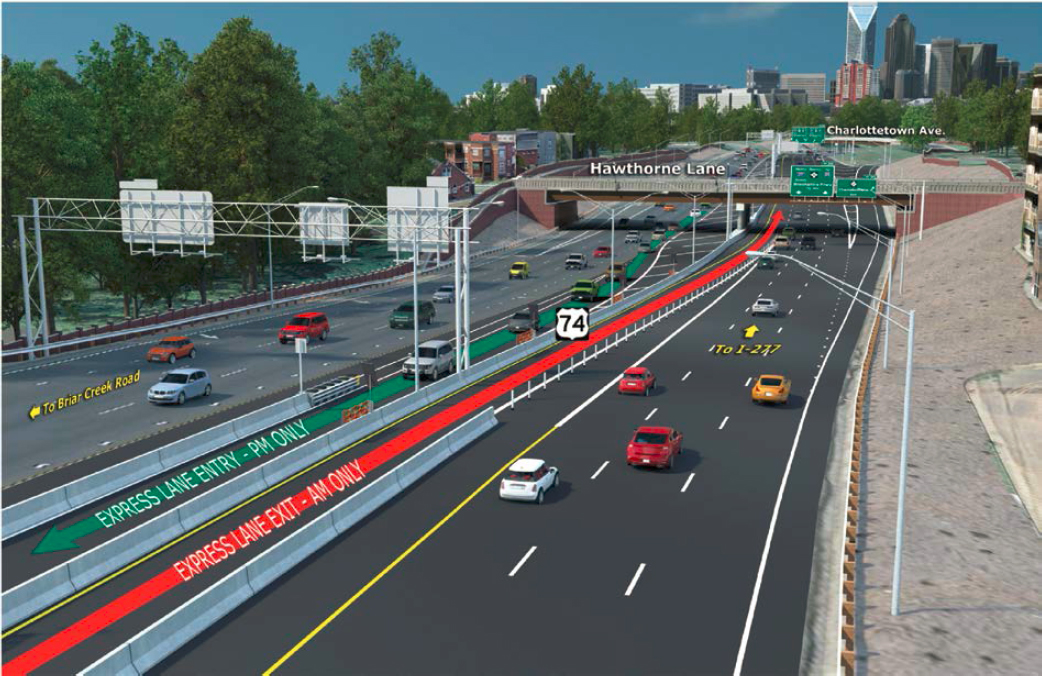
Exhibit 4-11. NCDOT VR application for the I-440 Walnut-to-Wade project.
Source: NCDOT, used with permission
A virtual reality application was developed for the I-440 Walnut-to-Wade project to better translate the appearance and location of the design concept and was dispersed across online channels.
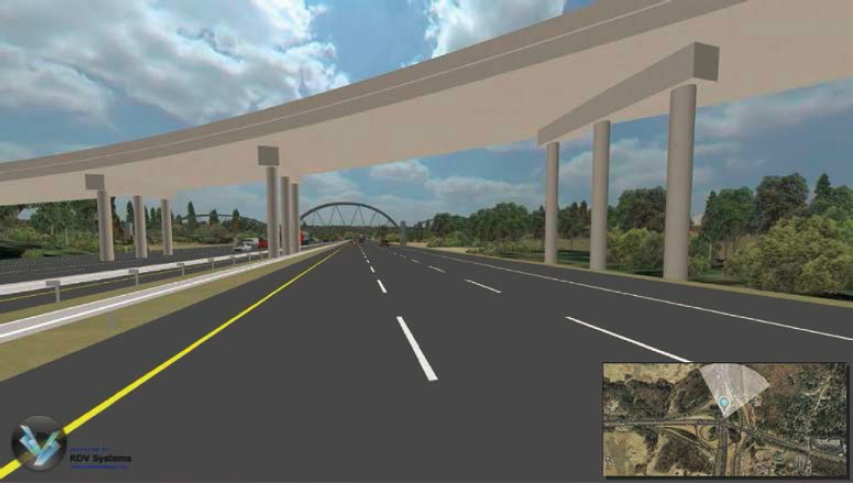
Exhibit 4-12. NCDOT 3D rendering of the proposed Capital Boulevard project in Raleigh.
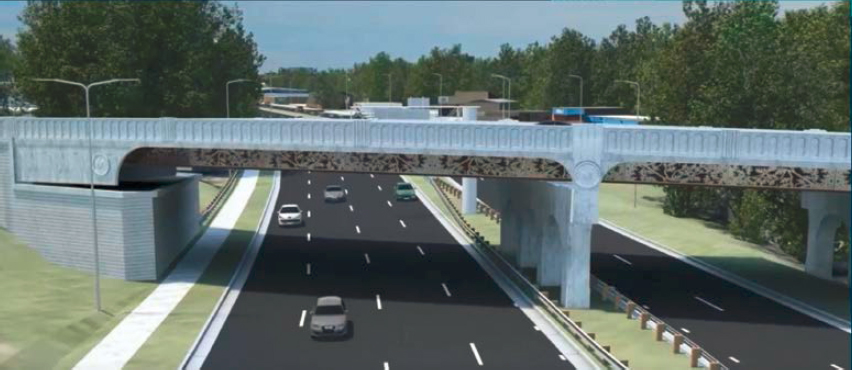
Source: NCDOT, used with permission
The visualization of the proposed Capital Boulevard project in Raleigh highlighted proposed artwork on the Wade Avenue Bridge.
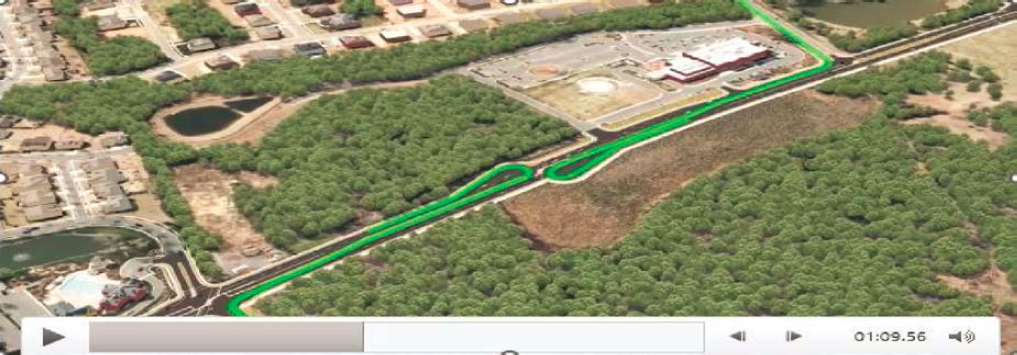
Exhibit 4-13. NCDOT QR code for the Complete 540 Project.
Source: NCDOT, used with permission
The Complete 540 Project used QR codes on business cards to disseminate visualization products—the public took cards with them after a public meeting to share with their family, friends, and/or neighbors. QR codes are highly effective for broad outreach that provides quick access to individual project website content.
Exhibit 4-14. NCDOT before/after photo-simulation.
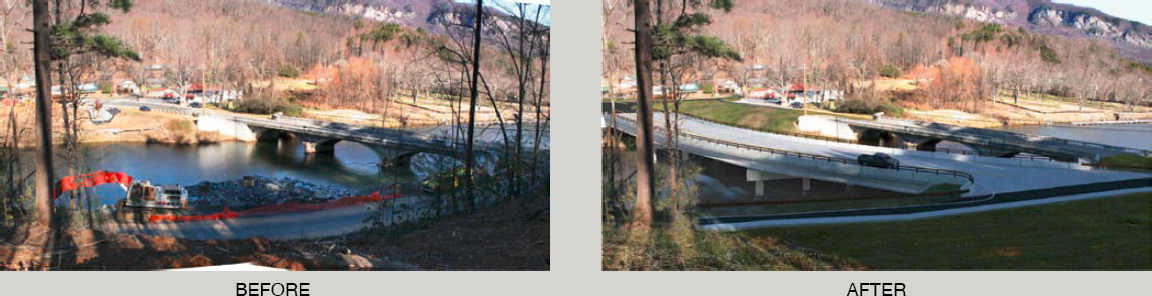
Source: NCDOT, used with permission
This simplified photo-simulation composited a rendered design with the original photo to illustrate the existing “before” condition and the proposed “after” improvements.
example of an NCDOT 3D annotated rendering from a 3D model of I-74. NCDOT staff noted that, “We will rely on the use of visualization more to help convey to the public the purpose, need, and technical attributes of upcoming planning and design projects. For transportation professionals . . . better understanding leads to better dialog, which leads to better projects.”
“We will rely on the use of visualization more to help convey to the public the purpose, need, and technical attributes of upcoming planning and design projects. For transportation professionals . . . better understanding leads to better dialog, which leads to better projects.”
—NCDOT Staff
Project videos accompany many projects and are effective in conveying project information at public meetings, after which directed questions about public preferences can be asked immediately. Exhibit 4-17 provides an example taken from such a video. Using project videos is especially effective when sharing proposed alternatives. Video/visualization hybrids are used to integrate
Exhibit 4-15. NCDOT Informational Video.
Source: NCDOT, used with permission
A video for Providence Road included live video footage and motion graphics to explain future design changes for a reduced conflict intersection that would improve traveler safety; the video format supports wide distribution.
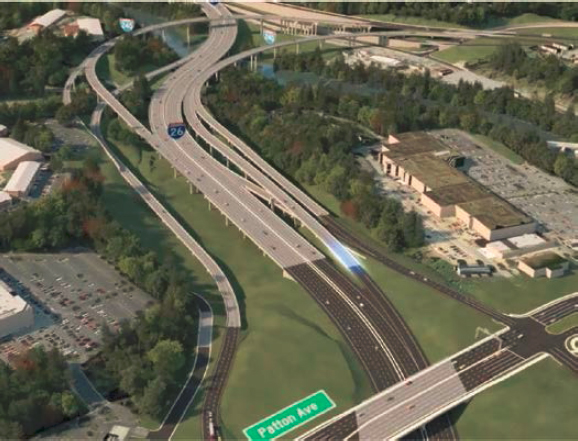
Exhibit 4-16. NCDOT 3D annotated rendering from a 3D model of I-74.
Source: NCDOT, used with permission
On I-74, a rendering from a 3D model includes terrain, textured buildings, grade separations, signs and signals, guardrail, noise wall, lighting, traffic and text overlays to convey the complete project approach.
Exhibit 4-17. NCDOT informational video.
Source: NCDOT, used with permission.
A video for Providence Road included live video footage and motion graphics to explain future design changes for a reduced conflict intersection that would improve traveler safety; the video format supports wide distribution.
visualization into live footage. The videos are also posted to the internet, thus easily and conveniently expanding information outreach.
Drone technology is simplifying and expanding DOT ability to show proposed environments, which traditionally required costly and time-consuming digital development. With drone footage, proposed conditions are overlaid on an existing view, and images can be developed from greater heights than with traditional bucket trucks.
AR is being explored for use in the project planning phase (e.g., smartphones can be used with a map to generate a future condition). Although NCDOT develops construction staging videos, given NCDOT’s limited expertise and access to required software, 4D modeling and animation are provided by consultants.
“A 21st century transportation system needs to be built on the foundation of a 21st century public involvement strategy.”
—NCDOT Staff
DOT Guidelines and Policies
NCDOT management supports visualization innovation for public involvement. NCDOT maintains standardized statewide processes for many aspects of public involvement, including the use of a subscriber-based online input platform to manage public feedback and project mailing lists. Currently, the Visualization Team is developing more consistent visualization scoping language. Although visualizations produced by this group have a uniform look, style, and approach, many projects use consultants for visualizations, and these do not pass through EAU for review.
There are statewide standards for mapping. Several years ago, NCDOT revised public meeting/hearing map standards to require 3D typical sections on maps and replace the typical schematic look.
Barriers to Using Innovative Visualizations
NCDOT identified two major barriers to the use of advanced visualization:
- Departmental or state policies that limit use of these methods.
- Lack of visualization workflow training.
NCDOT emphasizes customer service. Satisfying this priority while working through the procurement channels of the cabinet-level Department of Information Technology has its challenges. The state has a rigorous approval process for introducing new technologies and software, as well as restrictions on procuring certain software platforms and using certain vendors; these factors can affect the use of advanced visualization technology. The Visualization Team also noted the lack of training in visualization workflow for the civil engineering discipline as a problem for visualization development. NCDOT staff commented that, “A 21st century transportation system needs to be built on the foundation of a 21st century public involvement strategy.”
“Visualization is important because a picture speaks 1,000 words, but it must be the right picture. You must be careful about what the visualization looks like and ask yourself, is it feasible to build? And, more friendly visuals open public perceptions, as does humor.”
—UDOT Staff
Utah Department of Transportation
The Utah Department of Transportation (UDOT) is a decentralized organization, and visualization work is funded through project budgets. For visualizations that require more than basic graphics, UDOT relies heavily on consultants. UDOT communications professionals help guide visualization requirements and use of brand assets (e.g., mapping and iconography). UDOT staff noted that, “Visualization is important because a picture speaks 1,000 words, but it must be the right picture. You must be careful about what the visualization looks like and ask yourself, is it feasible to build? And, more friendly visuals open public perceptions, as does humor.”
Types, Formats, and Implementation of Visualization Technologies
Predominant uses of visualization are communicating emergency responses (e.g., flooding and rockslides) and road work and construction activity. The West Davis project made use of time-lapse video distributed via social media to inform the public of construction progress (Exhibit 4-18).
Exhibit 4-18. UDOT drone flyover of the West Davis project.
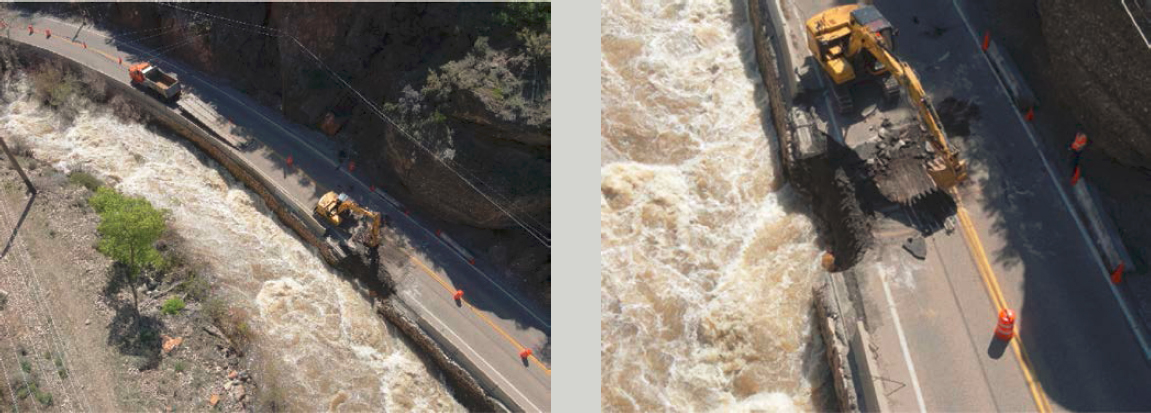
Source: UDOT, used with permission
When the SR-39 through Ogden Canyon Road started washing away, drone footage showed the damage and helped convey that UDOT was responding as fast as possible. The public got a real view of what was happening.
Social media is a key delivery vehicle for conveying visualizations for public involvement and provides the added benefit of easily gauging engagement levels (see Exhibits 4-19 and 4-20).
UDOT supports use of all major social media platforms, with accounts and channels managed by each region. However, managing multiple social media channels can be challenging given the staff time required.
Drone video and photograph capture is a critical UDOT tool, with both internal agency and project implementation, and UDOT has developed in-house capability for video production. Several communications staff are licensed to pilot drones. Implementation includes delivering project messaging through before-and-after imagery, showing project progress (e.g., using time-lapse technology to show construction activity and prefabrication of project elements), and sharing condition alerts such as closures due to flood damage, snow, or rockfall.
During the NEPA process, UDOT often chooses to develop visualizations that are not tied to a specific location so that the content will be relevant to many projects (e.g., more conceptual illustrations and infographics, and video “sketching” for planning concepts). General content has also been developed to explain project processes. For example, in collaboration with a consultant, UDOT developed a video about the NEPA process; this video uses simple animation to explain the required steps.
UDOT regularly uses advanced visualization methods such 3D and 4D animations, VR, and real-time interactive, especially for design and construction project phases and when there are concerns about potential effects.
“We don’t want to give the public a sense of the design/project being final. We want to use visualizations to help explain or educate on a project, initiative or process. Animation can help explain and bring people along step by step.”
—UDOT Staff
DOT Guidelines and Policies
UDOT recently invested in developing robust brand assets, including a suite of branded templates, guidance on use of colors and logo, standardized icons, and a video opener/closer. UDOT also established mapping standards (implemented in 2023) to bring uniformity across statewide outreach (Exhibit 4-21). But generally, UDOT visualization production is decentralized and is managed by local project managers who are responsible for public involvement in their projects.
Exhibit 4-19. UDOT social media for the West Davis project.
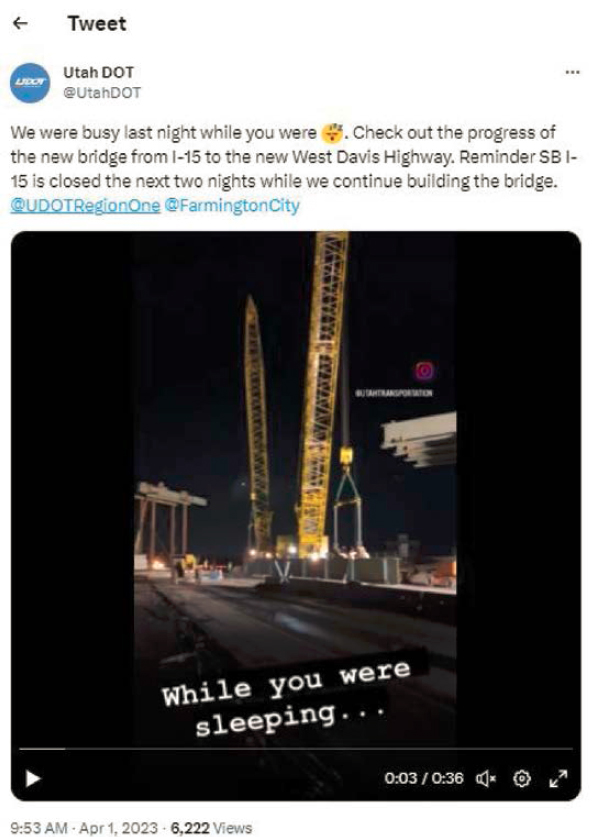
Source: UDOT, used with permission
The West Davis project used time-lapse video distributed via social media to inform the public of construction progress.
The budget for project visualization methods and deliverables is typically built into a consultant’s contract. UDOT encourages consultants to stay current with industry developments and bring this specialized knowledge to bear when needed.
“We want people to recognize when something is coming from UDOT and know they can come to us for information, and we’ll be transparent. This helps build our brand, as ‘our currency is the public’s trust.’”
—UDOT Staff
UDOT staff commented that, “We don’t want to give the public a sense of the design/project being final. We want to use visualizations to help explain or educate on a project, initiative or process. Animation can help explain and bring people along step by step.”
Other comments from UDOT staff were that “We want people to recognize when something is coming from UDOT and know they can come to us for information, and we’ll be transparent. This helps build our brand, as ‘our currency is the public’s trust.’” and “People LOVE maps and the ability to zoom in/out, find landmarks, and explore a variety of information in one location.”
UDOT has developed expanded in-house GIS capabilities for internal and project communication, with progress varying by region. Districts are embracing GIS as they see its power to help people understand how UDOT is improving the transportation system, especially through
“People LOVE maps and the ability to zoom in/out, find landmarks, and explore a variety of information in one location.”
—UDOT Staff
Exhibit 4-20. UDOT GIS comment map for the I-15 Environmental Impact Study.
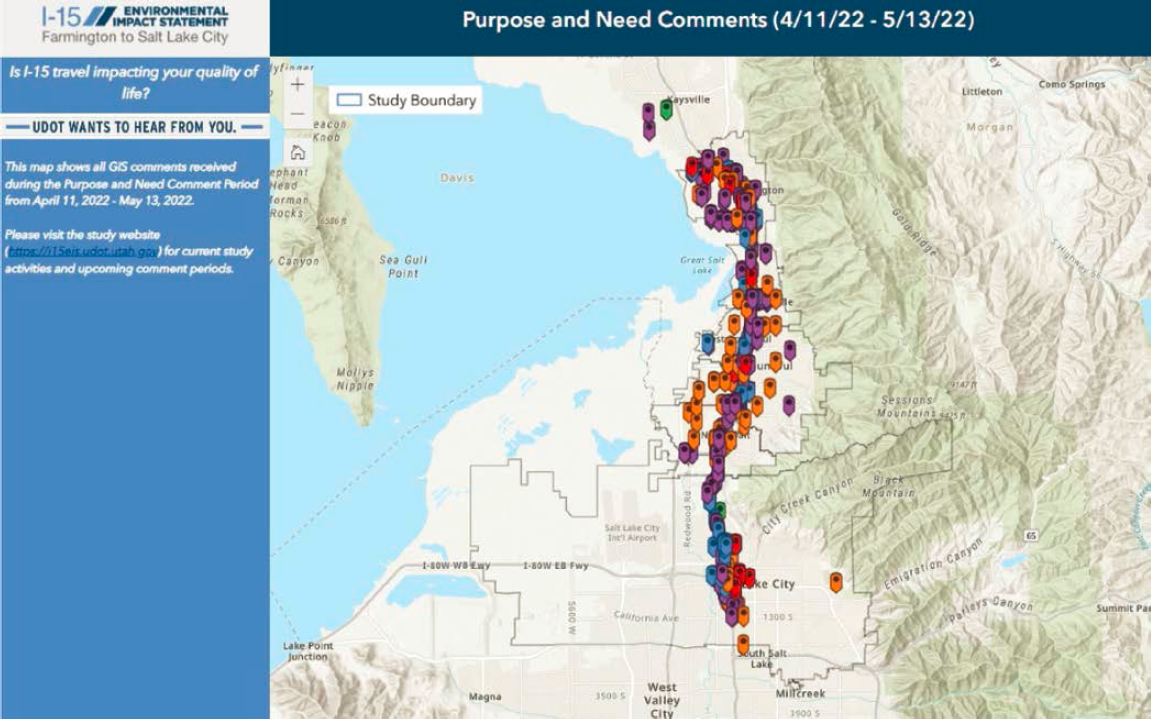
Source: UDOT, used with permission
GIS played a key role in the multi-year I-15 Environmental Impact Study during outreach for the Purpose and Need phase and was the primary comment collection mechanism, with the link distributed via social media and QR codes in two languages.
Exhibit 4-21. UDOT motion graphics animation.
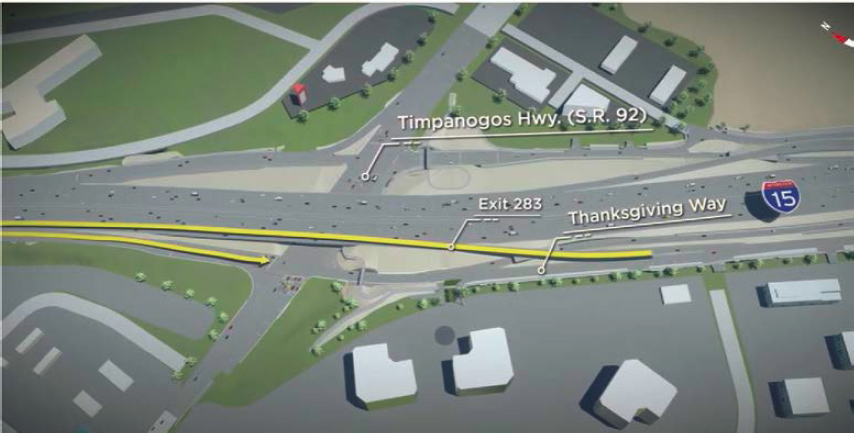
Source: UDOT, used with permission
The I-15 Technology Corridor used motion graphics animation to illustrate new options for interstate access and reduced traffic between two key interchanges, including an innovative frontage road system that allows access to local businesses without highway travel.
user-friendly StoryMaps. Exhibits 4-22 and 4-23 provide examples. UDOT’s largest geographic region relies on mapping data to answer basic public questions. Although consultants provide much of the GIS work, internal capabilities are being built in support of asset management and federal reporting requirements.
UDOT used GIS interactive mapping to share the contents of its Unified Plan, which was delivered in a web-based format. Because people love maps and like locating landmarks and zooming in/out, part of the design process is determining what zoom levels are needed and what scale is most useful to display the information effectively.
Exhibit 4-22. UDOT data visualization dashboard for the Heber Valley EIS Impacts.
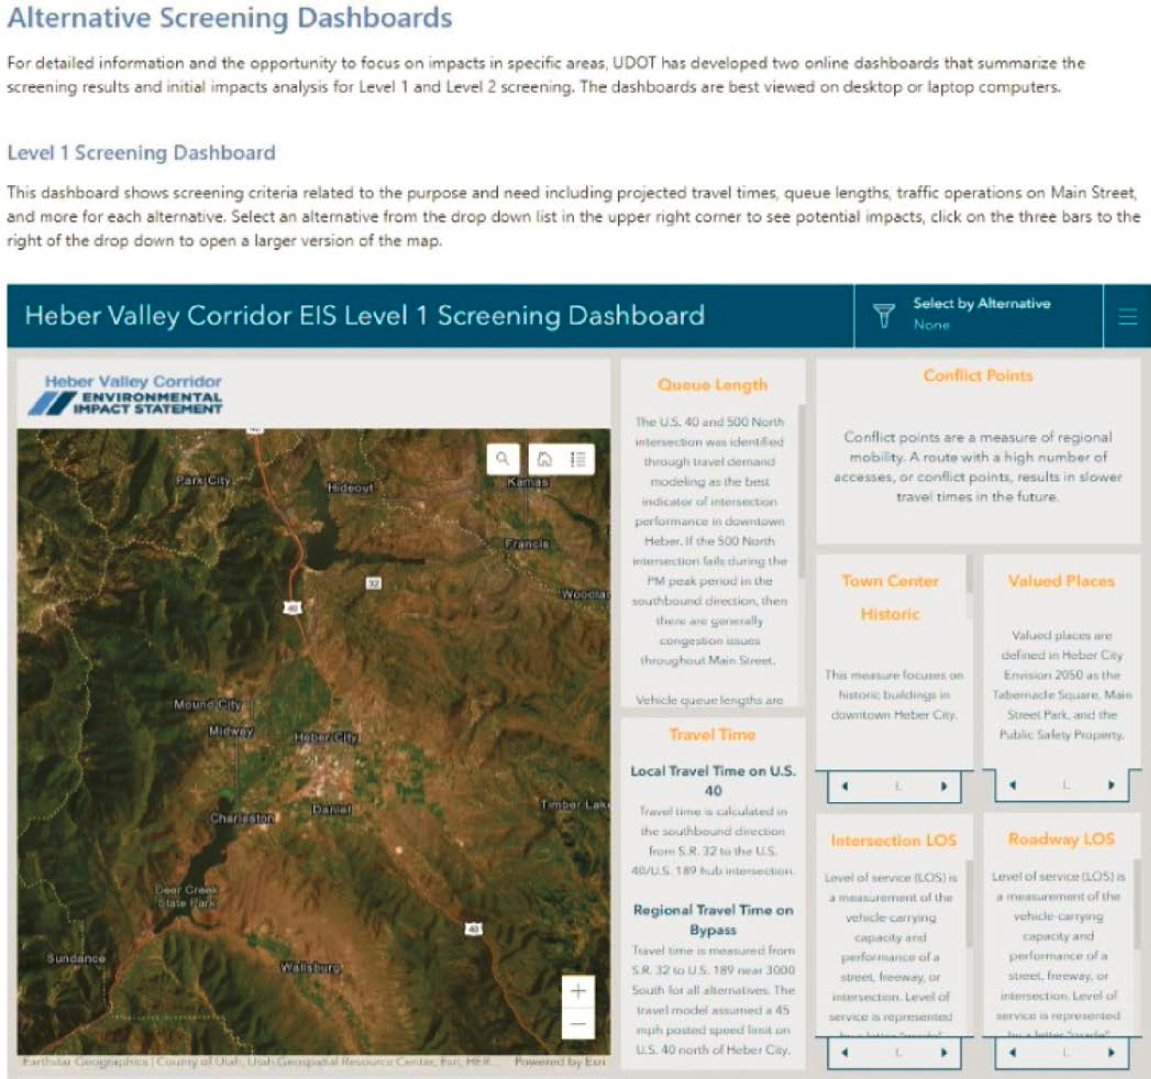
Source: UDOT, used with permission
The Heber Valley EIS Impacts online dashboard allows viewers to select an alternative from a drop-down list and see potential impacts across multiple metrics.
Exhibit 4-23. UDOT informational video for US-89.
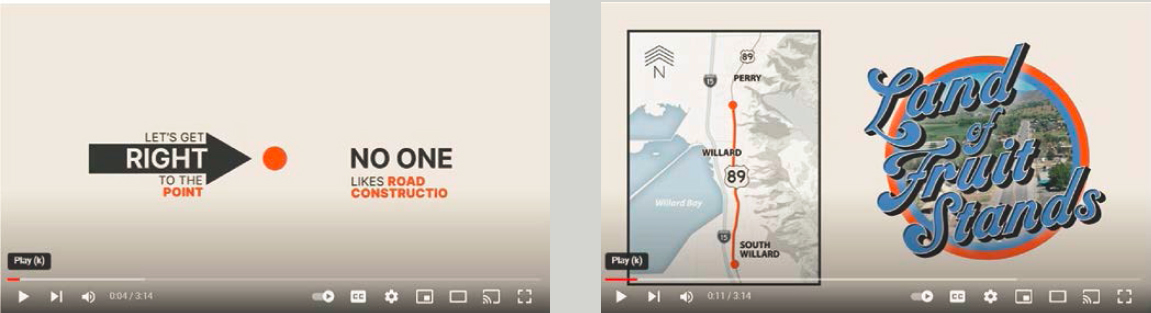
Source: UDOT, used with permission
For US-89, UDOT developed a humorous informational video to explain the “why” of a project, receiving an overwhelmingly positive response. A YouTube comment: “You could put a freeway through the middle of my house as long as I see a video like this about it ![]() great job.”
great job.”
UDOT implemented 3P Visual Tool, a GIS comment tool developed by a third-party vendor, for outreach during the Purpose and Need phase of the I-15 Farmington-to-Salt Lake City Environmental Impact Statement. This tool was the primary comment collection mechanism. Links and QR codes were provided to access this tool via social media (i.e., a project Facebook group as well as city and partner pages), city presentations, and grassroots methods (e.g., posters and lawn signs). English and Spanish language versions were provided via separate links. Web analytics, although imprecise, provided a good picture of engagement for web traffic originations within the study area.
Barriers to Using Innovative Visualizations
UDOT identified two major barriers to using advanced visualization:
- Cost/funding availability.
- Lead time required to produce visualizations.
The ability of project budgets to fund visualization deliverables can be a limiting factor; projects must be strategic about how and when to fund visualizations because visualizations do not make sense for some projects. The UDOT project team defines which project elements are most critical to the public involvement process before directing consultants and needs to be able to pivot from the original plan when an unexpected element that people do not understand needs to be visualized. UDOT staff noted that, “It can be hard to predict what the hot-button issue will be or when a good visualization could answer questions. Sometimes we don’t know until we have gotten initial feedback from the public.”
“It can be hard to predict what the hot-button issue will be or when a good visualization could answer questions. Sometimes we don’t know until we have gotten initial feedback from the public.”
—UDOT Staff


