Strategies to Address Utility Issues During Highway Construction (2024)
Chapter: 2 LITERATURE REVIEW
CHAPTER 2. LITERATURE REVIEW
INTRODUCTION
This chapter summarizes the results of the literature review the research team completed in preparation for conducting the practitioner survey. It covers the following topics:
- UR impacts on project delivery.
- Use of utility impact assessment tools during project delivery.
- Construction and utility inspection practices.
UTILITY-RELATED IMPACTS ON PROJECT DELIVERY
Impacts on Project Delays
In 1999, the United States General Accounting Office (GAO) published a report on the impacts of utility relocations on highway projects (1). GAO conducted a national survey of state DOTs and conducted interviews with officials at FHWA, both at headquarters and field offices, selected DOTs, and construction contractors. GAO also interviewed utility owners in nine states. The survey included a list of reasons for delays on highway and bridge projects. Table 1 shows the results of feedback from DOTs. The top three reasons mentioned were utility owners lacking resources to conduct relocations, insufficient time at the DOT for planning and design, and utility owners’ not assigning enough priority to utility relocations.
Table 1. DOT Reasons for Delays in Utility Relocations.
| Reason for Project Delays | Number of DOTs |
|---|---|
| Utility owner lacked resources | 34 |
| Short timeframe for state to plan and design project | 33 |
| Utility owners gave low priority to relocations | 28 |
| Increased workload on utility relocation crews because highway/bridge construction had increased | 28 |
| Delays in starting utility relocation work: Some utility owners would not start until construction contract was advertised or let | 28 |
| Phasing of construction and utility relocation work out of sequence | 26 |
| Inaccurate locating and marking of existing utility facilities | 23 |
| Delays in obtaining right-of-way for utility relocations | 23 |
| Shortages of labor and equipment for utility contractor | 19 |
| Project design changes required changes to utility relocation designs | 19 |
| Utility owners were slow in responding to contractor’ requests to locate and mark underground utility facilities | 16 |
| Inadequate coordination or sequencing among utility owners using common poles or ducts | 13 |
Ten DOTs responded that utility relocation delays had a “great” or “very great” impact on construction schedules and/or costs of highway and bridge projects. A total of 30 DOTs
indicated they incurred additional costs due to claims resulting from utility relocation delays. Interestingly, contractors indicated that cost increases due to utility relocation delays were either not covered entirely by DOTs, or the time required to prepare the paperwork for reimbursement was not worth their time and effort. However, the GAO report also noted that DOTs were frequently not aware of the magnitude of the impacts of utility relocation delays on construction schedules or costs because contractors shifted work crews and equipment to other segments of the project or to a different project altogether as a strategy to deal with utility relocation delays (rather than submitting schedule extension requests or change orders).
DOTs highlighted strategies to make utility coordination more effective. A total of 41 state DOTs used early planning and coordination, and 33 states used special contracting methods to alleviate the impacts of utility relocation delays during construction. The TxDOT highlighted a Utility Cooperative Management process to incorporate utility facilities into all project delivery process phases. Only seven DOTs indicated they conducted utility investigations using subsurface utility engineering (SUE) procedures on more than half of their projects. However, with the information that was available at the time, the GAO report highlighted that it was unclear whether the use of SUE practices contributed to a reduction in utility relocations and delays. A total of 44 state DOTs allowed contractors to extend project deadlines.
In 2001, NCHRP completed a survey of DOT officials, design consultants, and highway contractors to establish causes of project delays during the construction phase (2). The researchers prepared a list of 20 potential causes of project delays (Table 2) and asked survey participants to rank those causes by order of frequency. As Table 3 shows, all three groups ranked utility relocation delays as the top cause of project delays. DOTs and design consultants identified DSCs—utility conflicts as the second most frequent reason for delays. In contrast, contractors identified errors in plans and specifications as the second most frequent cause of project delay.
Interestingly, groups responded differently with respect to what they considered less frequent causes of project delays. For example, owner-requested changes were No. 11 for DOTs and No. 10 for consultants, but contractors indicated this cause was No. 5. Errors in design and specifications were No. 13 for design consultants but were No. 3 for DOTs and No. 2 for contractors. Insufficient work by contractor was No. 18 for contractors but was No. 8 for DOTs and No. 5 for design consultants.
The researchers analyzed a database of contract supplemental agreements they received from the Florida Department of Transportation (FDOT). The database included 2,616 contract changes. The researchers grouped these records by contract change reason code and concluded that a little over 5 percent were related to utility conflicts. The researchers also analyzed 150 FDOT projects of varied sizes and types (3). These projects involved 27 different construction contractors, of which 9 (or 33 percent) accounted for 80 percent of total time delays.
Table 2. Potential Causes of Project Delays Included in the 2002 Survey (2).
| Potential Causes of Project Delays |
|---|
| Conflict with other construction projects |
| Delays in environmental planning |
| Delays in receiving materials |
| Delays in right-of-way acquisition |
| Delays in design |
| Differing site conditions—utility conflicts |
| Differing site conditions—other causes |
| Equipment shortages |
| Errors in plans or specifications |
| Funding issues |
| Insufficient work effort by contractor |
| Labor shortages |
| Late start on work by contractor |
| Owner-requested changes |
| Pay items do not match scope of work |
| Permitting issues |
| Poor coordination of work by contractor |
| Utility relocations delayed |
| Weather |
| Other |
Table 3. Ranking of Top Ten Causes of Project Delays Based on Survey Results (2).
| Cause of Delay | DOTs | Designers | Contractors |
|---|---|---|---|
| Delays in utility relocations | 1 | 1 | 1 |
| Differing site conditions—utility conflicts | 2 | 2 | 3 |
| Errors in plans and specifications | 3 | 13 | 2 |
| Weather | 4 | 6 | 4 |
| Permitting issues | 5 | 4 | 7 |
| Delays in right-of-way acquisition | 6 | 9 | 11 |
| Delays in environmental process | 7 | 3 | 8 |
| Insufficient work effort by contractor | 8 | 5 | 18 |
| Owner-requested changes | 11 | 10 | 5 |
| Differing site conditions—other causes | 9 | 7 | 6 |
In 2003, FDOT analyzed causes of UR delays during the construction phase (4). The analysis included a review of cut damage reports and supplemental agreements in District 2 between January 2000 and June 2002. A cut damage report is generated after a utility facility is damaged during construction. The study concluded that utility facilities were damaged 77 percent of the time because of contractor actions, 15 percent of the time because of inaccurate plans, and 8
percent of the time because of utility owner actions. The study also noted that utility facility damages caused contractor delays in 30 percent of their projects. One of the reasons for UR delays mentioned in the report was inaccurate or inexistent location data about utility facilities.
The FDOT study also noted UR delays in cases where a utility owner did not allocate resources to conduct a relocation but instead used those resources to respond to customer demands, maintenance needs, or service upgrades. Other UR delays were caused by utility coordinators not being aware of changes the contractor made to the construction schedule, which resulted in conflicts between highway construction activities and utility relocation activities.
In 2006, the South Carolina Department of Transportation (SCDOT) completed a study listing factors that delay construction projects (5). The research included a survey of SCDOT construction engineers and an aggregated analysis of contract extension data. The report identified six main reasons for delays in construction projects, including utility delays (21 percent of contract extensions), extra work (17 percent), administrative delays (15 percent), design changes (12 percent), weather delays (10 percent), quantity adjustments (10 percent), and unknown (17 percent). The study also noted that SCDOT was beginning to use SUE more often to help with an earlier identification of utility conflicts.
In 2011, the FHWA Office of Inspector General (OIG) completed an audit of highway projects administered by local public agencies (LPAs) (6). The audit noted that state DOTs were responsible for providing oversight of billions of dollars in federal-aid program funds given to LPAs for highway infrastructure projects. The 2009 American Recovery and Reinvestment Act also invested billions of dollars in LPA-led infrastructure projects. The audit reviewed 59 federal-aid projects in four states. For the 59 LPA-led projects, OIG conducted compliance reviews in 12 key activities, ranging from change orders and claims to project bidding, project reporting and tracking, and construction close-outs. Of the 42 projects reviewed under the category of change orders and claims, 33 projects had errors (although the analysis did not disaggregate these data). Of the three projects reviewed under the category of utility agreements and reimbursements, two projects had errors.
In 2018, FHWA completed a national review to assess whether utility coordination practices posed a risk to the federal-aid highway program (7). The review included two phases. During Phase 1, FHWA reviewed utility coordination practices in all 50 states, the District of Columbia, and Puerto Rico, with a focus on utility agreements; utility relocation plans, schedules, and cost estimates; information in contract bid documents; and impacts during construction, such as time delays and cost increases. During Phase 2, FHWA conducted site visits at five state DOTs representing different geographic regions and federal-aid program sizes. The site visits included a more in-depth review of available information and discussions with state DOT officials, construction contractors, and utility owners.
Issues found during the national review included the following:
- Lack of accurate utility location information on plans.
- Incomplete utility relocation plans.
- Lack of justification for utility relocation estimates.
- Lack of utility relocation schedules.
- Lack of utility information in bid packages.
- Inability to quantify utility cost-and-time increases on highway construction projects.
- Lack of utility relocation oversight and inspection as well as source documents to support utility payments (utility final vouchers).
The FHWA report highlighted that lack of adequate data about existing utility facilities caused utility conflicts to be misidentified or not identified at all prior to construction, resulting, in turn, in contractors finding utility facilities during construction unexpectedly and causing project delays or cost increases.
The FHWA report also documented successful practices with examples on how to address the issues listed above. Worth noting were practices related to the preparation of utility relocation plans, utility relocation schedules, and cost estimates. FHWA outlined a series of high-level recommendations for FWHA division offices to discuss with state DOTs. These recommendations provided the basis for the National Highway Institute’s web-based course “Preparing and Communicating Effective Utility Relocation Requirements” (8).
Impacts on Project Costs
The technical literature is scant on the impact of UR issues on project costs. In 1984, NCHRP completed a synthesis project that examined UR delays and costs on highway projects (9). The synthesis summarized information received from several states, including California, Florida, Illinois, New Jersey, and New York. In California, the California Department of Transportation (Caltrans) noted that the state compensates the contractor if the contractor is delayed because high-risk utility facilities are not shown on the plans or because utility relocations are not completed within the specified period of time. In New York, the dollar amount of claims represented nearly one percent of the value of the construction contracts awarded. However, the average settlement of UR claims was on the order of 10 percent of the amount filed.
The synthesis highlighted that UR claims were typically the result of delays caused by unknown utility facilities, utility facilities that were not located properly, and untimely relocations. It also highlighted that the stated reason associated with a claim frequently masked the actual reasons because it was common to group several items in the same claim but label the entire claim using one of the items.
In 2004, the Indiana Department of Transportation (INDOT) completed a research project that examined cost overruns and time delays in INDOT projects (10). The research included a survey of DOTs on the causes of cost overruns and time delays, an analysis of cost overrun data provided by other DOTs, and a detailed analysis of change order data that INDOT provided. The study concluded that INDOT was average in terms of cost overrun rates compared to other states. The overall rate for cost overrun amounts at INDOT between 1996 and 2001 was 4.5 percent. Some 55 percent of all INDOT contracts experienced cost overruns. In addition, 12 percent of all INDOT contracts experienced time delays, and the average delay per contract was 115 days. Factors that influenced cost overruns, time delays, and change orders included contract bid amount, difference between the winning bid and the second bid, difference between the winning bid and the engineer’s estimate, and project type and location.
From a review of 18,000 change order records between 1996 and 2001, the study found most change orders were under the categories of errors and omissions in PS&E followed by constructability and changed field conditions. The review found 123 UR change orders, including 13 change orders under errors and omissions in PS&E, 74 change orders under constructability, and 36 change orders under changed field conditions.
The research also highlighted that different DOTs organize and group change orders differently. The level of disaggregation in change order classifications varies widely. How DOTs account for UR change orders also varies widely, ranging from not having a separate category for UR reasons to disaggregated categories such as not relocating on time or unknown utility facilities affecting the project. As an illustration, Table 4 lists codes or groupings for UR change orders mentioned in the INDOT research report.
Table 4. Codes or Groupings of Change Orders (10).
| State | Code/Grouping | Description |
|---|---|---|
| Florida | 1 | Utility delays |
| Minnesota | UD | Utility delay |
| New Jersey | H | Change to address a utility issue |
| Ohio | 14 | Utility relocation delay |
| Ohio | 15 | Improperly located utility |
| Ohio | 16 | Unknown utility |
| South Dakota | 14 | Utility agreements |
| Texas | 6 | Untimely right-of-way/utilities |
In 2009, TxDOT completed a research project that examined opportunities for integration of utility and environmental activities in the project delivery process (11). The research included an analysis of 30,043 change order records from July 1999 to February 2007 and 17 UR claim records from June 1996 to October 2007. Table 5 lists the categories and reason codes used for change orders at TxDOT.
Table 5. Change Order Categories and Reason Codes at TxDOT (12).
| Category | Code | Change Order Reason |
|---|---|---|
| 1. Design Error or Omission | 1A | Incorrect PS&E (TxDOT design): TxDOT prepared the PS&E and an error and/or omission is discovered, but there is no additional cost to the project, nor any contractor delay, rework or inefficiencies. |
| 1B | Incorrect PS&E (consultant design): A consultant prepared the PS&E and an error and/or omission is discovered, but there is no additional cost to TxDOT, nor any contractor delay, rework or inefficiencies to the project. | |
| 1C | Design error or omission (other): There is an error and/or omission, (TxDOT or consultant) but the cause (all or partial) cannot be assigned to TxDOT or the consultant and other codes in this category are not appropriate. | |
| 1D | Design error or omission that resulted in delay, rework, or inefficiencies (TxDOT design): TxDOT prepared the PS&E and an error and/or omission is discovered and additional cost, contactor delay, rework or inefficiencies occur on the project. | |
| 1E | Design error or omission that resulted in delay, rework, or inefficiencies (consultant design): A consultant prepared the PS&E and an error and/or omission is discovered and additional cost to TxDOT or contractor delay, rework or inefficiencies occur on the project. |
| State | Code/Grouping | Description |
|---|---|---|
| 2. DSCs (Unforeseeable) | 2A | DSCs (unforeseeable): Actual site conditions are found to be different than depicted in the plans, soil borings or other project information. |
| 2F | Site conditions altered by Act of God: The project is impacted by Acts of God. | |
| 2G | Unadjusted utility (unforeseeable): Unknown utilities impact the project. [Note: This reason code is no longer active.] | |
| 3. TxDOT Convenience | 3A | Dispute resolution. |
| 3B | Public request after letting: A change is made, or work is added to accommodate a public request. | |
| 3E | Reduction of future maintenance: A change is made with the intent of minimizing the need for future maintenance. Coordination should be untaken to determine FHWA participation. | |
| 3F | Additional work desired by TxDOT: TxDOT adds needed work. | |
| 3H | Cost savings opportunity: The project cost and/or project duration are reduced. | |
| 3I | Implementation of improved technology or better process: Improved technologies or better processes are utilized in the project. | |
| 3K | Addition of stock account or material supplied by TxDOT provision: This code should be used to buy material purchased by the contractor and not incorporated into the project. It should also be used when TxDOT supplies material to the contractor that is incorporated in the project. | |
| 3L | Revising safety measures: Safety measures on the project are revised. The safety enhancement may be suggested either by TxDOT or the contractor. | |
| 3M | Other. [Note: This reason code is no longer active.] | |
| 3N | Upgrade to current standards: Necessary changes are introduced to upgrade to current design standards where standards have changed subsequent to PS&E preparation. | |
| 3O | Time extension: Time to the contract is added. No other work is included in the change order. | |
| 3P | Repair due to third party damage. A third party causes damage to TxDOT property. | |
| 3Q | Emergency declaration. An Act of God happens, such as earthquake, tornado, hurricane or other cataclysmic phenomena of nature. | |
| 3S | Maintenance contract extension. A special provision to Item 4 is activated. | |
| 3T | Activation corrections. Corrections are needed to entries made or omitted in error at activation. | |
| 4. Third Party Accommodation | 4A | Failure of a third party to meet commitment: A third party to the contract fails to fulfill any part of their commitment. |
| 4B | Third party request for additional work: Additional work is requested by a third party. Generally, this will require a modification to the advance funding agreement. | |
| 4D | Third party accommodation: Other codes in this category are not appropriate. | |
| 5. Contractor Convenience | 5A | Contractor requested change in traffic control plan or sequence of work: The contractor requested change to the traffic control plan or sequence of work and must be acceptable to TxDOT. |
| 5B | Contractor requested change in materials and/or method of work: The contractor changed materials and/or method of work. The change must be acceptable to TxDOT. | |
| 5C | Payment for partnering workshop. The contractor is reimbursed for TxDOT’s agreed share of partnering expenses in accordance with Special Provision 000-002. | |
| 5E | Contractor convenience: Other codes in this category are not appropriate. | |
| 5F | Price reduction: Contract items have deficiencies and TxDOT is willing to accept work at a reduced price. | |
| 6. Right-of-Way and Utilities | 6A | Right-of-way not clear (third party responsible): The contractor is impacted because right-of-way was not cleared on the date(s) specified in the plans where a third party is responsible for the right-of-way acquisition. |
| 6B | Right-of-way not clear (TxDOT responsible): The contractor is impacted because right-of-way was not cleared on the date(s) specified in the plans where TxDOT is responsible for the right-of-way acquisition. |
| State | Code/Grouping | Description |
|---|---|---|
| 6C | Utilities not clear: The contractor is impacted by known utilities not being adjusted or relocated on the date(s) specified in the plans. [Note: This reason code is no longer active.] | |
| 6D | Other: Other codes in this category are not appropriate. [Note: This reason code is no longer active.] | |
| 6E | Untimely right-of-way: Other codes in this category are not applicable. | |
| 6F | Joint-bid utilities: This code should be used for all joint-bid project change orders. | |
| 6G | Known unadjusted utilities: Utilities are known to be in the vicinity and are potentially in conflict, but the utility was not properly marked or a utility did not finish the utility adjustment as scheduled. | |
| 6H | Unknown unadjusted utilities: Utilities are not known to be in the vicinity and are in conflict. | |
| 7. Termination | 7A | Contract terminated–design error TxDOT: A project is terminated or a significant portion of a project is eliminated due to a major design error and/or omission where TxDOT prepared the PS&E. |
| 7B | Contract terminated–design error consultant: A project is terminated or a significant portion of a project is eliminated due to a major design error and/or omission where a consultant prepared the PS&E. | |
| 7C | Contract terminated–utilities: A project is terminated or a significant portion of a project is eliminated due to a major utility delay or impact. The utility impact could be the result of either a known or an unknown utility. | |
| 7D | Contract terminated–right-of-way: A project is terminated or a significant portion of a project is eliminated due to a significant right-of-way acquisition delay. | |
| 7E | Contract terminated–third party: A project is terminated or a significant portion of a project is eliminated when it becomes known or evident that a third party will not be able or is unwilling to fulfill its obligation under an advance funding agreement. | |
| 7F | Contract terminated–Acts of God: A project is terminated or a significant portion of a project is eliminated due to an Act of God. | |
| 7G | Contract terminated–other: A project is terminated or a significant portion of a project is eliminated due to reasons where other codes in this category are not appropriate. |
The first database query involved using UR change order reason codes. However, for some records, the description turned out to be unrelated to a utility issue. Separate queries using the description explanation columns produced records that were UR, even though the corresponding reason code was not one of the UR codes in Table 5. After adding a list of 25 UR keywords to the query of the description and explanation fields, the result was a dataset of 1,144 change order records. On average, using the UR codes accounted for only 53 percent of the total number of records retrieved. A total of 139 change orders were associated with change orders that included terms such as “delay” or “add days” in the description and explanation fields. Of these records, only 72 change orders included a description sufficiently reliable to estimate the total time delay. An additional 41 records were for no-cost extensions.
Table 6 shows the list of contractor claim categories at TxDOT. From June 1996 to October 2007, there were 17 contractor claim records for which the category was unknown utility interference (UU claim code) or known utility interference (UK claim code). At the time of the analysis, 13 claims had been settled or closed. The time to settle UR contractor claims ranged from 210–848 days, for an overall average of 492 days (or about 1 year and 4 months).
Table 6. Contractor Claim Categories at TxDOT.
| Category | Description |
|---|---|
| CA | Contract administration |
| CA-Insp | Contract administration – Inspection |
| CA-Qty | Contract Administration – Quantities |
| CA-TA | Contract Administration – Time |
| CA-Test | Contract Administration – Testing |
| CIS | Change in scope |
| DSC | Differing site conditions |
| EW | Extra work |
| O | Other |
| PSE | PS&E |
| R | Late right-of-way acquisition |
| RW | Rework |
| UK | Known utility interference |
| UU | Unknown utility interference |
Cost overruns on infrastructure projects are frequently the reason DOTs get negative reports in the media. A sample of situations where the media has reported on UR costs affecting infrastructure projects follows:
- In 2015, newspapers in Texas reported that TxDOT had listed $25 million in additional payments to contractors because of issues with communication lines over a three-year period (13, 14). Project delays of several months were also noted. In one case, issues with existing communication lines accounted for a one-year delay in starting the highway construction.
- In 2013, the California High-Speed Rail Authority awarded its first contract for the construction of the high-speed train route in Fresno and Madera counties. At that point, the estimated cost to relocate utility facilities was $25 million. In 2018, the press reported that change orders, penalties for delays in acquiring right-of-way, and increases in utility relocation costs had resulted in a project cost estimate increase from $1.2 billion initially to nearly $1.5 billion (15).
- In 2019, a trade magazine article drew attention to highway construction projects in South Carolina, North Carolina, Montana, and other states, regarding utility relocation delays and the impact these delays have on the overall construction schedules (16). The article discussed situations where utility owners did not relocate their facilities on time, affecting highway construction activities. It also mentioned issues with late design changes, and projects going to letting without having all utility facilities relocated.
- In 2021, a television channel in Indiana reported on the impact of utility relocation delays on the progress of a highway construction project (17). Local officials indicated that the delays were causing higher costs on taxpayers, as well as generating an inconvenience to drivers. A communication line had to be relocated by April 2021, but by September the relocation had not yet taken place.
Impacts to Contractors
As in the case of impacts on project costs, the technical literature is scant on the impact of UR issues to contractors. The previous sections already included references to the 1999 GAO report and the 2001 NCHRP report, which included survey and interview responses from contractors (1, 2).
In 2003, a highway contractor in Indiana compiled a list of UR effects on construction projects and the process they follow to systematically understand the level of risk and how to manage it during the bidding stage, the pre-construction stage, and the construction stage (18). The contractor noted the following unknown impacts and costs related to utility conflicts during construction:
- Lower production rates than planned (i.e., higher unit costs) for installing underground appurtenances that were in conflict with existing or unknow utility facilities.
- Increased costs because of the need to work around existing utility facilities that had not been relocated.
- Crew delays while waiting on decisions regarding unknown utility facilities.
- Having to schedule work during more expensive seasons (e.g., late fall or winter), or push the overall construction schedule into the next construction season.
UR items they consider prior to deciding whether to bid include the following:
- How much is known about utility issues from the bidding documentation:
- UR information in notes or special provisions.
- Whether SUE was used.
- Level of detail about utility facilities on plans to determine existing conditions.
- Utility contact information in special provisions.
- Right-of-way status in relation to utility relocations:
- Potential conflicts between right-of-way staking and clearing, utility relocation schedules, and highway construction schedule.
- Particularly in urban areas, space availability for utility relocations.
- During or after a site visit:
- Utility facility markings.
- Confirmation of existing utility conflicts.
- Status of all utility relocations.
- Confirmation of utility owner’s point of contact.
UR items they consider after deciding to bid on the project include the following:
- Determine how to build the project, including utility relocation schedules.
- Identify productivity costs associated with existing utility facilities.
- Identify productivity costs associated with utility relocation disruptions.
- Assess UR risks and attempt to quantify costs to include in bid costs.
- Estimate overhead recovery costs and supervisory costs to include in bid costs.
UR items they consider during pre-construction include the following:
- Finalize project construction schedule.
- Establish the project workflow to minimize disruptions and maximize time efficiency.
- Schedule crew, equipment, material, and subcontractor resources.
- Conduct pre-construction meeting, including participation of project owner, contractor, subcontractors, utility owners, local agencies, and other stakeholders.
UR items they consider during construction include the following:
- Monitor the work schedule.
- Assess time and cost impacts resulting from utility conflicts and delays, as well as identify resolution strategies.
In 2004, a task force led by INDOT and that included representatives of highway contractors (including the contractor mentioned previously), utility owners, and consultants identified key issues related to utilities and strategies to address those issues (19). Construction phase recommendations for INDOT included strategies to improve the coordination process, preparing the right-of-way to expedite utility relocation work, and strategies to develop a policy and specifications for dealing with unexpected utility facilities that are discovered during construction.
USE OF UTILITY IMPACT ASSESSMENT TOOLS DURING PROJECT DELIVERY
Assessment and Management of Utility Risks
The technical literature is abundant on the topic of risk and risk management. However, it is scant on the topic of UR risks and management of these risks. The International Organization for Standardization (ISO) 31000 standard defines risk as the “effect of uncertainty on objectives” and risk management as “coordinated activities to direct and control an organization with regard to risk” (20). In the context of infrastructure projects, the 2010 NCHRP Report 658 defined risk management as the “sequence of analysis and management activities focused on creating a project-specific response to the inherent risks of developing a new capital facility” (21). The 2012 international scan report on transportation risk management practices defined risk as “anything that could be an obstacle to achieving goals and objectives” (22). The report defined risk management as a “process of analytical and management activities that focus on identifying and responding to the inherent uncertainties of managing a complex organization and its assets.”
Risk is related to uncertainty but is different from uncertainty. Uncertainty is a state of limited knowledge, which is quite difficult or impossible to measure. Risk is an outcome of uncertainty and normally has a negative connotation. Opportunity is also an outcome of uncertainty but has a positive meaning. Opportunities are sometimes called positive risks.
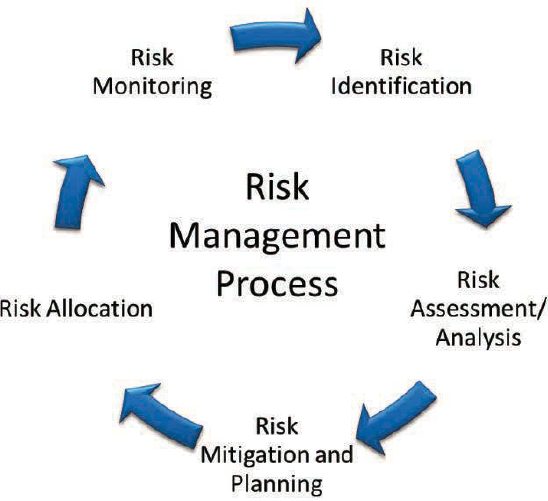
The risk management process includes five iterative steps (Figure 1) (21):
- Risk identification involves determining and documenting risks.
- Risk assessment or analysis involves conducting a quantitative or qualitative analysis to assess the probability and impact of a risk.
- Risk mitigation and planning involves evaluating risk response options and preparing a risk management plan.
- Risk allocation involves assigning risk responsibilities to stakeholders.
- Risk monitoring and control involves gathering performance data and comparing against the risk management plan.
Risk registers are commonly used to manage risk. A key component of a risk register is a matrix that combines the effect of probability of events and impact if the event happens. Matrix cells are normally color coded to visualize risk level (e.g., green for low risk, yellow for moderate risk, and red for high risk).
FHWA developed a risk register spreadsheet tool that includes a spreadsheet to document the five risk management steps (23). The spreadsheet tool includes a risk register matrix (Figure 2) and examples to help users conceptualize and classify risk probability levels (Table 7) and impact levels (Table 8). Notice that the impact level examples include suggested approaches for cost, time, scope, and quality.
![Risk Register Matrix (Adapted from [23])](https://uwnxt.nationalacademies.org/read/27859/assets/images/img-37.jpg)
Table 7. Example Approaches for Probability Levels (23).
| Example | Level | Probability |
|---|---|---|
| Example 1 | Very Low | Remote (10%) |
| Low | Unlikely (30%) | |
| Medium | Likely (50%) | |
| High | Highly likely (70%) | |
| Very High | Near certainty (90%) | |
| Example 2 | Very Low | 1–9% |
| Low | 10–19% | |
| Medium | 20–39% | |
| High | 40–59% | |
| Very High | 60–99% |
Table 8. Example Approaches for Impact Levels (23).
| Level | Primary Objective | |||
|---|---|---|---|---|
| Cost | Time | Scope | Quality | |
| Example 1 | ||||
| Very Low | No significant cost increase | Minimal schedule impact | Minimal scope change | Quality degradation barely noticeable |
| Low | <5% cost increase | <3-month delay | Changes in project limits or features with <5% cost increase | No deficiencies apparent |
| Medium | 5–7% cost increase | 3–6-month delay | Changes in project limits or features with 5–10% cost increase | Minimal deficiencies in constructability, operability, and safety |
| High | 7–10% cost increase | 6–9-month delay | Major changes in project limits and features with >10% cost increase | Major deficiencies in the technical adequacy of the final product |
| Very High | >10% cost increase | >9-month delay | Scope does not meet original purpose and need | Final product not acceptable due to deficiencies |
| Example 2 | ||||
| Very Low | Insignificant cost increase | Insignificant time increase | Scope decrease barely noticeable | Quality degradation barely noticeable |
| Low | <10% cost increase | <5% time increase | Minor areas of scope affected | Only very demanding applications are affected |
| Medium | 10–20% cost increase | 5–10% time increase | Major area of scope affected | Quality reduction requires owner approval |
| High | 20–40% cost increase | 10–20% time increase | Scope reduction unacceptable to owner | Quality reduction unacceptable to owner |
| Very High | >40% cost increase | >20% time increase | Project end item is effectively useless | Project end item is effectively useless |
Risk assessments can be completed at various levels (e.g., agency or enterprise, program, and project). In 2016, NCHRP completed a research project that examined the use of risk register spreadsheet tools at the enterprise and program levels (24). The research included a survey of state DOTs, international transportation agencies, and non-transportation organizations. Of the 27 state DOTs that responded to the survey, 19 DOTs indicated they had active enterprise- and/or program-level risk management programs.
The risk register spreadsheet tool developed by FHWA includes a suggested list of risks for risk management purposes (Table 9). The list includes only one UR risk: Unidentified utility impacts (under the construction functional area).
Table 9. Suggested Risks in FHWA’s Risk Register Management Tool (23).
| Functional Area | Design or Construction Risk |
|---|---|
| Construction | Unidentified utility impacts |
| Unexpected archeological findings | |
| Changes during construction not covered by the contract | |
| Unidentified hazardous waste | |
| Site is unsafe for workers | |
| Delays due to traffic management and lane closures | |
| Design | Incomplete quantity estimates |
| Insufficient design analysis | |
| Complex hydraulic features | |
| Surveys incomplete | |
| Inaccurate assumptions during the planning phase | |
| Environmental | Unanticipated noise impacts |
| Unforeseen Section 4(f) resources affected | |
| Environmental clearance for borrow site required | |
| Unanticipated barriers to wildlife | |
| Unforeseen air quality issues | |
| External | Project not fully funded |
| Politically driven accelerated schedule | |
| Permit agency actions cause unexpected delays | |
| Public objections | |
| Inflation and other market forces | |
| Organizational | Resource conflicts with other projects |
| Inexperienced staff assigned to project | |
| Lack of specialized staff | |
| Approval and decision processes cause delays | |
| Priorities change on existing programs | |
| Project Management | Inadequate project scoping and scope creep |
| Consultant and contractor delays | |
| Estimating and/or scheduling errors | |
| Lack of coordination and communication | |
| Unforeseen agreements required | |
| Right-of-Way | Unanticipated escalation in right-of-way values |
| Additional right-of-way may be needed | |
| Acquisition of right-of-way may take longer than anticipated | |
| Discovery of hazardous waste during the right-of-way phase | |
| Unforeseen railroad involvement |
Every DOT manages UR risks during project delivery. However, based on a review of DOT policy documents and manuals, it is unclear to what degree DOTs use the risk management steps described above to manage utility risks systematically. The following sections illustrate
examples of techniques some DOTs use. In addition, the national survey summarized in Chapter 3 sheds light on what kind of UR risk factors DOTs use.
Utility Investigations and Impact Analysis
It is widely known that existing utility data are frequently unreliable. Typically, agencies send project files to utility owners, either in portable document format (PDF) or computer-aided design (CAD) format, with a request to mark up those files with relevant utility information. In many cases, the marked-up files only show approximate utility facility locations. Sometimes, utility owners submit a copy of as-built files they already had, but these files are rarely scaled or georeferenced and follow a variety of formats, making it necessary to convert the files to a usable format and adjust their scale and alignment to match the project files. In any case, it is unclear how reliable the existing utility data are.
An NCHRP synthesis completed in 2023, which focused on the collection, management, and use of utility as-built data, confirmed these observations (25). DOTs also reported not having survey-grade accuracy or mapping-grade accuracy requirements for the submission of utility as-builts. DOTs typically receive information such as owner’s name and contact information along with data such as location, size, and material type. However, more detailed data are normally missing, such as number of lines and horizontal accuracy, contributing to poor quality and lack of completeness in the utility as-built information provided.
Questions about the completeness and quality of existing underground utility as-built data information and the potential liability of using this information by project designers prompted the emergence of national standards. In 2022, the Utility Engineering and Surveying Institute (UESI) and the Construction Institute (CI) at the American Society of Civil Engineers (ASCE) published an updated version of the 2002 consensus standard for utility investigations (labeled ASCE/UESI/CI 38-22 or ASCE 38 for short) (26). The ASCE 38 standard guideline outlines typical activities for conducting utility investigations and describes four quality level attributes for individual utility features: quality level D (QLD), quality level C (QLC), quality level B (QLB), and quality level A (QLA). ASCE 38 includes examples showing utility facilities and their quality levels on utility investigation deliverables. However, it is worth noting that ASCE 38 is not a standard guideline for utility data attribution or feature symbology.
In 2022, ASCE published a new consensus standard (ASCE/UESI/CI 75-22 or ASCE 75 for short) (27). The ASCE 75 standard guideline describes essential elements for recording and exchanging data about the location and other attributes of underground and aboveground utility infrastructure. The guideline focuses on newly installed, repaired, or otherwise exposed or accessible utility infrastructure. The guideline establishes minimum, optional, and conditional elements of spatial and non-spatial attribute data associated with utility infrastructure. The standard guideline also provides recommendations for effective practices to facilitate data exchange among project stakeholders. Typical situations for application of the standard guideline in the context of construction and utility inspections include the following:
- New construction or repair of existing utility infrastructure.
- Adjustment or relocation of existing utility infrastructure.
- Any construction activity that exposes utility infrastructure.
- Trenchless utility installation or rehabilitation of existing utility infrastructure.
The guideline specifies that the horizontal and vertical accuracies of all utility infrastructure observation points should be reported at the 95 percent confidence level in accordance with FGDC-STD-007.4-2002 (28). The guideline further specifies that all positions should conform to an established datum referenced to the National Spatial Reference System and avoid relative spatial positioning. The guideline did not specify a specific horizontal or vertical accuracy, leaving it to be specified by agreement between the parties. Another critical part is the definition of a framework for utility data exchange, which includes feature types, geometry types, and feature attributes. Importantly, the list of feature types includes minimum, optional, and conditional data requirements. Examples of minimum data requirements include owner, utility type, feature type, operational status, horizontal spatial reference and positional accuracy, and vertical spatial reference and positional accuracy.
The technical literature is abundant on the techniques and methods to conduct utility investigations. Most of the available literature focuses on underground facilities. For example, in 2009, a Second Strategic Highway Research Program (SHRP2) research report documented underground utility location techniques that were available at the time (29). The report highlighted the capabilities of the techniques as well as their limitations. It also highlighted that most geophysical methods require professional interpretation. In 2017, a research project in The Netherlands completed an assessment of detection technologies for underground features (30). The research compares electromagnetic, magnetic, ground penetrating radar (GPR), and acoustic technologies (Table 10).
Table 10. Comparison of Underground Detection Technologies (Adapted from [30]).
| Characteristic | Electromagnetic | Magnetic | GPR | Acoustic | ||
| Inductive | Passive | |||||
| Detectable material | Cables | X | X | X | ||
| Metal | X | X | X | X | X | |
| Non-metal | X | X | ||||
| Functional at excavation speed | Yes | Yes | Yes | Yes | No | |
| Accuracy | 0.1 m (0.3 ft) | 5% of depth | 5–10% depth | 0.1–0.2 m (0.3–0.6 ft) |
||
| Depth range | <2 m (7 ft) | <2 m (7 ft) | 3–6 m (10–20 ft) | <4 m (13 ft) | <3 m (10 ft) | |
| Frequency | 50–480 Hz | 50–60 Hz | 50 Hz–4 GHz | 132–210 Hz | ||
| Impact of soil condition on functionality | Wet soil | High | High | Low | High | High |
| Salty soil | High | High | High | High | Low | |
| Clay soil | Low | Low | Low | Low | Low | |
| Sensitivity to terrain conditions | Low | Low | Low | High | Low | |
| Scanning pattern | Swinging along estimated pipeline location | Swinging along estimated pipeline location | Swinging along estimated pipeline location | In grid | n/a | |
| Data processing | Real time | X | X | X | ||
| Post processing | X | X | ||||
| Estimated maturity level (scale 1–10) | 7 | 7 | 6 | 8 | 4 | |
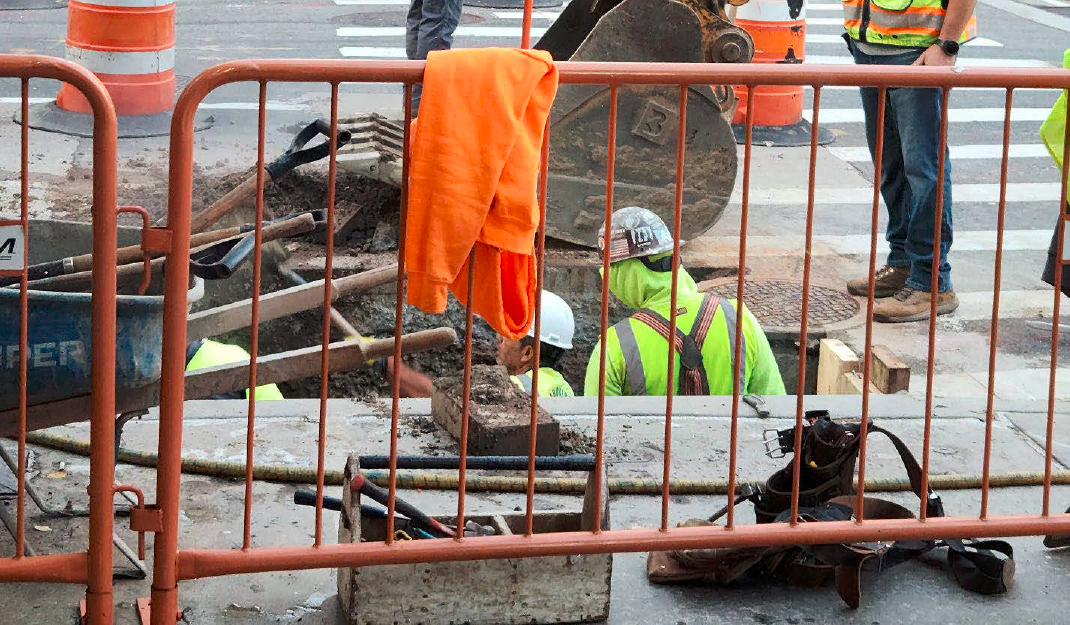
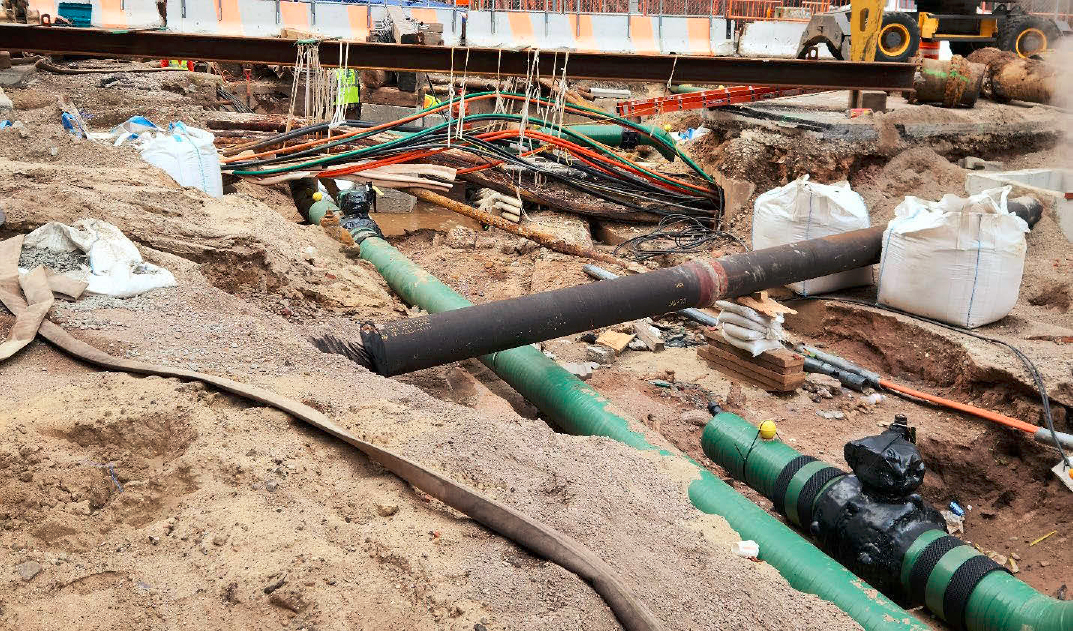
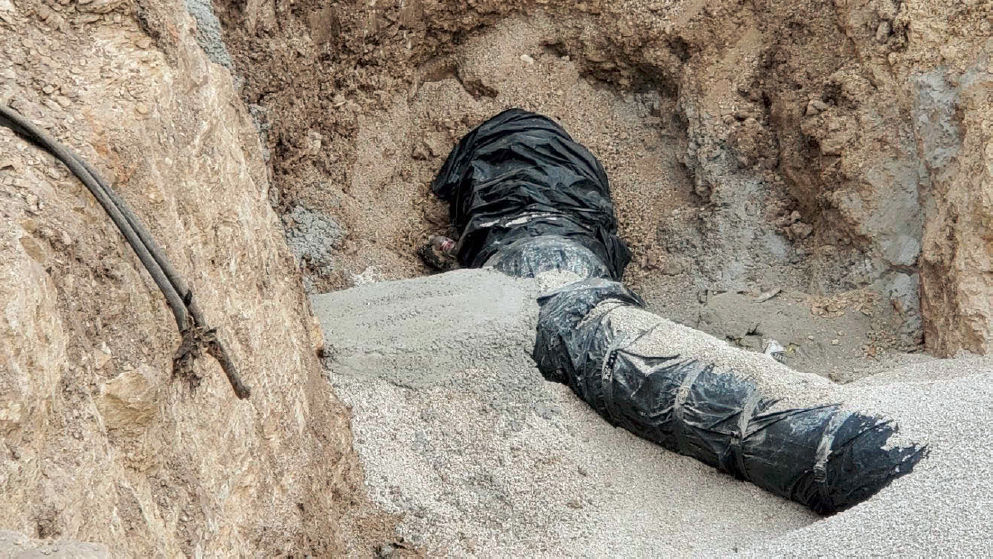
Utility investigations based on the ASCE 38 standard (particularly QLB and QLA investigations) are almost always conducted during the design phase. Increasingly, DOTs are beginning to conduct utility investigations earlier (i.e., during preliminary design). It is rare to use SUE during construction. Test pits are common during construction, primarily as a tool to confirm the location of underground features (Figure 3). Often, contractors begin digging test pits but end up digging slit trenches, particularly in situations where they cannot find underground features based on the information available to them on project plans. In complex urban environments, it is also common to complete “mass excavations” to expose underground utility installations over a wide area (Figure 4).
Courtesy of the Texas A&M Transportation Institute
According to a survey conducted in 2002, 22 state DOTs used SUE on highway projects, but it was not clear how systematically or to what degree (31). From the survey responses, most DOTs that used SUE left it to discretion of the project manager or district utility coordinators to decide whether to use SUE.
Courtesy of the Texas A&M Transportation Institute
As part of Phase 1 of the national utility review mentioned previously, FHWA asked state DOTs to explain the process to document existing utility facilities and whether they used utility owner input, as-built plans, or SUE for this purpose (7). A total of 27 DOTs (53 percent) indicated that their primary utility investigation method was as-built plans and the One-Call process. Contractors, utility owners, and DOT staff indicated as-built location data were unreliable and, at best, provided a general indication of X–Y utility location data.
As part of the literature review, the research team gathered DOT manuals (typically utility or design manual) from the agencies’ websites. The review revealed that 38 DOTs mention or describe procedures or requirements for utility investigations in their policy documents.
Some DOTs have developed tools to determine when to use SUE. The Pennsylvania Department of Transportation (PennDOT) developed a spreadsheet tool called utility impact analysis (UIA) to choose the appropriate utility investigation quality level for a project, more specifically whether QLB or QLB and QLA would be necessary (32, 33). In general, UIA assumes that preliminary utility data are available prior to starting the analysis.
UIA uses a two-step process. Step 1 is usually at the project level. Step 2 normally applies at the project segment or location levels because projects are not completely homogeneous regarding factors such as density or age of utility facilities.
As part of Step 1, the user answers four questions related to whether there is evidence of underground utility facilities; whether any excavation of more than 2 feet is necessary, including excavation on temporary construction easements or other easements; likelihood the project will
impact subsurface utility facilities; and lack of accurate utility facility data. A yes answer to any these questions (which is a common scenario), could indicate that a QLB or QLA investigation is necessary, and the user proceeds with Step 2.
As part of Step 2, the user evaluates the potential impact associated with the following 13 complexity factors:
- Density (i.e., number) of utility facilities.
- Type of utility facilities.
- Pattern of utility facilities.
- Material of utility facilities.
- Access to utility facilities.
- Age of utility facilities.
- Project area description.
- Type of project.
- Quality of utility record.
- Estimated business impact.
- Estimated environmental impact.
- Estimated safety impact.
- Other impact.
For example, for density of utility facilities, the user selects one of the following options: Low (if one pipeline is crossing the road), Medium (if two-three pipelines are crossing the road), or High (more than three pipelines are crossing the road, or if there are unknown pipelines). Likewise, for type of utility facilities, the user selects one of the following options: Less-Critical (in the case of water, forced sewer main, or stormwater), Sub-Critical (in the case of telephone, electric, cable television, or gravity sewer), or Critical (in the case of fiber optic cable, oil or gas pipelines, high-voltage electric lines, or unknown facilities). Each impact level has a numerical value: 1 for Low, 2 for Medium, and 3 for High.
After adding the numerical values for the complexity factors used and dividing by the number of complexity factors used, the average impact score is compared against a reference table to determine the quality level required (Table 11).
Table 11. PennDOT’s Utility Impact Scores (33).
| Descriptor | Utility Impact Score | ||
|---|---|---|---|
| 1.01–1.67 | 1.68–2.33 | 2.34–3.00 | |
| Recommended minimum SUE quality level | QLB | QLB or QLA | QLA |
| Relative cost factor | 16.67 | 33.33 | 66.67 |
The Georgia Department of Transportation (GDOT) developed a utility impact rating form to determine the quality level needed (34, 35). The form used 10 factors, where the impact level for each factor could be low, medium, or high. Combining the impact levels for the 10 factors produced an overall utility impact score, which could be low (minimum project impact), medium (moderate project impact), or high (high project impact). GDOT recommended gathering QLD
data during the project concept development, QLC if the utility impact rating was low, and QLB if the utility impact rating was medium or high. These recommendations were at the project level.
More recently, GDOT modified the process to determine quality levels (36). Currently, GDOT recommends conducting utility investigations as follows:
- QLD: This level of information is typically recommended during the project concept development.
- QLC: This level of information is typically used on rural projects and is recommended when preliminary design begins, and project mapping and survey control have been established.
- QLB: This level of information is used to make preliminary decisions about storm drainage systems, footings, and foundations with a focus on avoiding existing utility facilities. QLB is typically used on urban projects and is recommended when preliminary design begins, and project mapping and survey control have been established.
- QLA: This level of information is needed at specific locations for final design and utility placement decisions where the potential for cost savings is significant. It is recommended after the preliminary field plan review, preferably after completing a UIA.
GDOT’s UIA methodology is different from what PennDOT uses. GDOT’s UIA methodology relies on a utility conflict list to determine to what extent the project affects existing utility facilities (37). The analysis is typically recommended after gathering QLB data and is used to determine where QLA test holes are necessary (around 30 percent design). GDOT recommends conducting a second UIA after the second submission of project files to utility owners to resolve any new or remaining utility conflicts (around 70–90 percent design if applicable). GDOT also has checklists for SUE deliverables. The checklists vary depending on the SUE quality level that GDOT requested (37).
The Washington State Department of Transportation (WSDOT) determines the type of utility investigation needed depending on the type of project activity (38). Table 12 shows the minimum quality levels that are normally required for each type of project activity, along with recommended quality levels depending on the information that is found during the analysis. WSDOT highlights that project teams should identify and apply appropriate techniques based on budgets and expectations. In particular, project teams should evaluate the costs of a higher quality level versus the potential costs associated with the risk of accepting a lower quality level.
Until recently, Caltrans did not use geophysical techniques for utility investigations. At Caltrans, a positive verification of utility locations (using test holes) is necessary if the utility facility is considered a high priority (39). High-priority utilities are:
- Natural gas pipelines larger than 15 cm (6 inches) in diameter or with an operating pressure greater than 60 psi.
- Petroleum pipelines.
- Pressurized sanitary sewer pipelines.
- High-voltage electric supply lines, conductors, or cables of at least 60 kV.
- Pipelines transporting hazardous materials.
The project engineer can also order a test hole if a utility facility is within 3 m (10 ft) of a proposed excavation area.
Table 12. WSDOT’s SUE Quality Level Requirements (38).
| Type of Work | Quality Level Required | |||
|---|---|---|---|---|
| QLD | QLC | QLB | QLA | |
| Curbing | • | |||
| Concrete barrier | • | |||
| Striping | • | |||
| Hot mix asphalt (HMA) overlay only | • | ∘ | ||
| HMA or Portland cement concrete pavement | • | ∘ | ||
| Clearing and grubbing operations | • | ∘ | ||
| Removal of structures and obstructions | • | ∘ | ||
| Surfacing | • | ∘ | ||
| Sidewalks | • | ∘ | ||
| Guideposts | • | ∘ | ||
| Monuments | • | ∘ | ||
| Pit site production | • | ∘ | ||
| Signing | • | |||
| Mailboxes | • | |||
| Guardrail installation | • | ∘ | ||
| Roadside planting | • | ∘ | ||
| Fencing | • | ∘ | ||
| Irrigation systems | • | ∘ | ||
| Temporary erosion control | • | ∘ | ||
| Pipe/drainage structures | • | ∘ | ||
| Ditch/pond excavation | • | ∘ | ||
| Roadway excavation/widening | • | ∘ | ||
| Advanced geotechnical work | • | ∘ | ||
| Bridge structures | • | ∘ | ||
| Retaining walls | • | ∘ | ||
| Piling | • | ∘ | ||
| Signal systems | • | ∘ | ||
| Illumination systems | • | ∘ | ||
| Intelligent transportation systems | • | ∘ | ||
| Railroad crossings | • | ∘ | ||
| Sanitary sewers | • | ∘ | ||
| Water mains | • | ∘ | ||
| • – Minimum level required ∘ – Optional, depending on what is found | ||||
In 2018, the Colorado legislature passed a law that mandated the use of utility investigations in accordance with ASCE 38 (more specifically QLB and/or QLA) on any project that meets the following requirements (40):
- The project has a construction contract with a public entity.
- The project involves primarily horizontal construction.
- The project involves utility boring or has an anticipated excavation of more than 60 cm (2 ft) in depth and covers at least 93 m2 (1,000 ft2).
If the project meets these requirements, it then requires the services of a licensed professional engineer.
Utility Conflict Management
UCM is a comprehensive multi-stage process that involves the systematic identification and resolution of utility conflicts. A term sometimes used in the United States instead of conflict is interference. Abroad, the term interference is more common. In 2012, SHRP2 completed project SHRP2 R15B, which involved the development of a systematic UCM framework to identify and resolve utility conflicts (41). The research produced three implementable products: A standalone template for utility conflict lists, a utility conflict data model and database, and a one-day training course.
As part of the SHRP2 Implementation Assistance Program, 18 state DOTs received grants from FHWA to conduct pilot implementations (Table 13) (42). Members of the research team conducted the research and provided technical support for the implementations. The goals and scope of the implementations varied depending on the needs of the individual DOTs, but, in general, they ranged from implementation of the standalone utility conflict list at a sample of pilot projects to the development and implementation of enterprise system modules to automate specific UCM features.
The results of the FHWA pilot implementations were positive, including tangible economic and project delivery savings. For example, TxDOT identified almost $10 million in monetary savings and 38 months in project delivery time savings after implementing the UCM approach at five pilot projects. The savings were primarily the result of identifying changes in project design that avoided utility relocations. TxDOT also identified additional benefits totaling $13 million from projects elsewhere in the state that started using the UCM approach.
Table 13. Agencies that Received Funds to Implement the R01A, R01B, and R15B Products.
| Round 3 | Round 5 | Round 6 | Round 7 |
|---|---|---|---|
| R15B: Iowa Kentucky Michigan New Hampshire Oklahoma South Dakota Texas |
R01A: California DC Kentucky Texas Utah |
R01B: Arkansas California Ohio Oregon R15B: California Delaware Indiana Maryland Oregon Utah |
R01A: Indiana Michigan Montana Oregon Pennsylvania Washington R01B: California Indiana Montana R15B: Montana Pennsylvania South Carolina Utah Vermont Washington |
R01A focused on database implementations of utility inventories.
R01B focused on advanced geophysical techniques to conduct utility investigations.
R15B focused on the implementation of UCM techniques.
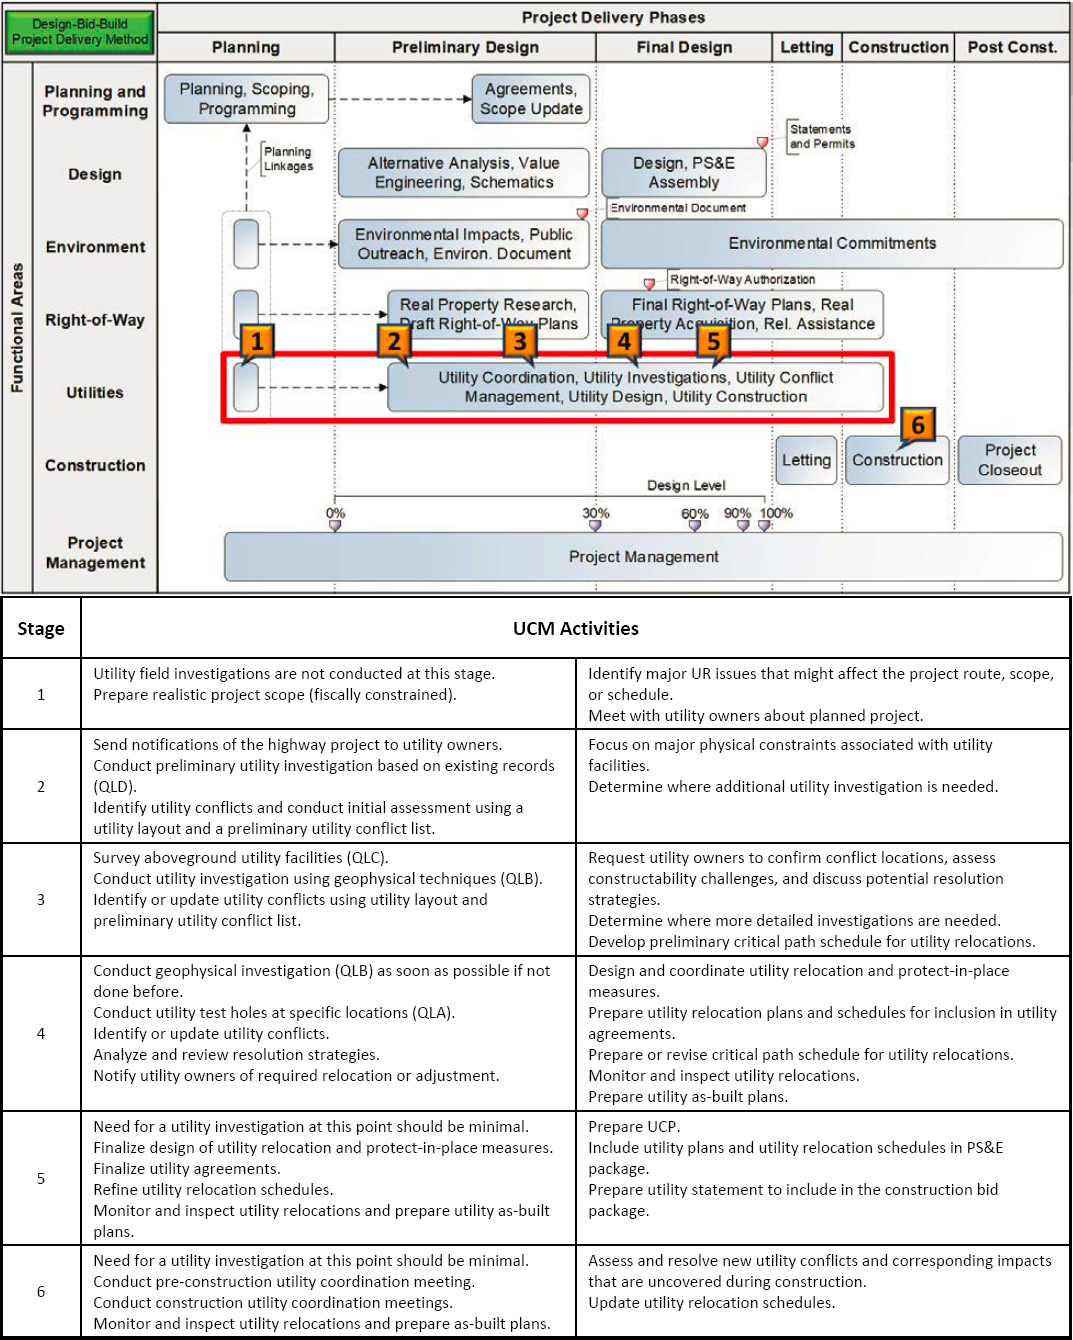
UCM stages can vary depending on project characteristics. As a reference, Figure 5 shows a generic depiction of the project delivery process assuming a design-bid-build project delivery method. Members of the research team have conducted hundreds of UCM training sessions since the initial SHRP2 R15B research was completed. Through interactions with practitioners all over the country, the research team has developed a generic, reference sequence of UCM activities throughout project delivery. Figure 5 shows six concurrence points that correspond to important UCM stages, along with a summary of UCM activities by stage.
In practice, the number and placement of the UCM activities could vary from project to project. However, the stage structure and UCM activities described above provides a framework for implementation.
Members of the research team have been involved in the TxDOT UCM program since its inception by providing technical support and training to all 25 TxDOT districts. As part of this program, TxDOT selected 25 pilot projects that were in the preliminary stages of project delivery (typically no more than 30 percent design). The pilot projects range from small two-lane rural projects to multi-lane urban freeway projects. As of this writing, half of the pilot projects had finalized design and moved to construction. This wide range of pilot projects has given the research team a unique opportunity to see first-hand a multiplicity of practices for managing utility conflicts. The research team has also documented lessons learned and provided recommendations to TxDOT officials (district and division level) and consultants to improve UCM practices.
Courtesy of the Texas A&M Transportation Institute.
Involvement of the research team during the construction phase has included participation in utility coordination meetings and documenting lessons learned that could be applied for future projects during the design phase. For example:
- A lesson learned from a utility coordinator involved in construction management indicated that focusing on flexibility and anticipating activities by the highway contractor instead of waiting for requests for information (RFIs) makes utility relocations during construction more expedited. Developing a working relationship with utility contractors is as important as developing a working relationship with highway contractors.
- For one of the projects, the design team designed the project in three dimensions (3D) including utilities, but the bid package was prepared in two dimensions (2D). The contractor only received 2D plan sheets. The construction utility coordinator and the construction management team commented that if they had received the 3D design files, it would have helped them to manage utility situations during construction more effectively.
- For another project, a proposed storm sewer inlet was designed a few feet away from an existing water line end cap. The location of the inlet was based on QLB data, which showed the location of the end cap. During construction, the contractor found a sizable thrust block providing critical structural support for the end cap, but the plans did not show the thrust block. None of the stakeholders during the design phase (SUE provider, project manager, designer, utility coordinator, or utility owner) thought a waterline end cap would need a thrust block for structural integrity. This conflict caused a delay during construction while a redesign of the stormwater was completed. This case highlights the need to strengthen SUE investigation requirements to make sure the deliverables depict all critical structural elements (such as thrust blocks, as shown in Figure 6), whether detected or suspected.
- For another project, some utility owners did not receive information about existing wetlands, which was critical considering the time required to obtain United States Army Corps of Engineers permits. In addition, for the relocation of a communication line, the plans the utility owner received showed stormwater information, but not an existing sanitary sewer. With this information, the utility owner conducted the design and proceeded with the relocation in the field. After finding the sanitary sewer, the utility owner had to redesign and relocate their line again.
Chapter 4 includes a more detailed description of the case study on United States (US) 281 in San Antonio, Texas, which is part of the TxDOT UCM implementation.
Courtesy of the Texas A&M Transportation Institute.
Decision Support Systems
A decision support system (DSS) is a system that facilitates the decision-making process in situations where the data needed to address a problem are unstructured (i.e., without a structure) or semi-structured. One of the applications of DSSs is risk management. DSSs could be fully computerized or manual.
The literature is scant on the application of DSSs to address utility risks during project delivery. Based on the definition above, the PennDOT UIA tool described previously could be considered a DSS because it relies on a combination of unstructured and semi-structured data to determine whether QLB or QLA may be recommended for a project.
In 2006, TxDOT completed a research project to analyze the effectiveness of including utility relocations in the highway contract (43). The research included the development of a prototype Combined Transportation and Utility Construction (CTUC) decision support tool. The tool, which was developed using Visual Basic for Applications in an Excel spreadsheet framework, was not implemented.
For proposed utility relocations, the decision support tool isolated significant issues and displayed feedback from project owners and utility owners in favor or against including utility relocations in the highway contract. The feedback was based on a list of 53 factors called decision drivers that described unique circumstances that called for including (or not) a utility relocation in a highway contract. Each decision driver had an impact level that ranged from 4 (No Impact) to 1 (High). The decision support tool also had a list of 17 questions that provided context to the decision drivers considered in the analysis.
The impact level associated with each decision driver was the result of feedback provided by TxDOT and utility owner stakeholders. As an illustration, Table 14 lists the top five pro-CTUC decision drivers and the corresponding impact levels as well as the top five anti-CTUC decision drivers and the corresponding impact levels.
Table 14. Top Five Decision Drivers (43).
| Rank | TxDOT Decision Driver | Impact Level | Utility Owner Decision Driver | Impact Level |
|---|---|---|---|---|
| Pro-CTUC Decision Drivers | ||||
| 1 | Severe schedule pressures | 2.81 | Reduced delay costs due to CTUC | 2.61 |
| 2 | Relocation can only happen during construction | 2.73 | Relocation can only happen during construction | 2.56 |
| 3 | Reduced delay costs due to CTUC | 2.62 | Substantial clearing and grubbing | 2.47 |
| 4 | Reduced delay costs due to CTUC | 2.44 | Reduced delay costs due to CTUC | 2.45 |
| 5 | Shared underground facility (all CTUC) | 2.37 | Severe schedule pressures | 2.44 |
| Anti-CTUC Decision Drivers | ||||
| 1 | Only utility crew can do | –3.75 | Front-end loading: Increased costs with CTUC | –3.5 |
| 2 | Utility cannot pay in advance | –3.38 | Change order: Increased costs with CTUC | –3.47 |
| 3 | Utility work beyond right-of-way | –3.29 | Utility cannot pay in advance | –3.44 |
| 4 | Utility plans are unacceptable | –3.00 | Added contract tier: Increased costs with CTUC | –3.37 |
| 5 | Utility owner does not qualify for State Infrastructure Bank financial assistance | –3.00 | Only utility crew can do | –3.33 |
In 2011, the SHRP2 research mentioned previously also produced a reference database of utility locating and characterization methods, which led to the development of a prototype decision support tool called Selection Assistant for Utility Locating Technologies (SAULT) (29, 44). The researchers examined several design approaches for developing SAULT, including deterministic, fuzzy logic, case-based selection, choices and preferences, and artificial neural networks (ANNs). The researchers noted that a robust database of real-world examples was not available and settled for a system that would provide strategies based on a range of conditions but would not be a substitute for first-hand experience with specific equipment under specific site conditions. SAULT was written in Jess, which is a rule engine for the Java platform. The system was based on a series of flowcharts describing site conditions and locating technology options.
CONSTRUCTION AND UTILITY INSPECTION REQUIREMENTS
The research team reviewed available information about construction and utility inspection requirements from all 50 states. The research team found 29 DOT websites that had specific requirements for construction or utility inspections. This review reflects standard requirements that apply to a wide range of highway construction projects, utility relocations, and new utility
installations within the right-of-way (typically via permit). It does not reflect specific requirements at the district or project level, which may be shared directly with stakeholders via special provisions in utility agreements and permits. DOTs do not normally publish these special provisions on their websites. Readers should also be aware that the review reflects inspection requirements that are available in regulations and manuals but does not capture the degree to which actual inspections conform to those requirements. Subsequent sections document inspection practices and the collection of utility as-built data after utility relocations of new utility installations.
Alabama
The Alabama Department of Transportation (ALDOT) requires as-builts depicting the location of existing and relocated utility facilities within the right-of-way. As-built files may be necessary from a 3D field survey tied to project control points or GNSS coordinates, including elevations of underground utility facilities (45). ALDOT does not require utility owners to submit as-built files if there is not a significant deviation from plans, specifications, locations, and conditions covered by the original approved permit or agreement. However, the utility owner must submit a letter to the region engineer stating that there is not a significant deviation and that original plans can be stamped “as-built.” If the deviation from the original plans is substantial, the utility owner must submit as-built files showing actual horizontal (and vertical if necessary) locations, types, sizes, and other descriptive data.
Sections 640–649 of the ALDOT standard construction specifications include utility construction requirements for minor utility adjustments, water lines, sanitary sewers, natural gas lines, and encasement pipes, which can be used as inspection criteria for utility inspections (46). For example, construction requirements for water lines are as follows:
- Excavate a drainage pit of 0.6×0.6×0.6 m (2×2×2 ft) below each hydrant.
- Include 0.9 m (3 ft) of pipe to connect fire hydrants to the water line.
- Excavate at least 0.45 cm (18 inches) plus the outside diameter of the water line.
- Ensure a minimum depth of cover of 1.2 m (4 ft) under pavement and 0.9 m (3 ft) under ditches.
- Install thrust blocks or other approved restraints on all water lines that are least 10 cm (4 inches) in diameter, at all wyes, tees, plugs, caps, and at bends with a deflection angle of at least 22.5 degrees.
Alaska
At the Alaska Department of Transportation and Public Facilities (DOT&PF), regional utility engineers decide actual inspection levels for utility relocations (47). General guidelines to determine the frequency and level of inspection include the complexity of the utility relocation; cost of the relocation; location of work and impact to the traveling public, businesses, and residences; duration of the relocation; and sensitivity of location in terms of environmental, historical, and potentially contaminated areas.
Table 15 shows survey accuracy requirements and Table 16 shows survey spacing requirements as a function of curve radius (R) at DOT&PF (48).
Table 15. Survey Accuracy Requirements (48).
| Highway Facility | Distance to Centerline (cm [ft]) |
Grade (cm [ft]) |
|---|---|---|
| Bridges | 0.6 (0.02) | |
| Clearing and grubbing | 10 (0.3) | |
| Culverts | 1 (0.03) | |
| Curb and gutter | 1 (0.03) | 0.6 (0.02) |
| Guardrail | 10 (0.3) | |
| Manholes, catch basins, and inlets | 1 (0.03) | 0.6 (0.02) |
| Riprap | 10 (0.3) | 5 (0.2) |
| Signs | 10 (0.3) | |
| Underdrains and sewers | 1 (0.03) | 0.6 (0.02) |
Table 16. Survey Spacing Requirements as a Function of Curve Radius (48).
| Highway Facility | R>250 m (820 ft) (m [ft]) |
125<R≤250 m (410<R≤820 ft) (m [ft]) |
R≤125m (410 ft) (m [ft]) |
|---|---|---|---|
| Centerline | 25 (82) | 12.5 (41) | 10 (33) |
| Clearing | 25 (82) | 12.5 (41) | 10 (33) |
| Curb and gutter | 10 (33) | 10 (33) | 10 (33) |
| Guardrail | 10 (33) | 10 (33) | 10 (33) |
| Riprap | 20 (66) | 20 (66) | 20 (66) |
| Slope stake/cross sections | 25 (82) | 12.5 (41) | 10 (33) |
| Under drains and sewers | 10 (33) | 10 (33) |
Arizona
The Arizona Department of Transportation (ADOT) has a list of inspection activities for highway construction projects (Table 17) (49). This list includes inspection activity descriptions and frequency (or spacing) for individual construction work items.
ADOT requires the collection of as-built data to document the final installation of contract bid items, such as pavement, signs, light poles, manholes, valves, storm drains, catch basins, curb and gutter, and utility facilities (49). ADOT requires as-built files to be compatible with ADOT’s CAD and geographic information system (GIS) software. ADOT provides GIS file formats and feature codes to assist with digital as-built file submissions.
ADOT requires as-built data to include line and point features and sufficient photo links to ensure the GNSS data properly describe the feature being captured (49). For example, for a sign structure that shows up as a point feature on the as-built plans, the construction manual requires a photo showing the actual sign placard on the structure. ADOT requires all as-built data (including elevations) to link to the project datum. ADOT also requires location precisions to be the same as the precision used to stake the project item.
Table 17. Construction Survey Task List (49).
| Specification Section | Specification Work Item | Activity Description | Inspector | Survey Crew | Frequency/Spacing |
|---|---|---|---|---|---|
| 201 | Clearing and Grubbing | Check staking limits with right-angle prism and 100-ft chain | X | Beginning of job | |
| 202 | Remove Structures and Obstructions | Measurements and records | X | Prior to removals | |
| 203 and 204 | Earthwork | Review plans; check contractor’s survey staking: | |||
| Check catch points | X | 152 m (500 ft) maximum | |||
| Check 90-degree angles | X | 152 m (500 ft) maximum | |||
| Check slope stakes | X | 152 m (500 ft) maximum | |||
| Check alignment | X | 152 m (500 ft) maximum | |||
| Spot check slopes with hand level | X | 152 m (500 ft) maximum | |||
| Check each progressive lift depth | X | 152 m (500 ft) maximum | |||
| 205 | Grading Roadway for Pavement | Check contractor bluetop survey staking | X | 61 m (200 ft) average | |
| Stringline all bluetops | X | All | |||
| 301 to 304 | Subgrades, Subbases, and Bases | Subgrade only: Check contractor survey control bluetops | X | 61 m (200 ft) average | |
| Subbases and bases: Check bluetops | X | By request only | |||
| Stringline each lift of subgrades, subbases, and bases | X | All | |||
| 305 | Lean Concrete Base | Check horizontal and vertical alignment of wire staking Check hub and tack control with plumbline and stringline | X | X | 61 m (200 ft) maximum 30 m (100 ft) intervals |
| 401 | Portland Cement Concrete Pavement (PCCP) | Check horizontal and vertical alignment of wire staking | X | 61 m (200 ft) maximum | |
| Check hub and tack control with plumbline and stringline | X | 30 m (100 ft) intervals | |||
| 402 | PCCP repairs | Measure, locate, record work | X | As required | |
| 406 to 408 | Asphaltic concrete classes | Check depths and offsets, stationing, and straight edging | X | 30 m (100 ft) intervals |
| Specification Section | Specification Work Item | Activity Description | Inspector | Survey Crew | Frequency/Spacing |
|---|---|---|---|---|---|
| 501 and 502 | Pipes, culverts, and Drains | Check Contractor’s survey cut stakes: vertical and horizontal control | X | Short runs - both ends | |
| Use appropriate survey instruments | X | All large sizes, long runs; others by request only | |||
| Check pipe excavation and backfill using hand level, watch grade checker | X | Check each advance | |||
| 503 to 505 | Catch Basins, Standpipes, Manholes | Check position: Alignment and elevations | X | Check only upon request | |
| Verify conformance with design | X | Field verify each location | |||
| 601 | Concrete Structures: Bridges | Forms/soffit/falsework: Verify edge of deck horizontal and vertical control. Check offsets, grades, screeds from control | X | X | Check every structure. Check all items |
| Abutments and piers: Check location and elevation of foundations prior to major pours | X | Check every structure | |||
| Bearing pads: Check initial placement and control points, prepare as-builts | X | Verify layout at beginning of job only, and by request thereafter | |||
| Check bearing pads prior to concreting | X | Subsequent construction | |||
| Check approach and anchor slabs | X | By request only | |||
| Bid-Well: Provide fill marks for inspector to check bid-well initial setup | X | Verify layout at beginning of job only, and by request thereafter | |||
| Continue progress checks: Depths, joint locations, etc. | X | Subsequent construction | |||
| 601 | Concrete Structures: Walls and Miscellaneous | Check contractor’s initial staking, check footings placement and elevations, etc. | X | Verify layout at beginning of job only, and by request thereafter | |
| Check locations and grades; check all wall forms and miscellaneous structures for plumbness and alignment | Check all items | ||||
| 603 and 609 | Pilings and Drilled Shaft Foundations | Check contractor’s survey control hubs, check elevations and horizontal placement | X | Initially all, then random | |
| Check lines and grades | X | Check all structures |
| Specification Section | Specification Work Item | Activity Description | Inspector | Survey Crew | Frequency/Spacing |
|---|---|---|---|---|---|
| 604 | Steel Structures | Forms/soffit/falsework: verify edge of deck horizontal and vertical control | X | Check every structure | |
| Check offsets, grades, screeds from control | X | Check all items | |||
| Abutments: initial location and elevation | X | Check every structure | |||
| Bearing pads: check initial placement and control points, prepare as-builts | X | Verify layout at beginning of job only, and by request thereafter | |||
| Check bearing pads prior to concreting | X | Subsequent construction | |||
| Bid-Well: provide fill marks for inspector to check Bid-Well initial setup | X | Verify layout at beginning of job only, and by request thereafter | |||
| Continue progress checks: depths, joint locations, etc. | X | Subsequent construction | |||
| 606 to 608 | Sign Structures and Support | Check installation layouts, foundation elevations, and slopes | X | Verify layout at beginning of job only, and by request thereafter | |
| Check lines and grades | X | All major units | |||
| 801 to 804 | Landscape Earthwork | Check contractor survey control bluetops | X | By request only | |
| Inspect final grading and depth of soil | X | All | |||
| 808 / 809 | Water Distribution and Sewer System | Check contractor’s survey cut stakes: Vertical and horizontal control | X | Short runs–both ends | |
| Use appropriate survey instruments | X | All large sizes, long runs; others by request only | |||
| Check pipe excavation and backfill using hand level, watch grade checker | X | Check each advance | |||
| 902 and 903 | Fences | Check layout work and measure for payment | X | Prior to and when complete | |
| 905 | Guardrail | Check contractor’s layouts | X | By request only | |
| Check layout and placement | X | Subsequent construction | |||
| 908 | Curb and Gutter | Check alignment and grade control points | X | Only if curb and gutter is placed prior to paving; otherwise checked by inspectors | |
| 909 | Survey Monuments | Check contractor’s survey on permanent section corner replacements and similar | X | Verify all key monuments |
| Specification Section | Specification Work Item | Activity Description | Inspector | Survey Crew | Frequency/Spacing |
|---|---|---|---|---|---|
| 910 | Concrete Barriers | Check placement and dimensions | X | All critical points | |
| 911 | Right-of-way Markers | Check placement | X | Verify all markers | |
| 914 | Sound Barrier Walls | Check contractor’s initial staking, check footings placement and elevations, etc. | X | Verify layout at beginning of job only, and by request thereafter | |
| 925 | Construction Surveying and Layout | Check locations, grades, and plumbness | Check all structures | ||
| Inspections and random checks as detailed above per instructions of the engineer (per the specification) | X | As directed |
This page intentionally left blank.
Arkansas
The Arkansas Department of Transportation (ARDOT) has requirements for locating and surveying existing utility facilities within the survey limits (50). The requirements, which are for design surveys, also include attributes for underground and overhead utility facilities. ARDOT requires measuring the lowest point of the catenary of overhead transmission lines, but not of the catenary of overhead service lines. ARDOT also requires recording utility pole locations with the prism placed on the roadside of the utility pole. For storm and sanitary sewer systems, ARDOT requires collecting manhole rim elevations, manhole invert elevations, pipe sizes, pipe types, and pipe flowline elevations. For underground utility facilities such as water, gas, electric, and communication lines, locations based on 811 paint markings are acceptable, unless a SUE investigation is necessary. ARDOT requires boxes, meters, valves, and other appurtenances to be measured and recorded.
California
At the California Department of Transportation (Caltrans), the utility coordinator is responsible for ensuring that inspections are conducted for utility relocations and for locations where a positive location (i.e., requiring a test hole) is necessary (51). The utility coordinator must notify district construction of any planned relocation and positive location work requiring inspection. A district resident engineer is responsible for conducting the inspection and maintaining diaries to document the work. Without an assigned engineer to inspect the work, a utility relocation should not proceed (52). Inspection objectives include the following:
- Ensure the utility owner’s work complies with relevant design, construction, and traffic requirements.
- Ensure utility facilities are cleared per the notice to owner, the encroachment permit, and the utility agreement.
- Observe and record labor, equipment, and materials used to accomplish the work and materials removed for salvage when the utility relocation is completed at state expense.
Colorado
At the CDOT, utility owners must submit as-constructed (as-built) plans within 45 days of completing a utility facility relocation, showing actual final aboveground and underground utility facilities, including location, alignment, profile, and depth (53). Utility owners must submit as-constructed plans in a 300-dpi, PDF file. In addition, utility owners must provide the depth and elevation of each structure, as specified in the special provisions of each permit (53). CDOT’s SUE scope of work requires the collection of X-Y-Z coordinates for all newly installed or relocated utility facilities (54). Table 18 shows minimum horizontal and vertical tolerances for selected highway features that can be used as guidance while preparing the as-constructed plans (55).
Table 18. Minimum Horizontal and Vertical Tolerances for Highway Features (55).
| Facility | Accuracy Tolerance in cm (ft) | |
|---|---|---|
| Horizontal | Vertical | |
| Culverts and sewers | 0.9 (0.03) | 0.6 (0.02) |
| Manholes, inlets, and meter vaults | 0.6 (0.02) | 0.3 (0.01) |
| Drainage pipe | 0.9 (0.03) | 0.6 (0.02) |
| Water line | 0.9 (0.03) | 0.6 (0.02) |
| Subsurface drains | 0.9 (0.03) | 0.6 (0.02) |
| Major structures | 0.3 (0.01) | 0.3 (0.01) |
| Steel Structures | 0.3 (0.01) | 0.3 (0.01) |
| Traffic control devices | 2 (0.07) | 0.6 (0.02) |
| Riprap | 30 (1) | 3 (0.10) |
In 2019, CDOT started a program to collect location and attribute data about utility facilities using a web-based platform that includes three components: a data collection platform, data integration tools, and a web-based dashboard application (56). The data collection platform is a GNSS-based mobile software application that enables users to capture asset location and attribute data in the field, as well as upload the data to an online geospatial database in real time. Users can also georeference photos, prepare electronic forms, mark up design files, take field notes, and create sketches. The data collection platform is 2D-based, but users can capture depth data using an attribute.
The web-based dashboard application enables users to visualize and analyze utility and pipeline facilities based on information received from data collection devices via a real-time interface, such as aboveground or underground facilities, as-built information, photos, and documents. The dashboard application enables users to mark up and edit map and tabular data and serve that information to field users via the cloud.
Connecticut
The Connecticut Department of Transportation (CTDOT) utility accommodation manual lists horizontal and vertical clearances for various utility facilities. It is not clear whether CTDOT also uses these requirements as guidance for utility relocation inspections. Examples of clearance requirements include (57):
- Utility poles: Minimum setback of 3 m (10 ft) measured from the edge of pavement or face of curb, when feasible and sufficient right-of-way exists. If a 3 m (10 ft) offset is not feasible, the pole may be positioned as close to the right-of-way line as possible. Utility poles man not be located less than 45 cm (18 inches) from the edge of pavement or face of curb.
- Overhead distribution lines: Minimum vertical clearance of 4.7 m (15.5 ft) measured from the road surface at maximum sag condition of the line. For communication lines, the minimum vertical clearance can be reduced to 4.1 m (13.5 ft) at locations where the line does not cross a street or driveway.
- Underground lines: Minimum depth of cover of 0.9 m (3 ft) from the top of the structure to the pavement or ground surface.
- Casing extension: At least 0.9 m (3 ft) beyond the slope or ditch and 5 m (15 ft) outside the edge of pavement.
The construction manual requires the use of station IDs for documenting utility relocations (58). For overhead utility facilities, a pole number is required.
Georgia
GDOT’s standard specifications include requirements for as-built information about utility facilities that are included in the highway contract (59). For example, for fiber optic lines, as-built documentation should include final splicing and fiber allocation details for every splice location. GDOT requires as-built files to include red markups on the original plans and a separate spreadsheet with GNSS coordinates for each item. For intelligent transportation system (ITS) components, GDOT requires a separate spreadsheet with the GNSS coordinates of each component, with a submeter or better positional accuracy.
Idaho
The Idaho Transportation Department (ITD) has a requirement for utility as-built plans to “accurately reflect” completed work including approved changes to original plans (60). This requirement applies to both utility permits and utility agreements. Upon completion of the work, the utility owner submits as-built plans to the district maintenance section. After verifying the information is correct, the maintenance section forwards the utility as-built plans to the district’s utility permit official. ITD allows utility owners to use the approved utility plans of the utility permit or agreement as as-built utility plans if the actual location of the utility facility did not deviate from what was approved. Otherwise, the utility owner must provide as-built utility plans showing the actual locations.
For highway construction, ITD’s standard construction specifications require as-built files to meet construction tolerances (61). For areas with specified tolerance values (as specified in the contract), the contractor must meet the tolerances shown in Table 19. For areas without specified tolerance values in the contract (e.g., ditches and side slopes), what values to use is at the discretion of the construction engineer.
ITD has a requirement for the collection of confidence point data to verify the accuracy of the natural ground digital terrain model (DTM). The confidence points must be evenly distributed over the entire DTM area. The number and density of confidence points depends on the area (e.g., at least 10 points every 457 m [1,500 ft]). Vertical tolerance values depend on the type of surface: 3 cm (0.1 ft) for paved or concrete surfaces, 9 cm (0.3 ft) for machine graded or compacted surfaces, 18 cm (0.6 ft) for irregular natural ground, and 45 cm (1.5 ft) for extremely rugged and rock surfaces. ITD also has a requirement for the collection of grade verification point data: one point for every 46 m2 (500 ft2) of grade (for grades within the subgrade area) and one point for every 93 m2 (1,000 ft2) of roadbed side and ditches (for grades outside the subgrade area). The district then uses the verification point data to evaluate the grade using any industry--
standard technique or method before the end of the first full business day following receipt of the grade verification point data.
Table 19. Control and Survey Tolerances (61).
| Description | Tolerance in cm (feet) | |
|---|---|---|
| Horizontal | Vertical | |
| Control (absolute position, independent of provided control) | 0.9 (0.03) | 0.9 (0.03) |
| Control (relative to nearest provided control) | 0.3 (0.01) | 0.3 (0.01) |
| Centerline points, including offsets | 1.5 (0.05) | |
| Cross sections, slope stakes, and references | 9 (0.3) | 1.5 (0.05) |
| Walks and bike paths | 0.9 (0.03) | 0.6 (0.02) |
| Curb and gutter | 0.6 (0.02) | 0.3 (0.01) |
| Culverts, ditches, and minor drainage structures | 3 (0.1) | 0.9 (0.03) |
| Walls (e.g., retaining, mechanized stabilized earth [MSE], sound) | 3 (0.1) | 1.5 (0.05) |
| Bridge substructure | 0.6 (0.02) | 0.6 (0.02) |
| Bridge superstructure components | 0.6 (0.02) | 0.6 (0.02) |
| Clearing and grubbing limits | 30 (1) | |
| Right-of-way limits | 3 (0.1) | |
| Roadway subgrade finish stakes | 6 (0.2) | 1.5 (0.05) |
| Roadway finish grade stakes | 3 (0.1) | 0.6 (0.02) |
| Paving reference line | 1.2 (0.04) | 0.6 (0.02) |
For highway construction, ITD has the following requirements for as-built files (61):
- Use the ASB abbreviation (i.e., as-built) to denote actual horizontal, vertical, dimension, or quantity measured by the survey or otherwise representing as-constructed conditions.
- Use the F.C. abbreviation (i.e., field change) for revisions or changes from the original design made in the field. In addition, mark as-constructed work in red ink or red pencil to identify the changes to the original design.
- Use the DELETED label for not constructed elements.
ITD requires the contractor to consolidate markings for all revisions and modifications on a clean, complete set of ITD-published plans.
Illinois
The Illinois Department of Transportation (IDOT) has the following requirements with respect to items that must be checked, corrected, and added to the original plan sheets (62):
- Horizontal and vertical control.
- Horizontal alignment (including curve changes and control point ties), profile grade, and changes in typical sections.
- Location, dimensions, and elevations of drainage structures.
- Underground structures such as cable, conduits, and pipes.
IDOT also requires that original details should not be removed from the plan sheets.
Sections 560–565 of the IDOT standard construction specifications include utility construction requirements for cast iron soil pipes, water lines, sanitary sewers, and hydrants, which can be used to facilitate utility inspections (63).
Iowa
The Iowa Department of Transportation (IOWADOT) requires utility owners to submit, within 90 days after completion of construction, as-built files or a letter certifying the actual location of the utility facility was the same as described in the original plan (64). If the utility owner fails to meet this requirement, IOWADOT has the option to hire an independent contractor to locate the utility facility and prepare an as-built file at the expense of the utility owner.
The Iowa Statewide Urban Design and Specifications (SUDAS) Program is a non-profit organization that receives funding from metropolitan planning organizations, regional planning authorities, and local and state transportation agencies. SUDAS developed and maintains statewide urban design standards and construction specifications (65, 66). Several divisions and sections in these documents cover items such as water lines, sanitary and storm sewers. Although they do not include specific inspection requirements, some of the provisions and visual aids can be used to facilitate utility inspections.
Kansas
The Kansas Department of Transportation (KDOT) requires the inspection of all relocated utility facilities to ensure the locations are located as shown on the approved plans. The inspection procedure varies depending on what stakeholder is responsible for the utility relocation: utility owner, KDOT’s contractor, or local public agency (67).
For highway construction, KDOT requires the contractor to visually inspect right-of-way survey monuments, establish or re-establish the project centerline and plan benchmarks, and perform all construction layout and reference staking necessary for proper control and completion of all structures. KDOT also requires the contractor’s surveyor to undertake training on the use of the contractor’s GNSS equipment. Table 20 shows relevant construction tolerances that KDOT uses (68). The specifications also include requirements for the site calibration of GNSS equipment and total stations. For bridges, KDOT has a list of critical bridge elements for which surveys must be within the tolerances established in contract documents (Table 21) (69).
Table 20. Construction Survey Tolerances (68).
| Description | Tolerance in cm (feet) | |
|---|---|---|
| Horizontal | Vertical | |
| Slope staking | 3 (0.1) | 3 (0.1) |
| Finish staking | 1.5 (0.05) | 0.3 (0.01) |
| Critical bridge member staking | 0.6 (0.02) | 0.3 (0.01) |
| Right-of-way survey monuments: Use Kansas Minimum Standards for Boundary Surveys | ||
| Project control points | 1.5 (0.05) | 1.5 (0.05) |
Table 21. Critical Elements Bridge Elements (69).
| Critical Element | Critical Component |
|---|---|
| Spread footing | Location and elevation of centerline |
| Pile cap footing | Location and elevation of centerline |
| Drilled shaft | Location and elevation of center |
| Drilled shaft cap | Location and elevation of centerline |
| Column | Location and elevation of center |
| Pile bent with web wall | Location and elevation of centerline |
| Abutment beam/bearing seat | Location and elevation of centerline |
| Pier beam/bearing seat | Location and elevation of centerline |
| Bearing devices | Location and elevation of centerline, temperature offset |
| Bearing stiffener | Location and elevation of centerline, temperature offset |
| Girder/beam | Location of centerline |
| Anchor bolts/preformed holes | Location of centerline |
| Expansion device | Gap (corrected for temperature) and alignment |
| Fillets (tenth point) | Elevation |
| Surface of forms (slab bridge tenth points) | Elevation |
| Post-tensioning duct | Location and elevation |
| Bolted field splice | Elevation |
Massachusetts
The Massachusetts Department of Transportation (MassDOT) has standard specifications for stormwater facilities and traffic control devices (including conduit, manholes, handholes, and pull boxes) (70). MassDOT requires the contractor to submit five complete copies of as-built or corrected copies of the contract plans, including locations and depths. For utility permits, MassDOT requires utility owners to submit as-built plans (in paper, AutoCAD, or PDF) showing the horizontal alignment and grade elevations of all utility facilities, referenced to the roadway alignment or state station numbers (71).
Michigan
The Michigan Department of Transportation (MDOT) has a standard specification for water mains, which includes the pipe and related facilities such as valves, valve boxes, curb boxes, hydrants, and service connections (from the distribution main to the right-of-way line or as approved by the engineer) (72). MDOT requires the contractor to submit two sets of as-built plans within 30 days after completion of the work. The as-built plans must include pipe locations and sizes, fittings, valve locations, hydrant locations, and service tap locations. The plans must also show the location of underground obstructions that required the relocation of the water main. MDOT also has a standard specification for sanitary sewer systems, including pipes, manholes, cleanouts, and service leads. MDOT requires the contractor to submit as-built plans, including pipe and manhole locations (station and offsets), pipe size and slope, manhole size, invert elevations, tees, tie-ins, and individual service connections.
For highway construction, MDOT has construction survey tolerances, as shown in Table 22.
Table 22. Construction Survey Tolerances (72).
| Description | Tolerance in cm (feet) | |
|---|---|---|
| Horizontal | Vertical | |
| Right-of-way | 1.2 (0.04) | |
| Clearing | 3 (0.1) | |
| Slope, subgrade, utility tunnel, and miscellaneous | 3 (0.1) | 0.9 (0.03) |
| Pavement and drainage | 1.2 (0.04) | 0.3 (0.01) |
| Bridges | 0.3 (0.01) | 0.3 (0.01) |
| Cross sections | 3 (0.1) | |
For utility permitting, MDOT implemented a program called Geospatial Utility Infrastructure Data Exchange (GUIDE) to facilitate the collection of X-Y-Z utility data at the time of installation and organization of the data in a spatial database (73). Data collection requirements include a positional accuracy of 5 cm (0.16 ft) horizontally and vertically and attribute data such as utility type, installation method, feature type, traceability method, and material. Observation requirements are as follows:
- Start and end points.
- At least every 30 m (100 ft) with the following additional points:
- Deviations in installation alignment, including, but not limited to, intentional changes in geometry (e.g., to avoid obstacles) and fittings such as elbows.
- Changes in facility characteristics (e.g., change in size, material, or encasement size).
- Start and end points for vaults.
- Appurtenances installed concurrently with new main installations (e.g., service leads or stubs).
- New appurtenances from existing mains.
- Transverse utility crossings installed via trenchless methods.
GUIDE also includes data collection requirements for a variety of trenchless installation method situations.
Minnesota
The Minnesota Department of Transportation (MnDOT) requires utility owners to submit a permit certificate of completion form along with as-built plans (74). The as-built plans must include the location and elevation of newly installed or relocated utility facilities, referenced to highway stations or the state grid system. MnDOT inspectors are responsible for:
- Noting the depth of trenches and the type of required and installed materials.
- Reviewing the method to backfill trenches and performing tests (or observing tests the utility owner conducts).
- Checking the depth of excavation for and placement of manholes to make sure there is not a conflict with other utility systems.
- Looking for any bad soil conditions.
- Making sure the utility owner covers out-of-service underground facilities or removes them from the right-of-way.
- Checking the location of facilities and their proximity to structures such as planned fences, signposts, light standards, drain structures, storm sewers, bridge structures, approaches, and pier footings.
New Jersey
The New Jersey Department of Transportation (NJDOT) has standard construction specifications for water mains, sanitary sewers, and gas lines (75). The specifications for water mains include pipes, service connections, hydrants, valves, valve boxes, and thrust blocks. The specifications for sanitary sewers include pipes, service connections, and manholes. The specifications for gas lines include pipes, service connections, and valve boxes.
NJDOT requires the contractor to submit as-built plans in a format acceptable to the utility owner. For water utility facilities, the as-built plans must include the location of all construction items (except reset fire hydrant and reset water valve box) and depth of the water pipe and service connections at least every 30 m (100 ft). The as-built plans must also include stationing, distances referenced to the curb line, and three ties for each valve box, curb box, and hydrant within 15 m (50 ft) of aboveground physical features. The standard specifications are similar for sanitary sewer and gas utilities. As-built plans for gravity sewer mains must include rim, invert elevations, and pipe slopes.
New Mexico
The New Mexico Department of Transportation (NMDOT) requires utility owners to submit as-built plans within 30 days after completion of the work (76). The as-built plans must be in AutoCAD .dwg or Microstation .dgn 3D file format. All utility location data must be tied to the department’s monuments and use the North American Datum of 1983 (NAD83), the North American Vertical Datum of 1988 (NAVD 88), and the New Mexico State Plane Coordinate System of 1983 (NMSPCS83). A New Mexico registered land surveyor must certify the utility location data. In addition, NMDOT requires a metadata text file along with the as-built plans, including the district utility permit number; name, address, and phone number of the responsible land surveyor; date of completion of the survey; equipment used to conduct the survey; horizontal and vertical control marks used to tie the survey to the NMSPCS83 and NAVD 88; ground-to-grid combined scale factor used; and elevation data at every 153 m (500 ft) and all survey break points.
North Carolina
The North Carolina Department of Transportation (NCDOT) has the authority to charge utility owners for the cost to conduct inspections that, in the view of the division engineer, are necessary to ensure the installation is completed according to what was permitted (77). The level of inspection can vary from spot-checking overhead installations to continuous and close
observation of the installation and backfilling of underground facilities. Charging utility owners for inspection costs does not usually apply to highway construction projects.
For horizontal drilling installations, NCDOT requires utility owners to submit as-built plans within 30 days after completing the work. The as-built plans must be in GIS format (either Esri™ shapefile or geodatabase format or Google Earth™ .kmz format) and a PDF file containing the following data: Actual path alignment, depth of cover for the casing, actual length, product diameter, casing diameter, and final elevations.
North Dakota
The North Dakota Department of Transportation (NDDOT) has a construction records manual and companion checklists that provide detailed guidance on what inspection activities should focus on and what information to collect during the construction phase (78, 79, 80, 81, 82). For water mains, sanitary sewers, and storm sewers, the inspection checklists cover preconstruction, construction, and post-construction phases.
NDDOT requires contractors to submit a set of as-built plans. The plans can be hand drawn and scanned to PDF or prepared electronically, in which case they should follow NDDOT CAD standards. As-built plans should document changes to the following information (78):
- Beginning and ending project stations.
- Horizontal and vertical alignments.
- Typical sections, including, but not limited to base or surfacing thickness, width of lanes and shoulders, and super elevation.
- Features such as pavement tapers and transitions, driveway locations and sizes, sidewalk width and location, curb size and location, fencing, striping and pavement markings, location of safety appurtenances and shoulder rumble strips, and location of signal and lighting elements.
- Location, elevation, or size of pipes and drainage structures.
- Right-of-way and borrow easements.
- Location, elevations, dimensions, and other characteristics of box culverts and bridges.
- Permanent benchmarks.
- Removal items.
- Placement of trees, shrubs, planters, and retaining walls.
Oregon
The Oregon Department of Transportation (OrDOT) requires contractors to submit as-built plans documenting changes to the contract plans during construction (83). As-built plans include the following information:
- Nonstandard or changed superelevation details.
- Corrected typical sections, base, and surfacing details.
- Changes in vertical and horizontal alignment.
- Established or re-established right-of-way markers, monuments, and benchmarks.
- Areas where subgrade or slope stabilization occurred.
- Changes to pipes and other drainage details.
- New, replaced, removed, or abandoned utility facilities.
- Road approaches and access locations.
Pennsylvania
PennDOT has a section in its design manual, which provides instructions for conducting utility relocation inspections (33). The assigned inspector is responsible for maintaining an accurate record of the relocation work in the Utility Section of the Project Site Activity (PSA) Report or on the Utility Inspection Report Form D-4298. Inspection information includes location references where the work took place and a confirmation that construction was in accordance with the approved locations. The inspection report also documents items such as major installation items (e.g., poles, length of pipe, and length of cable), equipment used, and number of workers. The frequency of inspection should be determined by the type of utility facility involved, the magnitude and location of the utility relocation work, and the quality of previous work and billing accuracy of the specific utility involved.
After completing the relocation work, utility owners must submit a certification of completion, certifying that all work has been accomplished in accordance with the plans, permits, estimates, materials, and other applicable data approved by PennDOT. Both the utility owner and PennDOT sign the certification of completion.
South Carolina
SCDOT requires utility owners to submit as-built plans within 60 days after completing the permitted work (84). As-built plans for directional drilling installations must include the following information:
- Actual path alignment.
- Utility facility geometry.
- Latitude and longitude data as well as elevations at each end.
- Rate of grade.
- Carrier pipe diameter.
- Casing pipe diameter.
- Depth of cover for the casing/carrier pipe
- Bore hole diameter.
- Actual viscosity, density, and composition of the drilling fluid.
- Actual fluid pumping capacity.
- Pressure and flow rates.
- Carrier pipe field pressure test results.
Texas
TxDOT now has a rule that requires utility owners to submit as-built plans or certified as-installed construction plans after completing the relocation of a utility facility or the installation of a new utility facility within the right-of-way (85). As-built plans or certified as-installed construction plans must include the horizontal alignment and vertical elevations of the utility
facility using TxDOT’s horizontal and vertical datums, the relationship to existing highway facilities and the right-of-way line, and access procedures for maintenance of the utility facility. TxDOT requires as-built plans to comply with ASCE guidelines and standards.
TxDOT requires as-installed construction plans certified by a utility owner or its representative for each relocation or new installation within the right-of-way. TxDOT can also require a utility owner to submit as-installed construction plans that are certified by an independent party or final as-built plans that are signed and sealed by an engineer or registered professional land surveyor. Factors that influence this decision include:
- Amount of available right-of-way or the proposed utility facility’s proximity to TxDOT facilities and other utility facilities.
- Type of utility facility.
- Complexity of required traffic control plans.
- Need for a storm water pollution prevention plan.
- Past performance of the utility owner providing accurate location data and conformance with its construction plans.
For design surveys, TxDOT has the accuracy error allowances shown in Table 23 (86):
Table 23. Accuracy Error Allowances for Design Surveys (86).
| Description | Tolerance in cm (ft) | |
|---|---|---|
| Horizontal | Vertical | |
| Bridges and other roadway structures | 3 (0.1) | 6 (0.02) |
| Utility facilities and improvements | 6 (0.2) | 3 (0.1) |
| Cross sections and profiles | 30 (1) | 6 (0.2) |
| Bore holes | 90 (3) | 15 (0.5) |
The TxDOT Survey Manual does not include requirements for construction surveys. However, older versions of the manual did. For example, the 2011 version included a reference to the Texas Society of Professional Surveyors (TSPS) Manual of Practice for Land Surveying in the State of Texas (87, 88). The TSPS manual provides a uniform standard for professional surveying services in Texas. The standard defines the following categories of surveying services:
- Category 1A—Land title surveys.
- Category 1B—Standard land surveys.
- Category 2—Route surveys.
- Category 5—Construction surveys.
- Category 6—Topographic surveys.
- Category 7—Horizontal control surveys.
- Category 8—Vertical control surveys.
- Category 9—Investigative surveys.
- Category 10—GIS products.
- Category 11—3D control surveys.
The manual of practice includes survey tolerances for categories 1A, 1B, 2, 6, 7, 8, 9, 10, and 11. For Category 5—Construction surveys, the manual indicates that staked locations should be as accurate as practicable and necessary. The manual recognizes that accuracy depends on many project-specific factors that require professional judgment.
The North Central Council of Governments (NCTCOG) publishes and maintains public works construction standards for use by cities, counties, and special districts in North Texas (89). Several divisions and items cover construction or rehabilitation of underground facilities, mainly water lines, sanitary sewers, and storm sewers.
Utah
The Utah Department of Transportation (UDOT) has a requirement for utility owners to submit utility facility data based on survey-grade accuracy. Another requirement is to submit as-built records for each permit or relocation activity (90). UDOT keeps as-built survey data about certain utility facilities and makes it available to highway contractors upon request (91).
Vermont
The Vermont Agency of Transportation (VTrans) can require utility owners to submit as-built plans (92). Proposed plans must include the following information:
- Offset from the right-of-way line, edge of the traveled way, or both. If the offset is not uniform, the plans must show all the locations and distance changes.
- Depth at various locations (or, alternatively, show depths using typical sections).
- Depths and locations of other adjacent utility facilities.
- Location of directional bores, plowing, or trenching operations.
- Treatment of roadside vegetation, especially if the vegetation is for aesthetics or snow control.
- Replacement vegetation to replace items that were damaged or removed during utility installation.
- Location of sensitive environmental areas, such as wetlands, hazardous material sites, historical sites, or endangered species habitats.
- Type and location of erosion control measures.
- Access points to utility facility.
- Locations of permanent locked gates.
- Special provisions by other regulatory agencies.
- Traffic control plan.
Virginia
The VDOT has an inspection manual that provides guidance for inspections at pre-determined stages of completion of a highway construction project (93). The inspection manual defines inspection levels, inspection objectives, and inspector activities. Inspection levels refer to inspection frequency (continuous, intermittent, or end product). Inspection objectives refer to the expected outcome of a construction activity. Inspector activities refer to specific tasks an inspector must complete to achieve one or more inspection objectives.
The inspection manual includes inspection objectives and inspector activities for water and sanitary sewer lines, manholes, junction boxes, and ITS components. For example, inspection objectives for water and sanitary sewer lines are as follows:
- Ensure uniform foundation and proper line and grade.
- Verify pipe layout and placement of pipe bedding material and pipe.
- Ensure uniform foundation and proper line and grade.
- Ensure placement and depth of bedding material as outlined in the specification.
- Ensure the pipe is of the correct type and size.
- Ensure pipe joints are installed according to the contract.
- Ensure pipe joints and fittings are sealed to the degree needed for the type and purpose of the pipe.
- Ensure that quality water is provided to the public.
- Ensure proper compacted cover has been achieved.
- Verify backfill operations, suitability of materials, depth of layers, density, and moisture.
Inspector activities needed to meet these objectives are as follows:
- Before the contractor begins excavation:
- Verify pipe layout.
- Verify the contractor has contacted Virginia 811.
- Before placement of bedding material:
- Sketch and compute minor structure excavations, probe foundation, check line, grade, termini, and verify source of pipe bedding.
- Before installing the pipe:
- Verify the type, size, and evidence of inspection.
- Before beginning the backfill operation:
- Inspect installed pipe including line and grade, termini, length, and joint treatment.
- Check for pipe damage during placement.
- Before tie-in into the existing system:
- Verify that contractor has disinfected the water mains.
- Review the contractor report of satisfactory test results.
- Before accepting pipe:
- Check for correct joining and sealing of pipe.
- Document testing for pipe leakage.
- Before allowing construction traffic over the pipe:
- Verify proper cover over the pipe.
For design-build projects, VDOT requires the contractor to prepare as-built plans. The utility facilities depicted on the plans must be color coded according to the Underground Utility Damage Prevention Act (94). The plans must show horizontal alignments and depths of the relocated underground utility facilities.
Washington
WSDOT requires utility owners to submit as-built plans within 90 days after completing the utility facility installation (95). This requirement applies if there was an approved field change to the accommodation document. Utility owners do not have to submit as-built plans if a WSDOT inspector document the changes. WSDOT notes these changes in the original accommodation document and in the utility franchise and permit database.
West Virginia
The West Virginia Department of Transportation (WVDOT) uses several forms to track the progress of high construction projects (96). In addition to daily inspection reports and survey field books, the WVDOT construction manual includes a provision to use FHWA construction inspection reports (96, 97). The FHWA inspection forms cover a wide range of construction-related items and include a reference to whether delays are attributed to utilities and right-of-way. These forms do not address location tolerances or errors.
The daily reports enable inspectors to verify that the location, measurement, quantity, quality, and progress of work meet contract requirements. Relevant accuracy levels are as follows:
- Right-of-way and temporary fence: 3 cm (0.1 ft)
- Waterline pipe or casing: 3 cm (0.1 ft)
- Sanitary sewer pipe or casing: 3 cm (0.1 ft)
WVDOT requires contractors to submit as-built plans that include plan views, profile sheets, and cross sections. WVDOT recommends considering the following major items for preparing as-built plans:
- Horizontal and vertical alignment:
- Show changes in the alignment by recording the revised control points (i.e., points of intersection, points of curvature, and points of tangency).
- Show the revised grade, right-of-way, and/or controlled access lines.
- Collect sufficient data to re-establish the centerline, right-of-way line, and grade line at any location.
- Show equations in stationing due to line revisions.
- Excavation:
- Show revised original cross sections, revised grades, and slopes with pay lines.
- Drainage structures:
- Show any change in location, length, flow line, type, or size.
- Bases and pavement:
- Show any changes in type or dimensions, with typical cross sections showing the area affected.
- Bridges:
- Show any change to bridge elements.
Wisconsin
The Wisconsin Department of Transportation (WisDOT) require utility owners to submit X-Y-Z as-built coordinate data for all open cut or trenched utility work, as well as other situations in which a utility facility is exposed to facilitate a survey (98). Specific data collection requirements include the following:
- Collect data every 50 feet and all angle points or direction changes along the utility facility centerline.
- Survey the top-center of each utility facility.
- For multiple facilities (e.g., duct banks), measure the total outside-to-outside width. Facility depths may be determined using permit information.
WisDOT recommends using RTK surveys. In areas with urban canyons or heavily wooded areas, WisDOT recommends using longer observation times, surveying more data points along a line, performing multiple or redundant measurements and averaging the results, or using established benchmarks that have published X-Y-Z data.
WisDOT requires using boring logs if they can be used to produce X-Y-Z data.
WisDOT requires utility owners to submit as-built plans using the Wisconsin Coordinate Reference System (WISCRS). In WISCRS, grid and ground coordinates are the same value, making it unnecessary to convert from grid to ground values using a combination factor. (Note: Combination factors were needed when WisDOT mapped projects using state plane coordinates).
CONSTRUCTION AND UTILITY INSPECTION PRACTICES
Historically, conducting complete, accurate, and reliable construction and utility inspections at DOTs has been challenging. Inspectors usually have a heavy workload that, in practice, makes it extremely difficult for them to be at all the job sites where inspections need to take place. In situations that involve excavation (e.g., for the installation of an underground facility such as a pipeline and subsequent backfill), a common occurrence is for contractors to finish the backfilling operation, but by the time the inspector shows up, the only way to verify the underground installation would be to re-excavate and remove the backfill to expose the facility that needs to be inspected. In practice, asking the contractor to do this rarely happens. Furthermore, it is unusual for inspectors to have access or training to use surveying equipment to verify locations in the field.
What follows is a summary of technologies and procedures that have been documented in the literature, which have been used or have potential to make the utility inspection work more effective.
Markers and Radio Frequency Identification
For decades, a widespread practice has been to use markers of various types to facilitate the identification and location of underground utility facilities. Table 24 shows a summary of commonly used markers (29).
Table 24. Commonly Used Utility Facility Markers (29).
| Marker Type | Description |
|---|---|
| Surface-to-structure marker | A marker (usually a 5-cm [2-inch] polyvinyl chloride [PVC] pipe) is embedded in the soil from the ground surface down to the utility facility. |
| Utility sign or pipeline marker | An aboveground sign or maker is placed near a utility facility (e.g., a high-pressure gas line, major water pipeline, or fiber optic line). |
| Continuous buried marker | Tracer tapes and wires are placed in the backfill, typically above newly constructed nonmetallic water and gas lines. |
| Parker-Kalon (PK) nail or survey marker | PK nails, surveying hubs, and surveying lathes are placed directly over a utility facility after excavating a test hole. |
| Single point buried marker | Small magnets are placed in the roadway material directly over a utility facility after it was exposed. |
In 2015, FHWA completed a research project that documented the feasibility of managing utility facilities within the highway right-of-way in a 3D environment (99). One of the tasks included a review of the use of radio frequency identification (RFID) technology to mark and manage underground utility installations.
RFID systems can be passive or active. RFID tags in passive systems do not have an internal power supply and store tiny amounts of data (typically tag ID and limited, pre-recorded attribute data). Range is limited. RFID tags in active systems have their own internal power source, which extends the range considerably. Active tags can store more information than passive tags but tend to be bigger and more expensive.
VDOT uses RFIDs to reduce the level of uncertainty with respect to newly installed utility facilities and, more specifically, as a damage prevention strategy. VDOT’s policy is to install RFID markers at the following locations:
- Every 8 m (25 ft) along straight utility facility alignments.
- At (significant) horizontal and vertical changes in direction.
- At critical utility crossings, tees, and service connections.
- On specific facilities that are important to the utility owner.
- On out-of-service facilities when they are encountered or uncovered in the field.
VDOT officials read the coordinates of each tag using a GNSS receiver as the tags are deployed in the field. VDOT also generates as-built polylines showing utility alignments and prepares clickable PDF files that users can query. VDOT makes these files available to utility owners throughout the construction phase so that they can update their records accordingly. Benefits of the RFID implementation at VDOT include the following:
- Availability of georeferenced utility segment information that enables the establishment of protection zones to avoid utility damages. Another benefit is the availability of as-built information that highway contractors can use for test hole or test pit planning purposes. VDOT has also been able to catalog many cases of mismarks between One-Call locates and RFID marker-derived locations.
- Improvement in the horizontal and vertical accuracy of utility facility information.
- Linkages between attribute data associated with each RFID marker with georeferenced coordinates for mapping and locating purposes.
- Production and conveyance of reliable, as-built utility information to utility owners, locators, excavators, and design engineers.
- Improved effectiveness of utility inspections by helping inspectors to verify that actual utility locations on the ground are consistent with design documentation.
- Improved coordination with other VDOT officials, including construction inspectors, for any UR issues that might arise during construction.
- No conflict with One-Call laws or regulations.
- Installation of RFID markers in proximity to existing gas markers without interference.
- Reduction in the risk of confusion between active line and out-of-service lines.
Utility Data Available During Construction
The current practice for designing projects involves the use of CAD software that relies primarily on vector graphics (which use primitives such as points, lines, and curves, as well as shapes or polygons) as opposed to raster images (i.e., based on pixels). Most highway projects are designed using 2D representations of the project by using plan views, cross sections, and profiles. Increasingly, DOTs are using 3D modeling techniques to visualize, design, and construct projects (99). BIM has emerged as an evolution of 3D modeling, where facility components are modeled as individual objects that have geometry, attributes, and relationships. BIM is now standard for vertical construction applications. In recent years, interest has increased in the use of BIM for horizontal construction projects (100).
Ideally, utility facility data should be depicted and used the same way as other data layers in highway design files. In practice, utility facility data vary in source, detail, accuracy, and collection timeframe, making it difficult to depict the data correctly and reliably. Typical examples that reflect current practices include the following:
- Utility facility symbology (including, but not limited to, line weights, colors, symbols, legends, and notes) differs widely from project to project and even within the same project.
- Utility lines and features are shown on utility maps right after collecting the data but are not necessarily shown or referenced on all relevant project design files. It is common to lose quality levels and/or notes as the layers showing utility facility data progress through the design phase. At some point, all that remains is a set of lines but without any context to help designers and contractors understand the significance and reliability of the linework.
- Utility lines and features are frequently not included in PS&E files or bid packages, even if utility statements or certifications in these assemblies list utility relocations that are still pending.
- Design plans, PS&E packages, or bid packages do not consistently show utility conflict data. Utility conflict locations are also not consistently shown on documents that are exchanged with various stakeholders during utility coordination. Utility installations that are relocated before or during the construction phase (and associated attribute data) do
- not appear on construction plans, or changes to the operational status of previously documented existing installations are not updated.
Unmanned Aircraft Systems
Examples of UAS applications that have been mentioned recently include (101):
- Structures: Bridge inspections, high mast lighting inspections, retaining wall inspections, and tunnel inspections.
- Operations and safety: Site monitoring, emergency response and incident management including crash reconstructions, search and rescue, route management, mud slide assessments, and snow avalanche management.
- Construction: Estimates and bidding, topographic surveys and elevations, construction monitoring, inspections and quality control, land surveying, break-line surveys, quantities, surface validations, work zone traffic monitoring, and as-builts.
- Maintenance: Roadside condition assessment, pavement inspections, vegetation management, overhead sign inspections, rockfall hazard mapping, and slope failures.
- Planning and design: Vehicle counting, traffic volumes, site analysis, land surveys, geotechnical investigations, and environmental assessments.
- Utilities: Utility investigations, utility design verifications, utility relocation monitoring, utility inspections, and utility as-builts.
UASs equipped with miniaturized cameras enable the collection of high resolution, 3D geospatial data at lower costs than traditional techniques. New technologies also make it possible to gather pictures and video using smartphones, which can be fed to structure-from-motion (SfM)/multi-view stereo (MVS) (or SfM for short) photogrammetry software to develop highly accurate 3D products. Operating UASs requires trained pilots and observers, but smartphones do not. Anyone with a smartphone and the correct app would be able to capture data in the field, which could be used to support the inspection process.
A variety of flight designs may be possible depending on the purpose and size of the UAS data collection activity. A flight design includes the trajectory the UAS will follow, endlap and sidelap requirements, and whether the operation of the aircraft will be autonomous or manual (101).
According to 14 Code of Federal Regulations (CFR) 107, a small unmanned aircraft is an unmanned aircraft that weighs less than 25 kg (55 lb) on takeoff, inclusive of everything that is onboard or attached to the aircraft (102). Most UASs that are used for highway applications are small UASs that weigh substantially less than 25 kg (55 lb), including payload.
The Federal Aviation Administration (FAA) requires pilots to register UASs. FAA also issues a certificate of registration that must be carried with the UAS whenever the UAS is being used. Under 14 CFR 107 rules, the UAS pilot, or remote pilot in command, must obtain a remote pilot certificate from FAA. The certificate is valid for 2 years and must be available during all UAS operations. Part 107 imposes several additional limitations on UAS operations (102).
Structure-from-Motion Photogrammetry
Several commercial and open-source SfM software suites are available for processing UAS imagery to derive mapping products. The typical SfM image processing workflow is as follows (101):
- Stage 1 (Keypoint Extraction and Matching)—Image sequences are input into the software and a keypoint detection algorithm is used to automatically extract features and find keypoint correspondences between overlapping images using a keypoint descriptor.
- Stage 2 (Bundle Adjustment and Sparse Point Cloud Creation)—A least squares iterative bundle adjustment is performed to minimize the errors in the keypoint correspondences. The matching points are verified, and their 3D coordinates simultaneously calculated to generate a sparse point cloud. To further constrain the problem and develop a georectified point cloud, camera geolocations from an onboard GNSS receiver and GCPs (if available) are introduced to constrain the solution.
- Stage 3 (3D Point Cloud Densification)—Finally, parameters for each image are used as input into an MVS algorithm to densify the point cloud by projecting every pixel at the full image scale or projecting pixels at a reduced image scale.
The basic output of the UAS-SfM image processing workflow is a densified set of X-Y-Z coordinates of the imaged scene. This set, called a point cloud, is typically colorized by the red, green, and blue (RGB) pixel values of the digital camera. UAS-SfM point clouds can have high point density (easily exceeding 1,000 points/m2) due to the high camera resolutions and typical low altitudes at which data are collected. The 3D point cloud can then be used to generate a digital surface model (DSM) of the terrain, which can then be used to orthorectify the images and produce an orthomosaic image or a 3D textured mesh. Output for these derivative mapping products is commonly performed by commercial SfM software.
As an illustration, Figure 7 shows a sample image of a 3D textured mesh resulting from a densified 3D point cloud. The 3D textured mesh is a surface composed by triangles (i.e., a triangulated irregular network), whose vertices are defined so as to minimize the distance between points of the 3D point cloud and the surface. It is worth noting that the image shown in Figure 7 is not a picture taken by the UAS. The 3D textured mesh is a true 3D model that enables the user to complete tasks such as reading X-Y-Z coordinates of any point, measuring 3D distances between any two points, and calculating volumes. For example, it would be possible to read the bottom and top X-Y-Z coordinates of the traffic sign; measure the width, length, and height of the vehicle; and calculate the approximate volume of the 3D surface that represents the vehicle with respect to the pavement.
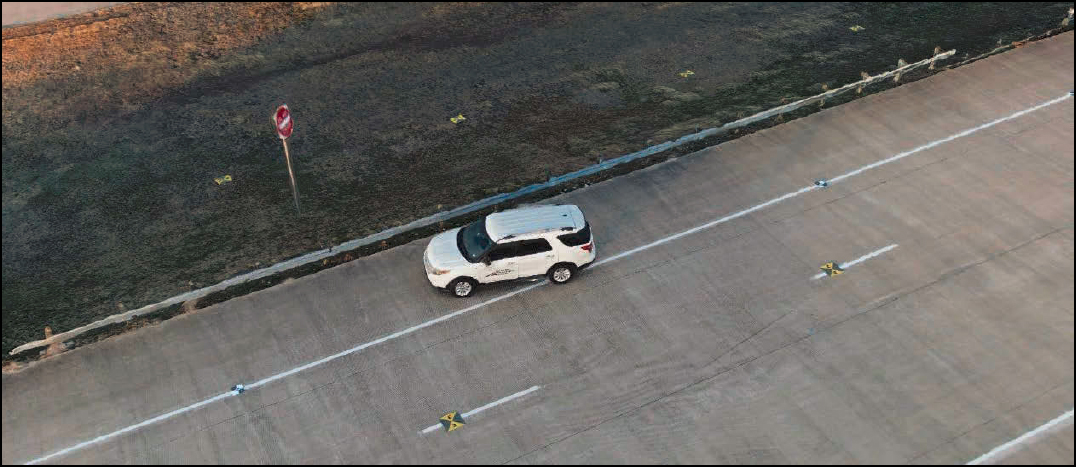
Courtesy of the Texas A&M Transportation Institute.
Smartphones and SfM Processing
Recent advances in SfM photogrammetry software now make it possible to feed pictures and video gathered using smartphones to SfM software to develop highly accurate 3D products. The basic process involves walking along or around the area of interest, taking pictures and/or video with the smartphone, running these files through a software component to generate pictures with positional and orientation data, and then running these pictures through the SfM software. The result is a 3D model that is ready for measurement and inspection. As an illustration, Figure 8 shows the 3D model of a hydrant and other adjacent utility facilities. Once the 3D model is produced, it is possible to conduct measurements, including the extraction of X-Y-Z coordinates associated with features of interest.
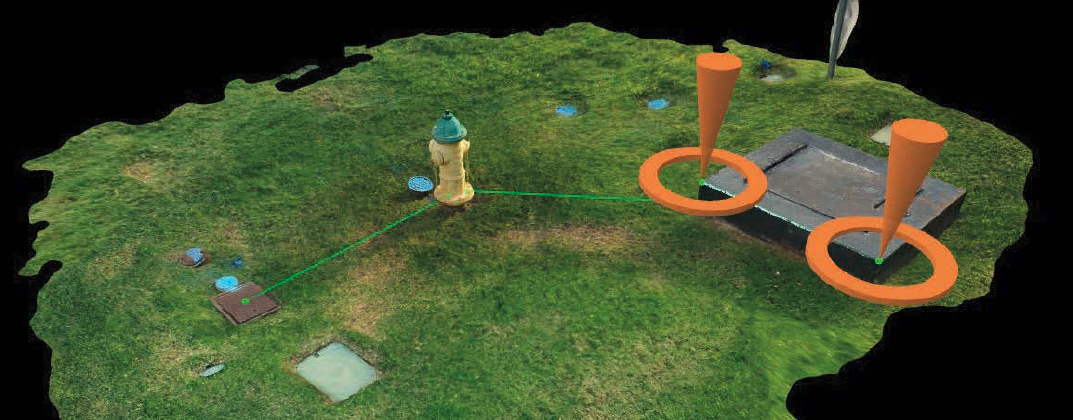
Courtesy of the Texas A&M Transportation Institute.
Light Detection and Ranging (LiDAR)
LiDAR is widely used at DOTs, primarily for surveying applications, but not for construction or utility inspections. However, proliferation of small LiDAR sensors in recent years has opened the door for a wide range of uses. Small LiDAR sensors are now mounted on small UASs and are also included as a feature in some smartphones and tablets.
Compared with traditional airborne LiDAR mapping, UAS platforms offer more flexibility in terms of flight design and data collection, higher scan density due to lower flight altitudes, rapid response capabilities, and reduced costs at localized geographic scales.
Raw LiDAR data consist of a 3D point cloud of the ground and land cover with intensity information typically provided. LiDAR intensity is a measure of the return signal strength of the laser pulse energy for each point that can also be used for object detection. A UAS-LiDAR point cloud, relative to a UAS-SfM point cloud generated from the camera detector array, is irregularly distributed (with varying levels of point density) due to the scan pattern, flight pattern, and swath overlap. UAS-LiDAR point densities can exceed several hundreds of points per square meter, i.e., much denser than traditional airborne LiDAR (103).
New Relevant Research Projects
Several initiatives are starting at the federal and state levels, which are relevant to this research. For example, NCHRP recently started NCHRP 15-81, Guideline for Depicting Existing and Proposed Utility Facilities in Design Plans (104). The main objective of the research is to develop approaches to depict existing, proposed, and relocated utility facilities; prioritize the depiction of data from multiple sources; reconcile inconsistent utility facility data from various sources; and determine reliability of depicted data for design standards.
Recently, NCHRP also started NCHRP 10-112, Guidelines for Digital Technologies and Systems for Remote Construction Inspection for Highway Infrastructure Projects (105). The rationale for the research is that using mobile devices and modern surveying equipment for construction inspection has been beneficial, and that remote virtual inspection (RVI) offers numerous benefits that support onsite construction inspection activities and enable the collection of digital data for several applications such as estimation of quantities, verification and acceptance, payment, and development of as-built records. The research will cover aspects of highway construction that can benefit from the use of RVI and will identify relevant technologies and systems (e.g., AI, LiDAR, UASs, augmented reality, and virtual reality).


