Tackling the Road Safety Crisis: Saving Lives Through Research and Action (2024)
Chapter: 2 U.S. Road Safety: Crisis, Context, and Culture
2
U.S. Road Safety: Crisis, Context, and Culture
INTRODUCTION
The United States is in the midst of a road safety crisis. The monetary cost to society of 42,795 motor vehicle fatalities in 2022 was approximately $1.9 trillion, including $465 billion in economic cost and $1.4 trillion in quality-of-life costs.1 Importantly, the risks of motor vehicle fatalities are unevenly distributed across our population, raising equity issues. Studies have shown that the risk of traffic death is systematically higher for Black and Hispanic communities.2 A negative correlation has been found between road fatality rates and income—wealthier people face lower risks.3 And while only 20% of the U.S. population resides in rural areas, 40% of traffic fatalities occur outside cities.4
___________________
1 NHTSA. 2023, April. “Traffic Safety Facts.” https://crashstats.nhtsa.dot.gov/Api/Public/ViewPublication/813428. This valuation was made by analyzing NHTSA’s crash cost methodology, where direct economic losses are combined with long-term quality-of-life opportunity costs. For some information, see TRIP. 2023, June. “Addressing America’s Traffic Safety Crisis: Examining the Causes of Increasing U.S. Traffic Fatalities and Identifying Solutions to Improve Road User Safety.” https://tripnet.org/wp-content/uploads/2023/06/TRIP_Addressing_Americas_Traffic_Safety_Crisis_Report_June_2023.pdf.
2 Raifman, M.A., and E.F. Choma. 2022. “Disparities in Activity and Traffic Fatalities by Race/Ethnicity.” American Journal of Preventive Medicine 63(2):160−167.
3 Glassbrenner, D., G. Herbert, L. Reish, C. Webb, and T. Lindsey. 2022, September. “Evaluating Disparities in Traffic Fatalities by Race, Ethnicity, and Income.” National Center for Statistics and Analysis, NHTSA. DOT HS 813 188.
4 “Rural/Urban Comparison of Motor Vehicle Traffic Fatalities.” 2024, May (revised). Traffic Safety Facts. NHTSA. DOT HS 813 488.
Eliminating a substantial number of traffic fatalities and serious injuries would bring significant, multidimensional benefits to the nation, and could bring important benefits to vulnerable populations. The scale of the costs of motor vehicle crashes could also be used to justify substantial investments, including research, in safety interventions and crash countermeasures.
This chapter describes the U.S. road safety crisis in contrast to improvements in road safety in other high-income countries. It examines the approaches to road safety used by peer countries and develops the importance of understanding how the American context differs. Factors such as geography and the history of urbanization as well as political and social factors can affect a society’s propensity to implement safety interventions and crash countermeasures and their effectiveness in the field. A sidebar covers these cultural forces for the case of automated traffic enforcement. The chapter closes with an introduction to the Safe System Approach (SSA) (see the sidebar “The Safe System Approach”) and how it differs from traditional approaches to traffic safety.
U.S. ROAD SAFETY IN THE INTERNATIONAL CONTEXT
Worldwide trends among high-income nations in Europe, as well as Australia, Canada, and Japan, demonstrate very different outcomes compared with the United States, where the motor vehicle deaths and rates per 100,000 population are as much as four times higher than in comparable nations (see Figure 2-1). Fatality reductions over the past two decades in some nations have been impressively large. For example, Sweden, which made a national commitment to drive the road traffic death rate to zero by 2050, has seen a 65% reduction in road traffic fatalities in the past 18 years.5
Normalized by the annual amount of vehicle travel, the U.S. fatality rate is still between 1.6 and 4.6 times higher than the set of comparable countries—Australia, Canada, France, Germany, Japan, the Netherlands, Norway, Sweden, and the United Kingdom (see Figure 2-2).
INTERNATIONAL APPROACHES TO ROAD SAFETY
The widening safety gap between the United States and other high-income nations was the subject of a previous TRB consensus study, 2011’s Achieving Traffic Safety Goals in the United States Lessons from Other Nations. This study examined actions and programs in several high-income nations. The study identified specific crash interventions known to be effective and
___________________
5 Trafikverket. “Origin and Background Vision Zero.” Text. Trafikverket. trafikverket@trafikverket.se. Accessed March 13, 2024. https://bransch.trafikverket.se/en/startpage/operations/Operations-road/vision-zero-academy/Background-Vision-Zero.

SOURCE: Data from OECD/ITF Annual Road Safety Reports. https://www.itf-oecd.org/node/28195.

SOURCE: Data from OECD/ITF Annual Road Safety Reports. https://www.itf-oecd.org/node/28195.
found that the other high-income nations more consistently and aggressively deployed them, with favorable results. The study also examined the management of road safety in the benchmark nations and identified the attributes of successful programs.6 Highlights from this report are shown in Box 2-1. Updating for today, some of the most effective crash countermeasures—those in Box 2-1 and others—are more commonly and successfully deployed in other high-income countries than in the United States.7
___________________
6 TRB. 2011. Achieving Traffic Safety Goals in the United States Lessons from Other Nations. TRB Special Report 300.
7 For example, European road safety experts presented to the committee on January 17, 2023; Australian road safety experts presented on February 7, 2023, and Canadian road safety experts presented on April 5, 2023. A full list of presenters is available in the Acknowledgments section of the report.
BOX 2-1
Attributes of Successful Road Safety Programs in Other High-Income Nations
Systematic Use of Proven Crash Countermeasures
A range of interventions are being employed to regulate driver behavior, ensure efficient emergency response and provide safe design and maintenance of roads. These interventions were usually intensively applied. Crash countermeasures include zero tolerance standards and enforcement for driving under the influence of alcohol (Sweden); automated enforcement of speed limits and traffic signals with fines used for road safety research and implementation (Sweden, Australia); extensive use of roundabouts; and traffic calming infrastructure designs to protect vulnerable populations.
Management and Planning
Transportation, public safety, and public health administrators systematically measure progress toward quantitative objectives, direct resources to the most cost-effective uses, and communicate with the public and with elected officials to maintain their support.
Political Support and Leadership
Elected officials are committed to road safety and ensure that necessary resources are provided. Administrators are held accountable for the results of safety initiatives, and system users are held accountable for compliance with laws.
SOURCE: TRB. 2011. Achieving Traffic Safety Goals in the United States Lessons from Other Nations. TRB Special Report 300. P. 213.
Of course, the United States is different from these countries in multiple ways. To a greater extent, U.S. urban development happened post-automobile and such post-automobile development patterns tend to be less dense. People living in most of the United States rely on the automobile as the principal means of mobility.8 These factors have led to post-automobile urban designs that are less pedestrian-friendly than what is common to European nations. However, Australia and Canada were also developed more recently than the European nations, and their standards of living and auto dependency are comparable to the United States. Nevertheless, the
___________________
8 Sauber-Schatz, E.K. 2016. “Vital Signs: Motor Vehicle Injury Prevention—United States and 19 Comparison Countries.” Morbidity and Mortality Weekly Report 65. https://doi.org/10.15585/mmwr.mm6526e1.
United States has 1.5 to 2 times as many road fatalities per billion vehicle kilometers and 2 to 3 times as many annual fatalities per 100,000 people.9 Furthermore, European cities are catching up in terms of auto ownership and use, but they are still exceeding the United States in improving motor vehicle safety outcomes.
AUTOMOBILITY AND THE SAFETY OF ALL ROAD USERS
The dominance of the automobile as the principle means of mobility in the United States is overwhelming. At the national scale, less than 4% of the vehicle trips in the United States are made by public transit, and that number is declining.10 That the United States has become an auto dominated nation is well documented in historical studies.11 The exceptions are a few of the largest cities, and in each of them motor vehicle use is substantial as reflected in high levels of road congestion.
The dominance of the automobile has led transportation planning and decision-making to prioritize roadway capacity and reducing travel time through concepts such as “level of service.” Road safety is described as a priority—virtually every road agency states that safety is its most important goal—but expenditure patterns, organization charts, and decisions about deploying highly effective countermeasures do not consistently reflect this.12
Federal and state governments have a history of considering safety largely from the perspective of drivers and passengers.13 Accommodations for people walking or biking have too often been overlooked, leaving more vulnerable road users at the mercy of motor vehicles.14 The prioritization of mobility and safety for motorists over the safety of other road users is
___________________
9 Yellman, M.A. 2022. “Motor Vehicle Crash Deaths—United States and 28 Other High-Income Countries, 2015 and 2019.” Morbidity and Mortality Weekly Report 71. https://doi.org/10.15585/mmwr.mm7126a1.
10 National Household Travel Survey. 2022. “Explore Person Trip Data.” https://nhts.ornl.gov/person-trips.
11 Wells, C.W. 2012. Car Country: An Environmental History. Seattle: University of Washington Press.
12 Presentation by Safety Staff to committee, November 3, 2022.
13 FHWA. “Road Safety Fundamentals Unit 1: Foundations of Road Safety.” Accessed May 8, 2024. https://highways.dot.gov/safety/learn-safety/road-safety-fundamentals-html-version/unit-1-foundations-road-safety.
14 For example, only recently have cities recognized the importance of assigning intersection priority to vulnerable road users and public transit in the form of Leading Pedestrian Indicators, which was added to FHWA’s proven countermeasures list in 2017. See FHWA. “Memorandum: Promoting and Implementing the Updated Proven Safety Countermeasures—2017.” Accessed May 8, 2024. https://highways.dot.gov/safety/proven-safety-countermeasures/memorandum-promoting-and-implementing-updated-proven-safety.
reflected in design and operations guidance, professional education, and the staffing and structure of state and local transportation agencies.
More recently, concern for the safety of all road users has been growing within transportation agencies. The direction of road management is changing, albeit slowly because of the challenge of adapting a well-developed institutional framework and associated professional practices. For example, there is a trend toward balancing the needs of motorists and communities. This is exemplified by the growing number of community design guidelines arising from state DOTs,15 cities,16 and transportation associations such as the National Association of City Transportation Officials (NACTO).17 In addition, FHWA is promoting the Complete Streets concept (described in Chapter 4), and some states are adjusting their priorities. For example, the Connecticut DOT recently implemented new Complete Streets design criteria to be incorporated into all projects.18 In Ohio, local jurisdictions can apply Ohio DOT’s Multimodal Design Guide and its new guidance for implementing pedestrian and bicycle facilities on their local and regional transportation networks.19
FEDERALISM AND ROAD SAFETY
A key difference between U.S. road safety management and that in other high-income countries is that infrastructure, behavioral, and policy actions to improve road safety in those nations are primarily the responsibility of national governments, which make and implement decisions.20 In the United States, these decisions are in the hands of state and local governments, which own and operate the road network. Some jurisdictions are preempted by state law from implementing policies. While the
___________________
15 For example, Ohio DOT Multimodal Streets Design Manual. Ohio DOT, Multimodal Design Guide. Accessed April 29, 2024. https://www.transportation.ohio.gov/working/engineering/roadway/manuals-standards/multimodal.
16 For example, Atlanta’s Multimodal Design Guide: “Streets Atlanta: A Design Manual for Multimodal Streets.” City of Atlanta Department of City Planning. 2018. https://www.atlantaga.gov/home/showdocument?id=55790&t=637907955482168122.
17 NACTO. “NACTO Design Guidance.” Accessed May 7, 2024. https://nacto.org/program/design-guidance.
18 Connecticut DOT. “CTDOT Announces New Complete Streets Design Criteria to Improve Roadway Safety and Enhance Mobility.” Press release. August 24, 2023. https://portal.ct.gov/DOT/CTDOT-Press-Releases/2023/CTDOT-Announces-New-Complete-Streets-Design-Criteria-to-Improve-Roadway-Safety-and-Enhance-Mobility.
19 Ohio DOT. Multimodal Design Guide. Accessed April 29, 2024. https://www.transportation.ohio.gov/working/engineering/roadway/manuals-standards/multimodal.
20 For example, in Norway, which has one of the safest road networks, nearly all the organizations responsible for road safety are at the national level. “Norway Road Safety Country Overview.” European Road Safety Observatory. 2017. https://road-safety.transport.ec.europa.eu/system/files/2021-07/erso-country-overview-2017-norway_en.pdf.
U.S. Department of Transportation (U.S. DOT), including modal agencies such as FHWA and NHTSA adopt policies on road safety—for example, the National Roadway Safety Strategy,21 a commitment to Zero Deaths, and the SSA22—adoption and implementation of specific safety policies, goals, and crash countermeasures happen at the state and local levels. The federal government does not own or operate the vast majority of the road network—even the Interstate Highway System. However, there are federal roads on federal lands. In countries with better road safety records, control of the road networks (in some cases, even policing) is in the hands of the national government, making it easier—indeed, making it possible—to take nation-wide actions.
The priorities and policies for road safety investments differ among the states, driven by their land use patterns and the values and politics of their residents. State crash outcomes also differ. For example, deaths per capita in Mississippi are around 5 times higher than in Rhode Island (see Figure 2-3).
Thus, while U.S. DOT, notably FHWA and NHTSA, can adopt a nominal national goal of zero roadway deaths, there can be a disconnect between federal goal setting and state and local implementation. Without the responsibility to deploy safety programs and crash countermeasures, the federal government is limited in its ability to ensure that a national road safety program will yield the intended results. This limitation also clouds the justification for allocating resources for both road safety research and crash countermeasure investments because it is not possible to predict the outcomes of federal investments with reasonable certainty. Widely varying levels of effectiveness in road safety by state are illustrated in Figure 2-3.
Federal agencies can incentivize certain state actions, but only if the Congress authorizes them to do so and provides the necessary resources. Securing that capacity requires policy consensus among legislators. Members of Congress are attuned to the interests of their constituents when making such decisions, and those interests vary among districts and states. Federally imposed sanctions for failing to follow a national road safety directive could include withholding federal aid, but such an action could have political repercussions that work against such a directive.23
That the power to manage the road network—and to set safety policies—resides in the states is not a complete explanation for the road safety
___________________
21 U.S. DOT. “National Roadway Safety Strategy.” Accessed March 13, 2024. https://www.transportation.gov/NRSS.
22 FHWA. “The Safe System Approach.” Accessed March 26, 2024. https://safety.fhwa.dot.gov/zerodeaths/docs/FHWA_SafeSystem_Brochure_V9_508_200717.pdf.
23 In 1967, the federal government required states to enact universal motorcycle helmet laws to qualify for certain highway safety funds. By 1975, all but three had complied. In 1976, Congress revoked federal authority to assess penalties for noncompliance, and states began to weaken helmet laws to apply only to young or novice riders.

SOURCE: IIHS-HLDI crash testing and highway safety. “Fatality Facts 2021: State by State.” Accessed May 2, 2024. https://www.iihs.org/topics/fatality-statistics/detail/state-by-state.
crisis in the United States. Australia bests the United States in preventing roadway deaths, but it is a federation of six independent states. Canada, which has 10 independent provinces, offers a similar counter example. Still, in the United States, the states have sovereignty to act in accordance with the preferences of their citizens. Thus, the federal government cannot address the road safety problem in an impactful way without the support of state and local governments.
SOCIAL AND POLITICAL FACTORS
Social, cultural, and political factors are important safety considerations because they affect the likelihood that safety interventions, particularly those directed at changing behaviors, will be embraced or rejected by the public and their decision. Social, cultural and political values vary across nations and U.S. states and regions. Therefore, crash countermeasures will differ in their political feasibility, including in the level of committed leadership and support from agency staff and advocacy organizations.
Large-scale, cross-national surveys provide evidence that certain cultural traits are correlated both fatality rates and attitudes toward behavioral safety interventions. Using data from the European Survey of Road Users’ Safety Attitudes (ESRA),24 one study found that, of six cultural values, “individualism”—defined as independent free-thinking—proved to be positively correlated with both lower fatal crash rates and increased resistance to additional behavioral interventions such as intelligent in-vehicle speed assistance and zero tolerance for blood alcohol content.25 This study also found that, across multiple nations, the opinions of respondents who admitted violating speeding and alcohol consumption limits were strongly correlated with opposition to aggressive enforcement of those regulations.
Social science research can help develop a deeper understanding of the nature of support or opposition to proposed safety interventions. A survey-based study in 10 countries, including U.S. data from California and Texas, that examined opposition to new and likely controversial safety interventions found that levels of support and arguments used in opposition varied by region. Californians opposed the new measures more than Texans, with California ranking in the bottom quartile of support for 6 of 10 countermeasures, while Texas ranked in the bottom quartile for 4 measures and
___________________
24 See https://www.esranet.eu/en/about-the-project/esra2 (accessed June 21, 2024).
25 Van den Berghe, W., M. Schachner, V. Sgarra, and N. Christie. 2020. “The Association Between National Culture, Road Safety Performance, and Support for Policy Measures.” IATSS Research 44:197–211.
the top quartile for 1 measure.26 Of the 10 arguments against the proposed interventions, “difficult to implement” was most frequently cited across the included nations. Although “limit people’s individual freedom or privacy” was used in similar amounts in opposition to the proposed interventions across the nations, responses from California and Texas stood out for more frequently arguing that the measures were an “unjustifiable state intervention.” Such research, developed for specific places and proposed safety interventions, can help prioritize countermeasures and design educational and advocacy campaigns.
In the United States, the implementation of behavioral crash countermeasures can be met with concerted opposition, sometimes by the legislators who view their role as to reflect the values of their constituents who may not prioritize safety. For example, 12 states now prohibit use of either automated red light or speed cameras, enforcement tools proven to be highly effective and widely used in nations with better road safety outcomes (see the sidebar “Automated Traffic Enforcement: Hitting a Cultural Barrier). Yet, evidence from U.S. survey research indicates that public response to some behavioral safety interventions can be more favorable than those of policy makers.27,28
The committee found multiple examples where local efforts to reduce speed limits in appropriate settings were blocked by state policies preventing the use of low-speed limits on state and county roads regardless of their context.29 Resistance to crash countermeasures also appears at the neighborhood level, where residents or business owners oppose traffic calming measures like chicanes and pedestrian accommodations because they reduce street parking and restrict vehicle turning movements.
___________________
26 Van den Berghe, W., and N. Christie. 2022. “International and Intercultural Differences in Arguments Used Against Road Safety Policy Measures.” IATSS Research 46:46–62. The 12 regions were Argentina, Austria, California, China, Flanders, Greater London, Greece, Nigeria, Sweden, Texas, Wallonia, and the west of France.
27 Fell, J. 2019. “Underutilized Strategies in Traffic Safety: Results of a Nationally Representative Survey, Traffic Injury Prevention 20(Suppl 2):S57–S62.
28 Munnich, Jr., L.W., and J.D. Loveland. 2011. “Do Americans Oppose Controversial Evidence-Based Road Safety Policies?” Transportation Research Record 2213, Transportation Research Board of the National Academies, Washington, DC, pp. 9–12. https://doi.org/10.3141/2213-02.
29 In Texas for example, the state DOT’s speed limit commission has authority to override local ordinances, even for highways within their jurisdiction: “Texas Administrative Code.” Accessed May 2, 2024. https://texreg.sos.state.tx.us/public/readtac$ext.TacPage?sl=R&app=9&p_dir=&p_rloc=&p_tloc=&p_ploc=&pg=1&p_tac=&ti=43&pt=1&ch=25&rl=21. Representatives of firefighters have also campaigned against crash countermeasures such as road diets and bike lanes. See, for example: Zahniser, D., and R. Uranga. “Firefighters Launch Campaign Against Measure HLA, saying ‘Road Diets’ Threaten Safety.” Los Angeles Times. February 14, 2024. https://www.latimes.com/california/story/2024-02-14/firefighters-launch-campaign-against-measure-hla.
SIDEBAR
Automated Traffic Enforcement: Hitting a Culture Barrier
An Effective Countermeasure Not Fully Implemented in the United States
Automated enforcement may offer a way to defuse conflicts that can occur in traffic stops. There is statistical evidence demonstrating that police disproportionately stop, cite, and search the vehicles of Black and Hispanic drivers in traffic enforcement.a,b Although the reasons associated with disparate enforcement statistics have not been adequately explained through research, in some cases, traffic stops for minor violations, including equipment violations, are made for general law enforcement processes: the traffic stop is made primarily for investigation rather than for matters of traffic safety. This conflating of purposes of stops may be effective from a policing perspective, but the resulting pattern of traffic stops raises concern about bias and can lead to community and political resistance to traffic law enforcement itself. Automated enforcement has the potential to deflect concerns about equity in enforcement, particularly as it relates to race and ethnicity. A well-placed camera enforcement system would document violations, without regard for the demographic characteristics of the driver.
Traffic law enforcement is still considered a priority by most law enforcement agencies. However, the number of citations issued for all types of traffic violations has decreased, largely due to competing priorities, staffing shortages, and budgetary constraints.c Automated Traffic Enforcement represents an important crash countermeasure that has been shown to be an effective way to gain driver compliance with safety regulations with reduced personnel.d The technology uses equipment to detect and photographically document traffic offenses like speeding and red-light running. Widely used in Europe, Australia, and other parts of the world for decades, it has been proven effective at reducing crashes, injuries, and deaths.e U.S. studies also find crash reductions, though the inconsistent research methods used have tempered consensus.f However, an evidence-based and compelling case can be made that automated enforcement improves U.S. driver behavior. Consistently, slower speeds and fewer red-light violations occur when automated enforcement is used.g
__________________
a Xu, W., M. Smart, N. Tilahun, S. Askari, Z. Dennis, H. Li, and D. Levinson. 2024. “The Racial Composition of Road Users, Traffic Citations, and Police Stops.” Proceedings of the National Academy of Sciences e2402547121. https://doi.org/10.1073/pnas.2402547121.
b Cai, W., J. Gaebler, J. Kaashoek, L. Pinals, S. Madden, and S. Goel. 2022. “Measuring Racial and Ethnic Disparities in Traffic Enforcement with Large-Scale Telematics Data.” PNAS Nexus 1:1–8.
c A trend analysis of traffic law enforcement in the United States sought to examine the trends in ticketing by partnering with nearly a dozen state and local police agencies who provided access to data and personnel interviews. See Cyr, E., R.K. Jones, J.H. Lacey, and C.H. Wiliszowski. 2001. “A Trend Analysis of Traffic Law Enforcement in the United States.” https://doi.org/10.21949/1524823.
d DeWeese, C., and Connecting Clients, LLC. 2023. “Automated Enforcement in a New Era.” GHSA. https://www.ghsa.org/sites/default/files/2023-12/Automated%20Enforcement%20in%20a%20New%20Era%2012-5-23.pdf.
e Retting, R., and S. Ferguson. 2003. “Effects of Red Light Cameras on Violations and Crashes: A Review of the International Literature.” Traffic Injury Prevention 4:17–23.
f Retting, R. 2010, November. “Two Decades of Photo Enforcement in the United States: A Brief Summary of Experience and Lessons Learned.” ITE Journal.
g Martinez, K.L., and B.E. Porter. 2006. “Characterizing Red Light Runners Following Implementation of a Photo Enforcement Program. Accident Analysis and Prevention 38:862–870; Fitzsimmons,
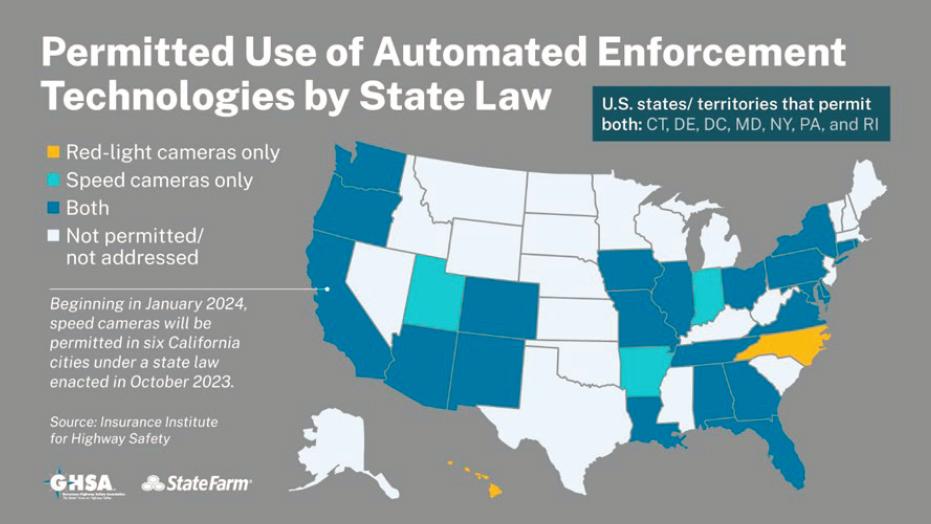
Despite the proven success of automated enforcement, it continues to be a largely underutilized tool in the traffic safety toolkit in America. Though technologically sound, automated enforcement is a politically polarizing countermeasure that includes equity implications in where devices are located. Some states have enacted legislation permitting speed and red-light cameras, while others have chosen to explicitly prohibit their use. Figure 2-4 depicts permitted use of automated enforcement technologies by state.
Early missteps in implementation contributed to public mistrust for automated enforcement.h This is unfortunate because automated enforcement creates deterrent effects that cannot be physically matched by officers on patrol. It is a force multiplier that can augment the traditional police enforcement effort, with proven safety benefits.
There are many benefits of automated enforcement, but there will always be a need for manual law enforcement too. Automated enforcement cannot not address the violent, reckless, and impaired drivers that require immediate interdiction. Together, however, automated and manual enforcement reduce mean speeds, ultimately lead to safer roads.
SOURCE: GHSA. “Automated Enforcement in a New Era.” December 2023. https://www.ghsa.org/resources/AutomatedEnforcement23.
__________________
E.J., S. Hallmark, T. McDonald, M. Orellana, and D. Matulac. 2007. “The Effectiveness of Iowa’s Automated Red Light Running Enforcement Programs.” Iowa State University, Center for Transportation Research and Education Report no. CTRE Project 05-226; Retting, R.A., and C.M. Farmer. 2003. “Evaluation of Speed Camera Enforcement in the District of Columbia.” Transportation Research Record 1830:34–37; Washington, S., K. Shin, and I. van Schalkwyk. 2007. “Evaluation of the City of Scottsdale Loop 101 Photo Enforcement Demonstration Program.” Arizona DOT Report no. AZ-07-684.
h For example, per Maryland state law, speed camera revenue must first be used to cover the operation of the I-83 camera system, with remaining funds allocated to I-83 safety capital improvements and maintenance. Baltimore City Department of Transportation. “ATVES.” March 3, 2017. https://transportation.baltimorecity.gov/atvesprogram.
However, there is tangible evidence of political and public support for increased road safety in the United States. Seat belt use by adult front-seat passengers was at a record high of 91.9% in 2023.30 Road safety can also be an interest that engenders intense advocacy in the United States, especially around safety for people walking and biking. Some cities are lowering their speed limits system wide and eliminating permissive right-turn-on-red rules.31 Complete Streets policies are popular: 1,700 policies, regulations, or ordinances have been adopted by state and local governments (see the sidebar in Chapter 4).32 The Bipartisan Infrastructure Law (BIL) authorized $5 billion for the new, 5-year Safe Streets and Roads for All (SS4A) Grant Program. Less than half-way through the program, more than 1,000 regional, local, and Tribal communities have applied for and received funding for safety planning and implementation grants.33 The cultural and political barriers to deploying automated traffic enforcement are discussed in the sidebar above.
Political feasibility, public support, and individual behavior in the aggregate are all important factors to consider in selecting, prioritizing, and designing the implementation of crash countermeasures and safety interventions. Research into these social, cultural, and political factors can help decision-makers choose appropriate strategies and tactics to adapt international successes to the varying cultures across the United States.
The SSA, now a part of the National Road Safety Strategy, represents a cultural shift in the way we address motor vehicle safety, spreading the responsibility for reducing fatalities more widely in recognition of the fact that drivers will make mistakes, and rejecting the notion roadway deaths are a “cost of doing business.” The SSA is discussed in more detail in the sidebar below.
SUMMARY
The long-term trend in U.S. motor vehicle fatalities was declining for many years, as improvements in the design of both roadways and motor vehicles and behaviors such as impaired driving reduced both crash frequency and
___________________
30 NHTSA. “Seat Belt Use in 2023—Overall Results.” Traffic Safety Facts, February 2024. https://crashstats.nhtsa.dot.gov/Api/Public/ViewPublication/813543.
31 NHTSA. “Lower Speed Limits.” Countermeasures That Work. Accessed May 6, 2024. https://www.nhtsa.gov/book/countermeasures-that-work/speeding-and-speed-management/countermeasures/legislation-and-licensing/lower-speed-limits; Zipper, D. “It’s Time to Ban ‘Right on Red.’” Fast Company, June 14, 2023. https://www.fastcompany.com/90908929/its-time-for-a-nationwide-ban-of-right-on-red.
32 Smart Growth America. “Complete Streets Policies.” Accessed May 6, 2024. https://smartgrowthamerica.org/program/national-complete-streets-coalition/policy-atlas.
33 U.S. DOT. “Safe Streets and Roads for All (SS4A) Grant Program.” Last updated April 16, 2024. https://www.transportation.gov/grants/SS4A.
fatalities. The trend began to reverse around 2000. In contrast, highly developed nations in Europe, North America, Australia, and New Zealand have continued to show reductions in motor vehicle death rates. This chapter examined cultural and contextual factors associated with this bifurcation of trends in search of a better understanding of why the United States has not done better, and how that pattern might be changed.
Among the differentiating factors is a greater dependence on the automobile for transportation, rather than public transit and non-motorized vehicles. Yet Canada, Australia, New Zealand, and increasingly highly developed European nations are comparable to the United States in terms of modal utilization and land development patterns that demand automobile travel.
Another factor is the organization of the U.S. government, where, constitutionally, the power to implement road safety lies primarily with the states. It is difficult for the federal government to promulgate a commitment to safety throughout the nation. The safety outcomes of the states, and the priorities placed on roadway capacity versus safety, vary widely. As a result, in contrast with most European nations, the federal government has limited ability to enable or enforce a safety culture across the nation. Still, Canada and Australia have better road safety performance but operate with a system of a strong national government and independent states and provinces.
Research into the political, social, and cultural factors that affect road safety and the implementation of safety interventions can provide insights into differences in road safety outcomes across and within U.S. states. Such research could also inform the selection and prioritization of countermeasures and the design of educational or advocacy campaigns. The U.S. manifests both intense advocacy around road safety as well as open resistance—both socially and politically—to proven behavioral crash interventions, such as those aimed at speeding and driving under the influence of drugs or alcohol. These differences are also seen in variations in acceptance of such interventions across the 50 states.
The SSA also represents a cultural change, putting the priority on safety in roadway and vehicle design and decreasing the tendency to blame road users for failures. Although the SSA philosophy is clear and the SSA guidance and tools for road safety practitioners are under development, operationalizing it may not be easy in the United States. There are liability concerns and the need to coordinate decision making across thousands of local jurisdictions. Therefore, implementing the SSA on the ground across 50 states remains a challenge.
SIDEBAR
The Safe System Approach
The Safe System Approach (SSA) is based on the principle that life and health should not be compromised by the need for mobility. While the SSA is not a new idea, it represents a significant shift in the way traffic safety is viewed and managed, elevating safety to more than just another aim of effective road safety management. The concept originated 30 years ago in Sweden and the Netherlands to connect traffic safety and public health.a The five elements of the SSA are safe road users, safe vehicles, safe speeds, safe roads, and post-crash care.b The SSA calls for designing and operating the road system under the assumption that drivers will make errors, and therefore facilities should be designed to reduce speeds and operated to reduce those errors and mitigate their consequences. The SSA attempts to accommodate the needs of all road users, (especially vulnerable road users), and it invites road managers to be proactive, identifying and anticipating risks and addressing them earlier rather than waiting until crashes reach some threshold level (see Table 2-1). The SSA can be seen as rebalancing safety versus capacity as primary objectives for the highway system.
The SSA is the key element of the U.S. Department of Transportation’s National Road Safety Strategy and it represents a significant change in culture for roadway management.c To facilitate this change in culture, the SSA was mandated in the 2021 Bipartisan Infrastructure Law, calling for states to conduct and regularly update a vulnerable road user safety assessment and take into consideration the SSA for “high-risk” locations as part of their State Highway Safety Plan.d Table 2-1 compares traditional and safe system approaches to road safety.
Because the SSA amounts to a cultural shift for highway planners and engineers, it is not surprising that uptake has been slow. In fact, states have been raising speed limits despite evidence of the association between high speeds, deaths and serious injuries, a direct conflict with the SSA.e Evidence suggests that driving speeds are generally increasing across the nation.f One study found a possible link between speed limit setting policies and continuously increased operating speeds on roads.g Other research has discussed road design policies and practices that may inadvertently en-
__________________
a Signor, K., W. Kumfer, S. LaJeunesse, D. Carter, and UNC Highway Safety Research Center. 2018, June. “Safe Systems Synthesis: An International Scan for Domestic Application.” University of North Carolina at Chapel Hill Highway Safety Research Center.
b Doctor, M., and C. Ngo. 2022. “Making Our Roads Safer Through a Safe System Approach.” Public Roads 85(4).
c The National Roadway Safety Strategy (NRSS). Accessed March 26, 2024. https://www.transportation.gov/NRSS.
d 23 U.S.C. 148. https://www.govinfo.gov/content/pkg/USCODE-2022-title23/pdf/USCODE-2022-title23-chap1-sec148.pdf.
e Hauer, E. 2009. “Speed and Safety.” Transportation Research Record 2103, pp. 10–17.
f National Council of State Legislatures. “Transportation Review | Speeding and Speed Limits.” Accessed May 8, 2024. https://www.ncsl.org/transportation/transportation-review-speeding-and-speed-limits.
g Hauer, E. 2009. “Speed and Safety.” Transportation Research Record 2103.
courage speeding.h These and other studies raise concerns about the persistent lack of progress in making design and speed limit setting policies consistent with the SSA in the United States (see the sidebar “The 85th Percentile Speed Limit: Legacy Guidance Lives on But Where Is the Evidence?” in Chapter 3).
The slow uptake of the SSA is in part because implementation guidance for practitioners lags the policy and it takes time to make the significant change in culture and institutions needed for SSA adoption. That guidance is catching up is reflected in a stream of new research under way.i However, the nature of this cultural shift may not make the SSA an “easy sell.” For example, committee explorations of efforts to reduce speed limit or add bicycle lanes as part of Complete Streets projects revealed examples where State DOTs threatened to block local actions by taking back roadways previously ceded to city control or preventing speed reductions to protect level of service for motor vehicles.j This is addressed in the sidebar “Combining Complete Streets Implementation with Resurfacing in Atlanta” in Chapter 4.
TABLE 2-1 The Traditional Approach and the Safe System Approach to Road Safety
| Traditional | Safe System | |
| Road Safety Problem | All Crashes | All Casualties |
| Policy Goal | Reduce Numbers of Crashes | Zero Casualties |
| Planning Approach | Reactive/Incremental | Proactive/Systematic |
| Crash Cause | Non-compliant Users | Mismatch of User and System |
| Crash Responsibility | Individual Road User | Shared Responsibility |
| Working Ingredients | Isolated Interventions | Holistic Approach |
SOURCE: Wegman, F. Delft University of Technology. Presentation to the committee. January 17, 2023.
__________________
h Donnell, E.T., S.C. Hines, K.M. Mahoney, R.J. Porter, and H. McGee. 2009. “Speed Concepts: Informational Guide.” FHWA-SA-10-001.
i For some examples of current NCHRP research projects related to the SSA, see https://apps.trb.org/cmsfeed/TRBNetProjectDisplay.asp?ProjectID=5088 and https://apps.trb.org/cmsfeed/TRBNetProjectDisplay.asp?ProjectID=5324.
j Bray, J. 2022, September. “Can San Antonio Become a Better Bike City? Not on State Roads,” Governing.
This page intentionally left blank.


