State of Knowledge Regarding Transmission, Spread, and Management of Chronic Wasting Disease in U.S. Captive and Free-Ranging Cervid Populations (2025)
Chapter: Appendix F: Data on Cervid Farms and Captive Cervids by State and Costs
Appendix F
Data on Cervid Farms and Captive Cervids by State and Costs
This appendix provides an expanded visualization of the cervid data reported in Chiavacci (2022). It also provides descriptions on cervid numbers, number of paid hunting licenses, and years since first detection in wild cervid populations. The committee developed several sets of figures presenting relationships of these data, separated into two frames—states with mule deer and states without mule deer. The appendix concludes with a discussion of public agency costs.
DATA ON CERVID FARMS AND CAPTIVE CERVIDS
Chiavacci (2022) documents the number of cervid farms and captive cervids by state in 2020. Figure F.1 groups those in states with mule deer habitat (Figure F.1a) and those without (Figure F.1b). Most states have less than 150 cervid farms and less than 10,000 captive cervids. The number of cervid farms and captive cervids in Texas exceeds that of others states by over an order of magnitude. Most of the Great Plains and western states with mule deer have less than 50 farms and 3,000 captive cervids. There are, on average, more cervid farms and captive cervids in states with only white-tailed deer habitat (i.e., the central and eastern states).
Some states such as Texas have both breeding and breeding and hunting operations. Little data exist on the scale of those operations apart from the facilities surveyed by Outlaw and others (2017). They determined that the average breeding farm size was found to be 21 acres for breeding and 30 acres for breeding and hunting. The sizes of these facilities are much smaller than those in Alberta documented by Arnot and others (2009), which are in the hundreds of acres.
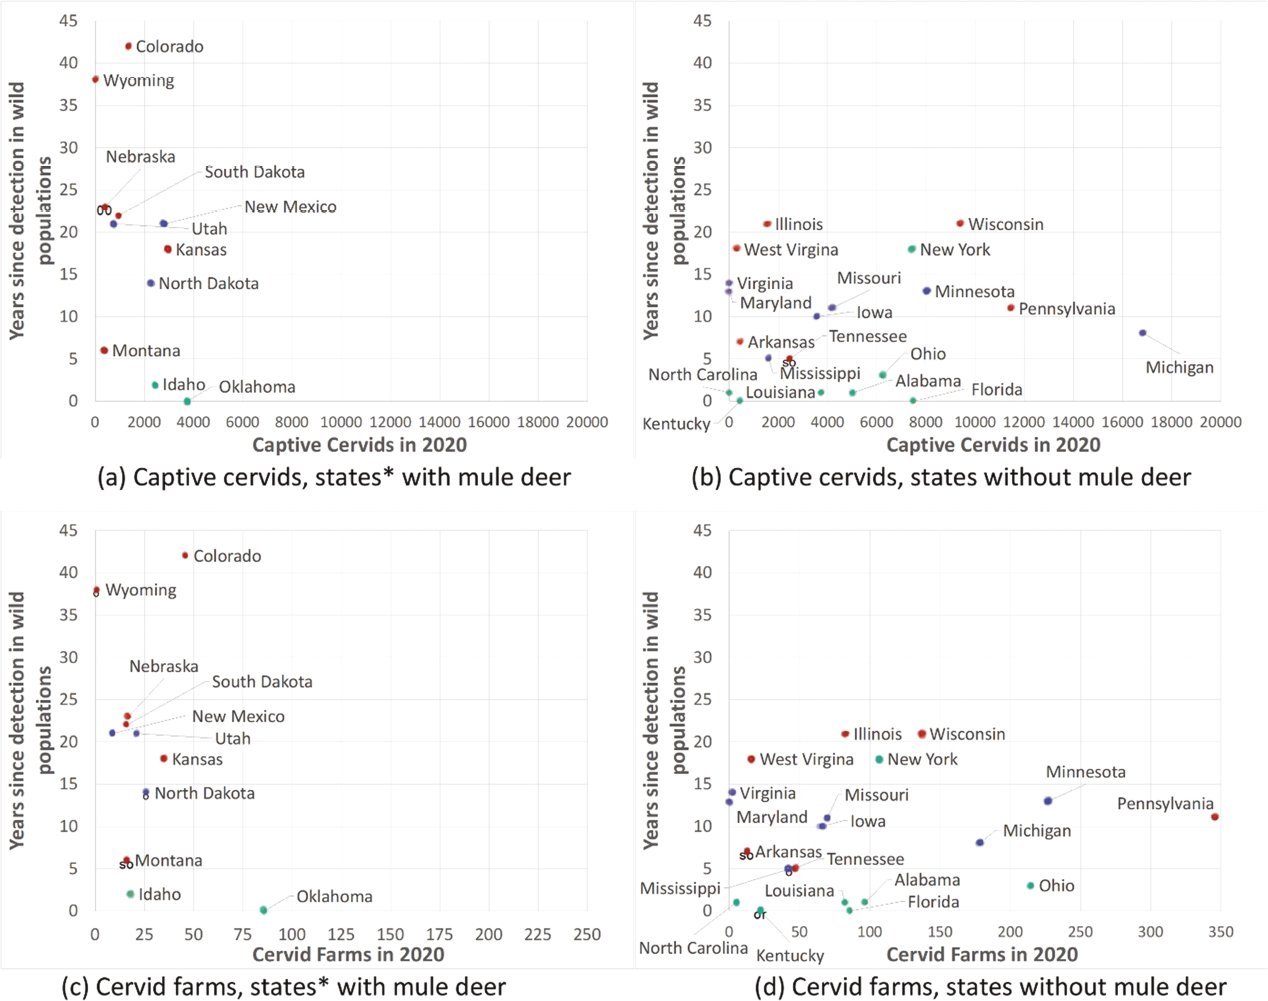
Figure F.2 plots the years since first detection of chronic wasting disease (CWD) in wild cervids in each state against captive cervids in each state in 2020 in Figure F.2a and Figure F.2b, and against the number of cervid farms in 2020 in Figure F.2c and Figure F.2d.
While CWD was first detected relatively recently in Texas, there is a relatively high number of locales with endemic CWD. The remaining states all have less than 4,000 captive cervids and fewer than 100 farms (Chiavacci, 2022). Both Idaho and Oklahoma have seen a few cases.
For the more eastern states without mule deer, there are regular groupings based on the years since first detection and number of endemic locales, each across the full range of number of cervids and farms. Exceptions to the pattern include Arkansas and Tennessee, which both have only recently detected CWD yet have several endemic locations. New York is also different in that CWD was detected 18 years ago, but few other cases have been found. This is fortuitus for New York as the state has almost 7,500 captive cervids and over 100 farms (Chiavacci, 2022).

SOURCE: Data from Chiavacci (2022, Table 1).
Data were obtained by the committee from a variety of digital sources on the state-by-state number of hunting licenses issued annually and populations of wild cervids. (The committee realizes these population estimates are rough and does not employ them in a formal analysis but rather as an indication of the magnitude of those populations at risk.) Considering deer as the most widespread species at risk, for the same states as employed in Chiavacci (2022) and grouped by states with and without mule deer habitat, Figure F.3 plots the number of hunters in 2022 and wild deer populations in 2022. Figure F.3 illustrates that those states with more deer have more hunters, but the general pattern in the states with mule deer habitat is quite different than that of states with just white-tail deer. It is important to note that there may be significant differences in the benefits and costs of hunting across cervid species and states, and the relative proportions of cervids in states vary significantly—for example, many states with mule deer also include significant populations of elk and moose. Also important to note is there is great variation in access to hunting across states and public lands and in resident and non-resident demand for hunting.
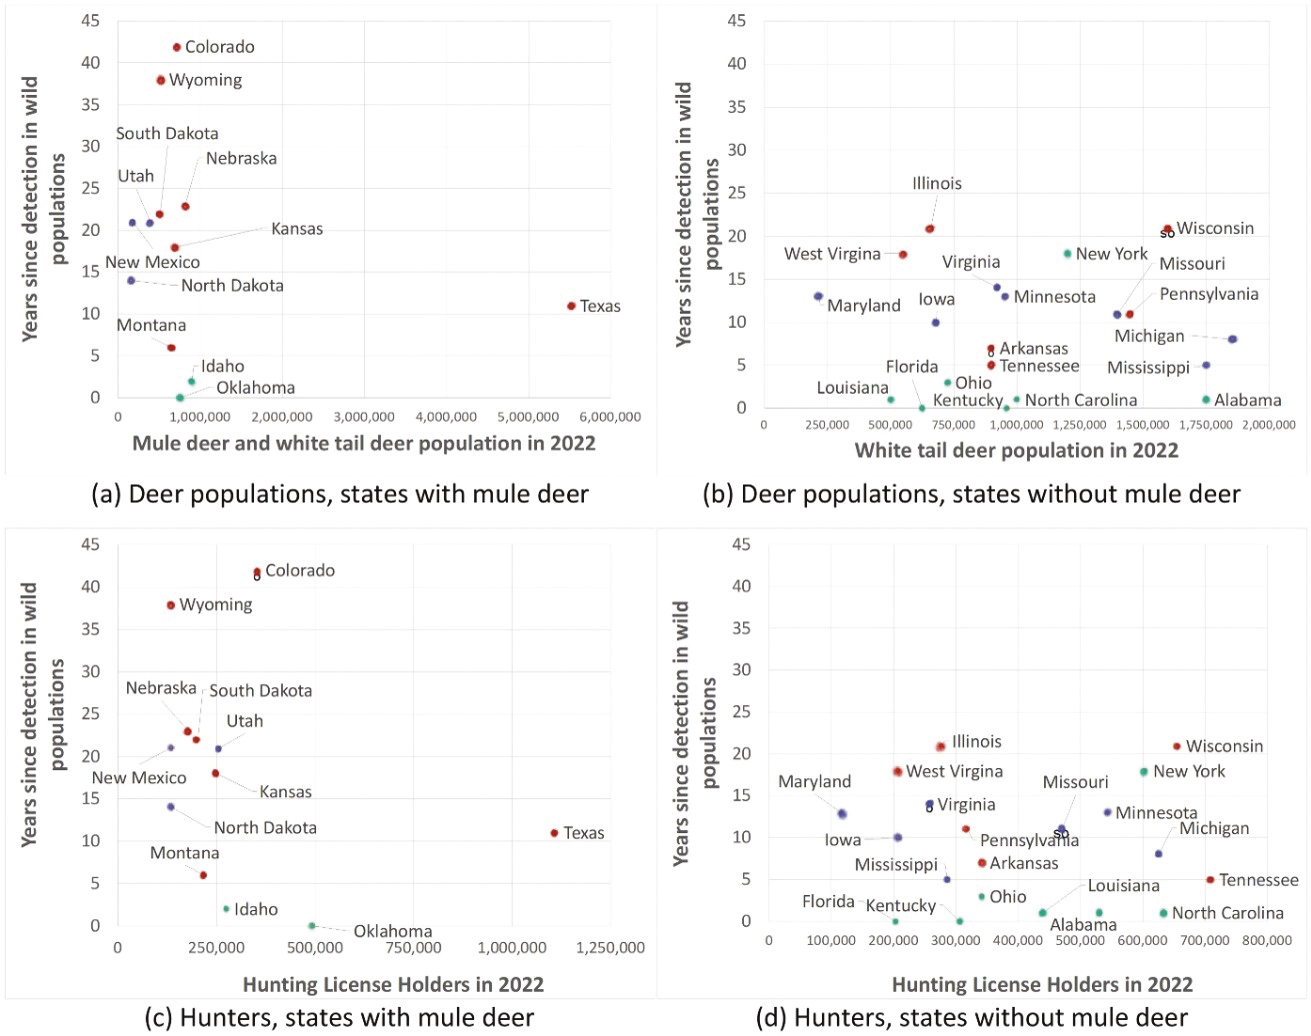
Figure F.4 plots the years since first detection and wild deer populations in 2022 in Figure F.4a and Figure F.4b, and the number of hunters in 2022 in Figure F.4c and Figure F.4d.
The plots illustrate again the differences in the pattern of the data between the western/Great Plains states and those further east. For the states with mule deer (Figure F.4a and Figure F.4c), both risk factors (long period of time since first detection and number of endemic locales) increase together apart from Montana (with lower numbers of deer and hunters) and Texas (with higher numbers of deer and hunters), where they have several endemic locales given a relatively recent first detection. The same general risk factor pattern persists for states without mule deer (Figure F.4b and Figure F.4d), although the groupings of each risk factor combination are maintained across broad ranges of deer populations and number of hunters. Again, outliers are Arkansas and Tennessee (having relatively recent detection and high numbers of endemic locales) and New York, which has only had a few cases of CWD since its initial detection many years ago.
CWD-RELATED COSTS
To help understand drivers in public agency costs, the cost data from Table 1 of Chiavacci (2022) were grouped by mule deer habitat and plotted against the number of years since CWD was first detected (Figure F.5a and Figure F.5b); against the population of wild deer (Figure F.5c and Figure F.5d); and against the number of hunting license holders (Figure F.5e and Figure F.5f). As one might expect, on average, states that have experienced more years since the first detection have high numbers of hunters and high numbers of deer, and tend to have the
SOURCE: Data on cervid farms and captive cervids in each state in 2020 are from Chiavacci (2022).
a Information on year of CWD detection in states:
Alabama, see https://www.outdooralabama.com/cwd/cwd-alabama.
Arkansas, see https://www.agfc.com/hunting/deer/chronic-wasting-disease/cwd-in-arkansas/.
California, see https://wildlife.ca.gov/.
Colorado, see https://www.cdc.gov/prions/cwd/occurrence.html.
Florida, see https://www.cidrap.umn.edu/chronic-wasting-disease/cwd-detected-first-time-florida-which-becomes-31st-affected-state.
Idaho, see https://idfg.idaho.gov/press/hunters-asked-help-chronic-wasting-disease-testing-salmon-region.
Illinois, see https://dnr.illinois.gov/content/dam/soi/en/web/dnr/programs/cwd/documents/cwd-fact-vs-fiction.pdf.
Indiana, see https://www.in.gov/dnr/fish-and-wildlife/wildlife-resources/wildlife-diseases-in-indiana/chronic-wasting-disease-cwd/.
Iowa, see https://www.iowadnr.gov/Hunting/Deer-Hunting/Deer-Health/Chronic-Wasting-Disease.
Kansas, see https://ksoutdoors.com/Hunting/Big-Game-Information/Chronic-Wasting-Disease-CWD; https://www.ksal.com/chronic-wasting-disease-spreading-in-kansas-deer/.
Kentucky, see https://fw.ky.gov/News/Pages/Chronic-wasting-disease-confirmed-in-Kentucky-for-first-time.aspx.
Louisiana, see https://www.lsu.edu/vetmed/news/2022/laddl_cwd_confirmed.php.
Maryland, see https://dnr.maryland.gov/wildlife/Pages/hunt_trap/CWD_in_Maryland.aspx.
Michigan, see https://www.cidrap.umn.edu/chronic-wasting-disease/michigan-reports-first-cwd-detection-ogemaw-county.
Minnesota, see https://www.dnr.state.mn.us/cwd/about.html.
Mississippi, see https://www.ms-sportsman.com/hunting/deer-hunting/update-on-chronic-wasting-disease-in-mississippi/.
Missouri, see https://www.ozarksfirst.com/news/local-news/which-missouri-counties-showed-deer-with-chronic-wasting-disease/.
Montana, see https://www.greatfallstribune.com/story/news/local/2022/11/11/montana-fwp-confirms-first-case-of-cwd-in-deer-near-belt-montana/69638009007/; https://www.rmef.org/elk-network/montana-records-first-suspected-case-of-cwd-in-wild-elk/.
Nebraska, see https://outdoornebraska.gov/conservation/conservation-challenges/wildlife-diseases/chronic-wasting-disease/.
New Mexico, see https://www.wildlife.state.nm.us/conservation/invasive-species-and-diseases/chronic-wasting-disease/.
New York, see https://dec.ny.gov/nature/animals-fish-plants/wildlife-health/animal-diseases/chronic-wasting-disease.
North Carolina, see https://www.bowhunting.com/article/first-cwd-case-found-in-north-carolina-deer-herd/.
North Dakota, see https://gf.nd.gov/wildlife/diseases/cwd/faq.
Oklahoma, see https://www.wildlifedepartment.com/hunting/resources/deer/cwd.
Pennsylvania, see https://www.vet.upenn.edu/docs/default-source/research/pa-wildlife-futures-program/threat-assessment-reports/cwd-state-level-dashboard-%281%29.pdf?sfvrsn=d02df6ba_8.
South Dakota, see https://gfp.sd.gov/userdocs/docs/chronic_wasting_disease_faqs.pdf.
Tennessee, see https://www.tn.gov/content/tn/twra/hunting/cwd/cwd-in-tennessee.html#History.
Texas, see https://tpwd.texas.gov/huntwild/wild/diseases/cwd/.
Utah, see https://wildlife.utah.gov/chronic-wasting-disease.html.
Virginia, see https://dwr.virginia.gov/wildlife/diseases/cwd/.
Washington, see https://wdfw.wa.gov/newsroom/news-release/first-chronic-wasting-disease-case-confirmed-spokane-county.
West Virginia, see https://oeps.wv.gov/cwd/Documents/community/cwd_QnA.pdf.
Wisconsin, see https://datcp.wi.gov/Pages/Programs_Services/ChronicWastingDisease.aspx.
Wyoming, see https://wgfd.wyo.gov/Wildlife-in-Wyoming/More-Wildlife/Wildlife-Disease/CWD-in-Wyoming-Wildlife.

SOURCES: License data are from the U.S. Fish and Wildlife Service (see https://partnerwithapayer.org/funding-sources/). Deer population estimates for 2022 were collected from state agencies and tabulated by https://wildlifeinformer.com/deer-population-by-state/.
SOURCES: Number of years since initial detection are from sources in Table F.1. License data are from the U.S. Fish and Wildlife Service (see https://partnerwithapayer.org/funding-sources/). Deer population estimates for 2022 were collected from state agencies and tabulated by https://wildlifeinformer.com/deer-population-by-state/.
highest public agency costs from CWD. But the effects depend on whether the states have mule deer habitat or not, and within each grouping there are further differentiations.
For both states with mule deer and without, costs (on average) are higher with years since first detection and more endemic locales (Figure F.5a and Figure F.5b). For the most part, costs are highest in states without mule deer for those which have higher numbers of endemic locales. However, states can have detected CWD relatively recently and have several endemic locales with relatively low costs (Montana, Figure F.5a; Arkansas, Figure F.5b) or high costs (Texas, Figure F.5a; Missouri and Michigan, Figure F.5b). In addition, there are states that first detected CWD many years ago and have several endemic locales yet have low costs (Kansas, South Dakota, and Nebraska, Figure F.5a; West Virginia and Maryland, Figure F.5b).
The pattern of costs and deer populations or hunters clearly depends on whether, or not, mule deer habitat is in the state. For states with mule deer, costs are higher with higher deer populations or more hunters and more endemic locales. The pattern is less clear in states without mule deer. While costs can be higher for states with more deer or hunters and with more endemic locales, there are wide ranges of deer populations and hunters with the same number of endemic locales and wide ranges of costs. For example, Maryland and West Virginia have lower deer populations and lower numbers of hunters yet moderate to high numbers of endemic locales and low costs.

REFERENCES
Arnot, C., E. Laate, J. Unterschultz, and W. Adamowicz. 2009. Chronic Wasting Disease (CWD) Potential economic impact on cervid farming in Alberta. Journal of Toxicology and Environmental Health Part A 72(17-18):1014-1017. https://doi.org/10.1080/15287390903084223.
Chiavacci, S.J. 2022. The economic costs of chronic wasting disease in the United States. PLOS ONE 17(12):e0278366. https://doi.org/10.1371/journal.pone.0278366.
Outlaw, J.L., D.P. Anderson, M.L. Earle, and J.W. Richardson. 2017. Economic Impact of the Texas Deer Breeding and Hunting Operations. Agricultural & Food Policy Center, Department of Agricultural Economics, Texas A&M AgriLife Research, Texas A&M AgriLife Extension Service, Texas A&M University, Research Report 17-3. College Station, Texas.


