Oil in the Sea IV: Quick Guide for Practitioners and Researchers (2023)
Chapter: Inputs: Sources of Oil in the Ocean
Inputs: Sources of Oil in the Ocean
Petroleum, or simply “oil,” is a fossil fuel that was formed in Earth’s crust from the remains of plants and marine organisms (see Box 1). As a source of energy and for chemical synthesis, oil is critical for technological and economic growth in the world. Oil and natural gas provide more than 50 percent of the worldwide energy supply as of 2023, with high energy demand driven by population growth and improvements in standards of living across the globe. Even as the world focuses on reducing its reliance on oil and gas to combat global climate change, oil and gas exploration, production, and global transport will continue into the foreseeable future.
Although many people picture images of major oil spills such as the Exxon Valdez or DWH when they hear about oil in the sea, oil enters the ocean from a variety of sources (see Figure 1).
IMAGE SOURCE: Alan Mearns.
Sources of oil entering the marine environment include:
- Natural oil and gas seeps, which are places where oil naturally enters the ocean through faults and fractures in the seafloor.
- The extraction of petroleum, which includes spills from production drilling platforms, deposition of air emissions of petroleum from platforms, and water produced from offshore oil and gas production.
- The transportation of petroleum, including pipeline spills, tanker spills, coastal facility spills, and deposition from tanker exhaust and volatile organic carbon emissions.
- The utilization of petroleum, including land-based runoff, spills from commercial vessels, operational discharges from commercial vessels, and atmospheric deposition from land-based sources.

SOURCE: Courtesy of the American Petroleum Institute produced by Iron Octopus Productions, Inc.
Recent Trends in Oil Inputs to the Ocean
To examine how changes in oil production and consumption over the past two decades have affected oil inputs, Oil in the Sea IV estimates the volume of oil originating from different sources to provide a comparison with estimates in the previous reports (see Table 1).
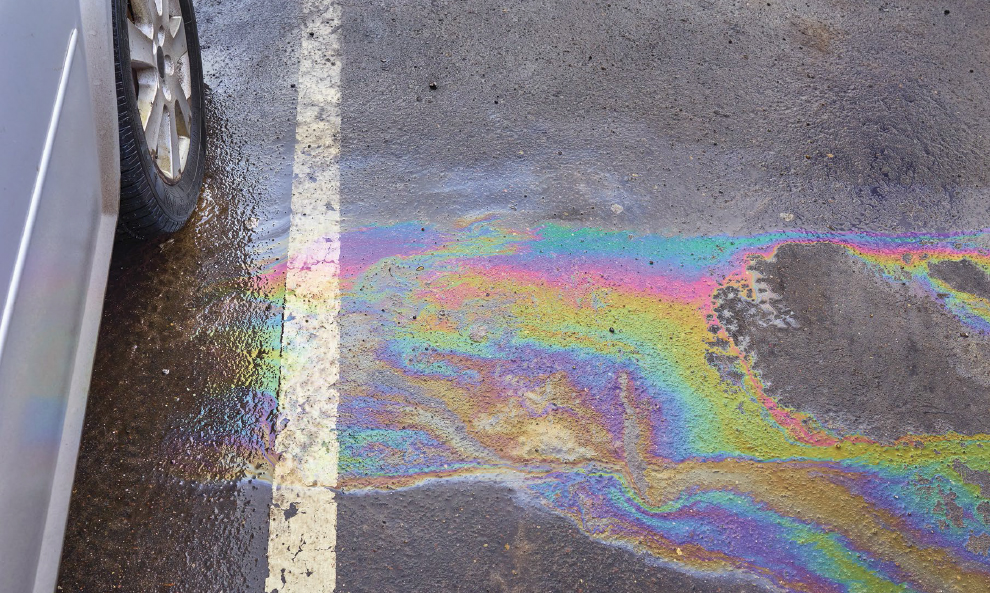
- The top source of oil in the ocean is land-based runoff, at an estimated volume up to 20 times higher than was reported two decades ago. There are now more people and more cars in North America’s coastal cities, which has increased the amount of oil pollution which runs from parking lots and highways to rivers and the ocean. Quantifying exact amounts and the contribution of specific activities remains difficult due to a lack of specific data.
- The second largest source is natural oil seeps through faults and fractures in the seafloor. These estimates are about a third lower than those made in the 1990s, due to changes in estimation methodology, including advancements in remote sensing.
- The third largest source is oil spills. Over the past 20 years, the volume of spills decreased significantly for pipelines, vessels, and coastal refineries. Following the DWH oil spill, there has been an increased focus on safety in the oil, gas, and shipping industries. The regulations governing offshore oil and gas operations were changed, and advances were made in blowout prevention and source control. New performance measures and enforcement mechanisms have improved pipeline safety, and new regulations have been introduced on the design and operation of ships carrying oil or gas as cargo or as fuel, and on engines used on recreational vehicles. These changes have decreased the volume of spills from pipelines, ships carrying oil, and coastal refineries.
Another major source is discharge from oil and gas operations, which includes oily water from offshore oil and gas production and discharges from machinery operations on commercial vessels. In the past, the
United States was a net importer of hydrocarbons, but now, because of increased production and changes in legislation, the United States is an exporter of crude oil and natural gas, which has increased activity at terminals and on shipping routes. Increased offshore oil production has also increased the volume of oil discharged during operations.
THE NEED FOR DATA ON OIL SOURCES
Teasing apart the volumes of oil entering the ocean from some sources is difficult because of a lack of data. Although enough data exist to understand trends—and in some cases, to provide more precise estimates—data are lacking for accurately estimating many inputs of oil into North American waters. This is particularly true for estimating oil inputs from land-based runoff. Except for oil released from spillage and estimation of natural seepage, there have been decades of inaction on measuring oil inputs to the ocean, with little progress on this front since the original Oil in the Sea report in 1975. More specific data would allow scientists to identify the particular oil sources that are most significant, most likely to have adverse effects on marine organisms, or most amenable to mitigation efforts.
TABLE 1 Estimates of Oil Inputs as Reported in Oil in the Sea IV Compared to Estimates from Oil in the Sea III
| Input Source | Oil in the Sea IV (2010-2019) (MT/yr) | Oil in the Sea IIIa (1990-1999) (MT/yr) | |
|---|---|---|---|
| Natural Sources (total not including natural gas) | 100,000 | 160,000 | |
| Oil seeps | 100,000 | 160,000 | |
| Gas seeps | 2–9 Tgb | Not reported | |
| Extraction of Petroleum | excluding DWH 9,500 |
including DWH 66,500 |
2,980 |
| Platforms | 1,100 | 160 | |
| MC-20 | 1,600c | ||
| DWH | 57,000 | ||
| Atmospheric deposition | Not reported | 120 | |
| Produced waters | 6,800 | 2,700 | |
| Transportation of Petroleum | 818 | 9,209 | |
| Pipeline spills | 380 | 1,900 | |
| Tank vessel spills | 200 | 5,300 | |
| Commercial vessel spills | 8 | 99 | |
| Coastal terminal spills | 220 | 1,900 | |
| Coastal refinery spills | 10 | Included with terminal spills | |
| Input Source | Oil in the Sea IV (2010-2019) (MT/yr) | Oil in the Sea IIIa (1990-1999) (MT/yr) | |
|---|---|---|---|
| Atmospheric deposition | Not reported | 10 | |
| Consumption of Petroleum | 1,200,399 | 83,520 | |
| Land-based runoff | 1,200,000 | 54,000 | |
| Recreational marine vessels | Not reported | 5,600 | |
| Spills (non-tank vessels) | 390 | 1,200 | |
| Operations discharges (vessels >100 GT) | 9d | 100 | |
| Operations discharges (vessels <100 GT) | 0d | 120 | |
| Atmospheric deposition | Not reported | 21,000 | |
| Aircraft jettison | Not reported | 1,500 | |
| Totale | 1,400,000 | 260,000 | |
| Totale (Excluding consumption and DWH) | 110,000 | 170,000 | |
a Oil in the Sea III’s “Best Estimate” is shown in this column.
b Gap volumes are reported in teragrams (Tg).
c Value shown reflects value of 1,600 MT/yr (30 bbls/day), the amount of oil collected from the site since April 2019. This value may be an over- or underestimate of annual discharge for the full 2010–2019 timeframe (see table for range of published estimates).
d Full compliance with discharge regulations is assumed.
e Reported values and totals rounded to two significant figures.
Looking Ahead: Future Sources of Oil in the Sea
In coming years, it is likely that other sources of oil may become more significant inputs of pollution to the ocean as a result of the following stressors and other factors.
DAMAGE TO OIL INFRASTRUCTURE CAUSED BY EXTREME WEATHER AND SEA-LEVEL RISE
The past two decades have been marked by a warming climate. The increase in intense, frequent storms and hurricanes and the sea-level rise associated with global warming could damage offshore structures, pipelines, and coastal facilities, presenting a significant risk of future oil inputs to the ocean (see Box 2 for an example of damage to oil infrastructure caused by a hurricane). Reviewing the integrity of energy infrastructure to determine if it could withstand increased frequency and intensity of extreme weather events, and making structural modifications as necessary would help to mitigate this risk.
DETERIORATION OF AGING ENERGY INFRASTRUCTURE
As aging offshore energy infrastructure deteriorates (such as abandoned or inactive wells, pipelines, facilities, and sunken ship wrecks), they will become an increasingly significant source of oil. Structural components of the well tubing, valves, and fittings, and even the materials used to plug a well are susceptible to corrosion, decay, tectonic shifting, and underwater landslides. Salvage or capping of these facilities would help to minimize the potential impact if the infrastructure fails.
INCREASED ARCTIC OIL EXPLORATION AND SHIPPING
As the climate warms and sea ice cover decreases, the Arctic region is becoming more accessible. The Arctic Ocean contains 21 percent of the world’s continental shelf—a geological feature that houses most recoverable oil deposits—and it is estimated that the northern coast of Alaska in the Chukchi and Beaufort seas may contain 14–47
billion barrels of recoverable oil (see Figure 2). As these resources become easier to reach, increased oil exploration, production, and transportation will bring new inputs of oil to the ocean. A more accessible Arctic will also bring increased oil discharges from commercial fishing, shipping, and tourism traffic.
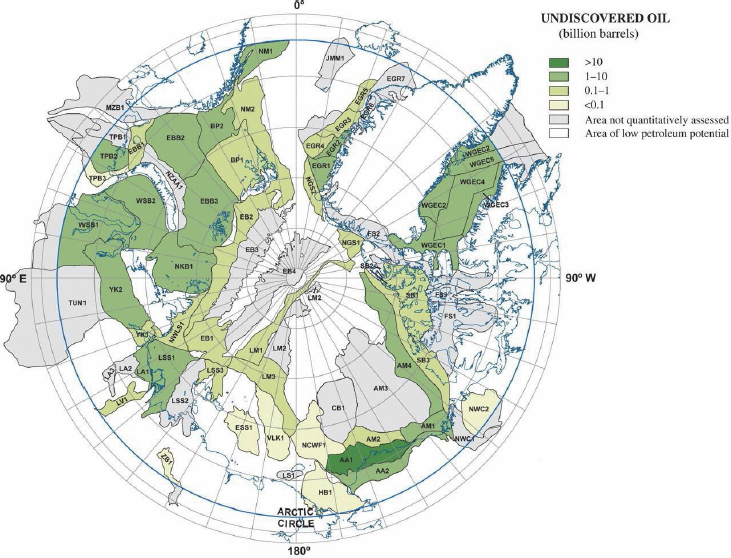
NOTE: Black lines indicate Assessment Unit boundaries.
SOURCE: Gautier, D. L., K. J. Bird, R. R. Charpentier, A. Grantz, D. W. Houseknecht, T. R. Klett, T. E. Moore, J. K. Pitman, C. J. Schenk, J. H. Schuenemeyer, K. Sorensen, M. E. Tennyson, Z. C. Valin, and C. J. Wandrey. 2009. Assessment of undiscovered oil and gas in the Arctic. Science 324(5931):1175–1179. https://doi.org/10.1126/science.1169467.


