Toward a 21st Century National Data Infrastructure: Enhancing Survey Programs by Using Multiple Data Sources (2023)
Chapter: 5 Data Linkage to Improve Income Measurement
5
Data Linkage to Improve Income Measurement
Much of the work on linking survey data with administrative records in the United States has been in the area of income statistics. One of the earliest large-scale linkage projects linked records from the Current Population Survey (CPS) with administrative records data from the Internal Revenue Service (IRS) and Social Security Administration (SSA; see Chapter 2). Numerous agencies and business organizations collect or assemble data related to income, and many of these data records contain identifying information such as Social Security Numbers (SSNs) that make it feasible to link records across sources.
As seen in Sections 3.6 and 4.2, data sources about income have been linked to increase the sample size for subpopulations, to add variables about subpopulation membership that permit calculation of disaggregated statistics, and to correct for measurement error in surveys. There is also a large literature in which researchers have used linked data to study issues of policy concern, such as poverty disparities, income inequality, earnings volatility, and effects of tax policies.
This chapter, relying in part on presentations in the workshop session Data Linkage for Income and Health Statistics, focuses on using record linkage to improve measurement and understanding of income and related concepts. When survey records have sufficient personally identifying information, it becomes possible to link them with tax records from the IRS, detailed earnings records from the SSA, and records from state-administered programs such as the Supplemental Nutrition Assistance Program (SNAP). Comparing income types and amounts reported to surveys with IRS or SSA records can identify areas for which better measurement
methods may be needed (for example to address underreporting or over-reporting in various sources), and can facilitate modeling efforts to calculate statistics about income and to impute missing income items in surveys and other data sources.
Section 5.1 reviews key federal income surveys and lays out some data-equity issues for income measurement, and Section 5.2 describes sources of administrative records data on income. Section 5.3 discusses how linking income surveys with administrative records can provide information about survey nonresponse bias and improve population coverage. Section 5.4 discusses examples of studies that have linked data sources to assess the accuracy of information about income and participation in food- and housing-assistance programs. Section 5.5 describes two major U.S. Census Bureau projects—the Comprehensive Income Dataset project, which examines the effect of improved income measures on poverty estimates, and the National Experimental Well-being Statistics project, which proposes to blend administrative and survey data to create more accurate income estimates.
5.1 INCOME DATA COLLECTION ON SURVEYS
Numerous federal statistical agency surveys collect data about income and poverty. This section describes three major ongoing data collections from the U.S. Census Bureau and the Bureau of Labor Statistics that have been used widely in record-linkage activities: the American Community Survey (ACS), the Current Population Survey Annual Social and Economic Supplement (CPS ASEC), and the Survey of Income and Program Participation (SIPP).1 It also discusses the strengths and limitations of the household surveys used to report official statistics on income, including issues of nonresponse.
___________________
1 Many other federal surveys measure concepts related to income, including surveys that focus on other subjects. See Czajka & Denmead (2008) for a comparative study of income data collected by eight major household surveys.
Surveys that are not conducted by federal agencies also provide opportunities for linkages with administrative records. For example, the Panel Study of Income Dynamics, conducted by the University of Michigan’s Institute for Social Research, is a longitudinal household survey that began in 1968 (https://psidonline.isr.umich.edu/). Since then, information on a subset of individuals in the original sample and their descendants has been collected at regular intervals (the sample has been occasionally refreshed to enhance representativeness). Thus, researchers have the potential to link survey observations and administrative records for multiple individuals from the same extended, multigenerational family. Chapter 6 discusses the Health and Retirement Study, an ongoing multicohort panel study of the U.S. population aged 50 and over.
American Community Survey
The ACS has been collecting household and personal income data continuously since 2005. It was designed to replace the decennial census “long form,” in which a sample of the population received additional questions about numerous topics, including income. Goals when launching the ACS were to shorten the decennial census form and thereby encourage response to the census, and to provide more timely estimates than the every-ten-years statistics previously produced by the long form.
Because of the ongoing data collection and large sample size (about 3.5 million addresses are selected for the sample each year), the ACS can produce annual statistics about income for geographic areas containing 65,000 or more persons. Estimates for smaller areas are calculated by aggregating ACS data over five years, adjusting dollar amounts for inflation. Each year, a new set of five-year estimates is produced, using data from the most recent five years, and these provide a rolling picture of income and poverty. The ACS thus provides more timely estimates than the census long form it replaced. One-year and five-year ACS estimates in tabular form are usually published in September and December of each year, respectively, with microdata issued one month later.
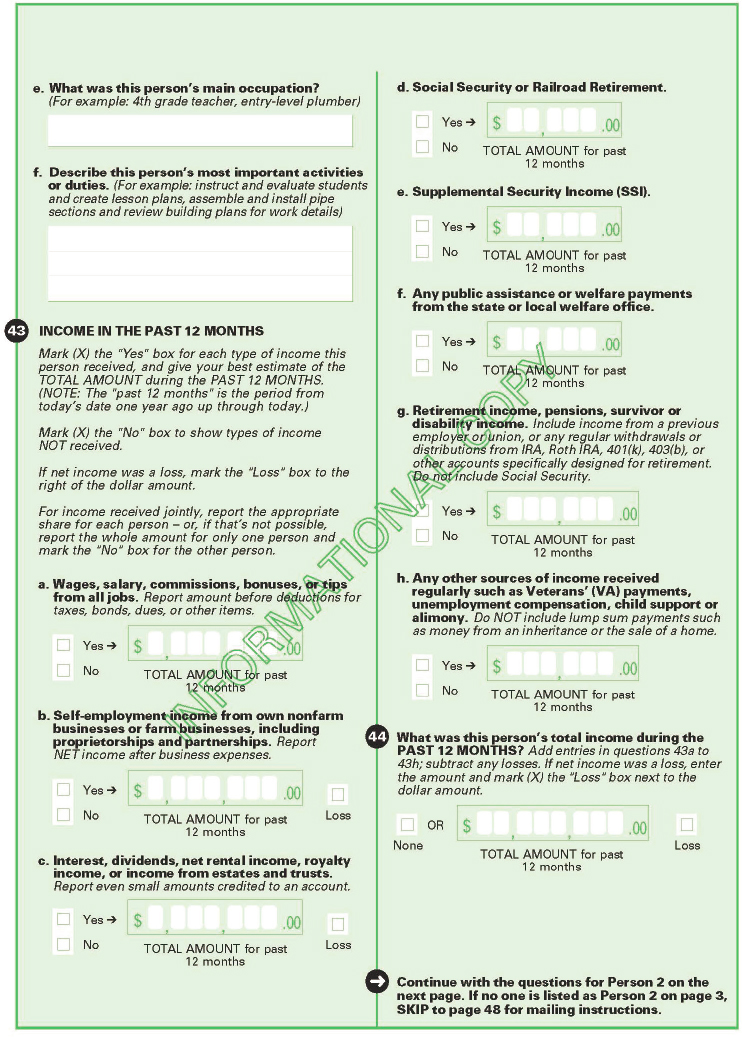
The income questions on the ACS are similar to those on the 1990 and 2000 Censuses (see Figure 5-1). These questions ask about each person’s total income and income from each of eight sources. The ACS is a multipurpose survey, however, and can ask only a limited number of questions about income. The two surveys discussed next collect more detailed information on aspects of income.
Current Population Survey Annual Social and Economic Supplement
As discussed in Chapter 2, the CPS originated in a program established in 1940 to provide direct measurement of national unemployment each month, on a sample basis. The monthly CPS sample still serves that purpose but is periodically supplemented by additional data collections that concentrate on specific aspects of the nation’s social or economic well-being.2 The oldest of these supplements, established in 1947, is now known as the Annual Social and Economic Supplement (ASEC). The CPS ASEC is the source of official national estimates of income and poverty.3
___________________
2 A list of CPS supplements from 2005–2021 is given at https://www.census.gov/programssurveys/cps/about/supplemental-surveys.html. These include, among other topics, supplements on displaced workers, contingent workers, disability, tobacco use, computer and internet use, and food security.
3 https://www.census.gov/data/developers/data-sets/Poverty-Statistics.html and Shrider et al. (2021).
ASEC data are collected once a year (in February through April) to “provide data concerning family characteristics, household composition, marital status, educational attainment, health insurance coverage, foreign-born population, prior year’s income from all sources, work experience, receipt of noncash benefit, poverty, program participation, and geographic mobility” (U.S. Census Bureau, 2019, p. 15). While the ACS asks about eight major sources of income, the questions in the CPS ASEC are more detailed, providing information about more than 50 potential income sources.
The sample size of the CPS ASEC is smaller than that of the ACS; in 2021, the CPS ASEC sample consisted of about 91,000 addresses (Shrider et al., 2021, p. 23). CPS ASEC estimates are issued in September of each year. They are accompanied by reports and news releases on income and poverty, with microdata issued one month later.
Survey of Income and Program Participation
The ACS and CPS ASEC are both cross-sectional surveys. The SIPP, which began in 1984, is a longitudinal survey whose “mission is to provide a nationally representative sample for evaluating: 1) annual and sub-annual income dynamics; 2) movements into and out of government transfer programs; 3) family and social context of individuals and households; and 4) interactions among these areas” (U.S. Census Bureau, 2021b, p. 1). The SIPP captures aspects of income and program participation not measured by the ACS or the CPS ASEC, such as changes in household composition, periods of program participation, and detailed data on assets and liabilities (which play a role in determining program eligibility).
The SIPP is organized as a series of national panels, which are samples of households selected to be interviewed periodically over multiple years. The typical duration of a panel ranges from 2.5 to four years. Panels begun at different times overlap, permitting cross-sectional as well as longitudinal analyses (Nwaoha-Brown et al., 2021; U.S. Census Bureau, 2021b). SIPP estimates must be longitudinally processed to ensure consistency over time and to separate data from panels being interviewed at the same time, and they are published with a longer time lag than the CPS ASEC. For example, 2020 SIPP data covering 2019 were released in October 2021.
Strengths and Limitations of Survey Data on Income
The three major surveys providing data about income have different strengths and limitations. This section discusses information that can only be obtained through a survey, and addresses aspects that may be improved by linkage with administrative records.
Each of the three household surveys provides information on entire family and household units. This is critical for measuring poverty and financial well-being. The large sample size of the ACS allows publication of statistics for detailed levels of geography and small demographic groups for the eight income sources it measures (see Figure 5-1). The CPS ASEC and SIPP contain detailed questions about income, noncash benefits, and program participation.4 The questions in each of those surveys have been developed through research programs that include stakeholder input and extensive testing. The surveys also ask about topics that would not be available from administrative records on income. For example, the ACS asks about education and disability; the CPS ASEC asks about health insurance and child care expenses; the SIPP asks about unpaid time away from work and adult and child well-being. All three provide family relationships and demographic characteristics that are not available in administrative data.
Because these are probability samples, selection and representation issues are controlled by the survey designer. The surveys have high population coverage overall (although the surveys exclude some parts of the population by design and some residential addresses are missed by the sampling frame); by contrast, administrative datasets exclude subpopulations that are not part of the program being administered. The surveys also undergo regular quality evaluations.5
All three surveys provide national estimates of the income concepts they measure (and the ACS provides estimates for states and smaller geographic areas) as well as statistics for some demographic subpopulations. But not even the ACS has sufficient sample size to provide separate estimates for every subpopulation that might be of interest, and statistical models are needed to estimate income and poverty for small subpopulations (see Box 2-2). In addition, surveys can ask only a limited number of questions and are thus constrained in the amount of information they can collect about income and subpopulation characteristics.
Income estimates from all three surveys are affected by two types of nonresponse. Some households and group quarters residents who are selected for the sample do not participate in the survey, usually because they cannot be reached or refuse to participate (called unit nonresponse because no information is supplied by the sampled unit). Additionally, some households that participate in the survey fail to answer one or more survey questions (called item nonresponse).
___________________
4 See https://www2.census.gov/programs-surveys/cps/techdocs/cpsmar22.pdf and https://www.census.gov/programs-surveys/sipp/tech-documentation/questionnaires.html for the CPS ASEC and SIPP questionnaires, respectively.
5 See, for example, https://www.census.gov/acs/www/methodology/sample-size-and-data-quality/ and U.S. Census Bureau (2019).
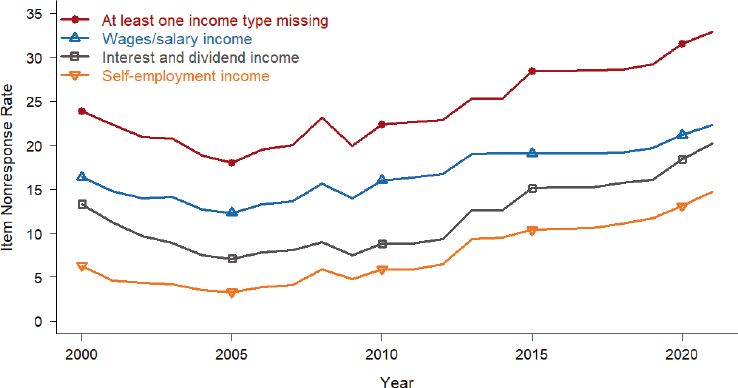
SOURCE: Panel generated with data from https://www.census.gov/acs/www/methodology/sample-size-and-data-quality/item-allocation-rates
NOTE: Nonresponse rates before 2005 are from the experimental precursor surveys to the ACS. Income types not shown are Social Security or Railroad Retirement; Supplemental Security; public assistance; retirement; other. The patterns for these other income sources over time mirror those shown and fall between the lines for wages/salary and self-employment income.
Figure 2-1 shows unit response rates for the ACS and CPS ASEC. Participation in the ACS is mandated by law, and consequently the survey has high unit response rates. However, as seen in Figure 5-2, ACS item nonresponse rates for income items have increased over time. In 2005, 18.0 percent of respondents were missing data for at least one type of income; that percentage rose to 32.9 percent of respondents in 2021. The CPS ASEC and SIPP have higher unit nonresponse than the ACS,6 and also have item nonresponse for income questions (Hokayem, Bollinger, & Ziliak, 2015).
The ACS and other household surveys usually use weighting to adjust for unit nonresponse and imputation to adjust for item nonresponse (U.S. Census Bureau, 2014). There is no guarantee, however, that these methods eliminate potential bias from nonresponse. Weighting adjustments
___________________
6 SIPP response rates are calculated separately by panel and interview and are not directly comparable with the other surveys, but SIPP response rates have also declined over the years. The response rate for the first interview of the 2018 panel was about 58 percent (Nwaoha-Brown et al., 2021).
typically ensure that estimates from the survey agree with known population counts for housing units and persons in demographic categories, but nonrespondents might still differ systematically from respondents with respect to other characteristics. As discussed in Chapter 3, imputation fills in missing items using data from similar individuals or prediction models, but imputed values can differ from actual values.
Item nonresponse tends to be higher for questions perceived as sensitive, such as those about income, than for other types of questions (Rässler & Riphahn, 2006). Moreover, item nonresponse is more prevalent among some subpopulations than others. Meitinger and Johnson (2020, p. 171) concluded that “in the U.S., African American, Asian, Hispanic, and Native American respondents have each demonstrated higher levels of [item nonresponse], compared to non-Hispanic whites, in social surveys.” As noted above, when there is differential nonresponse, data inequities might arise from failing to account for unobserved characteristics in the imputation procedures.
Decreasing response rates for surveys and, in particular, for income items raise concern about potential bias that may be more pronounced in some subpopulations than others. The next section describes administrative data sources that might be used to supplement or study properties of income surveys.
5.2 ADMINISTRATIVE RECORDS SOURCES FOR INCOME DATA
Many administrative data sources collect information about income. For example, the SSA knows how much each recipient receives in Social Security benefits each year. Other sources, such as income tax records, can provide information on particular types of income. Data from these sources can be compared to survey responses or possibly substituted for survey information.
Data from the Internal Revenue Service
The IRS collects information returns (W-2s, Form 1099s) from employers and tax returns (Form 1040s) from individuals, as well as tax returns from corporations and other organizations. The U.S. Census Bureau has direct access to specified items of individual and corporate income tax information under its enabling legislation. The data are protected by limiting access to a small number of Census Bureau employees with “special sworn status” and by following procedures in Title 26 U.S.C. and IRS regulations implementing data sharing. The U.S. Census Bureau uses these data in several ways, including:
- To improve the sampling frame for periodic business surveys such as the Annual Survey of Manufactures;
- As economic census data for certain “nonsampled” single-establishment firms, typically small firms (to reduce small business owners’ response burden from filling out forms);
- To produce statistics otherwise not available (such as for the Business Formation Statistics, Business Dynamics Statistics, and Non-employer Statistics programs);
- As the basis for aggregation to small levels of geography for use in modeling programs (such as the Small Area Income and Poverty Estimates program, described in Box 2-2);
- To create models of federal income and payroll taxes for computing post-tax income (used in the Supplemental Poverty Measure program);7
- To evaluate accuracy of income reporting (see Section 5.4); and
- To improve nonresponse adjustments for surveys and censuses.8
IRS data have some drawbacks. Data are available only for individuals who have Forms 1040, 1099, or W-2; this excludes many persons with low income and those not in wage and salary employment. Even if submitted, tax data may not be fully accurate. Earnings data are mostly complete in tax records, as federal regulations govern their reporting by employers, and they are eventually used by SSA to determine Social Security benefits. But other types of income, such as self-employment or tips income, are subject to underreporting (IRS, 2019).
In addition, tax returns are linked to tax-filing units, not households. For example, spouses who are married and living together can file separately, and dependents of divorced parents living separately can be reported on the return of the parent with whom they do not reside. Additional challenges to linking tax units to households include typographical errors in addresses, inaccurate addresses (e.g., post office boxes, rural routes, lack of apartment numbers), and outdated addresses. Even if one can reconstruct households accurately (see Larrimore, Mortenson, & Splinter, 2021), tax forms contain little demographic information, which limits options for
___________________
7 The Supplemental Poverty Measure “extends the official poverty measure by taking account of many of the government programs designed to assist low-income families and individuals that are not included in the official poverty measure” (Fox & Burns, 2021, p. 1).
8 Mule (2021) described the use of administrative records for nonresponse in the 2020 Census; Rothbaum and Bee (2021) and Rothbaum et al. (2021) described their use to help reweight the CPS ASEC and the ACS for unit nonresponse.
income tabulations (e.g., those with or without child dependents, those with or without a 65+ exemption). Inaccurate reporting can affect the use of tax data as benchmarks, and inconsistency in tax units versus households can affect linkage accuracy. In addition, some tax items are unavailable to the U.S. Census Bureau.
Data from the Social Security Administration
The SSA has data files that can provide earnings histories and Social Security benefit amounts. Those earnings histories are necessary to compute Social Security benefits once a program participant retires, and the data are provided to SSA by the IRS. SSA earnings records provide a longitudinal earnings history associated with each SSN. SSA data are also linked to longitudinal surveys such as the Health and Retirement Survey, to supplement the survey information (see Chapter 6).
Administrative Data from Other Government Agencies
Other federal agencies collect transfer program data that can be used to verify or enhance survey data. Examples include the Supplemental Security Income program administered by SSA, SNAP benefits for states reporting those benefits, and information about housing units receiving federal assistance from the U.S. Department of Housing and Urban Development (HUD).
5.3 USING ADMINISTRATIVE DATA WITH INCOME SURVEYS
Administrative records have the potential to address some of the shortcomings of survey data, including small sample sizes that limit the groups for which disaggregated statistics can be produced, inaccuracies in reporting income, and possible bias from misreporting and nonresponse. Administrative records also may contain information on some populations that are excluded from surveys (e.g., persons living in institutions). Administrative data can be used to reduce respondent burden in surveys by replacing survey questions or providing additional information without adding survey content. Combining earnings information from surveys with administrative data has the potential to provide more accurate estimates of income than could be calculated from either source by itself.9
___________________
9 See Bee and Rothbaum (2019) and Meyer and Mittag (2021). There has also been preliminary work on replacing survey questions (particularly on the ACS) with administrative records (e.g., O’Hara, Bee, & Mitchell, 2016; and NASEM, 2016b).
The Interagency Technical Working Group on Evaluating Alternative Measures of Poverty (2021, pp. 38–39) discussed three main ways to correct survey data for misreporting: “(1) rules-based approaches; (2) statistical- or regression-based modeling; and (3) direct substitution of survey reports with administrative records. These three approaches could be used independently or in combination.” Rules-based approaches impute participation using program rules: “[f]or example, in some states any person receiving public assistance is categorically eligible for Medicaid and SNAP” and thus Medicaid participation could be imputed for persons receiving public assistance. The SIPP uses the second approach.10 The National Experimental Wellbeing Statistics project, discussed in Section 5.5, uses the third approach.
Linking administrative data to the sampling frame for a survey can provide information about characteristics of nonrespondents and the nature of potential nonresponse bias (see, e.g., Sakshaug & Antoni, 2019; Rothbaum & Bee, 2021). For example, Bee, Gathright, and Meyer (2015) linked the 2011 CPS ASEC sampling frame to IRS records and found that survey respondents and nonrespondents differed in demographic characteristics such as marital status but had similar income distributions.
Effects of item nonresponse in surveys can also be studied through linkage with administrative records. For example, Bollinger et al. (2019) studied item nonresponse to the earnings question in the 2006–2011 CPS ASEC microdata by linking the data with SSA’s detailed earnings records. They found a U-shaped pattern, in which nonresponse was highest for extreme high- and low-earning individuals. Celhay, Meyer, and Mittag (2021) linked New York State SNAP and public-assistance data to the ACS, the CPS ASEC, and the SIPP, and found that nonrespondents to survey questions about SNAP and public assistance were more likely to be program recipients.
The linkage process, however, can also introduce errors and inequities, as discussed in Section 3.6, and linkage errors can interact with errors from nonresponse. For example, when studying linkages from the 1998–2009 CPS ASEC to SSA detailed earnings records, Hokayem, Bollinger, and Ziliak (2015) found that the characteristics of matched and unmatched individuals differed for survey respondents and nonrespondents. Survey respondents who could be matched with a corresponding SSA record were 14 years younger on average than survey respondents who could not be matched, while matched nonrespondents were only three years younger on average than nonmatched nonrespondents. Moreover, “matched respondents are
___________________
10 https://www.census.gov/programs-surveys/sipp/methodology/data-editing-and-imputation.html and https://www.census.gov/programs-surveys/sipp/tech-documentation/user-notes/2020-usernotes/chngs-imputd-earngs.html
statistically much less likely to be a high-school dropout or to be living in poverty than nonmatched respondents. These gaps are relatively small among nonrespondents” (p. 939).
Survey respondents who can be linked can thus have systematic differences from respondents who cannot be linked, and both can differ from nonrespondents. Omitting unlinked records can potentially lead to biases in the resulting analysis, so it is important for analysts to understand the characteristics of unlinked entities from each data source. Many linkage studies referenced in this report use weighting methods to attempt to compensate for missing links, as discussed in Section 6.4. These methods essentially treat linkage failures as a form of nonresponse and distribute the weights of units that cannot be linked among a set of units with similar characteristics (e.g., race, ethnicity, age) who can be linked. An additional option is to incorporate linkage uncertainty into standard errors of the statistics (Reiter, 2021).
Finally, some people may be missed by both the survey data and the administrative records data. For example, low-income households were more likely to be nonrespondents to the CPS ASEC in 2020 and to also be missing from tax data because they are not required to file (Rothbaum and Bee, 2021). Thus, the linked data can end up underrepresenting people who did not respond to the survey, did not have an administrative record, or lacked a strong set of identifying information to enable data linkage.
Bee and Rothbaum (2019) suggested some methods for redesigning surveys to take advantage of administrative records:
For example, we could assess from administrative records available prior to interview (through address linkage) the likelihood that members of a given housing unit will be PIKed [assigned a unique identifier used for linkage] and have particular administrative records. We could then use this information to adjust the probability that a given individual is asked particular income questions. This could reduce respondent burden on those that are more likely to have administrative data, maintain the questions for those likely not to have administrative data, and preserve a sample of each group with survey responses for modeling and imputation.
Another possibility is to use administrative information to over-sample subsets of the population, such as those that more likely have income that is not covered by administrative data or those that are less likely to be assigned a PIK. Similarly, survey questionnaires could focus on capturing information to improve linkage and representativeness, and to cover topics that are difficult to capture in administrative records, such as subjective well-being and informal employment (pp. 35–36).
5.4 STUDYING MEASUREMENT OF INCOME AND PROGRAM PARTICIPATION
This section examines examples of research conducted on using administrative records to assess the accuracy of survey reports on key sources of cash income—earnings, retirement, and pension income. It also looks at comparisons of survey data with administrative records from noncash transfer programs such as SNAP, to study the accuracy of participation and income reporting. This section does not include a comprehensive literature review (more extensive literature reviews can be found in Meyer & Mittag, 2021, and the Interagency Technical Working Group on Evaluating Alternative Measures of Poverty, 2021), but the examples show the potential of data linkage for improving accuracy in both administrative records and surveys.
Earnings typically account for approximately 80 percent of total income (Rothbaum, 2022, slide 12), and a number of studies have compared various types of earnings from the surveys discussed in this chapter with earnings for the linked records in administrative data. Examples include:
- Pedace and Bates (2000) analyzed income misreporting propensities and magnitudes using the 1992 SIPP linked to SSA earnings records for wage and salary and self-employment earnings, concluding that “the 1992 SIPP accurately estimates the net number of earnings recipients, but tends to underestimate the amounts received…. [R]espondents on the lowest end of the income distribution tend to overreport earnings, while those at the higher end of the earnings distribution are more likely to underreport earnings” (p. 173). They also looked at demographic characteristics associated with large discrepancies between SIPP and SSA record amounts, and found that large discrepancies were more common among males, persons reporting Hispanic ethnicity, persons reporting Black or Asian race, those who were married/divorced/separated (relative to never married), and persons in certain occupational categories.
- Using linked CPS ASEC/SSA records from 1998–2009, Hokayem, Bollinger, and Ziliak (2015) found that poverty rates among matched respondents were, on average, 1.7 percentage points lower using ASEC earnings than earnings from the SSA data. They speculated that “under-the-table” earnings may show up in the ASEC but are not reported to tax authorities.
Self-employment income, a component of earnings, is particularly susceptible to discrepancies between survey and administrative data and is likely underreported in both.
- Abraham et al. (2021) linked CPS ASEC records with tax information for the same individuals from the SSA detailed earnings record files to study self-employment income, which is more likely to be underreported in tax records than is wage income. They concluded: “The disagreement between these two data sources is both large and growing. Over the period from 1996 through 2015, 51.5% of those reporting CPS-ASEC self-employment income had no self-employment income for the same year on their tax returns. Even more striking, over the same period 66.7% of those with self-employment income on their tax returns did not report it in the CPS-ASEC” (p. 827).
- Eggleston, Klee, and Munk (2022) found that 32 percent of 2014 SIPP respondents who reported only unincorporated self-employment had no corresponding tax form in the SSA detailed earnings records. They noted: “The lack of tax forms for a self-employed worker may indicate low or negative profits—recall unincorporated self-employed workers are only required to file a 1040-SE if their earnings exceed $400—or it may indicate the self-employed worker did not report their income to the IRS” (p. 13).
Retirement and pension income are also amenable for study with SSA and IRS data. A number of studies have found that earned income from retirement and Social Security benefits is reported with high accuracy in surveys, but other forms of retirement income (for example, from pensions and individual retirement accounts) may be underreported.
- By linking 2013 CPS ASEC records for persons aged 65 or older to administrative data records supplied by the SSA, Bee and Mitchell (2017) were able to examine discrepancies at the individual record level (previous studies had compared aggregated statistics from separate sources). They found that the CPS ASEC underestimated retirement income overall, but “across most of the income distribution, we find that retirement income underreporting is mainly responsible for the overall income discrepancy, while self-reported earned income and Social Security benefits correspond well with administrative records” (pp. 2–3). Furthermore, most of the underreporting occurred because people who received retirement income failed to report any of it; when reported, retirement income amounts matched well.
- Dushi and Trenkamp (2021) used data from the 2016 CPS ASEC linked with IRS and SSA records to examine the extent to which administrative records could improve income estimates. For the population aged 65 or older, they found that “supplementing
- the CPS ASEC with IRS and Social Security administrative data results in a higher estimate of pension income’s share of aggregate income, less estimated reliance on Social Security, and a lower estimated rate of poverty” (p. 3).
Food and housing assistance participation can be studied by comparing survey data to SNAP records and records from HUD. A number of studies have found that survey estimates of amounts received from SNAP benefits are lower than amounts from administrative records (see, e.g., Meyer, Mok, & Sullivan, 2015). Linking records allows researchers to explore discrepancies for individual households.
- Shantz and Fox (2018) linked records from SNAP data in seven states to 2009–2015 CPS ASEC data and found that more than 40 percent of SNAP recipients did not report receipt on the survey. Celhay, Meyer, and Mittag (2021), linking CPS ASEC, ACS, and SIPP data with SNAP records in New York State, confirmed the high rate of discrepancies found in earlier studies, and commented that differences were most pronounced for households with Hispanic or Black householders.
- Meyer and Mittag (2019) linked CPS ASEC records from New York State with HUD and state administrative records, and found that 36 percent of housing-assistance recipients did not report receipt in the survey.
These studies indicate that the patterns for discrepancies between survey data and administrative records differ by survey, type of income or program, and, in some cases, by population subgroups. This has implications for the use of administrative records to impute data, develop imputation models, or serve as a substitute for survey data collection, and for the use of administrative records data in promoting data equity. Imputing Social Security benefits, for which centralized, detailed records exist, is likely to result in more accurate data than respondents’ recollections of the benefits they received. Similarly, SNAP files have complete coverage of program participants. Self-employment income may be inaccurate in all sources.
5.5 USING LINKED INCOME DATA TO IMPROVE INCOME STATISTICS
While many of the studies using linked income data from surveys and administrative records have addressed undercoverage, nonresponse, and reporting differences, other studies have looked at the effects of adjusting survey data on outcomes of interest, such as poverty or income
distributions, for the population as a whole and for subpopulations. This section describes two projects at the U.S. Census Bureau that have linked survey and administrative data, and explores their potential for improving understanding of income dynamics and poverty.
Comprehensive Income Dataset Project
The Comprehensive Income Dataset (CID) Project began at the U.S. Census Bureau as an internal project but is now transitioning to one whose product is available to outside researchers at a Federal Statistics Research Data Center. One of the motivating factors for creating the CID was that underreporting of various types of income has worsened over time (Meyer, Mok, & Sullivan, 2015).
The CID links each of four household surveys—the ACS, the CPS ASEC, the SIPP, and the Consumer Expenditure Interview Survey (collected by the U.S. Census Bureau for the Bureau of Labor Statistics)—to administrative records including:
- IRS-supplied tax return data;
- SSA Detailed Earnings Record and Master Beneficiary Record (Social Security and Supplemental Security Income);
- Federal housing assistance data from HUD (including the Public and Indian Housing Information Center and Tenant Rental Assistance Certification System files);
- Medicare and Medicaid enrollment data from the Centers for Medicare & Medicaid Services’ Medicare Enrollment Database and Medicaid and Children’s Health Insurance Program Statistical Information System; and
- Selected state data from SNAP; the Special Supplemental Nutrition Program for Women, Infants, and Children; Temporary Assistance to Needy Families; public assistance programs; and the Low Income Home Energy Assistance Program (see Medalia et al., 2019, pp. 4–5).
Medalia et al. (2019, p. 6) offered anticipated outcomes from the CID Project, “including improving the Census Bureau’s household surveys, becoming a critical resource for policymakers to evaluate policies, programs and taxes, and offering better evidence for researchers investigating a diverse range of topics.” Furthermore, linkage to Social Security and Supplemental Security Income files might permit actual benefit amounts to be substituted for the questions normally asked on income surveys, which could reduce respondent burden and increase accuracy. Such substitution could be expanded to programs administered by states, such as SNAP, if complete and
standardized data reporting from states to the federal government could be achieved.11
Data from the CID Project have been used in numerous research projects.12 For example, Meyer et al. (2021b) concluded that incorporating administrative data has a larger impact near the bottom of the income distribution, and that estimates calculated without incorporating administrative data overestimate poverty and underestimate the anti-poverty effects of safety net programs. In addition, administrative data can shed light on populations not covered by surveys. For example, the sheltered homeless population is excluded or underrepresented in most surveys, and the unsheltered homeless population is excluded from all surveys except the decennial census; using linked data, Meyer et al. (2021a) found persistently low well-being for these populations.
National Experimental Wellbeing Statistics Project
A second comprehensive U.S. Census Bureau project, The National Experimental Well-being Statistics (NEWS) Project, is under way. The NEWS Project is closely related to the CID Project and has the goal of developing better federal income statistics. Rothbaum (2022) discussed the potential of NEWS for expanding the set of income and resource statistics produced by the U.S. Census Bureau and for developing “best possible” estimates for income topics that make use of the range of data available. In addition to producing measures comparable to existing income, resource, and poverty statistics (including inequality), NEWS researchers hope to produce “mobility, opportunity, and volatility” statistics that focus on income and earnings dynamics. The systemic integration of multiple data sources will allow researchers to study and address potential biases from individual data sources (for example, from missing data or misreporting) through linkage with other data sources, and to produce new statistics that would not be possible from a single source.
According to Rothbaum (2022, slides 8–9), data sources for the NEWS Project include surveys such as the ACS and the CPS ASEC as well as the decennial census. The administrative data include IRS and SSA data, the U.S. Census Bureau’s Master Address File, and the Longitudinal Business and Longitudinal Employer-Household Dynamics databases (see Section 4.1). Additional information is included from state and federal programs such
___________________
11 This was recommended by the U.S. Commission on Evidence-Based Policymaking (2017, p. 2): “Where appropriate, states that administer programs with substantial Federal investment should in return provide the data necessary for evidence building.”
12 A partial bibliography can be found at https://cid.harris.uchicago.edu/, which also describes planned future linkages for the project.
as SNAP and programs administered by HUD, the Department of Veterans Affairs, and the Centers for Medicare & Medicaid Services. The Census Bureau also integrates private-sector data on home values into NEWS.
Examples of methodological studies related to specific aspects of NEWS include Jones and Ziliak (2022) on the Earned Income Tax Credit and Fox, Rothbaum, and Shantz (2022) on SNAP. In addition, NEWS researchers are using linked administrative data to adjust CPS ASEC weights for unit nonresponse (Rothbaum & Bee, 2021).
Using Administrative Records to Improve Income Measures
Rothbaum (2019) discussed strengths and limitations of using administrative records to improve measures of income. He listed three options (slide 3): 1) direct replacement, assuming that the administrative records are correct and substituting their information for survey responses (but assuming administrative records are free, or nearly free, from error is a big assumption); 2) using the survey response alone, when administrative records are unavailable or survey results have been shown to be reasonably accurate; or 3) combining information from both sources, since both sources provide information about “true” underlying income but both also have errors.
Bee and Mitchell (2017) suggested that administrative records may improve measurement of earnings, self-employment income, and income for those aged 65 and older. Income for older Americans is often from benefit programs, particularly Social Security and Supplemental Security Income, so direct substitution is possible if timely data are available from the SSA (Rothbaum, 2019, slide 6).
Rothbaum (2019) noted that some earnings (e.g., tips) may be under- or unreported to the IRS but may be reported on surveys. Sources such as the Longitudinal Employer-Household Dynamics database (see Section 4.1) may have information on nontaxable income that is missing from tax records. Rothbaum (2019) advocated improving earnings measurement through first obtaining the “best” estimate of earnings from administrative records, then comparing that estimate with survey data. The process requires guidelines for deciding which estimate is “best” and for which individuals the survey (or administrative record) value is preferred.
Self-employment income is more difficult to adjust through modeling and imputation, and the studies cited in Section 5.4, as well as audit studies, suggest there is substantial underreporting on tax forms and surveys. Some survey respondents report self-employment as wage and salary earnings (or not at all), and for some self-employment income there are no third-party information returns (such as Form 1099). One option is to develop imputation models for self-employment, using relationships between self-employment income and other characteristics from audit studies.
If administrative data are to be used to replace or impute survey items, timeliness of the administrative data is a critical issue. For example, SSA data used for earnings analyses are generally not available until the following year. One approach is to use time-series modeling, assuming that relationships between survey and administrative data within demographic and socioeconomic groups hold across time. Revised annual estimates could be released when the full set of administrative data becomes available, as is done in the National Income and Product Accounts. But tax laws and program administrative rules can change, which can make models developed on earlier data invalid for the current year.
Other challenges include false links and linkage failures as noted in Sections 2.2, 3.6, and 5.3, including the inability to link about 10 percent of survey respondents with administrative records (Rothbaum, 2019, slide 19). Linkage failures may occur because of problems with identification information or because administrative records have limited geographic, time, or population coverage.
In their review of the U.S. Census Bureau Frames project discussed in Section 4.2, Keller et al. (2022, p. 28) commented that “measuring income accurately … would benefit from curating and integrating multiple data sources [particularly in] capturing income for the bottom and top 10 percent of the income distribution where survey data is less useful due to more complex income payments.”13
Income measurement remains an active area for survey and administrative data development. With the development of data linkages, there is great potential for improving federal statistics.
CONCLUSION 5-1: Comparison of survey data with linked administrative records can provide statistical agencies with valuable information on measurement quality as well as guidance for further investigations and improvements.
___________________
13 Better understanding of income, consumption, and wealth is the focus of a 2022 National Academies consensus panel. See https://www.nationalacademies.org/our-work/an-integrated-system-of-us-household-income-wealth-and-consumption-statistics-to-inform-policy-and-research
This page intentionally left blank.


