Facilitating Interdisciplinary Research (2005)
Chapter: Appendix E Survey of Institutions and Individuals Conducting Interdisciplinary Research
E
Survey of Institutions and Individuals Conducting Interdisciplinary Research
To enhance scholarship and collect quantitative data on the impediments, programs, and evaluation criteria related to interdisciplinary research (IDR), the committee developed survey instruments and disseminated them to provosts and others.1 In this appendix, we analyze the results of the committee’s surveys of those interested in IDR, including students, postdoctoral scholars, faculty, funders, policy makers, and disciplinary societies.
The first survey, referred to in the report as the “convocation survey,” was given to the 150 persons who attended the Convocation on Facilitating Interdisciplinary Research, on January 29-30, 2004 (see Appendix C); 91 convocation participants responded to the survey—about a 75 percent return rate. The “individual survey,” a slightly modified version of the convocation survey, was posted on the committee’s Web site. An invitation to participate in the survey was sent to universities, professional societies, nongovernment organizations, and participants in federal and private interdisciplinary programs; 423 people responded to the solicitation. An invitation to participate in a third survey, the “provost survey,” was distributed on line to provosts or vice-chancellors of institutions that conduct IDR; 57 institutions responded.
|
1 |
http://www7.nationalacademies.org/interdisciplinary/SurveyHome.html. The survey instrument for individuals is appended. It differs from the provost survey in question #1. |
It must be noted that the survey population does not represent a random sample. There was undoubtedly selection bias in those who attended the Convocation on Facilitating Interdisciplinary Research and in those who responded to the Web-based survey. The results are representative of a wide population of researchers, but cannot be extrapolated to the entire population of researchers involved in interdisciplinary projects and programs. That said, the findings corroborate and extend previous studies of IDR, and offer unique insights on joint appointments and differences between researchers and administrators, and provide suggestions for how to prioritize change efforts.
DISSEMINATION
The convocation survey was distributed at the convocation in Washington, D.C. and the individual survey was distributed by the following organizations. We made every attempt to distribute the survey as widely as possible. Our strategy was to request larger organizations and umbrella societies in a variety of fields to distribute the survey
-
American Chemical Society (ACS)
-
American Institute of Biological Sciences (AIBS)
-
Association for Integrative Studies
-
Association of American Medical Colleges (AAMC)
-
Association of American Universities (AAU)
-
Association of Independent Research Institutes
-
Biophysical Society
-
Council of Graduate Students (CGS)
-
Federation of American Societies for Experimental Biology (FASEB)
-
National Association of State Universities and Land-Grant Colleges (NASULGC)
-
National Academy of Public Administration
-
National Institutes of Health Bioengineering Consortium (NIH BECON)
-
DOE National Laboratories
-
National Science Foundation (NSF) Engineering Research Centers
-
NSF Frontiers in Integrative Biological Research (FIBR) awardees
-
NSF Integrative Graduate Education and Research Traineeships (IGERT) awardees
-
NSF Science and Technology Centers
-
Washington Science Policy Alliance
The following institutions participated in the provost survey. We received the assistance of NASULGC and AAU in distributing the survey to their member universities.
-
Barnard College
-
Boston University
-
Carnegie Mellon University
-
Cedars-Sinai Medical Center
-
Clarkson University
-
Columbia University
-
Department of Energy Idaho Operations Office
-
Florida State University
-
Georgia State University
-
Instituto Mexicano del Seguro Social
-
Iowa State University
-
Jackson Laboratory
-
Johns Hopkins University
-
Lewis & Clark College
-
Massachusetts Institute of Technology
-
Medical College of Georgia
-
Miami University
-
National Cancer Institute
-
National Dairy Council
-
New York University
-
North Dakota State University
-
Northwestern University
-
Pennsylvania State University
-
Purdue University
-
Simon Fraser University
-
Stanford University
-
Syracuse University
-
Texas A&M University
-
Tulane University
-
University at Buffalo
-
University of Arizona
-
University of California, Irvine
-
University of California, Los Angeles
-
University of California, Santa Barbara
-
University of Chicago
-
University of Cincinnati College of Medicine
-
University of Houston
-
University of Idaho
-
University of Illinois, Chicago
-
University of Maryland, Baltimore County
-
University of Michigan
-
University of Minnesota
-
University of Missouri, Columbia
-
University of North Carolina, Chapel Hill
-
University of Tennessee
-
University of Texas, Austin
-
University of Utah
-
University of Washington
-
Vanderbilt University
-
Virginia Polytechnic Institute and State University
-
Wayne State University
-
Wright State University
SURVEY DEMOGRAPHICS
The committee collected information on respondent position and rank, involvement in IDR, age, and institution type, size, and budget.
Position and Rank
Respondents were predominantly faculty researchers, administrators, or both.
|
|
Convocation |
Individual |
Provost |
|||
|
Position |
n |
% |
n |
% |
n |
% |
|
Student |
2 |
2.2 |
26 |
6.2 |
0 |
0 |
|
Postdoctoral scholar |
0 |
0.0 |
18 |
4.3 |
0 |
0 |
|
Researcher/faculty |
29 |
31.9 |
325 |
76.8 |
3 |
5.3 |
|
Administrator |
26 |
28.6 |
5 |
1.2 |
12 |
21.1 |
|
Researcher/admin. |
17 |
18.7 |
47 |
11.1 |
40 |
70.2 |
|
Funder |
16 |
17.6 |
0 |
0 |
0 |
0 |
|
Other/not answered |
1 |
1.1 |
2 |
0.5 |
2 |
3.5 |
|
Total |
91 |
100.1 |
423 |
100 |
57 |
100.1 |
Respondents to the convocation and provost surveys predominantly held senior positions. The individual survey showed a wider array of ranks, but people holding senior-level positions outnumbered middle-level and junior positions by 2 to 1.
|
|
Convocation |
Individual |
Provost |
|||
|
Rank |
n |
% |
n |
% |
n |
% |
|
Senior |
64 |
70.3 |
194 |
45.9 |
52 |
91.2 |
|
Middle-level |
17 |
18.7 |
113 |
26.7 |
1 |
1.8 |
|
Junior |
6 |
6.6 |
105 |
24.8 |
2 |
3.5 |
|
Not answered |
4 |
4.4 |
11 |
2.6 |
2 |
3.5 |
|
Total |
91 |
100.0 |
423 |
100.0 |
57 |
100.0 |
Age Distribution
Overall, age distribution was fairly normal, with a mean of about 50 years.
|
|
Convocation |
Individual |
Provost |
Total |
||||
|
Age |
n |
% |
n |
% |
n |
% |
n |
% |
|
20-29 |
3 |
3.3 |
31 |
7.3 |
0 |
|
34 |
6.0 |
|
30-39 |
11 |
12.1 |
103 |
24.3 |
1 |
1.8 |
115 |
20.1 |
|
40-49 |
27 |
29.7 |
122 |
28.8 |
7 |
12.3 |
156 |
27.3 |
|
50-59 |
35 |
38.5 |
95 |
22.5 |
30 |
52.6 |
160 |
28.0 |
|
60-69 |
11 |
12.1 |
48 |
11.3 |
12 |
21.1 |
71 |
12.4 |
|
>70 |
3 |
3.3 |
6 |
1.4 |
0 |
|
9 |
1.6 |
|
Not answered |
1 |
1.1 |
18 |
4.3 |
7 |
12.3 |
26 |
4.6 |
|
Total |
91 |
100.1 |
423 |
99.9 |
57 |
100.1 |
571 |
100.0 |
Type of Institution
The majority of respondents were working at public academic institutions. About half as many worked at private academic institutions. (See Figure E-1.) Industry researchers, funders, and disciplinary-society representatives were targeted for participation only at the convocation and are not represented in the individual or provost survey populations.
|
|
Convocation |
Individual |
Provost |
|||
|
Type of Institution |
n |
% |
n |
% |
n |
% |
|
Public academic |
42 |
46.2 |
264 |
62.4 |
33 |
57.9 |
|
Private academic |
15 |
16.5 |
122 |
28.8 |
17 |
29.8 |
|
Industrial R&D org. |
2 |
2.2 |
3 |
0.7 |
0 |
|
|
Government R&D org. |
3 |
3.3 |
17 |
4.0 |
3 |
5.3 |
|
Indep. research inst. |
3 |
3.3 |
9 |
2.1 |
1 |
1.8 |
|
Public funding inst. |
9 |
9.9 |
8 |
1.9 |
0 |
|
|
Private funding inst. |
8 |
8.8 |
0 |
|
0 |
|
|
Professional society |
6 |
6.6 |
0 |
|
0 |
|
|
Other/not answered |
8 |
8.8 |
0 |
|
3 |
5.3 |
|
Total Surveys (Totala) |
91(96) |
105.6 |
423 |
101.8 |
57 |
100.1 |
|
aSome respondents gave multiple answers to this question. Percent is calculated using the total number of surveys returned, and may add up to more than 100%. |
||||||
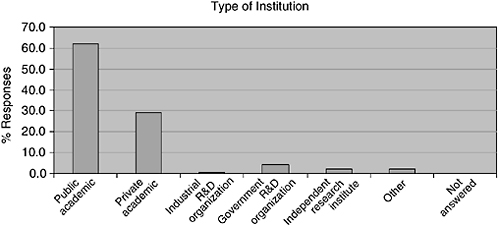
FIGURE E-1 Type of institutions responding.
Size, Budget, and Number of Researchers
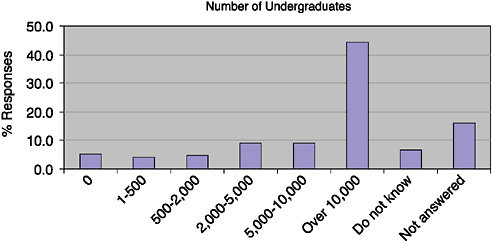
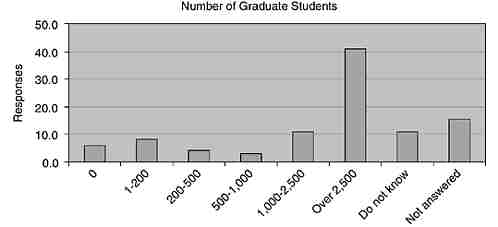
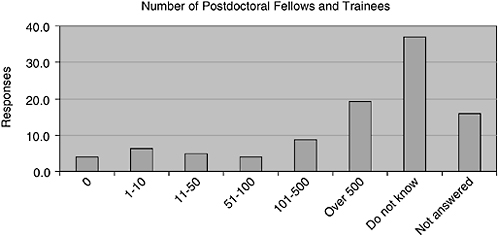
Survey respondents were asked to indicate the annual budget of their institutions and the numbers of faculty, undergraduates, graduate students, and postdoctoral fellows (see Figure E-2). It appears that most respondents were working at large research institutions. Annual budgets showed a bimodal distribution, with peaks at $10 million–100 million and over $1 billion. At the same time, almost half the respondents indicated that they

FIGURE E-3 Number of faculty and researchers at the respondents’ institutions.
were not aware of their institutions’ annual budget. Responses indicated that institutions tended to have over 500 faculty, 10,000 undergraduates, and over 2,500 graduate students (Figures E-3, E-4, and E-5). Most respondents did not know how many postdoctoral fellows were at their institutions (Figure E-6).
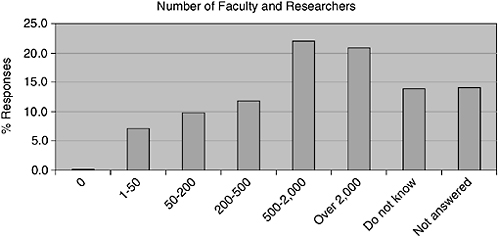
FIGURE E-2 Annual institutional budgets.
RELATIONSHIP TO INTERDISCIPLINARY RESEARCH
Participation in Interdisciplinary Research
In the combined surveys, 94 percent of respondents were at least partially involved in IDR.
|
|
Convocation |
Individual |
Provost |
|||
|
Participation |
n |
% |
n |
% |
n |
% |
|
Primarily interdisciplinary |
53 |
58.2 |
263 |
62.2 |
24 |
42.1 |
|
Partially interdisciplinary |
28 |
30.8 |
147 |
34.8 |
22 |
38.6 |
|
Not interdisciplinary |
0 |
|
12 |
2.8 |
4 |
7.0 |
|
Not answered |
10 |
11.0 |
1 |
0.2 |
7 |
12.3 |
|
Total |
100.0 |
|
433 |
102.4 |
57 |
100.0 |
Specific Roles
Respondents were asked to indicate how they were involved in IDR. This was a free-answer section; responses were analyzed and categorized by staff. Because more than one answer could have been provided, results may add up to more than 100 percent.
|
|
Convocation |
Individual |
Provost |
|||
|
Involvement in IDR |
n |
% |
n |
% |
n |
% |
|
Oversee or support IDR programs |
19 |
23.5 |
0 |
0 |
45 |
97.8 |
|
Fund IDR programs or grants |
14 |
17.3 |
0 |
0 |
|
|
|
Research is interdisciplinary |
41 |
50.6 |
366 |
89.3 |
23 |
50.0 |
|
Collaborate with others in different disciplines |
3 |
3.7 |
97 |
23.7 |
2 |
4.3 |
|
Head/director of IDR program |
7 |
8.6 |
28 |
6.8 |
1 |
2.2 |
|
Involved with IDR training program or teach IDR classes |
2 |
2.5 |
18 |
4.4 |
1 |
2.2 |
|
Editor of IDR journal |
0 |
0.0 |
2 |
0.5 |
0 |
0 |
|
Other |
8 |
9.9 |
8 |
2.0 |
0 |
0 |
|
Total involved in IDR |
81 |
|
410 |
|
46 |
|
|
Not interdisciplinary or not answered |
10 |
|
13 |
|
11 |
|
Ranking of Institutional Environment for IDR
Respondents were asked to rank the general supportiveness for IDR at their current institution and up to two previous institutions on a scale of 0 (IDR-hostile) to 10 (IDR-supportive). There appears to be a trend toward more supportive environments for IDR. It is possible that respondents moved to institutions that were more supportive during the course of their careers. Rankings are reported as mean +/– standard deviation. Not all respondents provided an answer. The total number of responses to this question was n = 480.
|
Environment for IDR |
Convocation |
Individual |
Provost |
|
Current institution |
7.74 +/– 2.07 |
7.25 +/– 2.31 |
7.24 +/– 1.70 |
|
Previous institutions |
5.95 +/– 2.17 |
6.35 +/– 2.57 |
5.67 +/– 2.04 |
To determine whether rank was associated with institution size or budget, we sorted the rankings by annual budget, number of faculty, and number of undergraduates (see Figures E-7 and E-8). There was no relationship between number of undergraduates and ranking, but there are some interesting trends for budget and number of faculty. It appears that smaller or larger institutions have a better environment for IDR than those with intermediate budget and faculty numbers.
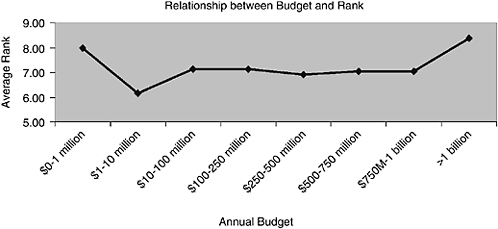
FIGURE E-7 Relationship between institutional budget and rank.
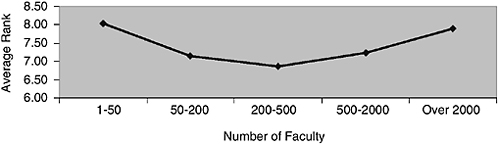
FIGURE E-8 Relationship between number of faculty and rank.
INTERDISCIPLINARY RESEARCH AT INSTITUTIONS
When asked whether there were impediments to IDR at their current institutions, 70.7 percent of the respondents answered yes, 23.2 percent answered no, and 6.2 percent did not know or did not answer (see Figure E-9).
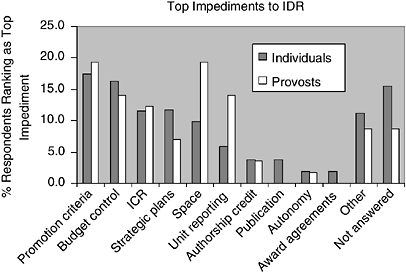
FIGURE E-9 Top impediments to interdisciplinary research at various institutions.
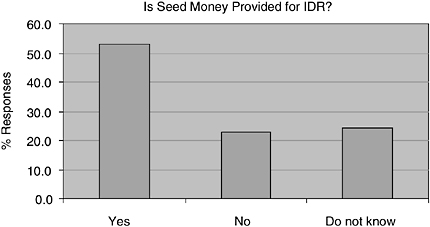
FIGURE E-10 Survey results as to whether seed money was provided for IDR.
Respondents were provided a list and asked to rank the top five impediments to IDR at their institutions (see Figure 4-5). The list2 included budget control, indirect-cost recovery (ICR), publication in disciplinary and interdisciplinary journals, compatibility with college or department strategic plans, promotion and tenure criteria, credit for joint authorship, unit reporting relationships, space allocation, honoring award agreements, restrictions on faculty autonomy, and other. The chart indicates the percentage of respondents who gave an impediment top ranking. It is interesting to note that “individuals” and provosts ranked impediments differently. Furthermore, impediments often mentioned in research literature–authorship credit and publication–were among the lowest ranked by both respondent groups. The impediments that were most often ranked first by “individuals” were promotion criteria, budget control, ICR, and compatibility with strategic plans. For provosts, the top impediments were promotion criteria, space allocation, budget, and ICR.
Seed Money
Respondents were asked whether their institution provided seed money to help start up interdisciplinary programs and were asked to briefly describe the amounts available and the major criteria used in making awards. Over half the institutions provided such “venture capital” for interdisciplinary work. Amounts provided ranged from $1,000 to $1 million. Duration of awards also varied but tended to be short: 1- to 2-year grants (see Figures E-10, E-11, and E-12).
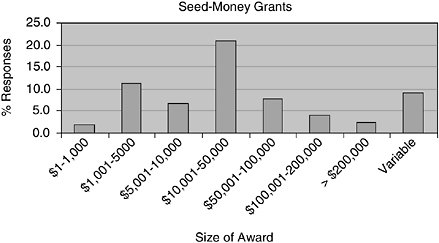
FIGURE E-11 Seed money grants and the size of the award.
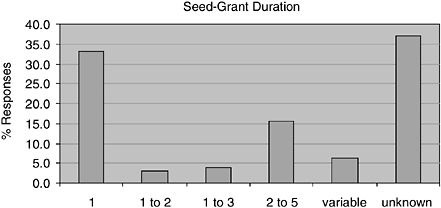
FIGURE E-12 Duration of the seed grant.
Three main criteria were cited by survey respondents for evaluating proposals for seed money:
-
What is the likelihood that this project or program, once developed, would generate outside funding? (21 percent)
-
What is the scientific merit of the work? (20 percent)
-
Is the work truly interdisciplinary? (20 percent)
“Other” responses (19.8 percent) ranged from selection-committee biases to university or department long-term strategic goals. Respondents often cited more than one criterion for determining seed-money allocation; therefore, the percentage of responses (based on the number of respondents) exceeds 100 percent (see Figure E-13).
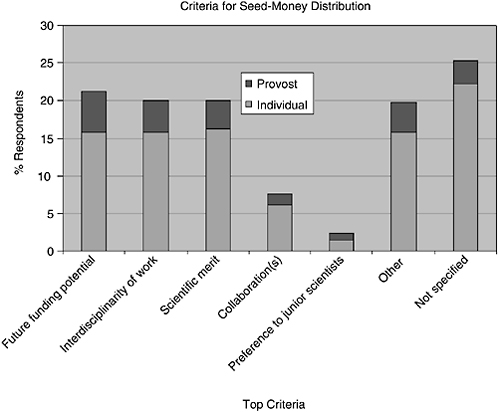
FIGURE E-13 Criteria for seed-money distribution.
Joint Appointments
When asked whether their institutions made joint appointments for interdisciplinary faculty or staff in which salary is shared, most respondents answered yes. However, in most cases, fewer than 10 percent of the faculty at the respondents’ institutions held such joint positions.
|
|
Individual |
Provost |
||
|
Shared Salary for Joint Appointments? |
n |
% |
n |
% |
|
Yes |
249 |
58.9 |
42 |
73.7 |
|
No |
85 |
20.1 |
12 |
21.0 |
|
Do not know |
88 |
20.8 |
2 |
3.5 |
|
Not answered |
1 |
0.2 |
1 |
1.8 |
|
Total |
423 |
100.0 |
57 |
100.0 |
|
|
Individual |
Provost |
||
|
Proportion of Such Joint Appointments |
n |
% |
n |
% |
|
0-10% |
190 |
76.3 |
33 |
78.6 |
|
10-25% |
24 |
9.6 |
7 |
16.7 |
|
Over 25% |
6 |
2.4 |
1 |
2.4 |
|
Did not answer |
29 |
11.6 |
1 |
2.4 |
|
Total (based on those who answered yes above) |
249 |
100 |
42 |
100.1 |
Interdisciplinary Programs and Characteristics
Respondents were asked to list and describe up to three interdisciplinary programs at their institutions with which they were currently involved, including centers and teaching programs. They were asked to indicate the number and name of each involved department, whether extra-institutional groups were involved, the number of researchers, whether there were associated faculty lines or training slots, the sources of funding, whether there was a central facility for the program, and how space was allocated. Over 800 programs were described, and this yielded rich data for anyone interested in examining the current organizational structure of IDR programs and centers. Among the findings, respondents indicated that 29.5 percent of the centers and programs did have faculty lines, whereas 33.3 percent did not; 12.3 percent stated that faculty lines did not apply to the program listed, and 24.7 did not know or did not provide an answer. The percentage of associated training slots was higher: 40.9 percent of programs listed had such slots, 23.1 percent did not.
EVALUATION OF INTERDISCIPLINARY RESEARCH PROGRAMS
Respondents were asked to describe dominant forms of evaluation used by their institutions to evaluate interdisciplinary programs. The predominant methods of evaluation were internal and external visiting committees and informal feedback. Percentages add up to more than 100 because respondents could choose more than one answer.
|
|
Individual |
Provost |
||
|
Institutional Evaluation Methods |
n |
% |
n |
% |
|
Internal committee |
148 |
35.0 |
38 |
66.7 |
|
Visiting committee |
130 |
30.7 |
46 |
80.7 |
|
Informal feedback |
122 |
28.8 |
30 |
52.6 |
|
Principal-investigator assessment |
113 |
26.7 |
24 |
42.1 |
|
Interviews |
25 |
5.9 |
7 |
12.3 |
|
Benchmarking surveys |
20 |
4.7 |
10 |
17.5 |
|
Do not know |
155 |
36.6 |
1 |
1.8 |
|
Other |
24 |
5.7 |
6 |
10.5 |
|
Not answered |
35 |
8.3 |
3 |
5.3 |
|
Total answers |
423 |
|
57 |
|
Respondents were also asked to report the top three methods that they used to evaluate the success of interdisciplinary programs. Respondents were provided a list and the opportunity to enter other options. The predominant IDR evaluation methods varied between individual researchers and provosts. For both groups, the top two choices were potential for innovation and increasing institutional funding. Provosts ranked enhancing the reputation of their institutions third, and individual researchers ranked enhancing student experiences third.
|
|
Individual |
Provost |
||
|
Personal Evaluation Methods |
n |
% |
n |
% |
|
Level of (or potential for) scientific discovery or innovation |
239 |
56.5 |
46 |
80.7 |
|
Increasing institution’s research funding |
156 |
36.9 |
33 |
57.9 |
|
Enhancing richness of undergraduate or graduate experience |
150 |
35.5 |
22 |
38.6 |
|
Enhancing institution’s reputation |
132 |
31.2 |
25 |
43.9 |
|
Increasing ability to attract outstanding faculty or postdoctoral scholars |
123 |
29.1 |
28 |
49.1 |
|
Societal relevance of problem being addressed |
97 |
22.9 |
15 |
26.3 |
|
Quality of leadership |
95 |
22.5 |
25 |
43.9 |
|
Attracting greater number or mix or caliber of undergraduates into science |
87 |
20.6 |
7 |
12.3 |
|
Do not know |
59 |
13.9 |
2 |
3.5 |
|
Other |
26 |
6.1 |
7 |
12.3 |
|
Not answered |
32 |
7.6 |
1 |
1.8 |
|
Total number of surveys |
423 |
|
57 |
|
PROPOSED RECOMMENDATIONS
Finally, respondents were asked to list one action that each stakeholder group could take to best facilitate IDR. Responses were categorized and are illustrated below in graphs for institutions, units and departments, funders, journal editors, principal investigators and team leaders, educators, post-doctoral scholars, and students. These were free-response questions; staff analyzed and categorized the responses. Percentages are based on the numbers of responses provided for each category.
The top three recommendations for institutions (n = 341) were to foster a collaborative environment (26.5 percent), to provide faculty incentives (including hiring and tenure policies) that reflect and reward involvement in IDR (18.4 percent), and to provide seed money for IDR projects (11.1 percent). See Figure E-14.
The top three recommendations for departments (n = 294) were to adopt new organizational approaches to IDR (32.1 percent), to recognize and reward faculty and other researchers for interdisciplinary work (20.8 percent), and to adapt or increase departmental resources to support IDR (12.3 percent). See Figure E-15.
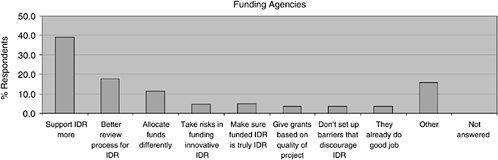
The top three recommendations for funding agencies (n = 266) were to provide more support for IDR (39.1 percent), to develop and implement a more effective review process for IDR proposals (17.7 percent), and to rethink funding allocation strategies (11.3 percent). See Figure E-16.
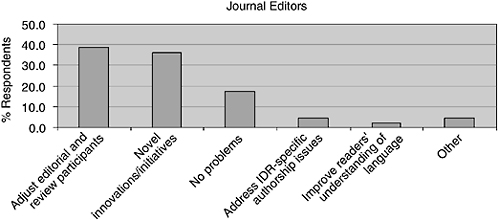
The top two recommendations for journal editors (n = 196) were to adjust the expertise of editorial and review panels and incorporate more reviewers with IDR experience (38.8 percent) and to feature novel innovations and initiatives (36.2 percent); 17.3 percent of respondents reported that they were satisfied with the current situation. See Figure E-17.
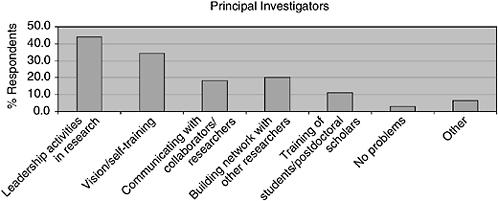
The top three recommendations for principal investigators (n = 186) were to increase leadership and team-forming activities (44.1 percent), to develop and clearly state their research goals and their overall vision (34.4 percent), and to build networks with researchers in other disciplines (20.4 percent). See Figure E-18.
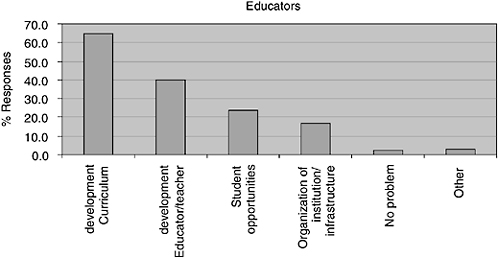
Respondents (n = 190) recommended that educators develop curricula that incorporate interdisciplinary concepts (64.7 percent), take part in teacher-development courses on interdisciplinary topics (40 percent), and provide student opportunities in IDR (23.7 percent). See Figure E-19.
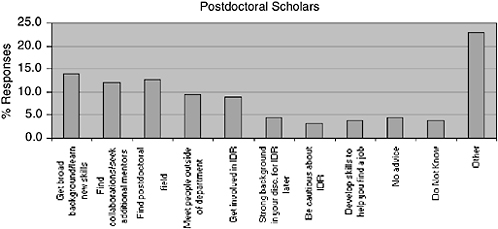
Respondents (n = 157) encouraged postdoctoral scholars to get a broad background and learn new skills (14.0 percent), to find a postdoctoral fellowship in a field different from their own graduate work (12.7 percent), and to develop collaborations and seek additional mentors (12.1 percent). See Figure E-20.
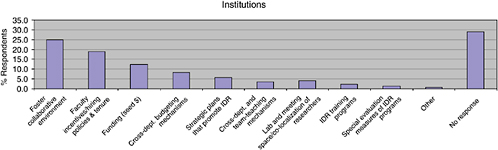
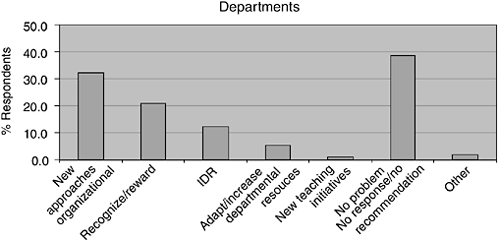
FIGURE E-15 Departmental recommendations for adapting approaches to IDR.
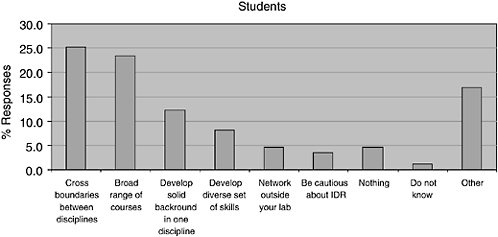
Finally, respondents (n = 171) recommended that students cross boundaries between disciplines (25.1 percent), take a broad range of courses (23.4 percent), but also develop a solid background in one discipline (12.3 percent). See Figure E-21.
THE “INDIVIDUAL” IDR SURVEY
Demographics
-
Please tell us about yourself:
__ Researcher/faculty member
__ Administrator
__ Student
__ Postdoc
Rank:
__ Senior
__ Mid-level
__ Junior
Age: _____
Describe your research:
__ Primarily interdisciplinary
__ Partially interdisciplinary
__ Not interdisciplinary
-
Which of these best describes your institution?
-
__ Public Academic
-
__ Private Academic
-
__ Industrial R&D organization
-
__ Government R&D organization
-
__ Independent research institute
-
__ Other (Please describe): _______________________________
-
-
What is the size of your institution?
-
Annual budget:
-
|
__ $0-1 Million |
__ $100-250 M |
__ $750 M-1 Billion |
|
__ $1-10 M |
__ $250-500 M |
__ >$1 B |
|
__$10-100 M |
__$500-750 M |
__Do Not Know |
-
If research institution, number of:
|
Faculty/ Researchers |
0 |
1-50 |
50-200 |
200-500 |
500-2000 |
Over 2000 |
Do Not Know |
|
Undergraduates |
0 |
1-500 |
500-2000 |
2000-5000 |
5000-10,000 |
Over 10,000 |
Do Not Know |
|
Graduate Students |
0 |
1-200 |
200-500 |
500-1000 |
1000-2500 |
Over 2500 |
Do Not Know |
|
Postdoctoral Researchers, Fellows, and Trainees |
0 |
1-10 |
11-50 |
51-100 |
101-500 |
Over 500 |
Do Not Know |
Relationship to Interdisciplinary Research
-
How are you involved with interdisciplinary research?
-
Based on your personal experiences, rate your present institution and prior institutions (that you feel able to judge) on general supportiveness of interdisciplinary research (IDR) using a scale from 0 (IDR-hostile) to 10 (IDR-friendly):
Interdisciplinary Research at Your Institution
-
Are there impediments to interdisciplinary research at your institution?
Yes ______ No ______ Do Not Know ______
If yes, please indicate the top 5 impediments in order of importance.
__ Budget control
__ Indirect cost recovery distribution
__ Publication in disciplinary/interdisciplinary journals
__ Compatibility with college/dept strategic plans
__ Promotion and tenure criteria
__ Credit for joint authorship
__ Unit reporting relationships
__ Space
__ Honoring award agreements
__ Restrictions on faculty autonomy
__ Other_____________________________
-
Does your institution provide seed money to help start up interdisciplinary programs? If yes, please briefly describe the amounts available and major criteria employed in making awards.
Yes ______ No ______ Do Not Know ______
-
If yes, please indicate:
Amount:
Duration:
Award Criteria:
-
Does your institution make joint appointments for interdisciplinary faculty/staff members in which salary support is shared between departments, units, and/or schools?
Yes ______ No ______ Do Not Know ______
If yes, what proportion of the faculty/staff have such joint appointments?
__0-10% __10-25% __Over 25%
-
Using the table below, please list and describe up to three interdisciplinary program(s) at your institution with which you are currently involved. These programs could be centers, organized research units (ORUs), teaching programs, etc.
|
|
A |
B |
C |
|
Program/Center Name: |
|
|
|
|
URL: |
|
|
|
|
Contact person: |
|
|
|
|
Phone #/e-mail: |
|
|
|
|
i. Number of involved depts/ schools/colleges |
__ 1 __Don’t know __ 2-4 __ 5-10 __ Over 10 |
__ 1 __Don’t know __ 2-4 __ 5-10 __ Over 10 |
__ 1 __Don’t know __ 2-4 __ 5-10 __ Over 10 |
|
ii. List the primary depts. involved |
|
|
|
|
iii. Extrainstitutional groups involved? |
__ Yes __ No __ Don’t know |
__ Yes __ No __ Don’t know |
__ Yes __ No __ Don’t know |
|
iv. Number of Researchers |
__1-5 __5-10 __10-20 __Over 20 __Don’t know |
__1-5 __5-10 __10-20 __Over 20 __Don’t know |
__1-5 __5-10 __10-20 __Over 20 __Don’t know |
|
|
A |
B |
C |
|
v. Faculty Lines? |
__Yes __No __Don’t know __Not applicable |
__Yes __No __Don’t know __Not applicable |
__Yes __No __Don’t know __Not applicable |
|
vi. Source of Funding? |
__ DoD __ DoE __ NASA __ NIH __ NSF __ Foundation: __ Institutional: __ Don’t know __ Other: |
__ DoD __ DoE __ NASA __ NIH __ NSF __ Foundation: __ Institutional: __ Don’t know __ Other: |
__ DoD __ DoE __ NASA __ NIH __ NSF __ Foundation: __ Institutional: __ Don’t know __ Other: |
|
vii. Central Facility? |
__ Yes __ No __ Don’t know |
__ Yes __ No __ Don’t know |
__ Yes __ No __ Don’t know |
|
viii. Space Allocation |
__ Project-driven __ Researcher-specific __ Don’t know |
__ Project-driven __ Researcher-specific __ Don’t know |
__ Project-driven __ Researcher-specific __ Don’t know |
|
ix. Training Slots? |
__ Yes __ No __ Don’t know |
__ Yes __ No __ Don’t know |
__ Yes __ No __ Don’t know |
Evaluation of Interdisciplinary Research Programs
-
What are the dominant methods of evaluation employed by your institution to evaluate interdisciplinary programs? (check all that apply)
__ Visiting Committee
__ Internal Committee
__ Benchmarking Surveys
__ Interviews
__ Informal Feedback
__ Principal Investigator Assessment
__ Do not know
__ Other (Please describe):
-
What are the dominant methods you use to evaluate the success of interdisciplinary programs? (select up to three or add your own).
__ Level of (or potential for) scientific discovery or innovation
__ Quality of leadership
__ Attracting a greater number/mix/caliber of undergraduates into science
__ Enhancing the richness of the undergraduate/graduate experience
__ Increasing the ability to attract outstanding faculty/postdocs
__ Societal relevance of problem being addressed
__ Enhancing institution’s reputation
__ Increasing institution’s research funding levels
__ Do not know
__ Other (Please describe):
Proposed Recommendations
-
If you could recommend one action each of the following could take that would best facilitate interdisciplinary research, what action would that be?
-
Institutions:
-
Units/Departments:
-
Funding Agencies:
-
Journal Editors:
-
Principal Investigators/Team Leaders:
-
Educators:
-
Postdocs:
-
Students:
-


