Review of the Long-Term Operations of the Central Valley Project and the State Water Project (2026)
Chapter: Appendix B: Background Information Relevant to the Central Valley Project and the State Water Project
Appendix B
Background Information Relevant to the Central Valley Project and the State Water Project
This appendix begins with a description of the social history of the Delta region over the past 150 years. It describes how the Central Valley Project (CVP) and the State Water Project (SWP) were developed and the water resources infrastructure that makes up the Projects. It ends with a description of the primary user groups of both projects.
RECENT HUMAN HISTORY IN THE DELTA REGION
It is generally accepted that humans have lived in California fewer than 15,000 years, although recent and hotly disputed findings (Callaway, 2018) suggest humans may have been present more than 100,000 years ago. The human presence prior to the 1800s was unremarkable in terms of its effect on water resources in the region. This situation changed in the middle of the 19th century with the discovery of gold in 1848, intensive European immigration into California after 1849, statehood in 1850, and then the gradual shift to agriculture as the underlying economic force of the state. Indeed, California’s economy and population have transformed several times, from a mining economy, to an agricultural economy, to a manufacturing economy, and now a mixed, mostly service-based economy. Since 2017, California has been the fifth largest economy in the world.1 Its population in 2023 was 39.1 million.2 Throughout the state’s recent history, global markets for California’s mining, agricultural, and other products have continually reshaped water uses and demands.
Mining
The initial growth in California’s population, occurring about 175 years ago, was due to gold mining from 1848 to 1888, beginning with the California Gold Rush. For some time, mining was the base for California’s economy, leading to a large influx of immigrants to expand and support the enterprise. The impact of mining on water resources in the region was substantial (Gilbert, 2017; James, 2004; James and Singer, 2008; Kelley, 1998) and due to extensive hydraulic mining from stripping hillsides and mining dredges that produced vast mine tailings. By 1884, hydraulic mining was banned by several court rulings, most accessible gold was depleted, and the accumulated mine tailings were disrupting navigation, flooding lands, and impeding agricultural development.
___________________
1 See https://www.gov.ca.gov/2024/04/16/california-remains-the-worlds-5th-largest-economy/.
2 See https://calmatters.org/commentary/2024/05/population-decline-california-grows-again/.
Providing access and services for the mines relied on water transportation, hence the development of steamship lines and ports up California’s major rivers through the Delta as far north as Red Bluff on the Sacramento River and south beyond Stockton on the San Joaquin River, and sometimes into Tulare Lake and the Kern River with high water. Accessibility improved with railroad and road expansions in the late 1800s along with waterborne commerce to support expansions in agricultural production, which replaced mining as California’s new economic base in the late 1800s.
Agriculture
The variable climate in California has made it challenging to support irrigation in a region that was otherwise almost ideal for profitable agriculture serving continental and global markets. Hence, the decline in mining was followed by extensive irrigated agriculture and associated land development in the Delta region from the 1850s to about 1930. The water navigation routes and railroads developed to support mining were converted to move agricultural products to regional and international markets.
Early intensive agriculture in California largely began in the Sacramento-San Joaquin Delta. Immigrant farmers from humid regions of the eastern United States knew little of irrigation or institutions and laws needed to support irrigation in such a variable climate as California. Hence, in the Delta and along streams in the region, irrigation was organized by individual landowners or small groups of landowners. These early irrigation systems had little or no seasonal or overyear water storage infrastructure. This lack of water management infrastructure left these regions vulnerable to droughts as well as floods.
Later in the 1800s and the early 1900s, land and water in the Sacramento and San Joaquin valleys were developed extensively for irrigated agriculture via the construction of many local levee systems with irrigation diversions and canals. In the later 1800s, larger irrigation districts were organized to convey water from streams to more distant fields. In the wetter Sacramento Valley, large unirrigated fields of wheat supported a growing agricultural economy. Nonetheless, the overall lack of water and unfamiliarity with irrigation technology and institutions slowed the use of irrigated agriculture in Central California (Pisani, 1984).
By the early 1900s, agricultural diversions from streams greatly diminished summer inflows to the Delta, allowing increased salinity intrusion into the Delta. This salinity intrusion harmed Delta towns and agricultural users and became a major motivation for developing large regional and inter-regional water storage and conveyance infrastructure to store water from the wet winters for dry irrigation seasons and move it from wetter to drier regions. The need for inter-regional water infrastructure became the subject of state water plans, beginning in the 1880s and more intensively in the 1920s. These efforts culminated in California’s first State Water Plan in 1930. This plan proposed a large reservoir on the Sacramento River and pumping from the south Delta (near Stockton), which would reverse summer flows along the San Joaquin River to better support irrigation in the southern Central Valley. The storage of winter flows from the Sacramento Valley was seen as essential to supply summer irrigation water and Delta outflows without an expensive physical ocean salinity barrier in the western Delta (CDWR, 1930).
Today, agriculture is the largest human water use in California. The U.S. Geological Survey (USGS) indicates that roughly 60 percent of statewide water withdrawals go to the state’s agricultural sector.3 The availability of water has been the major factor in the development of California’s agricultural sector, which made up about 5 percent of California’s total economic output in 2012 (Johnson and Cody, 2015). About 9.6 million acres in agricultural production in California were irrigated in 2019, or about 9 percent of the total land in the state (Mount and Hanak, 2019). California accounts for about one-fourth of total applied volume of irrigated water in the United States, growing from 26 million acre-feet (MAF) in 1960 to 34 million in 2023. Local and regional water sources, water imported from other regions (often using CVP and SWP facilities), and groundwater overdraft have been principal water supplies for agriculture.
___________________
3 See https://www.usgs.gov/centers/california-water-science-center/science/california-water-use.
Diking and Draining of the Delta
One reason for agriculture’s rise in Central California was the abundant freshwater available, such that most of the Delta was diked and drained, forming agricultural islands. Hundreds of thousands of acres of wetland were converted to agriculture over the past 150 years, bringing about not only the destruction of wetland habitat (since the early 1800s, 97 percent of wetlands have been lost; Whipple et al., 2012) but also the oxidation of the Delta’s peat soils as they were exposed to the atmosphere. These peat soils were produced from the decay of marsh plants over roughly 6,000 years since sea levels rose to first flood western and central parts of the Delta.
Initially, the agricultural islands formed in the Delta were near sea level and hence were irrigated simply by using tidal gates to irrigate near high tides and drain near low tides (Thompson, 1957). However, as lands subsided below low tide, pumping was needed to keep islands drained for agriculture. They could be watered with siphons. Many islands today have extensive irrigation and drainage networks with pumps and siphons.
The lands in the Sacramento-San Joaquin Delta have been subsiding since they were first drained for agriculture and exposed to oxygen and California’s warm temperatures (Deverel and Rojstaczer, 1996; Drexler et al., 2007; Thompson, 1957). These lands continue to oxidize and subside, though usually at a slower rate as the peat layers thin.
From this subsidence, thousands of acres of Delta lands are now 5 to 25 feet below sea level. More than 1,000 miles of levees resist the flooding of Delta lands. However, over time, levee failures have led to the abandonment of some subsided lands to become tidal lakes within the Delta, where the cost of recovery exceeded the productive value of these lands (such as Franks Tract, Liberty Island, and Mildred Island) (Lund et al., 2010). The strengthening of Delta levees has been supported by the state and local landowners, and has greatly improved their reliability, but substantial residual failure risk remains (Suddeth et al., 2010). Failures usually occur because of floods or levee work errors, but some have had unclear causes (such as Jones Tract in 20044), with large earthquakes and larger floods being a particular concern.
Urban Development
Urban development in the Central Valley began with Sacramento in 1848. Mining and agriculture were the economic bases for growing urbanization in the Valley, followed by manufacturing and now services. Growing towns and cities, initially depending on water transportation, faced winter flooding during this period (Kelley, 1998). Their growth and improved understanding of flooding led to the construction of a system of levees and river bypasses in the Sacramento Valley in the early 1900s, followed by the use of new reservoirs for flood control (as well as water supply) in the mid-1900s. Protection from floods has allowed major urban areas in the Delta region (such as Sacramento and Stockton) to grow considerably in terms of population and the economy. The region is inherently flood-prone, and flood vulnerability especially affects small river towns in the Sacramento Valley.
Demographics
The population of California was estimated to be about 92,000 in 1850,5 although the indigenous population was not included in the census. The state’s population increased to 10.7 million in 1950, with a growth rate of almost 25 percent per year during World War II, 1940–1945.6 The population was 20 million in 1971, and 30 million in 1991, and reached its peak of just over 39 million in 2024.7 The growing population, strong economy, including irrigated agriculture, and climate change are placing increasing demands on water and other natural resources in the state. With this growth came increased demand for reliable water supplies. Figure B-1 shows the trends and projections in California’s population from 1850 to 2100 with certain water resources milestones overlaid.
___________________
4 See https://damsafety.org/content/2004-failure-jones-tract-levee-potential-causes-and-repair-details.
5 See https://www2.census.gov/library/publications/decennial/1900/bulletins/demographic/10-population-ca.pdf.
6 See https://www.macrotrends.net/global-metrics/states/california/population.
7 See https://www.ppic.org/publication/californias-population/.
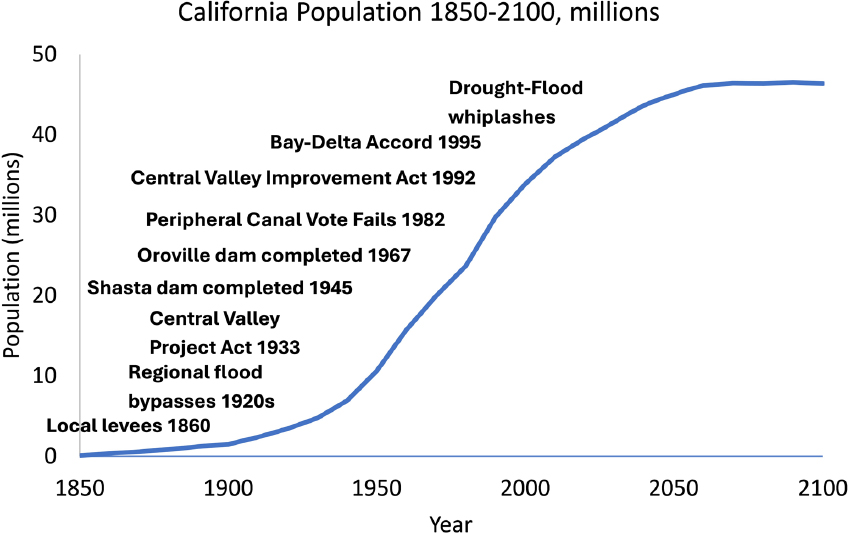
SOURCE: Data from U.S. Census to 2020 and California Department of Finance to 2100; https://dof.ca.gov/forecasting/demographics/projections/.
THE CENTRAL VALLEY PROJECT AND THE STATE WATER PROJECT
The federal CVP and California’s SWP are inter-regional water projects that have become foundational water infrastructure for California’s metropolitan and agricultural economies since about 1950. Table B-1 provides a timeline of major events that have shaped the development of the CVP and SWP for the past 150 years.
History of Project Development
State-led project planning for large-scale water supply development began with extensive studies and plans in the 1920s and a state project proposal in 1930 (CDWR, 1930). However, in the 1930s, the state was unable to sell bonds to fund project construction, so the project was taken over and re-developed under the U.S. Bureau of Reclamation (USBR) as a Great Depression-subsidized public works project and renamed the Central Valley Project. This project would enable expansion of irrigated land into the San Joaquin and Tulare basins, provide additional water supplies for the San Francisco Bay area, and mitigate salinity intrusion into the Delta. Early water management was not concerned with native species and ecosystems, because these species were considered to be abundant and with little potential for long-term economic development compared to agriculture.
In the 1950s and 1960s, growing demands for water from burgeoning metropolitan areas and agriculture (mostly in the Tulare basin) and diminished federal interest in water projects renewed state interest in developing a state water project to expand deliveries to these areas (with costs repaid by water users) and to provide ancillary flood, recreation, and hydropower benefits (Hundley, 2001). The California Water Plan of 1957 outlined this plan with an initial large storage reservoir on the Feather River in the Sacramento Valley, a major pumping plant in the south Delta, and the California Aqueduct and San Luis Reservoir (new off stream storage to be shared with the CVP) to move water to the San Francisco Bay area, the Tulare basin, and Southern California cities. The plan envisioned extensive expansions over time with additional reservoirs, aqueducts, and pumping plants on other streams, including a large peripheral canal to take water gathered from Northern California to intakes for the California Aqueduct. Pre-existing water right holders were integrated into the SWP with priority contracts for SWP deliveries.
TABLE B-1 Timeline of Events Relevant to the CVP and SWP
| Year(s) | Events |
|---|---|
| 1849 | Gold discovered in California, beginning of great immigrations |
| 1850s | Diking and draining of Delta islands begins; Delta land subsidence begins |
| 1884 | Court rulings largely end hydraulic mining |
| 1850s–1920s Local Land, Water, and Irrigation Development | |
| 1864, 1907 | Major floods occur |
| 1910–1930s | Upstream irrigation causes summer Delta salination; San Joaquin Valley overdraft and land subsidence begins |
| 1924, 1928–1934 | Major droughts occur |
| 1920–1982 Inter-Regional and Statewide Water Project Development | |
| 1928–1931 drought | “The Great Crusade for Fresh Water”; Recession shifts 1930 California state water project proposal to federal CVP |
| 1939 | Metropolitan Water District of Southern CA Colorado River Aqueduct |
| 1940s–1982 | CVP expands supplies to Tulare basin, San Joaquin Valley, and San Francisco Bay Area |
| 1959 | Delta Protection Act |
| 1960 | Statewide vote to start the SWP |
| 1969–1985? | SWP expands supplies to Tulare basin, Southern California, and San Francisco Bay Area |
| 1976–1977 | Major post-project drought occurs, causing local and regional innovations |
| 1982 | Peripheral Canal rejected by voters |
| 1983–2000 Return to Local and Regional Innovation | |
| 1986 | Overbite clam invasion |
| 1987–1992 drought | Local and regional expansions in urban water conservation, water markets, groundwater storage, and new surface storage |
| Environmental water requirements grow; Agriculture shifts to permanent crops; Major per-capita urban water use reductions | |
| New roles for old infrastructure | |
| “Portfolio” solutions | |
| 1992 | Central Valley Project Improvement Act |
| 1994 | Delta Accord and CalFED |
| 1995–2000 | Extremely wet period |
| 1999 | D1641 implementing the Delta Accord |
| 2000–Future Ecosystem Crises in a Changing Climate | |
| 2007–2009 | Drought renews Delta interest |
| 2012–2016 | Drought occurs; 2014 California Sustainable Groundwater Management Act Winter-run Chinook salmon becomes hatchery-dependent |
| 2017 | Wettest Northern California year; Oroville spillway failures |
| 2021–2022 | Drought occurs |
| 2022 | Delta smelt hatchery releases begin |
Expansions of the SWP and CVP came to a nearly complete halt following a statewide referendum rejecting a peripheral canal around the Delta in 1982. This event greatly reduced federal and state leadership in developing new water projects in California. Subsequent efforts to rejuvenate federal and state CVP and SWP infrastructure expansions have been diminished compared to earlier plans.
OVERVIEW OF INFRASTRUCTURE FOR WATER DELIVERY
The CVP and SWP include a large number of facilities that are operated in coordination to support a number of uses as described above and in adherence to regulations (see Appendix C). Many of these facilities and other features are shown in Figure B-2. Table B-2 documents the capacity of some of the major storage reservoirs within the CVP and SWP.8
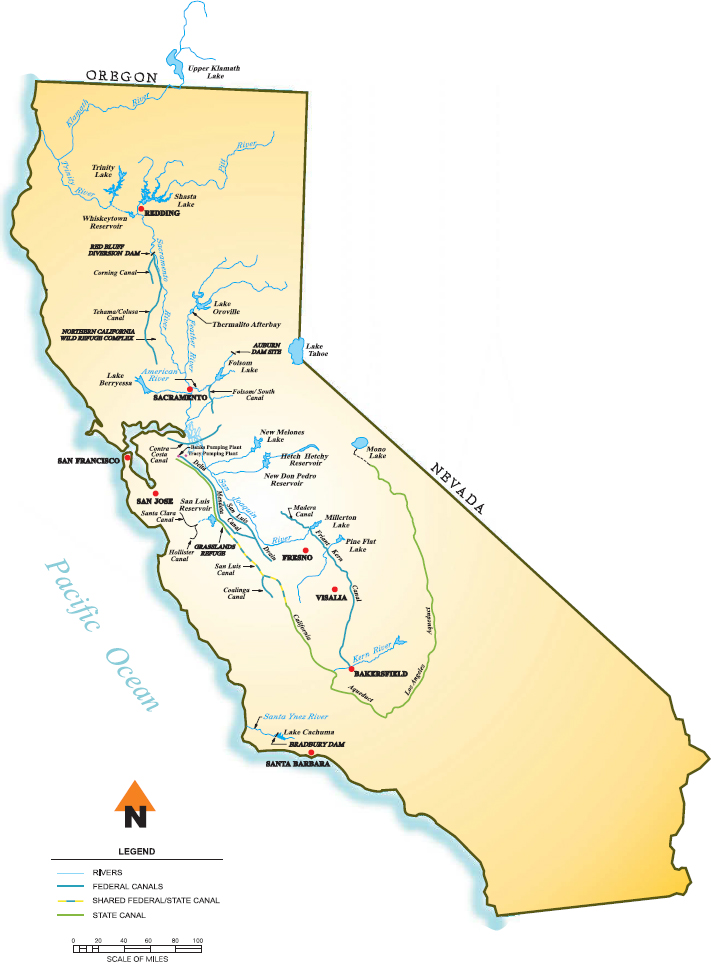
SOURCE: https://www.usbr.gov/mp/cvp-water/docs/cvp-map-11x17.pdf.
___________________
8 Additional information is available from https://www.usbr.gov/mp/cvp/ and https://water.ca.gov/programs/state-water-project.
The CVP facilities include reservoirs on the Trinity, Sacramento, American, Stanislaus, and San Joaquin rivers. Starting in the north, water from the Trinity River is stored and re-regulated in Trinity Lake, Lewiston Lake, and Whiskeytown Reservoir. Water from the Trinity Division is diverted to the Sacramento River basin via two tunnels and powerplants, where it joins the releases from Shasta Dam in its afterbay Keswick Reservoir to form the main stem of the Sacramento River that flows south to the Delta.
On its way south, Sacramento River water is joined, at Verona, by releases from Lake Oroville and Oroville Dam (an SWP facility) via the Feather River. Lake Oroville stores and re-regulates SWP water. The SWP contractors and SWP water rights settlement contractors divert water from the Feather River and Sacramento River. The next major confluence south of the Feather River is the American River on the east, which delivers releases from USBR’s Folsom Dam and its afterbay, Nimbus Dam. On the western side of the Sacramento River, the Yolo Bypass delivers flows from California’s Coast Range, its own drainage, and diversions from the Sacramento River.
The Sacramento River carries water to the Sacramento-San Joaquin River Delta. Other river inputs to the Delta are from the Mokelumne and Cosumnes rivers from the east and the San Joaquin River from the south. The Jones Pumping Plant at the southern end of the Delta lifts the water into the Delta-Mendota canal. This canal delivers water to CVP contractors and exchange contractors on the San Joaquin River and water rights contractors on the Mendota Pool.
The CVP also delivers water from the Friant Dam on the San Joaquin River to CVP contractors located near the Madera and Friant-Kern canals. Water is stored in the New Melones Reservoir for water rights holders in the Stanislaus River watershed and CVP contractors in the northern San Joaquin Valley.
On the state side, the California Department of Water Resources (CDWR) operates 21 dams and more than 700 miles of canals, pipelines, and tunnels as part of the SWP. SWP water flows are exported from the Delta by the Banks Pumping Plant, which lifts the water into the California Aqueduct, to the South Bay Aqueduct and Bay Area, and conveys water to the San Luis Reservoir. Many of the SWP contractors are in the southern San Joaquin Valley, Central Coastal area, and Southern California. To deliver water to the latter, the water is pumped 2,000 feet over the Tehachapi Mountains. The SWP also delivers water to the Cross-Valley canal between the California Aqueduct and Bakersfield, for CVP water service contractors.
The San Luis Reservoir is part of the San Luis Unit, a joint venture between USBR and CDWR that provides storage, downstream of both pumping plants, during dry seasons. The San Luis Reservoir is the largest off stream storage reservoir in the United States. The William R. Gianelli Pumping-Generating Plant pumps surplus water from both the Delta-Mendota canal (CVP) and the California Aqueduct (SWP) into the San Luis Reservoir. When water flow through the Delta becomes too low, water is released from San Luis into the Delta-Mendota canal and the California Aqueduct to meet demands. In addition, water from the San Luis Reservoir can be conveyed through tunnels to CVP contractors in Santa Clara and San Benito counties.
TABLE B-2 Capacity of Some of the Major Storage Reservoirs Within the CVP and SWP
| Feature/Facility | Location | Capacity (million acre-feet) |
|---|---|---|
| Shasta Dam and Reservoir | Sacramento River | 4.6 |
| Trinity Dam and Reservoir | Trinity River | 2.4 |
| Whiskeytown Dam and Lake | Trinity River | 0.24 |
| Folsom Dam and Reservoir | American River | 0.97 |
| Lake Oroville and Oroville Dam | Feather River | 3.5 |
| New Melones Dam and Reservoir | Stanislaus River | 2.4 |
| Friant Dam forming Millerton Lake | San Joaquin River | 0.5 |
| San Luis Reservoir | Off stream storage | 2.04 |
***
Many other sizable dams and reservoirs in Northern and Central California, not shown in Figure B-2, are part of neither the CVP nor the SWP. These include the Pacific Gas & Electric Company’s Lake Almanor in Plumas County, Camanche Dam and Pardee Dam owned by the East Bay Municipal Utility District, City of San Francisco’s Hetch Hetchy Reservoir, New Don Pedro Reservoir operated by the Modesto and Turlock Irrigation Districts, and many other local and regional projects, as well as independent federal (USBR and U.S. Army Corps of Engineers) projects.
Because both the CVP and the SWP convey water via the Sacramento River and the Delta, their facility operations are coordinated, based on the Coordinated Operating Agreement (see Chapter 1), the Bay-Delta Plan Accord, and other agreements, to maximize yields and deliver water into the main river channels and canals of the project in an efficient and economical manner.
Water Flows Through the Delta
Figure B-3 shows the common pathways for water movement through the Delta, most of which follow the major channels created by the Sacramento and San Joaquin rivers. Waters entering from the Sacramento River mostly flow directly southwest past the Delta and on to San Francisco Bay (dark blue line). Sacramento River water can flow into the central Delta when the Delta Cross Channel (DCC) is open (light blue lines in Figure B-3), initially flowing in the North and South Mokelumne River channel. Upon reaching the deep San Joaquin River channel, water can continue in several directions. The red arrows show the path water takes if it continues south into the Old and Middle River (OMR) channels. When the DCC gates are closed, the entire Sacramento River flows southwest to the San Francisco Bay (small red arrow in Figure B-3). However, depending on inflow and withdrawals from the Delta, some of the Sacramento River flow, averaged over a tidal cycle, travels east and then up the San Joaquin River channel toward the central Delta (small yellow bar in Figure B-3). From the Delta, water is withdrawn and used for agriculture in the Delta, it is withdrawn from the Delta via the state and federal pumps in the South Delta, or it flows out to San Francisco Bay.
Figure B-3 also shows the San Joaquin River (orange), which flows up to the Delta from the South, with the river itself passing through the city of Stockton. (Dredging has deepened the San Joaquin River channel from Stockton to Antioch to provide a shipping channel.) Water from the San Joaquin River can go directly to the pumps or make its way to the central Delta. The specific routes that San Joaquin River water takes through the central Delta are primarily determined by the DCC flow, San Joaquin River inflow from the south, and pumping rates. At times, there is almost no flow out of the San Joaquin River into the Delta.
Although Figure B-3 suggests both certainty and simplicity regarding the direction of Delta flows, the reality is that there is marked variation in the flows through these pathways throughout the year and depending on the water-year type. These variations are explored in Box B-1.
CVP and SWP as Parts of California’s Larger Water System
Even before the peripheral canal referendum in 1982, it was clear that expanding large water projects would not be enough to eliminate water shortages, particularly during droughts. California’s driest recorded year to date occurred in 1976–1977, when many water contracts and reliability expectations could not be fulfilled for cities, agriculture, and the environment. Cities, especially, saw seemingly draconian water use reductions, curtailing water use by 25–40 percent in many cases, and quickly introduced complex water transfer and exchanges to even out supplies. It became clear that local agencies and users could do more than only seek expansions of statewide water supplies, often with greater local control and reliability, especially because most inexpensive reservoir sites had already been developed. With urban water conservation and declining population growth rates, urban agencies tended to find other water management alternatives more attractive in terms of control, cost, controversy, and reliability.
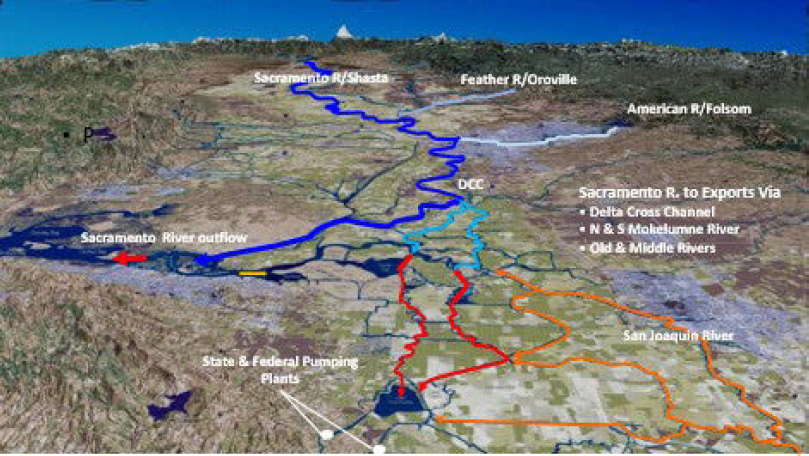
NOTES: Dark blue = Sacramento River; medium-blue = Feather River; light-blue = American River; red = flow from Delta south to the state and federal pumping plants via the Old and the Middle rivers; orange = San Joaquin River flows into the Delta.
SOURCE: Adapted from Sumer (2024).
These many changes in supplies and demands in the late 1970s returned water management focus and initiative to local and regional water agencies and away from state and federal agencies (Hanak et al., 2011; Lund et al., 2018). Local water use efficiencies, water use reductions, conjunctive groundwater use, water interconnections, recharge and reuse of treated wastewater, and inter-regional water market transfers all came to diversify local and imported water supplies starting from the 1976–1977 drought and continuing today. These activities also increased cooperation between water delivery and management agencies regionally and statewide. Diversified supplies could be combined with water use reductions and coordination across local, regional, and statewide scales to foster “portfolio-based” water management with less controversy, greater reliability, and likely lower costs. These strategies were reinforced by the 1987–1992 drought, such that portfolio strategies greatly blunted the impacts of more recent droughts, especially for urban regions (Lund et al., 2018). Portfolio strategies have been less developed for ecosystems and agriculture, perhaps because of less funding and ability to pay and less organized coordination among users. Adoption of the Sustainable Groundwater Management Act of 2014 will likely spur further development of agricultural water management portfolios. With a few exceptions, environmental water management remains underdeveloped in combining science, infrastructure, and operations for ecosystem purposes across scales and is increasingly challenged by non-native species and climate change.
The CVP and SWP were designed for an expected era of indefinite growth in water demands for an economy specializing in agriculture and manufacturing with high per-capita water use. These sectors have developed and prospered, but California’s economy and water needs are now very different. Today most urban users and some agriculture water users no longer rely on water project expansions and abundant water deliveries into the future, but rather they have diversified their water supplies and manage their water demands to provide more reliable and affordable water services. The CVP and SWP and their core existing infrastructure will need to accommodate new concerns, technologies, changing environmental concerns (especially with climate change), changing (and often reduced demands) human water demands, and much greater local and regional control, finance, and initiative, requiring broader coordination of water operations across diverse water uses and managers.
BOX B-1
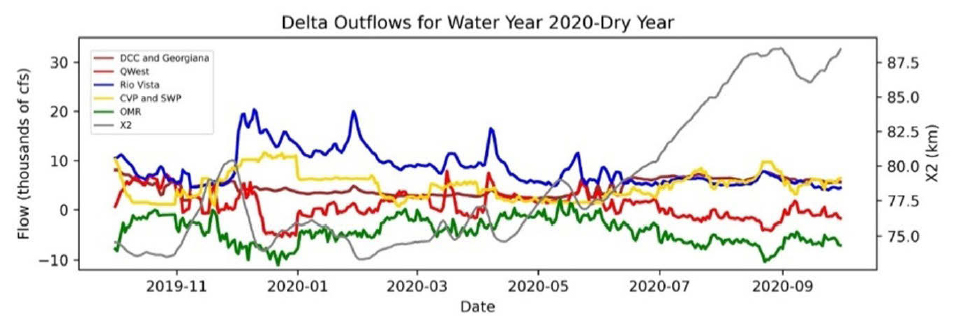
A Comparison of Water Flows Through the Delta for Four Recent Water Years
To understand the challenges of managing flow and water quality parameters (including salinity, turbidity, dissolved oxygen, and temperature) in the Delta, it is necessary to appreciate both annual variability and the interannual variability of daily averaged flow rates, and even flow directions. Using data from the DayFlow website,a the Committee plotted daily averaged Delta inflows and outflows for four recent years: 2017, 2018, 2020, and 2023. The flows plotted on the inflow graphs are as follows:
- Yolo Bypass at Woodland
- Sacramento River at Freeport
- Consumnes River (inflows to Delta from Sierras to the East)
- Mokelumne River (inflows to Delta from Sierras to the East)
- San Joaquin River at Vernalis
- Delta tributaries
These are recorded inflows and thus are what remains after the large consumptive withdrawals and diversions before the rivers reach the Delta.
The flows plotted on the outflow graphs are as follows:
- DCC and Georgiana Slough
- QWEST (San Joaquin River flows out of the Delta at Jersey Point near Antioch)
- Sacramento River at Rio Vista (after the DCC diversion)
- Combined pumping rate for the projects (CVP and SWP)
- OMR flow measured at USGS gauges OBI and MDM (data from CDWRb)
X2, showing the penetration of salinity into the Delta, is also plotted.
Figure B-4 shows the data from all four years with inflows and outflows plotted separately. Note that the y-axes have the same range as do y-axes for the four outflow graphs.
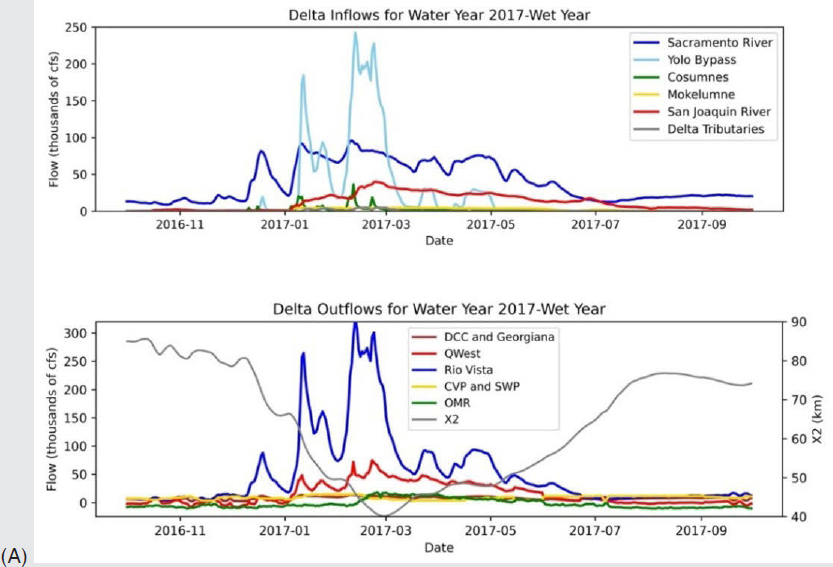
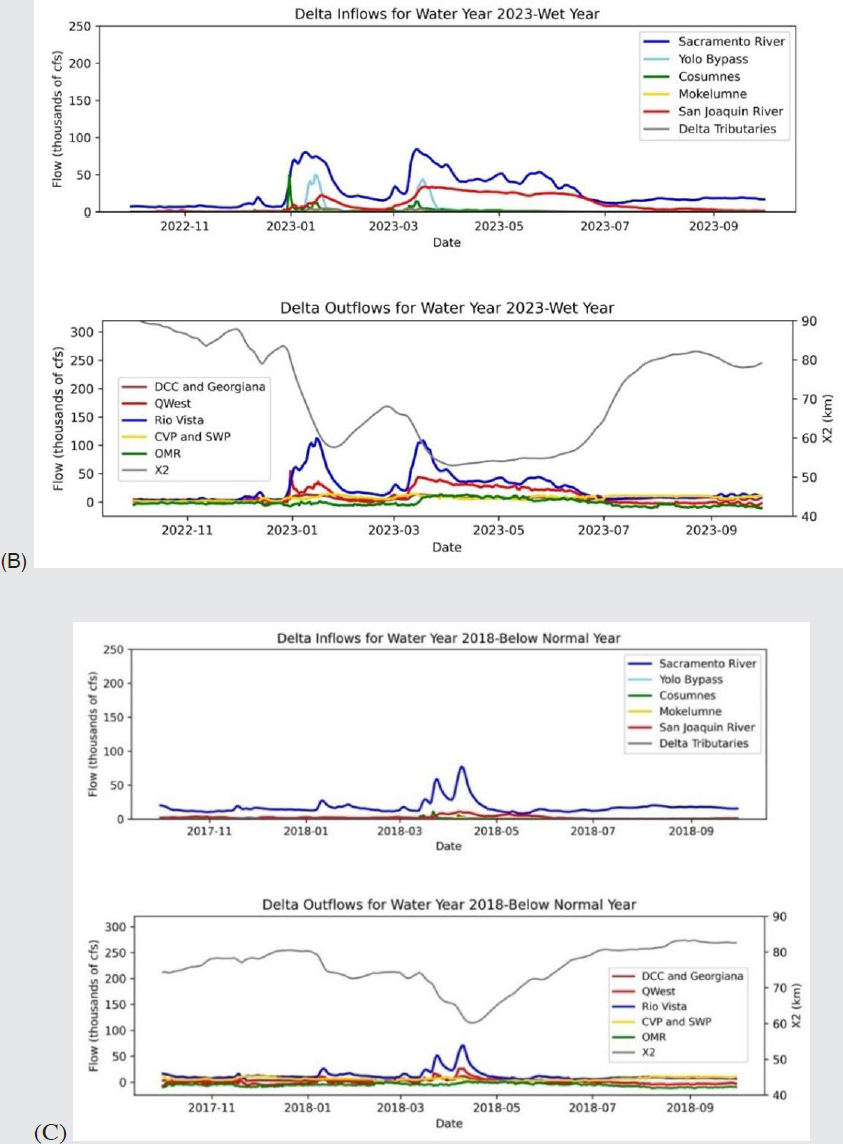
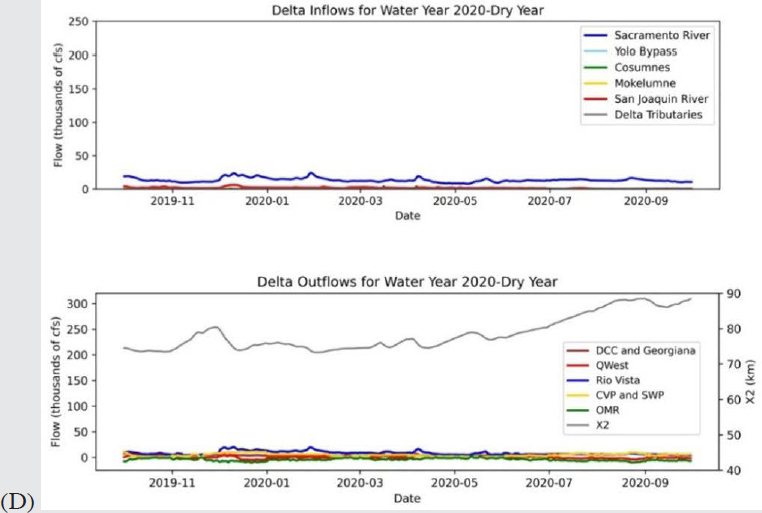
NOTES: (A) 2017 (“wet year”), (B) 2023 (“wet year”), (D) 2018 (“below normal year”), and (D) 2020 (“dry year”).
SOURCE: Data from Dayflow website and CDWR. https://data.ca.gov/dataset/dayflow
Although both 2017 and 2023 were wet years, 2017 was extremely wet, with huge flows from the Yolo Bypass. In 2023, two large storms put water in the Yolo Bypass, but otherwise inflows to the Delta were less than in 2017. In the below normal year of 2018, only Sacramento River and San Joaquin Delta inflows are visible. There appear to be two small storm events but no flow in the Yolo Bypass. In dry 2020, little Sacramento River water reached the Delta, and the San Joaquin River appears dry.
There is large seasonality in flows into the Delta from the Sacramento River, Yolo Bypass, and the San Joaquin River, especially in wet years. Water from the Yolo Bypass arrives in large pulses that result from flood waters from the Sacramento River diverted down the bypass. In below normal and dry years, there can be very little flow from the San Joaquin River at Stockton, requiring that the pumps use water from the Sacramento River either through the DCC or from negative San Joaquin flows at Jersey Point.
There were two very large storms (both with double peaks) in 2017 and a large storm in mid-December of 2016, leading to substantial flows into the Delta from the Yolo Bypass, the Sacramento River, and the San Joaquin River. The peak inflows from the bypass (242 thousand cubic feet per second [tcfs]) and the Sacramento River (96 tcfs) combined to yield a Sacramento River outflow peak at Rio Vista of 324 tcfs. San Joaquin flows to the Delta generally stayed below 50 tcfs. However, peaks from the Consumnes and a little from the Mokelumne pushed San Joaquin outflow at Jersey Point to near 80 tcfs. Delta outflow from both rivers persisted with wet conditions extending through June. OMR was negative starting in June, reflecting diversions from the Sacramento River to the pumps. Jersey Point flows were often negative after July. The salinity index X2 was less than 80 kilometers (km) from December onward, reaching a value of zero in March 2017. So, the focus for water management in 2017 was flood management.
In 2023, two large storms activated the Delta Yolo Bypass, and Sacramento River flows at Rio Vista peaked around 110 tcfs. During July and later, Rio Vista flow is diminished by DCC and Georgiana Slough diversions. Starting in April, San Joaquin River flow into the Delta is similar to the Sacramento River’s flow to the Delta until August, when the San Joaquin River flow largely disappears, and OMR and QWEST become negative to compensate for pumping. After February, X2 was generally at or below 80 km.
In 2018, reservoir storage appeared to capture much of the larger flows in the March-to-May period. The Sacramento River supplied water to the Delta as needed through the summer and fall. OMR and QWEST became increasingly negative after August and through September. The DCC and Georgiana diversions plus inward QWEST flows about equal the pumping during that period. X2 stayed around 80 km or less in the late spring.
Significant storms in 2020 were regulated by dams and produced minimal runoff that reached the Delta. Sacramento River inflows after February were generally 10–15 tcfs, and San Joaquin inflows remained less than 3 tcfs before and less than 1 tcfs after February. Because Delta outflow values are so small, Figure B-5 shows those values on an expanded scale. OMR values fluctuated but were mostly negative, typically near -4 tcfs. Pumping rates varied but were generally less than 9 tcfs. X2 is generally below 80 km until August, when it begins an increase to almost 90 km.
One lesson from Figures B-4 and B-5 is that wet years can differ substantially. With the large flows reaching the Delta, 2017 was a flood management year. Although 2023 was also wet, it avoided serious floods. Dry years tend to look more alike, because little water reaches the Delta. On a finer scale, Sacramento River water flowing east around Sherman Island and up the San Joaquin River channel is common in August through September. Indeed, QWEST flows almost mirror the pumping in 2020, suggesting that water for export in June and later is derived primarily from the Sacramento River reversing its natural course to the ocean and flowing up the San Joaquin River. The dynamic nature of the magnitude and direction of flows in various streams and channels makes understanding flows in the Delta difficult. The variation of channel widths and depths (natural and dredged) makes it less than obvious what paths flows will follow. Furthermore, the sloshing of tides creates substantial mixing of waters.
Users of CVP and SWP Water
Following the decline of the hydraulic mining era, irrigated agriculture became the largest water user in California, incentivizing local organizations to establish irrigation systems administered by irrigation (or reclamation) districts and small water companies. Limited growth prospects due to insufficient local water availability and funding forced the development of groundwater extraction, particularly in areas lacking access to surface water rights, with accompanying conflict among water users and the detrimental consequences of aquifer overexploitation.
Central Valley Project Water Users
The CVP was authorized in the early 1930s for the purposes of navigation, flood control, water supply, and hydropower generation. By the early 1950s water deliveries, hydropower generation, Delta pumping, and San Joaquin River diversions were in place, with later systemwide expansions (Hanak et al., 2011). To accommodate pre-existing water users and water rights, many pre-existing users became CVP contractors. Settlement Contractors incorporated pre-existing Sacramento Valley users as high-priority CVP contractors (see Appendix C). Earlier users of San Joaquin River water became Exchange Contractors, receiving higher priority to water pumped from the Delta (which allowed more San Joaquin River water diversion to the Tulare basin). Expansions to the CVP infrastructure were mostly completed by 1960, with a few expansions occurring into the 1980s.
Through roughly 270 contracts or agreements, the CVP delivers water either because of a service contract or a water right. Under water service contracts, USBR delivers water to its contractors, usually for a fee, subject to water availability in storage and forecasts of hydrologic conditions. Service contracts allow for agricultural as well as municipal and industrial (M&I) water uses. Water rights deliveries, in contrast, often receive higher priority
SOURCE: Data from Dayflow website and CDWR. https://data.ca.gov/dataset/dayflow
__________________
than the water services contracts because of predating of water rights (relative to CVP) or regulation. Those with the highest priority water rights or settlement contracts include the Sacramento and San Joaquin contractors and wildlife refuges (USBR, 2016). A description of the various CVP water rights holders and water service contractors is given in Box B-2.
The CVP has a maximum contract amount of 9.5 MAF/yr subject to shortage. In addition, the CVP provides 235 thousand acre-feet per year (TAF/yr) from the American and Sacramento rivers to the city of Sacramento not subject to shortage. Historically, CVP supplies around 7 MAF/yr, of which 5 MAF are for irrigation, 600 TAF for M&I uses, 800 TAF for fish and wildlife, and 410 TAF for refuges (CRS, 2024; Stern et al., 2024). The San Luis Reservoir allows water from the Sacramento Valley to be stored south of the Delta and expansion of irrigated areas in the San Joaquin Valley.
A more detailed list of CVP contractors along with average delivery amounts for the 2013–2024 period is shown in Table B-3. Most of the time, water rights contractors receive their full allocation. The exception is dry years when they receive roughly 75 percent of the maximum contract amount, which is also the case for the Central Valley refuges using Class 2 water, that is the next amount of water available (up to 1.4 MAF) after Class 1 (800 TAF) water.
The Sacramento River Settlement and San Joaquin Valley Exchange Contractors and Level 2 refuges had average allocations above 87 percent for the 2013–2024 time period. Contract water deliveries averaged around 65 percent, excluding Class 2 water in the Friant Division (17 percent). Water service contracts north of Delta and south of Delta have received no allocation in recent droughts.
BOX B-2
CVP Water Users
The highest priority water rights holders and water service contractors are described first.
CVP Sacramento River Settlement Contractors. This user group consists of 146 districts or individuals with water rights that were in place prior to Shasta Dam construction. The CVP Sacramento River Settlement Contractors are entitled to about 2.2 MAF per year except for Shasta Lake critical years,a when allocation is reduced to 75 percent of the full contract amount (1.65 MAF). From the total allocation, 1.76 MAF are considered “base supply,” which can be diverted without charge, and 330.2 TAF are “Project water,” which are additional waters that may be diverted subject to pricing and federal requirements (CDWR, 2022). Should their water rights be fully exercised, the ability of the CVP to deliver to water service contractors would be compromised.
San Joaquin River (SJR) Exchange Contractors. The SJR Exchange Contractors represents a group of four entities—namely, Central California, Irrigation District, Columbia Canal Company, San Luis Canal Company, and the Firebaugh Canal Water District—that exchanged diversion rights on the SJR and the Kings River for substitute water from the CVP to facilitate construction and operation of the CVP Friant Division. They receive up to 840,000 AF of water in normal years. However, in Shasta critical years such allocation can be reduced to 650,000 TAF. In the event that USBR cannot fulfill deliveries, the Exchange Contractors can return to SJR diversions largely by reducing Friant Diversion deliveries and other junior water rights holders (CRS, 2024).
CVP Schedule 2 Water Rights, Fresno Slough. In addition to the SJR Exchange Contractors, USBR entered into settlement contracts with water right holders or claimants to the Fresno Slough affected by the construction of the Delta-Mendota canal. Such settlements entitled the Fresno Slough water rights contractors to 35,623 AF of Schedule 2 water, which is water delivered at no charge and does not originate from CVP sources, yet it employs CVP infrastructure for storage and conveyance to users. Some users in this group can also receive an additional 55,475 AF per year as contracted water service from the CVP.
CVP Wildlife Refuges. Under the Central Valley Project Improvement Act of 1992, refuges in the Central Valley became co-equal to agriculture, municipal, and industrial uses in the CVP. The Refuge Water Supply Program was established to obtain 555,000 AF per year for 19 refuges, under two categories: Level 2 and Level 4 sup-
Water Allocation and Shortages.
CVP water allocation decisions evolve over the water year and are the result of several factors, including surface water storage, forecasted hydrologic conditions, water rights decisions, and regulations protecting habitat for wildlife. Overall, CVP prioritizes water rights contracts and refuge deliveries over water service contracts. Whereas in most years deliveries to water rights contractors and Level 2 water for refuges are met, dry years may reduce their CVP deliveries down to 75 percent. Within the water service contracts, M&I uses are prioritized over irrigation under the current water shortage policy, where the aim is to provide M&I contractors 75 percent reliability with respect to historical use, defined as the average last three years with unconstrained CVP deliveries. Before M&I shortages take effect, irrigation deliveries need to be reduced by at least 75 percent.
In conjunction with hydrologic conditions and water rights, at least three major systemwide legal constraints restrict pumping and hence affect CVP allocation decisions: California state water quality requirements, Endangered Species Act implementation, and Central Valley Project Improvement Act implementation, along with water conservation requirements. The legal constraints are discussed in Appendix C.
plies. Under Level 2, considering average water deliveries prior to the CVP, the refuges get 422,251 AF yearly. During dry years, such allocation is reduced by 25 percent. Level 4 supplies (133,264 AF) are acquired by voluntary measures including purchases through the Central Valley Project Restoration Fund. Level 4 water supply increments above Level 2 supplies are considered optimal for wetland habitat development.
Lower in priority are municipal, industrial, and agricultural water service contractors that purchase CVP project water under a long-term (e.g., 40-year) renewable contract. These are discussed below, organized by location: North of Delta, In-Delta, East Side; South of Delta; and the Friant Division.
North of Delta Water Service Contracts, In-Delta Division, and East Side Division. This user group includes the Sacramento and Trinity River divisions, Corning Canal Unit, Delta Division, the Feather Water District, and the city of West Sacramento, totaling 468,490 AF. By adding the American River Division (313,750 AF), the north of Delta water service contract maximum is 782,640 AF. The “In Delta” Division includes the Contra Costa Water District, which has a maximum contract amount of 195,000 AF. The East Side Division includes storage in the Stanislaus River, Chowchilla River, and Fresno River. Users include the Central San Joaquin Water Conservation District, Stockton-East Water District, Oakdale Irrigation District, and South San Joaquin Irrigation District. The maximum contract amount is 755,000 AF.
South of Delta Water Service Contracts. This area includes various divisions, namely the Delta-Mendota canal, the Mendota Pool, the Cross Valley canal, the San Felipe Unit, and the San Luis Unit. Altogether these contractors’ maximum contract allocation is 2,112,898 AF.
Friant Division Contracts. This group of 32 water service contractors receive two classes of water: Class 1 (up to 800,000 AF), mostly for M&I contractors with no access to groundwater, and Class 2, largely for users with access to groundwater for up to 1.4 MAF per year. During dry years, if USBR cannot provide the SJR Exchange Contractors with their CVP allocation, then these can appropriate Friant Dam-stored water that would otherwise go to the Friant Division contractors. The Chowchilla Water District and the Madera Water District add 24,000 AF each of maximum contract amount for a Friant Division total of 2,249,475 AF.
__________________
a A Shasta Reservoir critical year is defined as a current year with forecasted inflow of less than 3.2 MAF, or when the total accumulated actual deficiencies below 4 MAF in the immediately prior water year, or series of successive prior water years, each of which had flows less than 4 MAF, together with the forecasted deficiency exceed 800 TAF.
State Water Project Users
The water demands of a growing population and the legal challenges to irrigation water users were instrumental in supporting the building of the SWP. Oroville Dam, the major storage facility of the SWP, was completed in 1967 for water supply, flood control, and hydropower. The SWP serves 29 contracts with a total contract amount of 4.17 MAF/yr mostly for M&I (70 percent) and irrigation of roughly 750,000 acres of land. The SWP delivers Table A water, Carryover water, and Article 21 water to contractors. Table A refers to the maximum amount contractors are entitled to request of the SWP, totaling 4.17 MAF/yr based on estimated 1960s delivery capability (Osorio, 2020). Maximum contractual Table A allocations are shown in Table B-4 below. Carryover water is the amount of Table A water that can be saved for next year’s delivery to avoid losing undelivered water and hedge in the event of a forthcoming dry year. Carryover requests to the SWP are subject to available storage capacity and the water contractor’s specific maximum storage allocation in the San Luis Reservoir, which brings some risks and operational challenges seeking non-SWP storage in the event of a full reservoir. Article 21 water, also known as surplus or unscheduled water, is available mostly in wet years, on top of Table A allocations. Oroville releases water to the Feather River, which is joined downstream by the Yuba and Bear rivers as it travels to the North Delta from the confluence with the mainstem of the Sacramento River. Diversions in the Delta include the North Bay Aqueduct, supplying water mostly to Solano and Napa counties, and the South Bay Aqueduct, supplying Santa
| Contractors | Division | Units | Contract Type | Max Contract | M&I Hist. | Agriculture Max | Average of Max % |
|---|---|---|---|---|---|---|---|
| North of Delta | Sac River | Black Butte, Colusa Drain, Corning, Tehama Colusa, Shasta Trinity | Water Service | 468,890 | 21,628 | 441,886 | 63% |
| North of Delta | American River M&I | Folsom, Folsom South, Upper Am. River | Water Service | 313,750 | 181,047 | 0 | 75% |
| North of Delta | Sacramento River Settlement | Sacramento River W.R. Settlement & Shasta | Water Rights | 2,115,620 | N/A | N/A | 87% |
| South of Delta | Delta | Delta-Mendota canal, Mendota Pool, Cross Valley, San Felipe, San Luis | Water Service | 2,112,898 | 161,690 | 1,942,077 | 37.4% |
| South of Delta | Delta | Exchange, Settlement | Water Rights | 875,623 | N/A | N/A | 91% |
| South of Delta | Friant | Friant Dam, Friant-Kern, Miscellaneous | Water Service | 800,000 CL1 1,401,475 CL2, and 48,000 Misc |
63,880 CL1 | 62% CL1 17% CL2 |
|
| In Delta | Delta | Contra Costa | Water Service | 195,000 | 170,000 | 76% | |
| East Side | East Side | New Melones, Tri-dams | Water Service and Water Rights | 755,000 | 46,214 | 71% | |
| Refuges | North and South of Delta | North and South of Delta Class 1 | Water Rights | 422,251 | N/A | N/A | 89% |
| CVP total | 9,508,507 | 60% |
NOTE: CL1 and CL2 stand for Class 1 and Class 2.
SOURCES: Adapted from CDWR (2018) and USBR (2015), CRS (2024); https://www.waterboards.ca.gov/waterrights/water_issues/programs/hearings/byron_bethany/docs/exhibits/wr/wr225.pdf.
Clara and Alameda counties. Both aqueducts are owned and operated by CDWR. Water is exported south of the Delta through the Banks pumping plant in the southern Delta.
As with the CVP, allocation decisions in the SWP involve multiple factors including hydrologic conditions, water rights, environmental regulations, water conservation needs, and operational capabilities. Precipitation indexes, snow water content, and storage and water supply indexes can drive water deliveries of water from the SWP. In addition, deliveries are affected by contractor-specific water supply agreement amendments, which include transfers between users, non-SWP water, carryover, and other provisions. Unlike CVP water allocations that privilege senior water rights contractors (e.g., Settlement and Exchange contractors), SWP Table A allocations are more volatile for most contractors. Over the period 2013 to 2024, allocations have been as low as 5 percent, bringing average allocation to 40 percent of the Table A maximum (Table B-4).
Not included in Table A allocations (and hence not in Table B-4) is Settlement Water in the amount of 31,620 AF for the Solano County Water Agency. Also, CDWR has water rights settlement agreements with the Feather River Service Area districts that include the Western Canal, Joint Water District Board, Plumas Water Conservation
District, Garden Highway Mutual Water Company, Oswald Water District, and Tudor Mutual Water. Such Feather River service area settlement and water rights total 978,455 AF, and they are not part of the Table A water in Table B-4. The city of Vallejo has water rights senior to the SWP in the amount of 22,780 AF and not subject to Term 91 curtailments, which restrict diversions from the Delta mostly during dry years (CDWR, 2022).
Future Challenges and Vulnerabilities for CVP and SWP Water Users
Both of the Projects operate within a heavily allocated system, where water amounts are often insufficient to meet the competing co-equal goals of water supply and environmental conservation. Future climate conditions, characterized by warmer temperatures and more frequent, intense precipitation and prolonged droughts, are expected to exacerbate these challenges by further reducing water availability.
Some studies estimate that 1 foot of sea level rise may necessitate approximately 500 TAF of additional Delta outflows to protect water quality (Fleenor et al., 2008). Climate projections also point to decreased runoff in the upper basins feeding the Delta due to higher temperatures and increased evapotranspiration (Null et al., 2010). CDWR (2024b) predicts that by 2043, under climate change, the long-term average percentage of Table A maximum deliveries (Table B-4) could drop to as low as 41 percent (down from 53 percent under historical climate conditions). Similarly, CDWR’s Water Available for Replenishment report (CDWR, 2018) estimates that SWP and CVP annual exports may decline to an average of 4.63 MAF under future conditions without intervention, compared to 4.94 MAF under current conditions.
On the demand side, higher crop evapotranspiration could increase applied water requirements, particularly during multi-year droughts (Moyers et al., 2024). For example, an additional 2–4 inches of crop water demand in a dry year across the Central Valley floor would be sufficient to fill a 1–2 MAF reservoir. Lund et al. (2024) project that future statewide water supply reductions could range from 4 to 7 MAF when accounting for these and other factors. Although some overlap exists among these estimates, the overall projections consistently indicate reduced water availability and heightened demand, complicating efforts to meet demand within current regulatory constraints.
TABLE B-4 Maximum SWP Contractual Table A Amounts (acre-foot/yr) and 2013–2024 Average Allocation
| Area | Contractors | Maximum Table A (Acre-feet/yr) | Average Allocation |
|---|---|---|---|
| Feather River | Yuba City, Butte, Plumas | 39,800 | 52% |
| North Bay Area | Napa, Solano | 76,781 | 49% |
| South Bay Area | Alameda (Zone 7), Alameda County, Santa Clara | 222,619 | 40% |
| Central Coast | San Luis Obispo, Santa Barbara | 70,486 | 40% |
| San Joaquin | Dudley-Ridge, Empire, Kern (M&I and Agriculture), Kings Oak Flat, Tulare | 1,129,556 | 40% |
| Southern California | AVEK, Coachella, Crestline, Desert, Littlerock, Mojave, Palmdale, San Bernardino, San Gabriel, San Gorgonio, Santa Clarita, Metropolitan, Ventura | 2,633,544 | 40% |
| Total | 4,172,786 | 41% |
DATA SOURCES: Maximum Contract Amounts and Deliveries from Bulletin 132-19 (CDWR, 2022) and Bulletin 132 Appendix B for 2024 (CDWR, 2024a). Average allocations were calculated by the Committee based on both Bulletin 132 Appendix B for 2024 Maximum Table A amounts and final historical SWP Table A Allocations (CDWR, 2025).
REFERENCES
Callaway, E. 2018. “Critics Attack Study That Rewrote Human Arrival in Americas.” Nature. https://www.nature.com/articles/d41586-018-01713-y.
CDWR (California Department of Water Resources). 1930. Fleenor State Water Plan, California Department of Public Works, Division of Water Resources, https://cawaterlibrary.net/wp-content/uploads/2020/01/Bulletin_25__1930.pdf.
CDWR. 2018. “Appendix B: State Water Project and Central Valley Project Water Reliability and Availability.” Water Available for Replenishment. https://water.ca.gov/-/media/DWR-Website/Web-Pages/Programs/Groundwater-Management/Data-and-Tools/Files/Statewide-Reports/WAFR/Final/Appendix-B-for-Water-Available-for-Replenishment_ay_19.pdf.
CDWR. 2022. Management of the State Water Project. Bulletin 132-2019. Sacramento, California. https://water.ca.gov/programs/state-water-project/management/bulletin-132.
CDWR. 2024a. Data and Computations Used to Obtain 2025 Water Charges. Bulletin 132-22 Appendix B. Sacramento, California. https://water.ca.gov/programs/state-water-project/management/bulletin-132.
CDWR. 2024b. SWP Delivery Capability Report. https://data.cnra.ca.gov/dataset/a3bb1ddd-624b-4c3d-95e7-2aa6b3bf2b5b/resource/92356681-957a-48ee-97c4-529d25b9dbb2/download/final_dcr2023_v2.pdf.
CDWR. 2025. Historical SWP Table AAllocations. https://water.ca.gov/Programs/State-Water-Project/Management/SWP-Water-Contractors.
CRS (Congressional Research Service). 2024. Central Valley Project: Issues and Legislation. R45342.
Deverel, S. J., and S. A. Rojstaczer. 1996. “Subsidence of Agricultural Lands in the Sacramento–San Joaquin Delta, California: Role of Aqueous and Gaseous Carbon Fluxes.” Water Resources Research 32:2359–2367. https://doi.org/10.1029/96WR01338.
Drexler, J. Z., C. S. de Fontaine, and D. L. Knifong. 2007. Age Determination of the Remaining Peat in the Sacramento–San Joaquin Delta, California, USA. USGS Open File Report 2007-1303. Sacramento, CA: U.S. Geological Survey. https://pubs.usgs.gov/of/2007/1303/.
Fleenor, W., E. Hanak, J. R. Lund, and J. Mount. 2008. “Delta Hydrodynamics and Water Quality in Future Conditions.” In Comparing Futures for the Sacramento San Joaquin Delta, edited by J. Lund, E. Hanak, W. Fleenor, et al. San Francisco, CA: Public Policy Institute of California. http://www.ppic.org/content/pubs/other/708EHR_appendixC.pdf.
Gilbert, G. K. 1917. Hydraulic-mining Debris in the Sierra Nevada. No. 105. U.S. Geological Survey.
Hanak, E., J. R. Lund, A. Dinar, et al. 2011. Managing California’s Water: From Conflict to Reconciliation. Public Policy Institute of California.
Hundley, N., Jr. 2001. The Great Thirst. Californians and Water: A History. Berkeley, CA: University of California Press.
James, L. A. 2004. “Decreasing Sediment Yields in Northern California: Vestiges of Hydraulic Gold-Mining and Reservoir.” In Sediment Transfer through the Fluvial System. IAHS Publication 288. https://books.google.com/books?hl=en&lr=&id=SnRW2HWK8TgC&oi=fnd&pg=PA235&dq=James+california+gold+mining&ots=Kc1eD0EmhG&sig=A7f2_BCEHQPetynZylqz2GODAdE#v=onepage&q=James%20california%20gold%20mining&f=false.
James, L. A., and M. B. Singer. 2008. “Development of the Lower Sacramento Valley Flood-Control system: Historical Perspective.” Natural Hazards Review 9(3). https://doi.org/10.1061/(ASCE)1527-6988(2008)9:3(125).
Johnson, R., and B. A. Cody. 2015. California Agricultural Production and Irrigated Water Use. Congressional Research Service. https://sgp.fas.org/crs/misc/R44093.pdf.
Kelley, R. 1998. Battling the Inland Sea. Berkeley, CA: University of California Press.
Lund, J., E. Hanak, W. Fleenor, et al. 2010. Comparing Futures for the Sacramento-San Joaquin Delta. Berkeley, CA: University of California Press.
Lund, J., J. Medellín-Azuara, J. Durand, and K. Stone. 2018. “Lessons from California’s 2012–2016 Drought.” Journal of Water Resource Planning and Management 144(10). https://doi.org/10.1061/(ASCE)WR.1943-5452.0000984.
Lund, J. R., J. Medellin-Azuara, and A. Escriva-Bou. 2024. The Magnitude of California’s Water Challenges. A Report Prepared for the California Municipal Utilities Association. https://www.cawaterforall.com/s/Magnitude-of-Californias-Water-Challenges_24-May-2024-FINAL.pdf.
Mount, J., and E. Hanak. 2019. Water Use in California. Public Policy Institute of California. https://cwc.ca.gov/-/media/CWC-Website/Files/Documents/2019/06_June/June2019_Item_12_Attach_2_PPICFactSheets.pdf.
Moyers, K., J. T. Abatzoglou, A. Escriva-Bou, J. Medellín-Azuara, and J. H. Viers. 2024. “An Invisible Water Surcharge: Climate Warming Increases Crop Water Demand in the San Joaquin Valley’s Groundwater-Dependent Irrigated Agriculture.” PLoS Water 3(3):e0000184. https://doi.org/10.1371/journal.pwat.0000184.
Null, S. E., J. H. Viers, and J. F. Mount. 2010. “Hydrologic Response and Watershed Sensitivity to Climate Warming in California’s Sierra Nevada.” PLoS One 5(4):e9932.
Osorio, N. 2020. “An Introduction to the State Water Project Deliveries.” California Water Blog. May 24, 2020. https://californiawaterblog.com/2020/05/24/an-introduction-to-state-water-project-deliveries/.
Pisani, D. 1984. From the Family Farm to Agribusiness: The Irrigation Crusade in California, 1850–1931. Berkeley, CA: University of California Press.
Stern, C. V., P. A. Sheikh, and E. H. Ward. 2024. Central Valley Project: Issues and Legislation. CRS Report No. R45342. https://crsreports.congress.gov/product/pdf/R/R45342/45.
Suddeth, R., J. F. Mount, and J. R. Lund. 2010. “Levee Decisions and Sustainability for the Sacramento San Joaquin Delta.” San Francisco Estuary & Watershed Science 8(2). https://doi.org/10.15447/sfews.2010v8iss2art3.
Sumer, D. 2024. Overview of the Central Valley Project and the State Water Project. Preamble: Modeling for LTO Operation and Actions. Presentation to the NASEM Committee to Review the LTO of the CVP and SWP. February 28, 2024, Davis, CA.
Thompson, J. K. 1957. “Settlement Geography of the Sacramento-San Joaquin Delta, California.” PhD dissertation, Stanford University.
USBR (U.S. Bureau of Reclamation). 2015. “CVP Water Contractors.” https://www.usbr.gov/mp/cvp-water/water-contractors.html.
USBR. 2016. Central Valley Project (CVP) Water Contracts Fact Sheet. https://www.usbr.gov/mp/cvp-water/docs/cvp-water-contracts-fact-sheet.pdf.
Whipple, A. A., R. M. Grossinger, D. Rankin, B. Stanford, and R. A. Askevold. 2012. Sacramento-San Joaquin Delta Historical Ecology Investigation: Exploring Pattern and Process. Prepared for the California Department of Fish and Game and Ecosystem Restoration Program. A Report of SFEI-ASC’s Historical Ecology Program, SFEI-ASC Publication #672. Richmond, CA: San Francisco Estuary Institute-Aquatic Science Center.


