Climate Security in Central America: Proceedings of a Workshop (2024)
Chapter: 5 Climate Security Data and Tools
5
Climate Security Data and Tools
To advance the workshop’s goal of developing an integrative systems understanding of climate security risk, the Data and Tools section of the workshop considered key analytic capabilities for climate-related security risks in Central America, beginning with a panel discussion featuring three invited experts. Mr. Ignacio Madurga-Lopez, of the International Center for Tropical Agriculture (CIAT), explored tools for analyzing the link between climate and conflict in the region. Dr. Susan Adamo, of Columbia University, described national and regional sources of data in Central America. Dr. Tim McPherson, of the Pacific Northwest National Laboratory, presented on potential future impacts of extreme sea level rise. A representative of the Defense Intelligence Agency, who is also a member of the workshop planning committee, moderated the panel discussion. The Data and Tools section of the workshop also included a series of structured discussions, in smaller groups, to develop ideas for indicators for climate-related security risks in the region.
INNOVATIONS AND TOOLS FOR CLIMATE SECURITY
Madurga-Lopez prefaced his remarks by noting that his home institution CIAT is one of the research centers within CGIAR (Consultative Group on International Agricultural Research), which focuses on agricultural research for development globally. Madurga-Lopez has been investigating the nexus of climate change; conflict; and key systems related to land, water, and food security. The overarching aim of this work is to understand how transformation of land, water, and food systems can help address issues of food insecurity, vulnerability, and social inequalities, while also contributing to the broader goal of sustainable peace.
Transitioning to the key innovations and tools CIAT has produced, Madurga-Lopez highlighted the Climate Security Observatory, which was to launch officially in May 2023 (see Figure
5-1).1 He noted that the Observatory is intended as a decision support system for policymakers and other leaders to help prioritize and target investments, policies, programming, and actions aimed at addressing climate conflict risks in a holistic, systems-oriented manner. Providing background, Madurga-Lopez explained that the Observatory currently covers detailed analysis for 12 countries, most of them located in Africa. However, it is actively expanding coverage this year to additional priority countries, including Honduras and Guatemala in Central America, as well as Pakistan, Jordan, the Philippines, and more. He noted that the Observatory hopes to continue to expand substantially the number of countries it covers in the coming years.
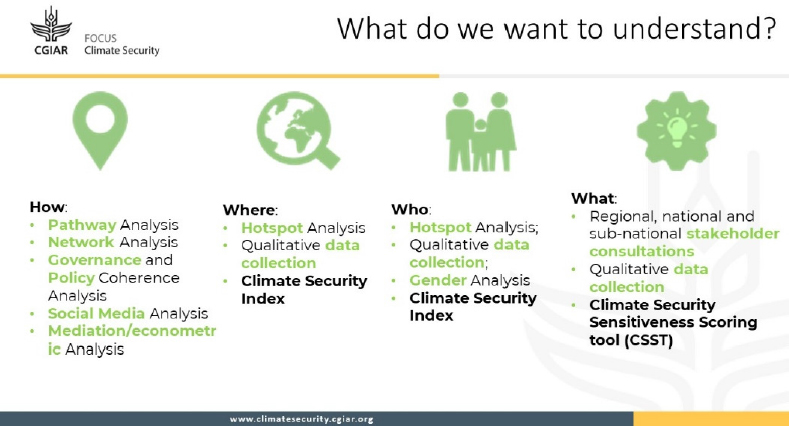
Shifting to the framing philosophy of the Observatory, Madurga-Lopez outlined the key guiding questions driving its approach to research and analysis: (1) understanding how climate change impacts interrelate with and exacerbate conflict and insecurity dynamics; (2) identifying where spatial hotspots are located based on overlap between climate vulnerabilities, socioeconomic vulnerabilities, and peace/security vulnerabilities; (3) within hotspot areas, determining who is most vulnerable to climate conflict risks, such as indigenous peoples, women, and youth; and (4) identifying what interventions and solutions can effectively address the cycles between climate crisis and conflict/insecurity. Elaborating on how the Observatory aims to answer these critical questions, Madurga-Lopez explained it has developed more than 20 different methods, combining quantitative techniques with qualitative techniques, such as field interviews and participatory community workshops, in order to provide a robust evidence base. He highlighted four examples: climate security pathway analysis; spatial analysis; social media analysis; and community-based field research.
Climate security pathway analysis uses mixed methods to map the mechanisms by which climate impacts cascade through intermediary variables to exacerbate conflict and insecurity. Madurga-Lopez explained that this type of analysis combines quantitative data analysis with qualitative insights from field consultations who have diverse national stakeholders in order to develop a systems understanding of these complex dynamics. He noted that the pathways concept is valuable for capturing these complex relationships while avoiding simplistic claims about direct climate–conflict causality. The analysis underscores the relevance of social, political, and economic factors within the pathways.
Spatial analysis overlays maps of climate vulnerabilities, socioeconomic vulnerabilities, and peace/security vulnerabilities to identify areas of highest overlap, indicating “hotspots” for climate security risk. As examples, Madurga-Lopez listed climate exposure indices, food insecurity estimates, poverty rates, and conflict event data.
Social media analysis, Madurga-Lopez said, focuses specifically on policymaker narratives, and includes analyzing thousands of tweets from government and ministry accounts on X, formerly known as Twitter. This approach aims to gauge the extent to which national policymakers acknowledge and discuss climate security issues in their discourse and communications.
Madurga-Lopez highlighted community-based field research as a critical means of capturing granular local knowledge, which is often missing from top-down climate security discourse. Through partnerships leveraging CGIAR’s rural research networks, CIAT trains local partners to run participatory workshops aimed at learning from community experiences of climate–conflict interactions and their insights on potential solutions. As an example, in a Mayan community in Guatemala facing climate impacts, migration risks, and intercommunity conflict over natural resources, a participatory exercise produced agreement on a solution for developing and implementing an integrated Forest Management plan based on collective action.
Transitioning to additional Observatory tools and innovations, Madurga-Lopez provided high-level overviews of several other tools produced at CIAT. The Climate Security Index addresses the gap caused by climate change factors being incorporated rarely into existing peace and
___________________
1 The Climate Security Observatory decision support tool officially launched on May 23, 2023 (https://www.cgiar.org/news-events/event/launch-of-the-climate-security-observatory). Readers can find detailed information about the datasets, methodologies, and supporting literature for the tool on its website (see https://cso.cgiar.org/#/Resources).
security indexes. Rather than merely creating a composite national-level score, it uses network analysis approaches to capture the complex interconnections and indirect relationships among climate factors and security dynamics. Spatial analysis is then used to identify subnational regions experiencing the highest vulnerability based on the climate security overlaps uncovered through the network analysis. The Climate Sensitiveness Tool focuses specifically on strengthening the peacebuilding potential of climate adaptation programs and interventions, especially those involved in agriculture, rural development, and livelihoods. The Climate Security Dialogue is a dashboard that compiles and analyzes several thousand tweets related to climate security dating back to 2014. Using sentiment analysis, it identifies discourse trends over time in terms of how climate security issues are framed and interconnected. For example, it can assess whether tweets linking climate change and justice have positive or negative connotations.
Finally, Madurga-Lopez highlighted a project with the Famine Early Warning Systems Network that used machine learning techniques to analyze more than 30 years of food security early warning reports for more than 30 countries. By identifying signals preceding food security crises, including links to climate shocks and conflict, it developed methods for building early warning systems specifically for food crises. While not directly under the climate security umbrella, these techniques and lessons learned can help advance similar early warning systems to anticipate climate-exacerbated security risks.
SOURCE: CGIAR System Organization.
SOCIOECONOMIC AND DEMOGRAPHIC DATA: NATIONAL AND REGIONAL SOURCES
Adamo provided an overview of some of the available sources of socioeconomic and demographic data for the Central America region. Her focus was on demonstrating where quantitative analyses such as those described by Madurga-Lopez can obtain information on critical
societal variables, including exposure, social vulnerability, livelihoods, and adaptation and coping strategies. She described regional and national data sources primarily and explored key gaps in data availability, accessibility, and usability.
With respect to regional sources of data, Adamo identified several key resources (see Table 5-1):
- The International Organization for Migration’s Displacement Tracking Matrix provides data on migrant populations and internal displacement, including figures, needs, vulnerabilities, and mobility tracking.
- The United Nations Economic Commission for Latin America and the Caribbean hosts the CEPALSTAT data portal, which compiles extensive official national statistics across demographics, economic, and social sectors for countries in Latin America and the Caribbean.
- The UN Population Fund maintains population data and projections disaggregated by age, sex, location, and other factors for monitoring issues such as migration, urbanization, and aging.
- The U.S. Census Bureau’s international programs collect some demographic and economic data internationally, including population estimates and projections.
- The DesInventar database catalogues disaster and loss and damage data, as well as human and economic impacts of disasters, by location.
With respect to national data sources, Adamo emphasized the importance of national statistical offices in the region. These offices provide various essential data—including population, economic, and agricultural census data—and collaborate with other institutions to ensure accuracy and completeness. Although data frequency may not always meet expectations, the data’s subnational detail adds significant value. Adamo also underscored the importance of sector-specific statistics, including from central banks, which play a vital role in providing data on remittances that can offer insights into the economic aspects of migration. She also highlighted research datasets that, although not always publicly available, can offer a range of information from mixed-methods analyses.
Despite the wealth of available data, Adamo highlighted several data gaps that need to be considered. One key gap relates to the general sparseness of socioeconomic and demographic data, which imposes fundamental limits to understanding the societal impacts of climate change. She also discussed the challenge of integrating data, particularly when dealing with data of varying formats and quality, which requires careful handling and consideration. Data variability and accuracy were raised as important considerations when interpreting data. Certain datasets may have limitations or lack a consistent standard, which can impact the accuracy of analyses and conclusions. Consequently, data users must exercise caution and employ appropriate methodologies to ensure accurate interpretations. She emphasized the value of having a robust reference framework for data interpretation. It is essential to move beyond viewing data as isolated numbers and instead understand the context in which the data were generated and how they can inform decision-making effectively. Data need to be understood in relation to their provenance and reliability, thereby enhancing the understanding of their implications. Finally, Adamo highlighted the challenges of language differences when dealing with data from various sources. While the audience may have a predominant knowledge of English, many valuable data sources exist in other languages. Accurate translation is essential to avoid misinterpretations caused by differing terminologies in different languages.
TABLE 5-1 Examples of Regional Socioeconomic and Demographic Datasets
| Source | Description / Link |
|---|---|
| DesInventar: United Nations disaster loss database |
|
| Economic Commission for Latin America and the Caribbean |
|
| International Organization for Migration regional and country offices |
|
| United Nations Population Fund |
|
| U.S. Census Bureau International programs |
|
SOURCE: Generated by the workshop rapporteur.
CHARACTERIZING IMPACTS FROM FUTURE EXTREME SEA LEVEL
McPherson presented an overarching framework that conceptualized extreme sea level impact risk analysis in terms of three key components: threat, vulnerability, and consequences. He explained that climate models could be used to characterize the threat posed by climate change, the effects on local natural systems could help analyze vulnerabilities, and the impacts on critical societal systems could illuminate the potential consequences. He also noted that technological change enables mitigation of threats. McPherson stated that connecting the different components of this framework poses real challenges, as translating impacts between global climate effects, local natural systems, and critical human systems is difficult. He emphasized that the analytic questions drive the requirements for data and tools. As an example, he outlined questions related to migration risks from extreme sea level threats, noting that these would necessitate regional climate data to characterize the threat, natural systems models to translate threats into local impacts, and primary exposure analysis to quantify the population at risk, which relates to potential consequences.
McPherson explained that understanding the mission needs and intended uses of the analysis is a crucial part of determining which specific questions need to be answered. He stated that this ties into conceptual validity assessments for models and data, as the requirements dictate whether available tools and information are appropriate. McPherson stated that the questions help to identify gaps systematically and to tailor the analysis for relevance and actionability for the mission. McPherson characterized mission needs themselves as a class of data that guides overall workflow design in terms of connecting climate threats to vulnerabilities to consequences.
McPherson compared two hypothetical workflow options for different use cases—regional extreme sea level risk assessment versus analysis to support emergency planning and exercises. He noted that while the workflows would utilize similar sets of data and tools, they would be configured differently based on the end goal. For regional risk assessment, the aim is characterizing the threat of extreme sea level through projections, modeling inundation extent, and analyzing exposed population and assets. For emergency planning, historic events or scenarios may be modeled instead to understand impacts on populations and critical systems to inform contingency
efforts. In both cases, extreme sea level and flood modeling capabilities would be leveraged but tailored to the distinct objectives. He described the workflows as sharing common components such as hazard representation and consequence enumeration but each being tuned to the intended application.
McPherson presented results using an existing global extreme sea level dataset that projected higher coastal flood risk in 2050 and 2100 under Representative Concentration Pathways 4.5 and 8.5, compared with baseline levels, for the Caribbean and Central America regions (see Figure 5-2). He noted that the exposure figures for population at risk indicated that substantial numbers of people are already affected by current extreme sea level events. The analysis aimed to quantify the increase in risk expected under different climate change scenarios. McPherson pointed out that while risk grew significantly in all areas under the scenarios, the scale of increase varied across countries based on geography. For example, the model highlighted Guatemala and Honduras as experiencing greater relative impacts.
McPherson concluded by emphasizing that an understanding of mission needs enabled the translation of climate data into appropriate spatial scales; informed selection of relevant indicators for consequences; guided what climate data is most pertinent; and shaped analysis approaches to produce targeted, actionable products. He stated that identifying stakeholder needs and working directly with them to codevelop solutions provides significant value, as stakeholders often have the best understanding of mission requirements as well as potentially useful data resources.

SOURCE: Timothy McPherson, Pacific Northwest National Laboratory.
DATA AND TOOLS PANEL DISCUSSIONS
In response to a question to all presenters about the smallest unit of analysis that socioeconomic and demographic datasets were able to support:
- Adamo explained that the most commonly available data tend to be at a level equivalent to U.S. counties, as many national statistics offices restrict access below this level because of privacy concerns. However, she added that resolution is improving as the value
- Madurga-Lopez added that for their climate security vulnerability mapping, the highest-resolution data used has been 30 meter–scale digital elevation models from the Copernicus program. He said its climate exposure indices utilize 1 km data, while its conflict risk indices rely on 20 km pixels. Madurga-Lopez noted his team is prioritizing integration of georeferenced data rather than administrative unit–level statistics only. This allows better representation of risks, such as migration, that cross boundaries. However, he acknowledged, baseline data constraints remain a challenge.
- McPherson responded that for coastal flood risk modeling, his team has used 90 meter–scale digital elevation data, while population estimates have been at 3-arcsecond resolution. He reiterated that privacy and data access constraints can necessitate using more heavily processed, lower-resolution datasets in many cases. But direct engagement with national agencies can sometimes help obtain appropriately detailed data for specific applications.
of highly localized data becomes recognized, with some countries now allowing access to census tract–type scale in certain cases. Adamo emphasized that contacting national statistical offices directly can help determine what granularity of data is possible to obtain and use, based on respective country disclosure laws.
In response to a question about whether any of the tools developed by CGIAR are intended to function as early warning systems to alert decision-makers about emerging climate security threats:
- Madurga-Lopez explained that their current prototype Climate Security Index is not designed as an early warning tool per se. However, his team is working to contribute some of its data analysis innovations to strengthen existing early warning systems managed by governments and other partners. For example, he mentioned that CGIAR is in preliminary discussions about integrating its social media analytics and network analysis methods into Guatemala’s national early warning system to help improve its effectiveness. Rather than creating entirely new competing systems, CGIAR is working to collaborate with established institutions to enhance the early signaling capacity of its tools where possible.
In response to a question on how the various data sources and analytical tools presented account for the large informal economies across many Central American countries:
- Adamo acknowledged that informality poses a measurement challenge since informal work is by definition not registered or tracked. However, she explained that cross-referencing various labor market questions in surveys can provide proxies—for example, typical reported occupations, contract types, and access to pensions/retirement benefits can help identify informal workers. Adamo added that some national household surveys also include direct questions about informality or social protection access that can assist with quantification. While indirect, these techniques allow systematic assessment of general informal employment levels.
In response to a question about whether any common insights seem to have emerged from across the varied tools and datasets presented:
- Madurga-Lopez offered that it is vital to consider the intermediate factors and vulnerabilities beyond climate parameters when trying to understand climate security dynamics. He pointed to an example from fieldwork with Guatemalan farmers, where short-term land tenure agreements exposed livelihood vulnerability independent of, but compounding, climate impacts. Madurga-Lopez concluded that climate risks must be examined
through a broad social science lens encompassing governance, economics, culture, and other systemic issues affecting how environmental shocks translate into security outcomes.
DATA AND TOOLS WORK GROUPS
Workshop participants broke out into five smaller, structured discussions intended to develop ideas for improving climate security analytic capacity in Central America. Each group was asked to build on the earlier discussions of important indicators and potential pathways in the region and received some organizing prompts for their discussion:
- What are the highest-priority data needs? How well are current data sources meeting those needs? Are there data sources that are being overlooked?
- For different risks, what are the most appropriate spatial and temporal scales? For example, what questions require macro-scale data (e.g., long-term climate modeling?) versus micro-scale data (e.g., seasonal weather patterns, crop yields, government statistics)?
- What analytic approaches, methodologies, or tools have the most promise for addressing climate security issues in the region?
- Are there partnerships that are important to develop?
After the breakout sessions, participants from each group (A–E) reconvened in plenary to report out on their discussions. Following the reports, Brian O’Neill, the chair of the workshop planning committee, facilitated a discussion.
Group A: In its discussions, Group A considered challenges around measuring and obtaining data on displacement and migration resulting from climate impacts or other drivers. The group questioned what specific data, such as duration and return rates, are needed to track and understand displacement. Interesting data sources such as remittances, phone records, and social media data were noted. However, the group reflected that in some cases spatial data availability is not as much of a limitation as the need for high-quality time series data to establish baselines from which to identify changes. This raised further conceptual questions such as whether data ought to be selected based on available sources versus driven by the priority questions stakeholders need to answer. The group highlighted the need for much clearer articulation of the core driving questions before focusing intensely on data acquisition. It emphasized that more interdisciplinary dialogue is needed to define the right questions, especially regarding what response options are feasible. Otherwise, misguided data collection efforts, such as the “streetlight effect”2 can occur. Group members stressed that currently, near real-time socioeconomic data remain a major gap and challenge.
Group B: In its discussions, Group B highlighted the importance of building expertise within the Intelligence Community to deeply understand localized contexts across Central America’s diverse subregions. It noted national level data has limitations, and vulnerable watersheds or municipalities need to be understood. The group emphasized integrating quantitative data with qualitative, ethnographic insights directly from local stakeholders. This can help explain quantitative findings and relationships that may not be clear from data alone. Group members highlighted a mismatch between the long-term timescales used in climate modeling versus the near-term policymaking timescales of most urgent interest. Examples of converting long-term projections into salient geopolitical or economic issues were requested. The group advocated for greater use of retrospective analysis to understand historical trends and for building adaptive capacity assessments into risk analyses. It suggested that academic experts on methodologies such as structured analytic techniques could help strengthen Intelligence Community practices.
___________________
2 The streetlight effect is a cognitive bias whereby researchers focus on what they know or perceive rather than consider other relevant possibilities.
Group C: In its discussions, Group C focused on physical infrastructure as an important data need, given cascading impacts on sectors such as water and agriculture. However, the group noted that most disaster-related data tend to be after-the-fact rather than predictive. Crop-vulnerability data were highlighted, given the cultural and economic centrality of agriculture. The group discussed the relationship between data confidence and transparency on who bears responsibility for collection and how it is interpreted and shared. In terms of methods, remote-sensing and big data analytics were noted as enabling early warning systems, while sensitivity analysis was highlighted as a technique for long-term projections. Group members discussed key data gaps, such as quality of socioeconomic data; continuity of collection; and nontraditional partnerships with utilities, nongovernmental organizations, and infrastructure operators.
Group D: In its discussions, Group D considered the challenges around data accessibility, even when sources exist, given cost barriers or institutional stovepipes. The need for standardized, transparent data with clear provenance was emphasized. Centralized data management systems or partnerships could help overcome these obstacles. The group discussed data related to rainfall, drought, and food prices, balanced with the need for macro- and micro-scale data relevance. Group members discussed the timeliness of data for policy impact, given political cycles, although long-term data remain valuable. Private-sector partnerships were highlighted as important for helping to fill data gaps.
Group E: In its discussions, Group E reflected on the intrinsic difficulties of measuring and modeling human behavior, a major source of uncertainty and limitation in climate security analysis. The group noted that this constraint places a premium on integrating social science data. However, key decisions are still made with imperfect information, underscoring the need to start from key questions and priorities rather than just available data. The group emphasized the importance of scrutinizing assumptions in datasets and being aware of inclusion biases. Just because there was an absence of evidence in some locations does not mean there was no risk. The need for trust-building around local knowledge coproduction was discussed. Group members stressed that making partnerships across diverse disciplines and contexts more effective is essential to addressing these complex challenges.


